Note: Descriptions are shown in the official language in which they were submitted.
~ CA~ ~l77
~7gl83
FLUORESCENCE ANALY~ER FOR LIGNIN
FIELD AMD BACKGROUND OF THE INVENTION
The present inventlon relate~ ln general to the pulp and paper industry,
and in particular to a new and useful analyzer for monitoring the
concentratlon of lignln ln wood pulp and black liquor.
In the pulp and paper lndustry, the production of paper products requires
that llgllln be partia~ly removed from the wood chlp feed ~tock pr~or ~o making
paper products. Lignin is a polymer of complex chPmical structure which
"cements" the wood's cellulose flbers together. The process by whlch lignln
i8 removed is referred to as dellgnification. The most prevalent method of
deligniflcation ls by chemlcal means ln which raw wood chips and chemicals are
combined at a controlled pressure and temperature in a vessel known as a
digester. Whlle in the dlgester, the amount of lignln removed frvm thP wood
chip~ determlnes the product quality, the product yield, the amount of energy
consumed, the quantity of chemicals consumed, and the product cost. Fluid
drslned from the diges~er during delignification contains lignin removed from
the wood chips and ls referred to as "black llquor". The black liquor is
used as fuel in a boller to produce process steam.
The measurement of the residual lignin remaining in the pulp, which exits
the d~gester, is most co~monly carried out by laboratory analysis of hourly
samples of the digester output (samples are typically obtained at the last
stage of the brownstock washer). The lab analysis takes approxfmately one
hour and therefore is a poor method for provldlng process control feedback and
, ~ 5l77
~.~7~.83
canl._, be used for feedforward control. This lab analysls is a back tltratlon
method which mesfiures the consumptlon of the potassium permanganate ~nd i9
only an approximatlon to the llgnln concen~ration. The output of titration
analysis 18 referred to as "KAPPA Number" and the procedure 1~ documented ln
TAPPI procedure T236 hm-88, "KAPPA Number of Pulp". A number of manufacturers
have produced automatic sampling and tltration devices which have been trled
in pulp mill situations but they have been mostly unsuccessful in providing
accurate long term result~ and do not reduce the hour delay between the
process and measurement of ~he re~idual lignin.
The ultravlolet absorption and fluore~cence properties of lignin have
long been known and a number of researchers have reported results of
mea6urements in solutlons containing lignln. Both the absorption technlque6
(e.g. sPe Kleinert, T.N. and Joyce, C.S., "Short Wavelength Ultraviolet
Absorption of Varlous Lignins and Related Substances," Part IV,
, Oct. l957, pp. l47-152) and the fluorescence techniques (e.g.
~ee Demas, J.N., Excited State Life~lme Measurements, Academic Press, New York
1983) have all been applied to very dilute solutlons. The fluorescence
~echniques have been used primarily as a method of detecting trace quantities
in~effluent streams. All of these approaches made use of the very dilute
lignin solutions where the absorpt~on and fluorescence signal are linearly
related to lignin concentration. The dilution is typically 2,000 - 10,000
times more dilute than the concentration of lignin in "black liquor" found in
the pulping process and thus requires precise sample preparation prior to
measurement. A number of devices which attempt to monltor the lignin
concentration in "black liquor" during the pulping procefis by UV absorption
techniques (alone or in combination wlth chemlcal analyfiis) have been produced.
~ .~E 5177
2 ~
The~d devlces requlre sample preparation and dilutlon prlor to measurement and
are therefore not in-situ, no~ real-tlme, ~nd introduce snmpling and di]ution
errors. See Tikka, P.O., and Virkola, N.E., "A New Kraft Pulping Analyzer for
Monitoring Organic and Inorganic Substance~", TAPPI Journal, JunP, 19669 pp.
66-7l; Wllliams, D.J., "The Application of Ultra-Violet Absorption
Characteriztlc of Lignln to the Control of Pulp Uniformi~y", Appita~ Vol. 22,
No. 2, September, l968, pp. 45 - 52; and Carpart, R., Obese-Jec~y, K., Le
Cardinal, G. and Gelus, M., "Gontribution of the On-Line Rraft Pulplng
Control", PRP 4 Proceedings, Ghent, 1980.
Use of ultravlolet absorption has recently been extended to the
measure~ent of resldual lignin in wood pulp (see Kubulnieks, E., Lundqvist,
S., and Pet~ersson, T., "The STFI OPTI-Kapa Analyzer, Applications and
Accuracy", TAPPI JO~rDa1~ ~ovemb~r, 1987, pp. 38-42~. The devlce di~closed ln
thls article is marketed by Asea Brown Boveri under the trade name "Opti~Kappa
Analyzer". In this approach, the pulp stream i5 sampled approximately once
~very 5 mlnutes. The pulp sample 18 screened, washed thoroughly, and diluted
~ignificantly. The diluted sample i~ circulated in a loop where UV light
absorption is measured over a pre~cribsd time period and the pulp
concentration in the slurry (i.e., pulp consistency) is measured
independently. Thls system lnvolves sampling error~ screening error, and pulp
consistency measurement error. Although the system provides results much
faster than the conventional lab titratlon proces~, lt ls still off-line. The
washing requirements of this device are stringent ~ince any ~mall amount of
black liquor remalning in the diluted solution will absorb UV llght and
produce error. BTG also offers a device whlch operates on a similar principle
but uses W reflection rather than absorption. The BTG device is marketed
under the name "KNA-5000 Kappa Number Analyzer".
~ E 5177
~7~ 3
All of the investigations and devices discussed 80 far used broad band
lamps as the source of UV light. In 1986, researchers at the National Bureau
of Standards (see Horvath, J.J., Semerjian, H.G., "I.aser Exci~ed Fluorescence
Studies of Black Liquor," Proceedings of The SPIE, Vol. 665, June, 1986, pp
258-264) performed fluorescence tests on diluted black liquor samples using a
la~er as the source of UV light. Although thelr investigation resulted in
better slgnal-to-nolse ratios, they essentially dld not extend the art beyond
that of previous investigator~. They were only able to obtain a functional
relstionship between fluorescence and lignin concentration in very dilute
sample~ of black llquor (les~ than 1300 PPM, which 1B orders of magnitude le~8
than the in-situ concentrations) and did not investigate pulp at all. They
did not provide any insight into how one mlght be able to use either UV
absorptlon or fluorescence technlques to extend the useful measurement range
beyond the highly d~luted 6tate.
They did mention that this process was a candidate for ln-si~u monitoring
but provided no ra~ional explanation of how the dilutlon require~ent could be
overcome. They also mentioned that the measurement could be made more
acceptable fo,r field use by u~ing optical fiberg to gulde the UV excitation
light to the process ~tream and carry the fluorescence signal back to the
opto-electronlcs uni~.
SUMMARY OF THE INVENTION
Based on a desire to meet the need for an on-line, real-~ime device which
could monltor the concentration of lignin in wood pulp and black llquor, the
present invention resulted from a pro~ect which exflmined the fluorescence of
black liquor and wood pulp under excita~lon by varlous nnrrow band wavelengths
~. ~
~E 5177
~ 3~.~3
of ~ light. It is believed that theRe wood pulp experi~ent were the first
ever performed and the resulte are novel in that a completely unexpected
phenomenon was discovered. Namely, when the concentration of lignin in the
~pecimen ls increased beyond the very dllute reglme, whicll had been ~tudle~
esrlier by others, the fluorescence intensity levels off and then begln~ to
decrease with increaslng concentration3 of lignin. The region of most
interest to on-line pulplng is represented by a monotonlcally decreasing
function of fluorescence VB. lignln concentratlon. This monotonically
decreasing function of fluore~cence vs. concentration is known ~s the
"quenched fluorescence regime". Although the quenchlng phenomenon in
molecular substances has been known for a long time, the shape of tha~ curve,
which can be flat, erratlc~ or decreaslng, had never been empirlcally
determined for lignin containing substance prior ~o the prevent invention.
This is important because the steep monotonically decreasing function
discovered is not common and is the only curve that would make the technique
of the invention valuable in measuring lignin in che undllu~ed product.
It has also been found that the fluorescence signal which ls produced in
undllute~ wood pulp, as it flows past the la6t brownstock washer in the pulp
mlll, i5 unaffected by ~race amounts of black liquor remaining in the pulp at
that stage of the proce~s. Thls means ~hat the measurement can be made
on-line without having to wash the pulp beyond the level already performed in
the normal pulping process.
The inventlon also includes three technlcal enhancements which improve
accuracy and resolution of the measurement. These three enhancements are:
A. Uae o more than one UV excitatlon wavelength to discriminate
between the f luorescence of llgnin and any potential interferents.
C~. 5177
$:~ ~ 3
~ . Use of time resolved fluorescence to eliminate unwanted fluorescence
and to make the functlonal relatlonship between fluorescence and llgnin
concentration even more steep, thus resulting in improved resolution in hlghly
concentrated substances.
C. Use of phase resolved fluore~cence to eliminate the unwanted
fluorescence.
The inventlon also uses mechanical dl~tancing, ~pecial optics, and
proximity sensors to make pos3ible the mea~urement of a moving pulp mat whose
distance from the probe 1~ varylng. For the measurement of pulp and/or black
liquor in a plpe line the invention also uses a number of probe
conflgurations.
The invention further includes thè results of investigating vari~ble
excitation wavelengths, phase resolved fluorescence, and time resolved
fluore~cence. All of these methods have been successful in discrimlnating the
fluorescence of lignin in the presence of other fluorescent species in
undiluted wood pulp.
Accordingl~, an ob~ect of the present inventlon i5 to provide an
apparatus for and a method of monitorlng lignin concentratlons ln wood pulp
and black liquor on a real-tlme, on-llne basis.
A further ob~ect of the the inventlon is to provide an apparatus for
monitorlng lignin concentratlon whlch ls slmple ln design, rugged in
construction and economical to manufacture.
~ he varlous feature~ of novelty whlch characterize the invention are
pointed out with particularity in the claims annexed to and formlng a part of
this dlsclosure. Por a better understandlng of the lnventlon, lts operatlng
g ~ ~ ~
~ASE 51~7
advantages and specific ob~ects attained by itg uses, reference i8 made to ~he
accompanylng drawing~ and descriptive matter in which the preferred
embodiments of the inventlon are illu~trated.
BRIEF DESCRIPTION OF THE DRAWINGS
In the drawlng~:
Flg. 1 18 a graph plotting fluorescence v~. lignin concentration as
measured by pulp KAPPA Number in pulp monitored according to the present
lnventlon using continuou~ excltatlon at 334 nm, ~hich demonstrates the
functional relationship a~ undlluted llgnin concentrations;
Fig. lA iB a graph plotting light lnten~ity against time for an
excitation light pulse and resulting fluorescent behavior of fluoresclng
~aterial in general;
Fig. lB is a graph plotting fluorescence intensity against time Ior
different fluoresclng specles;
Fig. 2 i8 a schematic block diagram of a lab set up used in accordance
with the present invention uslng continuous excitatlon;
A r~
Fig. 3~ia a composite graph plotting fluorescence V5 . lignin
concentration di~covered using the lab ~et up of Fig. 2 on a variously diluted
black liquor sample;
Fig. 4 iB a block diagram of an apparatus used to measure ~ignin
concentration in a black liquor sample, using phase resolved fluorescence;
Fig. S iB a view similar to Fig. 4 of an apparatus for measuring lignin
concentratlon on a time resolved basis;
Fig. 6(a) i8 a schematlc dlagram of an apparatus used for measuring
lignin ln a sample with dual excitatlon wavelength fluorescence spectroscopy;
CASE 5177
$ ~
Flg. 6(b) ls ~ frontal view of chopper wheel (51~;
Fig. 7(a) ~s a plot of fluorescence lntensley versus KAPPA Number with
excitation at 337 nm;
Flg. 7(b) is a plot of fluorescence intenslty versus KAPPA Nu~ber with
excleation at 488 nm;
Flg. b 1~ a plot combining two measured quantltie~, F (337) and F (488)
versus KAPPA Number;
Fig. 9 is a partial schematlc view of a device according to the present
invention for maintaining a selected distance between a probe used in
accordance wlth the present lnventlon and a pulp drum carrying a layer of
p-llp;
Fig. 10 is.a view ~imilar to Fig~ 9 of another embodim2nt of the device;
Fig. 11 is a view similar to Fig. 9 of a still further embodiment of the
- devlce;
Fig. 12 is a view similar to Fig. 9 of a still further embodlment of the
de~lce;
Fig. 13 is a front elevational vlew of a device for maintnlning a
selected ~paclng between a pulp mat and a probe used ln accordance with the
present invention;
Fig. 14 is a schematic slde view of a stlll further embodiment of the
invention for measuring lignin concentration on a pulp mat;
Fig. 15 is a vlew similar to Fig. 14 showing a further embodiment of the
present lnventlon;
Fig. 16 is a view simllar to Fig. 14 showing a still further embodiment
of the invention;
Fig. 17 is a view similar to Fig. 14 of a still further embodlment of the
invention;
SE 5177 ~ ~ 7 ~
Fig. 18 ls a slde elevational vlew of a probe and flow tube combination
for measuring the llgnin concentration in pulp alurry or in black liquor
accord~ng to the present inventlon;
Flg. 19 is a vlew slmilar to Fig. 11 of a different embodlment tllereof;
Fig. 20 i8 a view similar to Figo 17 of a still further eMbodiment
thereof;
Fig. 21 is a view slmilar to Fig. 18 of a further embodiment of the
present invention;
Fig. 22 i3 a schematlc block diagram of a laboratory set up for verlfying
the excita~lon wavelengths and time resolved fluorescence techniques of the
present invention; and
Fig. 23 ls a plot of fluorescent intenslty vs. KAPPA Number using time
resolved fluorescence at 12 ns delay using the device of Fig. 22.
DESCRIPTIO~ OF THE PREFERRED EMBODIMENTS
Referring ~o the drawings in particular, the invention embodied therein
comprlses a method and apparatus of monitorlng lignin concen~ration in wood
pulp or black liquor, which takes advantage of the predictable and
reproducible fall off in fluorescence as lignin concentratlon increases,
illustrated in the graph of Fig. 1. This portion of the curve i~ referred to
as ~er~D~n~ s~d~ the quenched fluorescence regime.
Referring to the upper graph shown in Fig. 3a~the quenched slde begins
i~mediately after the peak on the curve and continues to include everything ~o
the ri~ht side of the curve therefrom. At an excitation wavelength of 334 nm
and other nearby wavelengths, the lignin concentration expressed in KAPPA
Number fallfl off in such a predictable manner that fluorescence intensity can
be utilized to calculate lignin concentration.
; :.
SE 5177
Excltation wavelengths less than 500 nm can be used to excite lignin
fluorescence. Shorter wavelengths are preferred since ~hey produce stronger
slgnals and are more selective than longer wavelengths. The actual wavelength
chosen depends upon the embodiment. Resultc have been obtained uslng the 313
nm, 334 nm, and 365 nm llnes (wavelengths) of a Mercury arc lamp, the 325 nm
line o a HeCd laser, the 337 nm line of a pulsed N2 laser, and 360 - 500 nm
wavelengths of a pulsed dye laser.
Fig~ lA illu~trates the temporal behavlor of the fluore~cing material
when excited by a pulse of llght having short duration. During the excitation
pulse,the fluorescence inten~lty ri~es rapidly. After the excitatlon pulse,
fluorescence begins an exponential decay with a characterlstic and
identlfiable time constant.
Fig. IB shows the fluorescence from two different species under pùlsed
excltation conditions. The decay time constant of specles A is much longer
than that of B. If a sample to be analyzed according to the present invention
contains both species, the resultant slgnal will be the sum of the two curve~
ln Fig. lB.
In ~ conventional, non-tlme resolved approach, one would generute a
~ignal proportional to the total area under the resultant curve. In other
words, instead of looking at how the signal changes wlth time, one would
merely integrate the total signal over the total tlme of. fluorescence.
When the sample contains only one or the other of the components A and B,
this type of 6ignal is sufficient to provide a measure of the concentration of
that component. If both components are present, one cannot separate the
contributlon~ of the two and, hence, cannot determine the concentration of
elther.
ASE 5177
~73~
In tlme resolved fluorescence spectroscopy the inventlon makes u~e of the
addltional lnformatl~n that component B fluore~cence decays much more rapldly
than does that from A. If the decay time difference ls large, one can simply
wait to turn the detector on untll virtually all of the f luorescence from B i8
gone. The remaining signal9 although smaller ~han the total, can then be
attributed to A and therefore used to flnd the concentratlon of A. Knowlng
this concentration of A, the B concentration can then be calculated from the
conventional "all time" mea~urement.
In fact, the difference in decay times need not be so large as to allow
the complete decay of B before making the measurement. As long as the time
constants are known, any two measurements made over two different tlme
intervals, provide the lnformation necessary to calculate the concentration of
both A and B.
Phase sensitlve spectroscopy of the invention ~s based on the same
effect, e.g~, the differential in decay time~. Instrumentally, however, it i9
sltogether different. Instead of pulsing the excitation and making
measurements at known time intervals ater the pulse, as ln the time resolved
approach, ~ continuous source ls used. This source i9 then rapldly modulated.
~his in turn modulates the fluorescence signal. In other words, if one turns
the excitation on and off at some rate, the fluorescence slgnal wlll turn on
and off at the same rate. Because of the time constant, however, the
fluorescence slgnal does not shut off at ~he same tlme as the source but at
some time later determined by the decay time constant. The fluorescence
signal then has the same frequency as the source modulation but is delayed in
phase, the pha~e delay belng proportional tn ~he decay time constant. When
the sample has two or more components, the fluorescen~ slgnal ls a sum of two
or more slgnal~ all having the same frequency but each dlfferlng ln phase.
ASE 5177
~7~
These signals can be electronically ~eparated on the basis of this phase
dlfference and used 6epara~ely to determine the concentration of lndivl~ual
components.
The present inYention can thua dlstlnguish ~he fluore.scet~ce due to llgnln
even when other fluorescing ~aterials are present in the sample, as long as
the spectral characeeristic of each material 18 known in advance.
- Fig. 2 illustrates an apparatus of the presen~ inventlon for collecting
fluorescence inten~ity data which comprlses a llght source (10) ln the form of
a ~ercury arc lamp. Lamp (10) shine~ light through an optical system in the
form of a len~ (12), a flret fllter (14) and a second lens (16) whlch focu~ea
the llght onto a ~ample cell (18) containing pulp or black liquor.
Fluorescent light emltted rom sample cell (18) passes through a second filter
(20) and along a fiber optic bundle (22), to a monochromator ~24), A light
intensi~y detector (26) is connected to the ou~put of monochromator (24) to
genera~e a signal which ls processed in circui~ry (28). Circuitry (28) is
connected to display means (30) which produces a graphic representation of
fluorescent intensity plotted against wavelength. For an excl~ation
wavelength of 334 nm, the concentration of solids in black liquor, and thus
the~concentration of lignin; in sample cell ~la) i9 changed to produce the
results lllustrated in Fig, 3~for a 501id9 concentration approaching 0 up to a
concentration of about 650,000 parts per million (ppm). The concentration of
lignin in the black liquor 18 roughly 50Z of the solids concentration.
Although fluorescence increase~ up to about 13,000 ppm, it thereater drops
off as ~hown in the upper portlon of the graph.
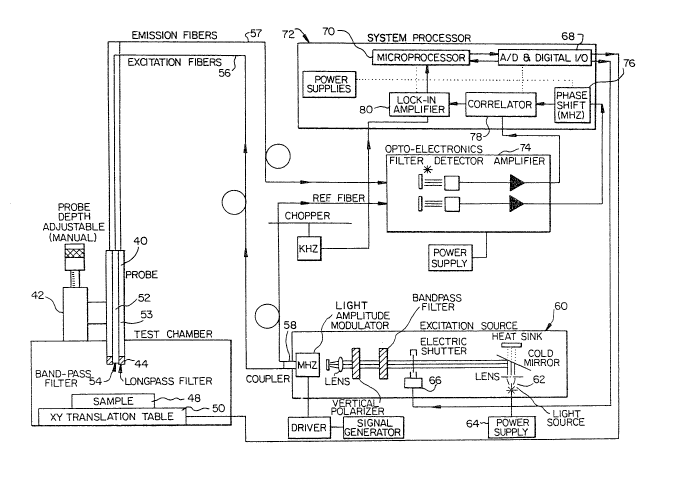
Fig. 4 schematlcally illustrates an apparatus which can be utilized for
practlcing the phase resolved version of present invention off-line. For
ASE 5177 2 ~ 7 ~ 3 3
.I-line operatlon, one of the probe configuratlons shown ln Fies. 9 - 21 may
be lncorporated, The apparatus comprise3 a probe (40) attached to depth
ad~usting means (42) for moving the detecting end (44) o ~he probe closer to
or further ~way from a sample (48) for example a wood pulp mat, held on a
precl610n XY translation table (50) which can change the relative position o
the mat (48) to the detecting end of the probe (40). Probe (40) comprlses a
central excltation tube (52) having a band-pass filter (54) at its lower end
for passing a fielected wavelength, ~uch as 334 nm, of excltation light. Light
is supplied to the excltation tube (52) by excitatlon optical fibers (56)
attached at a coupler (58) to an excitation source generally designated (60).
Excitation source (60) has a ligh~ source (62) powered by a power supply (643
for pa~3ing light through an optlcal arrangement lncludlng an electric shutter
~66~ which is con~rolled by an input/output (I/0) devlce (68) connected to a
microprocessor (70) in a ~ystem processor arrangement (72)o O~her lenses and
filters are provided in excitation source (60) for conditloning the light
~upplied through filter (54) onto ~he sample (48). Fluorescent llght from the
sample (48) is conducted through a long pass filter and a tube (53) forming
another part of probe ~40). This llght is conducted along an optical fiber
bundle (57) to an opto-electronlc package (74). Coupler (58) also provldes a
reference light source to the opto-electronlcs package (74). The reference
light i9 ~upplied to a phase shit element (76) and then compared with respect
to phase, to the fluorescent llght in a correlator (78). The correlation or
lack thereof between the source and fluorescent ligh~ is applled to the
microproceB60r (70) through a lock-in amplifier ~80). Mlcroprocessor (70) ls
programmed with the information necessary to calculate llgnin concentration
from phase ~hlt information, the phase shift informatlon corresponding to the
~ C , 5177
fl~orescent llght intensity due to fluorescent llgnin in the sample. The
slgnal~ from mlcroproce~sor ~70~ can al~o be utillzed to move the shutter (66)
and the XY translation table (50) for taking a fresh reading.
Fig. 5 i~ an embod1ment aimilar to Fig. 4 for measurlng the intensity on
a ti~e resolved basis. The Qame reference numerals are u~ilized to designate
the same or functionally similar parts. Where the part~ have already been
de~cribed in connectlon with Flg. 4, the description will not be repeated.
The time resol~ed embodlment of Fig. S utlllze~ a pulsed laser (63)
operating at a selected wavelength such as 337 nm which shlnes light through a
beam splitter (67), to the optlcal fiber bundle (56~ carrylng the excitation
llght~ A fiber bundle (69) conveys thQ divided part of the split beam from
la~er C63)3 to a hlgh voltage pulse generator (61) which applles gating pul~es
to a pair of high speed detectors or detector amplifiers (82, 84) in
opto-electronlcs package (74) which may contain a 1_u--_u~ monochromator at
the asterlskO The amplifier~ (82, 84) respectively receive pulses
proportional to light intenslty on emisslon flber~ (57), corresponding to the
fluorescent intensity from the lignln in ~ample (48), and an optical fiber
bundle (59) /which supplie~ pulsed laser light from the coupler (58). The
opto-electronlcs package (74) thus provide~ time refiolved compari~ons between
excitatlon and fluorescent light of sample ~48), which is processed in
microproces~or (70).
Fig. 6(a) is another embodiment similar to Fig. 5 for measuring the
lignin concentratlon in wood pulp using dual excitation wavelength
fluorescence spectroscopy. The same reference numerals are utilized to
designate the same or functionally Yimilar parts. Two lasers are operated at
two different wavelengths, ~1~ and ~2~ for example A 1 ~ 337 nm and ~\2
14
~ ~E 5177 2 ~ 7 ~ ~ ~ 3
4~u nm. Of course, there i3 grest flexlbillty ln selectlng excltatlon
wavelengths. The two la~er beams h 1 and ~ 2 are combined by a mlrrored
chopper wheel (51) rotated by a stepper motor (55~. The chopper wheel (51)
consists of a serie~ of open slot~ (51a) alternating with mirrors (51b) as
best seen in Fig. 6(b). When the open slot (51a) i~ at the point of
intersection of the two beams, ~ 1 and ~ ~, only ~ 2 pas~es through and is
inpu~ through a lens (13) to the source or excitation optical flber or flber
bundle ~56) where lt i9 received and transmitted by probe (40) to a ~ample
(48) such as a pulp mat.
Laser beam ~ 1 passes to the excitation flber (56) only when the mirror
(51b) la at ths polnt of intersection. Whil2 laser beam ~ 1 is directed to
probe (40) by way of len~ (13) and the Pxcitation fiber (56), laser beam ~ 2
is blocked by mirror ~51b) of the chopper wheel (51). In this fashion, the
la~er beam entering the excita~ion fiber (56) alternates in time between the
two excitation wavelengths.
Probe (40) focuses the laser beam on the sample (48) with the sample's
emitted fluorescence being collected by the same. Emission or detector fiber
or fiber bu~ le (57) carries fluorescence signal6 to a detector (74) as
previously described with re~pect to Figs. 4 and 5. In this embodiment the
slgnal from detector (74) is sent to a system processor arrangement (72) and
alternates between thst of ~1 and ~ 2. Durlng the in~tial calibrat:Lon and
set-up, a weighting constant, C, may be set to a desired value simply by
ad~usting the intensity of la~er beam ~2. The slgnal from detector (74) wlll
then be a square wave whose amplitude is the deslred function, e.g.,
F~ '\1) ~ C F( ~ 2)
`, , ,~ 5177
- ~37~ $~
The to~al fluorescent emission from undilu~ed pulp samples can be
expres~ed as follow~:
F ~ Afl + Bf2 (I)
where:
fl ~ the fluorescence that correlates well wlth the
concentration of lignin as measurPd by the standard wet
chemical method and expre~ed a~ KAPPA Nu~ber.
f~ 5 th~ fluorescence that does not correlate well wlth
measured lignin conceneration.
A and B are constants.
Because of the f2 component, the correlation between F and Kappa Number
is poor, a~ 6hown in Flgs. 7~a) and ~b), and F cannot be used as n measure of
lignin concentratlon. The data in Flgs. 7~a) and (b) were obtalned with a
device schematlcally depicted in Flg. 6(a) set at ~ 33i nm and ~ 2 = 48B
nm. A comparlson of Flg~ 7(a) with Flg. 7(b) shows that the rel~tive effect
of the f2 co~ponent i~ greater when the fluore~cence is exclted by a longer
wavelength source, l.e., 488 nm.
l'herefore, equation (I) can be rewrltten a~ follows:
F(337) e A(337)*fl + B(337)*f2 (II)
F(488) ~ A(488)*fl + B(488)*f2 (III)
16
CA 5177
~7~
When these two equations (II) and (III) are combined to elimlnate the f2
term, the followlng equatlon results:
1 ~ F(337) - C*F(488)
whe~e:
C and D are eonstant~ that are comblnations of the original A'~
and B's.
Since fl provide~ a good mea~ure of the lignin concentration as expressed
by KAPPA Number~ the two measured quantitles, F(337) and F(488), are used to
calculate the relative lignin concentration provlded the constant C is known.
Empirically, it was determined that the constant C has the value of 0.29 for
lnvestigated pulp samples. Fig. 8 shows that combining the measurements in
~his way gives a ~ell behaved monotonically decreaslng func~ion suitable for
the de~ermlnat-lon of KAPPA Number. It remains to be seen if the constant9 C,
i8 the same for pulps from different woods and/or different processes. I
not, a calibrstion i8 almply required to determine thls value for a given type
of pulp.
Fig. 9 shows a mounting for probe (40) in a vacuum sleeve (90) which ls
engageable at a selected dlstance from a pulp mat on 8 pulp drum (92). The
signals from probe (40) can be processed in the apparatus of Figs. 4, 5 snd
6(a) to monitor lignin concentration in the pulp mat.
Flg. 10 shows a contact version of the inventlon where a probe (40) is in
contact with the mat through a standard thickness transparent layer (94) in
contact wlth the mat on the drum ~9~).
'
.. .
` ASE 5177
Flg. ll utlllzes probe (40) whlch 18 fluld coupled ~t (41) to ~ ~ 7~ r~ ~c3
of a sllic8 (Si02) cyllnder (96) in contact with the pulp mat on drum (92~.
Fig. 12 show~ an embodlment where the probe (40~ i6 mounted as a spoke o
a quartz cyllnder (98) in rolling contact wi~h the mat on drum (92).
In the embodiment of FiK. 13, the sensing end (44) of probe (40) is held
at an accurate and 6elected dlseance from pulp mat (48) by mounting the probe
(40) on the axle (1003 of a palr of rollers (102) rolllng against the pulp mat
(48).
Fig. 14 illustrates a non-contact pulp mat probe arrangement where the
pulp mat (48) 16 llluminated by 8 llght ~ource (62) with fluore6cent light
belng received by light sensor (104), for processlng.
In the embodlment of Flg. 15, probe (40) both fihines and receives light
through a lens (106) to and fro~ the mat (48).
In ~he embodiment of Flg. 16, mat (48) ls illuminated by a probe (40)
having an outer light source (108) and a central fluorescent response ~ube
(110). A lens (107) having separate in6ide and out~ide elements for shining
and receiving the light i~ provided between the probe and the pulp mat.
In the embodiment of Fig. 17, probe ~40) is ~e~ at a known ~esired
di6tance'from mat (48) by a proxi~nity ~ensor (112) such as an ultrasonic
dl~tance lnstrument which lff physically connected to the probe. In the
non-contact version of the presen~ invention, maintaining a set snd accurately
known dls~ance between the probe face and the mat ls essential to avold
variations in light intensity which, rather than due to lignin concentration,
i~ due to di~tance variationff.
Embodlments of the invention for measuring lignin concentration ln black
liquor or pulp 61urries are shown ln Figs. l8 - 2l.
1~
CA 5177 2 ~ 7 ~ ~ 3 3
Fig. 18 show~ probe (40) whlch may be the same design a~ the probes
utilized ln the equlpment of Figs. 4, 5 and 6(a) engaged to an aperture ln u
flow tube (114) which contains a flow of black liquor or pulp slurry.
In the embodiment of Fig. 19, probe (40) penetrates tube (114) in a
recess (115). The sensor face of probe (40) ls serviced by a fluid in~ector
(116) whlch may be used to seour and clean the sen60r face~
A slmilar in~ector (116) is used in a recess ~115) of the tube (114) in
the embodiment of Fig. 20 where probe ~40) ic mounted next to multiple window~
(120~ which are used to insure the pre~ence of black liquor flow. A single
long windo~ may replace the two windows (120).
Flg. 21 shows an embodiment of the invention where flow ls normally
conducted through a supply valve ~122) downstream of a Y-connectlon (123) in
the flow pipe (114). When a real-time measuremen~ is to be taken, valve (122)
1~ closed and a second valve (124) i3 opened which cause3 the stream to pass
probe (40). The streams are reconnected at a second Y-connectlon (125~.
Fig. 22 lllustrates an apparatus for verifying the usefulness of the
invention which comprises a nitrogen laser (130) which supplies light to an
optical arrangement of lenses and mlrrors (132), to a sample mounted on a
translator (134) and to a fiber (136) ~hich supplies a reference light 6ignal
a~ a trigger to electronlc sen~ing equlpment. Fluorescent light iB supplied
over a fiber bundle (138) to the lnput (139) of a monochromator (140). The
output (142~ of monochromator ~140) ls supplled to a detector (144).
The apparatus of Flg. 22 was utilized to measure fluorescence at time
delay~ of 00, 04, 061 08, 10 and 12 nanoseconds (ns) to reveal the correl~tion
be~ween fluorescent light intensity and KAPPA Number. Flg. 23 ls a plot of
fluorescent lntenslty ver~u~ KAPPA Number uslng time resolved fluore~cence at
12 n~ delay with the device shown in Fig. 22.
19
~ 5177
.
While the specific embodlment~ of the invent-lon have been shown and
de~cribed ln detail to illustrate ehe applicatlon of the principle~ of the
invention, it will be understood ~hat the lnvention may be embodied otherwise
without departlng from such prlnclple3.