Note: Descriptions are shown in the official language in which they were submitted.
2 ~ ~ 7 ~ 7 3
I~PROV~D ~RT~RIA~ B~OOD NO~ITO~I~G ~Y8T~
FI~LD O~ ~H~ I~Y~N~ION
This invention relates to pul e oximeters which
noninvasively measure the oxygen saturation o~
hemoglob.in in arterial blood and, in particular, to an
improved arterial blood monitoring system for
perfo~ming these calculation~ and ~or also measuring
a number of additional parameters, including: total
hemoglobin and oxygen content of arterial blood.
PROB~E~
It is a pro~lem in the field medical monitoring
equipment to accurately measur~ various parameters o~
arterial blood in a noninvasive mannerO For example,
th~ oxygen saturation (SeO2) of the hemoglobin in
arterial blood is determined by the relative
proportions of oxygenated hemoglobin and reduced
hemoglobin in the arterial blood. A pulse oximeter
system noninvasively determines the oxygen saturation
o~ the hemoglobin by measuring the dif~er~nce in the
light absorption of these two forms o~ hemoglobin.
Reduced hemoglobin absorbs more light in the red band
than does oxyhemoglobin while oxyhemoglobin absorbs
more light in the near in~rared band (800 - 1000nm~
than does reduced hemoglobin. The pulse oximeter
includes a probe that is placed in contact with the
. :
.
-2- 2 ~
skin, either on a flat surface in the case of
reflectance probes or across some appendage in the
transmission case. The probe contains two light
emitting diodes, each o~ which emits light at a
specific wavelength, one in the red band and one in
the infrared band. The amount of light transmitted
through the intervening appendage is measured many
times a ~econd at both wav~lengths.
The appendaye contains arterial, capillary and
~enous hlood as well as intervening tissue and bone.
Therefore the red and infrared signals received from
the probe contain a non-pulsatile component which is
influenced by the absorbency of tissue, venous blood,
capillary blood, non-pulsatile arteri~l blood, the
intensity of the light source and the sensitivity o~
the detector. The pulsatile component of the received
signals is an indication of the expansion of the
arteriolar bed with arterial blood. The amplitude of
the pulsatile component is a very small percentage of
the total signal amplitude and depends on the blood
volume per pulse and the S~O2. The received red and
infrared signals have an exponential relationship to
the path length of the arterial blood. The effects of
different tissue thicknesses andlskin pigmentation can
be removed from the received signals by normalizing
the received signal by a term that is proportional tu
the non-pulsatile incident intensity. Taking the
ratio of the mathematically processed and normalized
red and infrared signals results in a number which is
theoretically a function of only the concentration of
oxyhemoglobin and reduced hemoglobin in the arterial
blood, provided that the concentration of
dyshemoglobins in the arterial blood is sufficiently
small.
' "' ;~- .
,
,: ' . ,,
~; :
-3- 2 ~
Measuring 5a2 alone provides an incomplete
picture of patient oxygenation status~ To help
complete our knowledge of oxygen delivery, we need to
know, not only the percentage of hemoglobin bound to
oxygen but also just how much hemoglobin is availableO
There presently does not exist any medical monitoring
equipmentt comparable to a pulse oximeter system, for
noninvasively measuring other parameters of arterial
blood, such as total hemoglobin content and o~ygen
content. The~e parameters are either measured in an
infrequent invasive manner or not directly measured at
all. It is therefore a problem in the field of
medical monitoring equipment to concurrently measure
in real time a plurality of characteristics of
arterial blood in a noninvasive manner. It is also
desirable to minimize the number of pieces of
equipment required to perform these measurements as
well as the number of probes re~uired to collect the
data.
2~$~
--4--
O~TI0~
The above described problems are solved and a
technical advance achieved in the field by the
improved arterial blood monitoring system, that allows
for noninvasively measuring and calculating a
plurality of ch~racteristics of arterial blood. This
improved arterial biood monitoring system takes
advantage of the basic st~tistical property of
arterial blood tha~ arterial ~lood contains a
plurality of dominant absorbers, whose measured light
absorption spectra appear as a constant over a short
interval of time. The arterial blood characteristics
to be measured are empirically related to the changes
in the measured light transmission through the
plurality of dominant absorbers a~ a ~unction of the
changes in arterial blood volume at the probe site.
By measuring the transmitted light as it varies with
arterial pulsation at selected wavelengths of light,
the relative amount of these dominant absorbers in the
~O arterial blood can noninvasive:Ly be determined. The
wavelengths of light are selected such that the
dominant absorbers have different extinction
coefficients at at least one oiE these wavelengths of
light. The wavelengths can a:lso be selected to be
substantially isobestic to a number of the dominant
absorbers or their components.
Arterial blood contains a number o dominant
absorbers, including water and hemoglobin. The
hemoglobin itself is comprised of oxygenated
hemoglobin, deoxygenated hemoglobin,
carboxyhemoglobin, etc. The concentration of n of
these components can be determined by selecting n
different waveleng-ths of light where each of the n
components have different extinction coefficients at
-5~
at least one of the wavelengths of light. In
addition, in a two wavelength system, one of the
wavelengths of liyht is selected such that the two
primary components of hemoglobin, oxygenated
hemoglobin and deoxyqenated hemsglobin, are
~ubstantially isobestic at that wavelength o~ light~
By selecting one wavelength of light around 1270nm,
where water has a measurable extinction and a second
wavelength at about 810nm, a wavPlength that is
substantially isobestic to oxygenated and reduced
hemoglobin, a direct relationship between the
transmitted intensities at these two wavelengths and
the art~erial hemoglobin concentration will exist and
can be calculated.
The use of a plurality of wavelengths of light
enable the arterial blood monitoring system to
concurrently measure a number of characteristics of
arterial bloodO By selecting wavelengths of light
around 660nm, 940nm and 1270nm, the values of total
hemoglobin and oxygen saturation of arterial blood can
simultaneously be dete~mined. In addition, oxygen
content of arterial blood can be calculated ~rom these
values of total hemoglobin and oxygen saturation.
Thus, a plurality of characteri;tics of arterial blood
can be noninvasively determined by the arterial blood
monitoring system. This sy~tem is able to measure
this particular plurality of characteristics of
arterial blood as a result of extending the techniques
of pulse oximetxy to include measurements at a
wavelength where water has a measurable extinction.
The use of a single probe and multiple wavelengths of
light simplifies the apparatus required to perform the
desired measur2ments and solves the problems of the
prior art.
--6
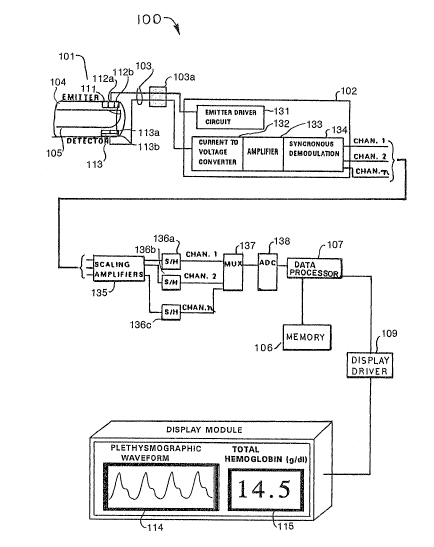
BRI~F D~RIPTIQN o~ T~ DRawI~G
Figure 1 illustrates in block diagram form the
overall architecture of the improved arterial blood
monitoring system:
Figure 2 illustrates a t~pical display for the
improved arterial blood monitoring system;
Figure 3 il l ustrates in graphical form the
various components of the input ~ignal from the pro~e;
and
Figures 4 and 5 illustrate in flow chart ~rm the
op~rational steps taken by this system to dete~mine
the desired arterial blood characteristics.
..
`2 ~ 5
-7-
D~TAIL~D D~CRIPTION
The improved arterial blood monitoring system
takes advantage of th~ basic ~tatistical property of
arterial blood that arterial blood contains a
plurality of dominant absorbers, whose measured light
absorption spectra appear as a constant over a short
interval of time. The arterial blood characteristics
to be measured are empirically related to the changes
in the measured light transmission through the
plurality of dominant absorbers as a function of the
changes in the arterial blood volume at the probe
site. Therefore, by measuring ths transmitted light
as it varies with arterial pulsation, at selected
wavelengths, the relative amount o~ these dominant
absorbers in the arterial blood can noninvasively be
determined. A single probe can be used to generate
the plurality of wavelengths of light, therefore
simplifying the arterial blood monitoring ~ystem.
Definition_of Term~
Io = The intensity of the beam of ligbt at a
given wavelength incident on the tissue-
under-test, where the wavelength is denoted
by the subscriptO
I = The instantaneous value of the intensity of
the light received by the detector. The
light is at a given wavelength, which
wavelength is indicated by a subscript.
= The extinction coefficient of light by a
given substance ~indicated by a
~uperscript~ at a given wavelength
(indicated by a sub~cript).
C = The concentration of a given substance
(indicated by a superscript)~
" , , , . ' ~: ';
L = The pathlength of a giv~n substance
~indicated by a superscript).
tHb = Total hemoglo~in measured in arterial
blood. Usually expressed in terms of grams
per deciliter.
0 = Used a~ a ~uperscript to represent
oxyhemoglobin.
R = Used as a ~uper~cript to repres~nt reduced
hemoglobin.
W = Used as a superscript to represent water.
t - Used as a superscript to represent the
combination of oxyhemoglobin and reduced
hemoglobin.
~y~te~ Ar~hit~tuxe
Figure 1 illustrates in block diagram form the
overall architecture ~f the arterial blood monitoring
system of the present inventiorl. The arterial blood
monitoring system 100 consists of a probe 101
cannected to probe interface circuit 102 by means of
a set of electrical conductors 103 and connector 103a.
The probe 101 consists of an exterior housing 104 that
applies the active elements of the prob~ to the tissue
under test, such as a finyel^ 105, containing an
arterial blood flow that is to be monitored. Included
within housing la4 is a plurality (at least two) of
light emitting devices ~11, 1~2 and at least one
corresp~nding light detector 113. The light emitting
devices 111l 112 ~ach produce an output light beam o~
predetermined wavelength which is directed at the
finger 105 enclosed by housing 104. The light
detector 113 monitors the level of light that is
transmitted through or reflected from finger 105. In
order to distinguish between the light beams produced
,
", , : .
:,; .~
j, - , .
- 9 -
by first 111 and second 112 :Light emitting devices,
these light emitting devices 111~ 112 are modulated in
a manner to allow the output of the light detector 113
to be synchronously demodulated. Ambient light, being
unmodulated, is easily eliminat~d by the demodulator
process.
The signals received by probe interface circuit
102 from light detector 113 are t~pically processed by
additional analog circuit~y 135 - 137 and then
converted by an analog-to-digital converter circuit
138 into sets of digital measurements which are stored
in memory 1060 Data processing sircuit 107
mathematically processes the digitized measurements
stored in memory 106 to compute the desired
characteristies based upon the measurements taken on
the components in the arterial blood in finger 105.
It is also possible that analog circuitry can be used
to perform some o~ the mathematical operations
described herein as performed by data processing
circuit 107, such as taking derivatives or logarithms.
The results of the computations are displayed
numerically via display driver 109 and the associated
display 115 while the plethysmographic waveform is
typically displayed graphically via display 114. The
operation of data processing ci.rcuit 107 is disclosed
in additional detail below and, for the purpose of
this disclosure, it is assumed that many of ~he other
elements disclosed in Figure 1 are the conventional
components found in existing pulse oximeter systems.
Probe
Probe 101 contains a minimum of two light
emitting devices 111, 112, each of which produces a
beam of light at a distinct wavelength. Probe 101
~ ~.
~ ,
: ::
:. .. : :
--10--
also contains light d~tector(s) 113 capable of
receiving the emitted wavelengths of light. The beams
of light produced at a specific wavelengths are
referred to as Io1, Io2,..~Io~. while the received
beams of light are referred to as ~ . In the
present implPmentation, the light detector 113
consists o~ a multiple layer element that contains a
germanium photodiode 113b placed under a silicon
photodiode 113a. For the wavel~ngths of light shorter
than approximately lOOOnm, the silicon photodiode 113a
receives the incident light. Above this wavelength,
the silicon photodiode 113a becomes transparent and
the germanium photodiode 113b picks up the incident
light. Probe 101 includes a cable 103 and connector
103a ~or transmitting and receiving signals between
probe 101 and probe interface circuit 102. Probe 101
is positioned on the tissue either in the transmission
mode: light emitting devices 111, 112 on one side and
light det~ctor(s) 113 on the other side of finger 105,
earlobe, toe or other appropriate site khrough which
light can be received by the light detector~s) 113 at
acceptable signal levels; or in the reflectance mode:
in which the light emitting devices 111, 112 and light
detector (5) 113 are placed on the same side o~ the
tissue under test, such as the ~orehead or forearm.
~i~nal Com~ons~ts
Figure 3 illustrates in graphical form (not to
scale~ the various components of the total absorption
produced by the finger 105. The light detector output
signal, high where absorption is low and visa versa,
consists of a lar~e magnitude non-pulsatile component
and a small magnitude pulsatile compo~lent. The non-
pulsatile component represents light remaining after
:
,:
- 2 ~9 ~ ri ~3
--11
absorption due to a combination of venous blood flow,
cutaneous ti~sue, bone, and constant arterial blood
flow while the small pulsatile component is caused by
the light absorption due to pulsatile arterial blood
flow that is to be measured. Following synchronous
demodulation the data signals produced by the light
detector 113 and transmitt~d to probe interface
circuit 102 consist of a series o~ data points that
are digitized and stored in memory 106. Since the
first 111 and second 112 light emitting devices are
sampled simultaneously and in rapid succession, these
digitized data points consist of a plurality of sets
of measurement , with one set corresponding to samples
of the light beam in~ensity at a first wavelength, the
other set corresponding to samples of the light beam
intensity at a second wavelength, and, in some
schemes, a third set corresponding to the intensity of
the ambient light~
Ideally, in pulse oximeter systems red and
infrared wavelengths of light are used and the ratio
of th~ normali~ed derivative (or logarithm~ of the red
intensity to tha normalized derivative (or logarithm)
of the infrared intensity is a constant. This
constant is indicative of the partial o~ygenation
(SaO2) of the hemoglobin in the arterial blood flow.
It is obvious that thi~ ratio chan~es as SAO2 changes
but, for a short interval with rapid enough sampling
rate, the ratio remains constant.
The actual analog data received by the probe
interface circuit 102 can include a fairly significant
noise component which is caused by a number o~ sources
including motion of the finger 105, the introduction
of ambient light into the housing 104, and various
sources of electrical noise. These noise components
-12~
skew the values of either or both of the m~gnitudes
measured in each sst of data points destroying the
correct relationship between the red and infrared
signals. Existing pulse oximeter circuits make use of
various filtering techniques to minimize the impact of
the noise on the SaO2 Yalue measured by the ~ystem.
This filtering circuitry and software or algorithms
are analogous to that used in the arterial blood
monitoring ~ystem 100 and is therefore not descxibed
in detail herein.
~ystem I~pl~me~t~tio~
Figure 1 illustrates in block diagram form the
various components used wi~hin the arterial blood
monitoring system 100 of tha present invention. This
embodiment illustrates khe use of a plurality of
wavelengths of light and, in particular, two
wavelengths of light to measure total hemoglobin
concentration in the arterial blood. Emitter driver
circuit 131 produces the ana:Log drive signals to
activate light emitting devices 111, 112 in probe 101.
These analog drive signals are carried over cable 103
to probe 101. To measure the c:oncentration of total
hemoglobin (tHb) in arterial blood the concentration
of several dominant absorbers contained in the
a~terial blood must be measured. In particular, the
concentration of the water and hemoglobin components
of the arterial blood must be measured. In order to
accompli~h this, light emitting device 111 is selected
to produce a beam of light at approximately 810nm,
which wavelength is substan~ially isobestic to the
oxygenated and deoxy~enated components of the
hemoglobin in the arterial blood (that is, the
extinction coefficients of the oxygenated and
,;
.
.
-13- 2~3~
deoxygenated hemoglobin are substantially identical).
Light ~mitting devi~e 112 is selected to produce a
beam of light at approximately 1270nm. The selection
of these two wavelengths is æuch that water i5
transparent at the first wavelength of .light (810nm)
but detected at the second (longer) wavelength of
light (1270nm). In addition, these wavelengths are
such that the extinction coePficients of the two
components (water and hemoglobin) differ at the first
wavelength o~ light. Further, at both wavelengths the
two species of hemoglobin are substantially isobestic
in extinc~ion but not transparent.
The analog data signals produced by light
detect~r 113 in response to the recei~ed beams of
light are received from probe 101 over conductors 103
and filtered by anal~g hardware 132 - 134 in probe
interface circuit 102. The input analog data from
probe lOl may be decomposed into its non-pulsatile and
pulsatile sub-elements in probe interface circuit 102
in order to provide accura1e, high resolution,
measurements of these components. The pulsatile
component typically represents anywhere from .05% to
20% of the total input si~nal and ~he decomposition of
the input signal into pulsatlle and non-pulsatile
components permits accurate analog to digital
conversion of even the smallest of the~e pulsatile
components.
Probe Intsr e~ Circuit
Probe interface circuit 102 includes emitter
driver circuit 131 that is capable of driving light
emitting devices lll, 112 such that the light beams
produced traverse finger 105 and su~ficient light
intensity is incident on light detector 1~3 to produce
-14- 2~7.~7~
data indicative of the light absorption of the
dominant absorbers in arterial blood~ The data
produced by light detector 113 (voltage eguivalent o~
the received light intensities) at each wavelength is
kept distinct and can be processed independently.
This can be done by any of the many schemes presently
in use for pulse oximetry, ~uch as time division
multiplexing, or freguency division multiplexing.
The light receiv d from finger 105 is converted
to an e~uivalent current signal by the photodiodes of
light detector 113, and then converted to a voltage
signal by the current to voltage converter 132. The
data is then amplified by amplifier 133, and
demultiplexed via synchronous demodulation cir~uit
134. The demultiplexed data comprises ~nalog voltage
signals applied to leads CH~N 1, CHAN 2 . . . CHAN n
represent~tive of the intensity of the raceived light
at each of the wavelengths of light produced by light
smitting devices 111, 112, respectively. The Yoltage
signals on leads CHAN 1, CHAN 2 are then scaled
(further amplificationj by scali.n~ amplifiers 135 such
that they can be converted, wit:h optimal resolution,
to a digital equivalent. Al.l channels output by
scaling amplifiers 135 are then simultaneously sampled
by the sample/hold circuitry 136a, 136b, . . . 136nO
The sampled data is pa~sed a l~hannel at a time via
multiplexer 137 to the analog to digital converter
138. From there the data, now in digital form, is sent
on to data processing circuit 107 where it is stored
in memory 106 for processing. The digital data
represents the substantially simultaneously sampled
amplitudes of the received light intensities from each
of the wavelengths used at a sampling frequency of
typically 30 Hz or greaterO These data values are
', ~
.: . : . . .
,
-15-
referred ~o as I11 I2~ . ~ . IN~ where the ~ubscript
indicates the given wavelength. In then indicates the
received light intensity at any given wavelength.
~ata Processi~ Cir~uit
In a tw~ wavelength system, data processing
circuit 107 computes a ratio from the digital
amplitude data measured at each wavelength of light.
In particular, this process used by data processing
circuit 107 is illustrated in flow diagram form in
Figure 4. At step 401, data processing circuit 107
receives a set of digital input data indicative of the
measured intensity of light at both wavelengths, as
received by light detector 113. Data processing
circuit 107 at step 410 transmits the received set of
data to display driver 109 for display in graphical
form on display 114. The displayed wave~orm
represents the pulsatile component of the arterial
blood. Data proces~ing circu~t 107 also stores the
received set of data in memory 106 and uses this set
of data and the last most rec:ently received set of
data to compute at steps 402 and 403 the differential
change in absorption of the arterial blood in finger
105 at the first and second slelected wavelengths of
light, respectively. The differential change in
absorption at wavelength n i5 computed by data
processing circuit 107 as: -
n In t )
Because dIn is a mathematical construct, it is
approximated in arterial blood monitoring system 100
by AIn, where ~In is the difference between two
- : : .,
. . ~ - , - , ............ :: . .
,, . : ;:
r~ ~ ~
-16-
consecutively received In values. Only ~I values that
are caused by a small but non zero change in path
length through finger 105 are used and therçfore ~In
can also be a longer interval of time if necessary to
obtain a sufficient change in received intensity o~
the b~am of light. The In value used in equation 1 i~
th~ average of the two ~ucc2ssively received In values
used to ¢ompute ~In.
In a two wavelength system, a final ratio is then
calculated by data processing circuit 107 at step 404
as:
R = d A2 ~, 2 )
where the data values used to compu-te dA1 are from the
same sets of data as the data values used to compute
dA2.
This ratio is then used in a calibration equation
by data processing circuit 107 at step 405 to relate
the R value to a specific total hemoglobin value,
which is approximated by a second order polynomial of
the form:
t~b = A~2 + BR + C ¦3)
2 0 Where A ~ B, a~d C are constants that depend on
the speci~.ic wavalengths of light used.
The tHb value is then output by data processing
circuit 107 at step 406 to display driver 109 (and/or
hardcopy) to display in human-readable fo~m on display
115 a numeric value of the concentratisn of total
hemoglobin in the arterial blood of finger 105.
Processing then returns to step 401.
.
~17
Theory
This device is based on the theory that:
dAn = ~C æ'dL ~ t
A differential change in absorption at a given
wavelength n to a given substance (dAn5), is equal to
the extinction o~ that s~bstance ~n~) times the
concentration ~Cs~ o~ that ~ubstance ti~es the
differential change in pathlength of that ~ubstance
(dLs) .
Further the differential change in absorption can
0 be defined as:
dIn ~ 5)
n
Note that no measurement of the incident light
intensity, Io, is required to me~sure the differential
chan~e in absorption dA. However, samples of I" must
be taken sufficiently close in time so that ~In
represents a good mathematical 2pproximation o~` dIn.
To determine the relative proportions of two
dominant absorbers, in this case water and hemoglobin,
one chooses two wavelengths of light at which the two
absorbers have extinction~, sueh that the following
set of simultaneous equations has a unique solution
for all possible concentrations and pathlengths of the
two absorbers.
~ dL t + ~1 dL W ( 6 )
: "
,
dA2 = ~2 d L t + ~2 dL~ ~7~
In this system of equations it is assumed that the
only cnmponents which change in pathlength are those
of the arterial blood. Further it is assumed that the
primary absorbers are those o~ water and hemoglobin
where the hemoglobin species in the blood are
essentially o~ly those o~ oxyh~moglobin and reduced
hemoglobin. Choosing a wavelength of light *hat
represents an isobestic point for the two species of
hemoglobin, such as 804nm, minimizes the effects of
oxygen saturation on the tHb readings o~ the system.
The concentration term can be taken as 1 tor 100%) by
viewing the optical system as compartmentalized, that
is look:ing at the tissue under test as one in which
the light first passes through 180% skin tissue,
followed by 100% vPnous blood, followed by 100%
arterial hemoglobin, followed by 100~ waterl and so
on.
In the system of equations (Equations 6, 7) the
extinction ~ values are ccnstants and it is the job of
the arterial blood monitoring ,system 100 to read the
di~ferential change in absorpkion (dA values) as
accurately as possible. This leaves only the values
of the differ2ntial path lengths dL as unknowns. With
two equativns, the dL values can be uniquely and
simply solved for.
Writing the proportion of hemoglobin in the
arterial blood as:
Proportion ~b = dLt ~8)
dL t + dLv
.
' `'
' .
--19--
While this proportion i5 not directly the tHb, it is
directly related to it. And while this relationship
could be theoretically d~rived, an empirical
relationship (as defined in equation 3) is measured
instead. This is necessary due to sever~l ways in
which the true optical system of living tissues and
realistic optical elements deviate from the exact
theoretical model developed here. Equation 3 is
therefore referred to as the calibration equation and
its coefficients A, B, and C, are axperimentally
derived via clinical t~sting. The coefficients are
then installed in the arterial blood monitoring systsm
software. It should be noted that these coefficients
differ for different wavelength emitters.
The wavelengths of light produced by light
emitting devices 111, 112 are also selected so as to
optimize the performance of the entire electro optical
systemo low ~nough light absorption so that sufficient
optical signal is received by light detector 113 and
high enough light absorption so that there is an
appreciable change in light absorption over the range
of physiological changes in pathlength caused by the
pulsation of arterial blood. Typical wavelengths of
light selected for a realization o~ this system are
810nm and 1270nm, however many wavelength combinations
meeting the above criteria can be used.
Combination t~b ~onitor ~D~ PU1~0 O~i~eter
The methodologies for pulse oximetry are well
known, The method of obtaining tHb noninvasively and
in real time has been disclosed above. The arterial
blood monitoring system o~ the present invention
combines the two technologies to create an improved
device for measurement of both parameters. tHb is an
-
~20~
interfering substance in the mea urement of S~O2 by
the present technologies. By "interfering substance"
it is meant that variations in tHb cause variations in
the SaO2 as read by a pulse oximeter~ These
variations in S~O2 are correlated to, but not
corrected for, the t~b level. A device capable of
measuring tHb can therefore provide a ~eans for
eliminating the error it causes in determining S~02.
ThP same holds true in terms of 5~2 being an
~0 inter~ering substance in the measurement of tHb. The
solution to this problem lies in a combination device
capable of reading both parameters. Such a device can
be simply obtained by using two wavelengths to derive
the SaO2, and two more as described above for
obtaining tHb. The resulting values for Sa32 and tHb
can then be used to correct the readings of the other.
A more sophisticated system uses a three wavelength
system, where the practical realization of this system
utilizes the standard oximetry wavelengths o~ 660nm
and 940nm produced by two light emitting devices llla,
lllb, along with a wavelength of 1270nm produced by a
light emitting device 112. (Once again, any three
wavelengths that meet the crite.ria stated above for a
standalone tHb system can be usedO~ In addition, the
two segment light detector lL3 is activated in a
manner to rePlect the use cf three wavelengths of
light. Silicon photodiode 113a detects both of the
light beams (660nm, 940nm) produced by light emitter
devices llla, lllb and its output is demultiplexed to
separate the two measured values o~ lighk intensity.
Germanium photodiode 113b of light dete~tor 113
measures the intensity of the third beam of light at
1270nm.
In particular, the process used by data
'': . ' ':
2 ~ $ S~ r~ 7
-21-
processing circuit 107 is illustrated in flow diagram
form in Figure 5. At ~tep 501, data processing
circuit 107 receives a set of digital input data
indicative of the measured intensity of light at all
three wavelength~, as received by light detector 113.
Data processing circuit 107 at step 510 transmits the
received set of data to display driver 109 ~or display
in graphical ~orm on display 11~. The displayed
waveform represents th~ pul~atile component o~ the
arterial blood. ~ata processing circuit 107 also
stores the received ~et of data in memory 101 and uses
this set of data and the last most recently received
set of data to compute at steps 502 - 504 the
differential change in absorption of the arterial
blood in finger 105 at the first J ~econd, and third
wavelengths of light, respectively.
Thus, as noted above, and extrapolated to a three
variable system:
dAA = ~dL ~ ~,dL,~ ~ ~AdLW (9)
where
0 = [0zHb~
R = [RHb]
W = r~2]
Therefore at any given wavelength, A, the diff~rential
change in light a~orption is a function of the change
in path length of the three absorbers: oxyhemoglobin
(02Hb), reduced hemoglobin ~RHb~, and water (H20~.
b dL + dL R ~10 )
dL + dL ~ ~ dL w
Note that this equation shows only that the total
2 ~
hemoglobin is proportional to this ratio of path
length changes, not equal to ito This is due, at
least in part, to the ~act the tHb is measured in
terms of grams/deciliter o~ whole blood and this
eguation is a ratio of path lengths. There is a one
to one correspondence between this ratio of path
lengths and the tHb which is determined, and curve
fit, experi~entally. The empirical ~urve fit also
compensates for the differences between the
theoretical models and the actual optical systems.
dL + dLR g?13
For a three wavelength system, with the subscripts 1,
~, and 3 indicating the specific wavelengths used we
can write the following system of equations
dAl = ~1 dL + ~ dLR + ~lW dLW
dA2 = ~2 dLo ~ 1~2R dLR + ~2 dLW tl3)
dA3 - ~3 dL + ~ dLR + ~3W dZ,W (14
In matrix notation:
¦d 2~ = ¦dLR¦ ¦~o ~ 5)
This allows us to solve for the pa~h length
contributions of each of the three absorbers as
.. . . ~
--23--
defined by the ~ollowing equSations
d~ d~ ( 6~63 -- ~6~ l, ( 6S63 -- 6~65 ~ ~ da3 ( 61 6~ -- ~Es ) ~ 16
l363 - dA3~z) - 6~ 6~ 6s) I 63 ~d~S62 ~ d~ .
dZ.~' ~62L~A3 -- 6~d~3) -- 62 (~da3 -- 63~s) ~ 6~ ~61dA, -- 6~Lta~
.
Now the S"02 can be calculated by data processing
circuit 107 at step 405 as
S~02 dL + dLR ~19
ld~, [6~6~--656~ 65~1--6~6~ 3 ~6~6~ 6~6~? ] / ___
[d~5 ~--6~6~ 6563--6365) ~L~ 16~ 6;) ~6s ~dA26~--~362) l~2 9 )
6 ~ d~26~ 3 6SV) ~ 6 ~ ~ 6~ ;) ] /~
6J~ ^62~R)~d4a~e -6l~!t~ IdA3~ ea~~s~ )
63--6z~--~26~6~6~ 6~--616;~ 6~6~ ) ~ ( 2 1 )
d~3 ~6i62-6~6~V-6~062~606")
Recognizing that the extinction coefficients are
5 empirically measured constant:s, llsing K~, through K6
to indicate the appropriate combination of extirlc~ion
coefficients, we can simplify the equation for SaO2 as
~ollows
.: : ~' , ', , :
'' :: "- '' .-, '- '~
, '' ,. . .:, :' '
; ' ~ :.,' :' : .'
'. ' , ' . . :'. - ' ' ;
2 ~
.24 ~
S o = ~1 (Kl ) + d~2 (K2) + dA~ (K3) la22 'J
dAl (K4) I dA2 (K5) ~ dA3 (K6)
The ~ame development that was per~ormed for S~O2 can
now be done by data processing circuit 107 at step 406
for total hemoglobin. Notice that the numerator in
this equation is identical to the denominator in the
equation ~or SaO2.
tHbC~ dL~ + dL2 ~233
dL" ~ dL + dLR
3-~2~ 2)~3+1~2W~30) +dA2 (~ +~W-~w~)
t~bK . 3 ( 1 2 ~ 2 )
2~ +~2~-~~3+~W_~W) +
dA2 (~-~1~+~3-~1~+~ 3) +
dA3 ~ 2~ 2w~+~2w_~
t~bK dAl (K4) + dA2 (K5) + dA (K6) 125
dAl (K7) + dA2 (K8) ' dA3 (~Cg)
O~y~en Content
With tHb and S~02 known it is a simple matter to
calculate and display the 02 content of the arterial
blood. This is derived by data processing circuit 107
at step 407 as ~ollows:
02 ct - (.0031 ~ PO2) l (1. 38 * th~ * SaO2) ~26)
,~
.: '
,
` ,.; ~` :
$ ~
-25-
tHb and S~O2 are the analytes ~easured by the arterial
blood monitoring system and P2 can either be taken as
a fixed value of 90 torr or for increased accuracy can
be obtained by working backwards through the oxygen
dissociation curve. The curve can be installed as a
look-up table in memory 107 or an equation in the
software of data processing circuit 107. As the pH,
2,3 DPG and PaC02 ~re unknown, the curve used assume
an average or noxmal level for these variables. Since
the dissolved oxygen is such a ~mall contribution to
the total 02 ct, either of these methods provides
adequate accuracy. At step 508, data processing
circuit 107 transmits the computed values of S~O2, tHb
and 02 ct to display driver 109 to prGduce numerical
human-readable outputs on display devices 115a, 115b,
115c, xespectively.
There are several di~ferent mathodologies that
accomplish the same purpose. One of these is a
logarithmically based method. In this method, Rn as
defined in equation a is modified as follows:
~ = log In(9"9tol0) ~27)
og In~d~agtolo)
The log values are to the :base e. Systole and
diastole refer to the two points on the
photoplethysmographic waveform where the transmitted
intensity is sampled.
These log values can ~e calculated ~or ~btained
via lookup table in memory 106~ by data processing
circuit 107 usiny the circuitry already defined.
Alternatively the circuitry can be altered to utilize
logarithmic amplifiers so that the data sampled by
data processing circuit 107 is already converted to
' ,,, ' .; ~.
. . - ~ ~, '::
4~ L~
--26--
logarithms or is the ~inal ratio calculated in
equation 2. One advantage of this methodology is that
it allows cne to work with the max and min values of
the photoplethysmographic waveform. It is worth
noting that the sample points on the
photopethysmographic waveform do not necessarily have
to be at systole and diastole. They can be any two
point~ separated by a measurable change in arterial
path length.
While a specific emhodiment of this invention has
been disclosed, it is expected that those skilled in
the art can and will design alternate embodiments of
this invention that fall within the scope of the
appended claims.
.' . : ,
, ~
.
~. .,
. ~