Note: Descriptions are shown in the official language in which they were submitted.
2100687
METAL DETECTOR WITH BIVARIATE DISPLAY
Field of Invention
The present invention relates to the field of
metal detectors, and more particularly to a means of
- graphically displaying bivariate signal information that
reflects signal characteristics r~cpon~ive to metal
objects which pass beneath a search head of the metal
detector.
Background of the Invention
An induction balanced metal detector, of-the
type used to locate coins, rings and other treasure
buried in soil within a few feet of the surface, has a
search head that houses a transmit coil and receive coil.
The metal detector has circuitry that transmits a
periodic signal to the transmit coil as the search head
is manually swept over a ground surface to detect buried
metal objects. When the transmit coil passes over a
metal object, a signal is generated in the receive coil
due to perturbations in the magnetic field which cause
the AC inductive coupling between the transmit and
receive coils to become unbalanced. These receive coil
signals are responisive to target characteristics such as
2s size, depth below the ground surface, orientation with
respect to the search head, and type of metal. In order
to provide the user with information about the target's
characteristics, (e.g., to distinguish coins from nails),
some metal detectors measure the phase angle between the
transmitted signal and the received signal. This phase
angle is typically displayed~to the user as a number on
an output device such as an analog meter or a liquid
crystal display (LCD). Under ideal conditions this phase
angle can provide the user with accurate information
regarding the target.
However, in actual practice the phase angle
information is materially affected by ground
2100687
mineralization and can also be affected by the target's
orientation with respect to the search head. Under
either of these conditions a single sweep of the search
head can, with conventional displays, produce multiple
S phase angle readings and thereby result in an indecipher-
able o~u~. In response to this problem some metal
detector designers have also provided an audio ~ uL of
the received signal where the tone's frequency corre-
sponds to the phase angle of the signal and the tone's
volume corresponds to the signal strength. An example ofthe prior art which uses a numeric LCD to display phase
angle information and which also has an audio oul ~a~ is
Maulding, U.S. Patent No. 4,868,910, assigned to the
assignee of this invention. This recent prior art
approach provides the user with more complete information
regarding phase angle and signal strength, but suffers in
that the information cannot be latched for careful analy-
sis and it also depends upon the user's audio memory and
ability to discern frequencies in order to determine the
target's characteristics.
Summary of the Invention
The present invention solves the above problems
by providing a biv,ariate visual display of two variables
that are associated with a signal induced in the receive
coil of a metal detector. The two variables are:
(1) the receive signal's phase angle (with respect to the
transmit signal) and (2) the choice of either (a) a count
of the number of occurrences in which the signal ampli-
tude exceeds a predetermined amplitude (hereinafter, thesignal count) or (b) the signal amplitude. The bivariate
information is displayed on a suitable graphic device
such as an LC~. This method permits the metal detector
operator to readily make a visual discrimination between
valid phase angle readings that represent good target
information and those that-are due to extraneous,
non-target magnetic field perturbations.
2100687
The principal objective of the present
invention is to provide a metal detector having a
bivariate visual display of two signal characteristics
that are representative of a target object.
It is a further objective of the present
invention to provide an improved metal detector in which
(a) the phase angle between the transmit and receive
signals is determined only when the signal ~trength
exceeds a predetermined level and (b) the number of times
the signal amplitude ~c~e~ the predetermined level at a
predetermined range of phase angles is counted, and then
simultaneously displaying both the phase angle and-signal
count on a visual display device.
It is a still further objective of the present
invention to provide a metal detector that measures the
phase angle between the transmit signal and receive
signal when the signal strength exceeds a predetermined
level by displaying the phase angle and received signal
strength simultaneously on a visual display device.
The foregoing and other objectives, features
and advantages of the present invention will be more
readily understood upon consideration of the following
detailed description of the invention ta~en in conjunc-
tion with the acco,mpanying drawings.
Brief Description of the Drawinqs
FIG. 1 is a block diagram of a portion of an
exemplary metal detector circuit of the present
invention.
FIGS. 2a-2g show exemplary embodiments of a
bivariate graphic display of the present invention
showing signal information associated with a metal
detector. -
FIG. 3 is an abridged flow diagram of an
exemplary software routine for processing the signals
associated with the metal~detector.
4 ~ 7
FIG. 4 is a flow diagram of an exemplary
software routine that writes phase angle and signal count
to the graphic display of FIG. 2.
FIG. 5 is a flow diagram of an exemplary
software subroutine that selects a shorter bar character
associated with the graphic display device of FIG. 2.
FIG. 6 is a flow diagram of an exemplary
software routine that writes phase angle and amplitude
information to the graphic display device of FIG. 2.
Appendix A is a source code listing of the
subroutine REPORT.
Descri~tion of the Preferred Embodiment
This invention pertains to improvements in the
display of signal information generated within induction
balance type metal detectors. A metal detector of this
type is fully described in Maulding, U.S. Patent No.
4,868,910. Before proceeding to the preferred embodiment
of the present invention, it is first necessary to
generally describe the operation of an induction-balanced
metal detector which will be done with reference to
Maulding.
An induction-balanced metal detector generally
has a search head with two AC coupled, electrically
conductive coils: a transmit coil and a receive coil.
Maulding describes a search head with three coils;
transmit, receive and a feedback coil; however, the
feedback coil is not relevant to the present disclosure.
(See Maulding, FIG. 1, Nos. 22, 24 and 26.) To search
for buried targets, a periodic signal is applied to the
transmit coil as the search head is swept over an area of
ground. Under ideal conditions, i.e. proper induction
balance and no magnetic field perturbations, there is no
signal in the receive coil. However, when the search
head passes over a target it causes a disturbance in the
transmit coil's magnetic field, thereby inducing a signal
2100687
s
in the receive coil. The transmit and receive signals
are then electronically processed and applied to various
ou~ devices in an effort to measure and communicate
various target characteristics. As exemplified in Mauld-
S ing, the signals are processed into six components; XD,
XF, YD, YF, GD and GF. Only the filtered signals XF, YF
and GF are relevant to the present application. XF and
YF are DC phase quadrature components of the receive and
transmit signals and GF is a filtered DC signal represen-
tation of the ground mineralization effects. (See
Maulding, FIG. l where 52, 56 and 78 represent signals
XF, YF and GF, respectively.) From the XF and YF compo-
nents, a receive signal phase angle is measured which is
representative of the target's characteristics. (Mauld-
ing, FIGS. 2, 3; Col. 9, lines 35-50; and Col. 21, lines
27-50.) This phase angle information discloses charac-
teristics such as type of metal, size, orientation of a
ferromagnetic object with respect to the search head, and
ground mineralization.
FIG. 1 of this application shows the components
of Maulding's circuit which are also in the present
invention. (The reference numbers in FIG. 1 correspond
to Maulding reference numbers for identical component
blocks.) All the reference elements in FIG. l are also
represented in Maulding with the important exception of
LCD 139 which is materially distinct from Naulding's LCD
138.
With reference to FIG. 1, it can be seen that
signals XF and YF emerge from respective band pass
filters 42, 46 and are applied to respective track and
hold circuits 50 and 54. Thereafter, signals XF and YF
are applied to a multiplexor (MUX) 82. The signal GF
emerges from a band pass filter-74 and is thereafter
applied directly to MUX 82.
Reading a signal is a two-step process and
fully described in Maulding (Col. 18, line 25 to
Col. 19, line 3). In essence, the main processor 116
2100687
simultaneously commands track and hold circuits 50, 54 to
hold the respective XF and YF signals so that the signals
which are later sequentially input into the MnX represent
XF and YF cignals that are sampled at the same instant in
s time. The main processor 116 then directs MUX 82 to
route selected signals to the MnX o~uL in a predeter-
mined sequence at a fixed sampling rate of approximately
.S milliseconds. The signals coming out of the MnX are
applied to an analog-to-digital converter system 100 and
then applied to the main processor 116. At this point
the present system is different from Maulding in that the
main processor then writes the information to LCD 139 in
a suitable format using onboard software p~y~mming
described hereinafter.
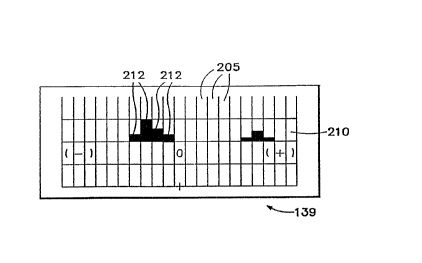
FIG. 2a represents a preferred embodiment of
the bivariate graphical display of the present invention
showing two variables of signal information displayed on
LCD 139. There is a horizontal scale that is divided
into a series of evenly-spaced divisions 205, each divi-
sion represents a range of phase angles. A preferred
embodiment of the present invention that is generally
commercially available is a LCD having a 4 x 20 character
display, which means that the horizontal axis can display
20 characters and the vertical scale can display four
characters, with each character representing a range of
values.
In the preferred embodiment of the display
shown in each of FIGS. 2a-2g, the horizontal scale repre-
sents the relative phase angle. Each division represents
a range of phase angles: where the possible range of
phase angles is 180- then each division along the hori-
zontal scale of a 4 x 20 LCD would represent a 9~ range
of phase angles. The vertical scale 210 represents a
second variable which is either (1) a signal count or
(2) an amplitude of the receive signal.
The signal count~is a running tabulation of the
number of times that a signal having a particular phase
2100687
angle exceeds a predetermined threshold amplitude (e.g.,
the number of times that a signal with a phase angle
between ~20 and ~29 exceeds a signal strength of 0.08
volts). Either the user or the main processor 116
selects the threshold amplitude to filter out weak
signals. Each time a signal amplitude exceeds the
threshold amplitude the associated phase angle is
measured and the signal count for that phase angle is
incremented.
The alternate variable displayed on the
vertical scale is the amplitude of the receive signal.
Only information associated with phase angles whose
amplitude exceeds the predetermined threshold level is
displayed.
The individual characters 212 used to represent
the bivariate information are user definable characters
which are bit-mapped into a five by eight matrix within
the main processor 116 and downloaded to the ~CD. The
standard configuration displays the signal information as
a bar graph, with a bar at respective phase angle ranges
and the height of the bar is proportional to the signal
count or signal amplitude (the bar height is zero where
no signals correspond to a given range of phase angles).
FIGS. 2b,2g are examples of the LCD display
when the search head encounters various buried metals.
FIGS. 2b-2d represent the display in response to "good
targets,~ that is, targets that the metal detector user
may want to dig up. Good target displays are character-
ized by a tight grouping of bars within a narrow range of
phase angles, or optimally at a single phase angle range
as shown in FIG. 2b. Additionally, good targets are
characterized by groupings in the positive portion of the
graph; i.e., the area between the "0" and "(~" symbols.
The exemplary embodiments of FIGS. 2b-2d also show other
information on the LCD such as the VDI, which is a
numeric representation of~the phase angle, and a textual
estimate of the target, e.g., "quarter" in FIG. 2b.
2100687
FIGS. 2e-2g are exemplary embodiments of the
display when the search head encounters undesirable
(i.e., non-valuable) metal targets. These graphs display
signal information having phase angles that are predom-
inately in the negative portion of the graph (between "0"and n (~ ) and which typically show a signal response at
a wide range of phase angles rather than the tight group-
ing associated with goods targets. The bivariate display
is particularly helpful in deciphering those signals that
are spread across a wide range of phase angles, as is
shown in FIG. 2f. If the display were monovariate (e.g.,
a numeric LCD), the user would not be able to distinguish
good targets from bad because the numeric LCD would be as
likely to show a phase angle associated with a good
target as with a bad one. But the bivariate display of
the present invention shows the signal information as a
"smear" across the display, thereby clearly communicating
to the user that the target is not desirable.
~he advantage of the bivariate display is also
apparent in a comparison of FIG. 2g with FIG. 2d. A
monovariate display would likely indicate the same phase
angle for each of these targets, namely the phase angle
associated with the division 250 to the immediate right
of the center because the largest bar is at that loca-
tion. However the bivariate display of the presentinvention shows information on multiple phase angles and
the good target FIG. 2d has a bar to the positive side
whereas the undesirable target FIG. 2g has a bar to the
negative side of the largest bar. A user familiar with
these displays will recognize the more positive phase
angles as indicative of a good target.
FIG. 3 is an abridged software flow diagram
representing the steps performed by the main processor
during operation of the metal detector. A more complete
flow diagram showing all steps necessary for operation of
a metal detector is shown ~in Maulding, FIG. 11. Contin-
uing with FIG. 3 of the present invention, steps 302 and
2100687
304 represent channel selection and signal reading
wherein the main processor 116 instructs the Mnx 82 to
route a selected channel to the MUX o~u~ pin. After
reading the signals 304, the next step calls software
subroutine PEAK 306, which determines whether signal GF
has reached a local maximum value. (Subroutine PEAK is
exemplarily shown in Maulding FIG. 16.) A "local maxi-
mum" is one that occurs within a predetermined period of
time. When the main processor determines that GF has
reached a local maximum, a flag ~PK" is set. The next
step, subroutine ~l~ASE 308, calculates the phase of
the receive signal from XF and YF and stores the result
in a memory register "PHASE." (~hl~ASE is exemplarily
shown in Maulding, FIG. 18.) After ~l~nASE, the soft-
ware calls subroutine REPORT 310 which checks the statusof flag PK and writes the signal information to the LCD
when flag PK is set. (The subroutine REPORT 310 is novel
to this invention and has no equivalent in Maulding.)
Software module REPORT utilizes one of two routines AVERG
(FIGS. 4 and 5) or NORM (FIG. 6).
The REPORT subroutine checks a flag "MP" to
determine whether the user has selected the display mode
which shows the signal count or the signal amplitude. If
the user selects tjhe signal count display, then the sub-
routine REPORT will branch to a routine AVERG (FIG. 4).
Alternatively, if the user selects the amplitude display,
then REPORT will branch to the routine NORM (FIG. 6).
AVERG and NORM could be subroutines, but in the preferred
embodiment they are code within the subroutine REPORT.
FIG. 4 is an exemplary flow diagram of AVERG
400 which writes signal information to the LCD. This
routine determines whether a local maximum in the signal
amplitude has occurred at step-410 by testing whether
flag PK has been set. If PK is not set then the routine
exits at 412. If flag PK is set then the routine gets
the phase angle in step 42-0 from the memory register
PHASE. In step 425 the routine converts the phase angle
2100687
into an LCD "write" address. As explained above, the
preferred embodiment includes a 4 x 20 matrix LCD display
device and the phase angle is represented along the 20-
character axis. Therefore, the software program converts
the phase angle into a "write" address corresponding to
the LCD axis by multiplying the phase angle by 20 and
dividing the result by 180, effectively creating 20
ranges of phase angles of nine degrees each. The routine
then reads the height of the bar at the LCD address
corresponding to the ~write" address at step 430 and in
step 435 determines whether the bar has reached a maximum
height. If the bar has not reached a maximum height then
the routine writes the next taller bar character in step
445. Alternatively, if the bar is at a maximum height
then the routine calls FADE at step 440.
FADE 460, FIG. 5, decrements the height of all
bars that are at addresses other than the "write"
address. FADE loops through 20 iterations, step 465, to
read the height of the bar at each address, step 470. If
the height of the bar is zero then the subroutine does
nothing and loops to the next bar, step 485. If the
height of the bar is not zero then the subroutine selects
thé next shortest bar character at step 480. The sub-
routine loops through all the bars until each bar other
than the "write" address bar is decremented (or skipped,
in the case of zero height bars) at step 485. After
completing the 20 iteràtions the subroutine FADE returns
control to AVERG which terminates at step 490.
FIG. 6 is an exemplary flow diagram
representation of the routine NORM 500. Upon entering
NORM, the program first determines whether a local
maximum in the receive signal has occurred at step 502 by
testing for the flag PK. If flag PK is not set, the
routine terminates at step 526. If flag PK is set, the
3s program gets, at step 504, the phase angle of the receive
signal from the memory register and converts the phase
angle to an LCD "write" address 1 to 20, step 506, in the
2100687
- 11
same manner as described above for routine AVERG. In the
next step, the program runs a subroutine BYTE(GF) to
calculate a compressed eight-bit datum representing the
GF level which correlates to the receive signal ampli-
tude. (BYTE is exemplarily disclosed in Maulding,
FIG. 14.) Thereafter, the routine, at steps 510, 512 and
514, respectively, tests the eight-bit representation of
the GF level against three preset, respectively decreas-
ing thresholds designated thresholds 1, 2, and 3. If the
GF level is greater than the first threshold 510, then
the routine selects all four segments of the bar at step
516. If the GF level is less than threshold 1 but-
greater than the next lowest threshold 2, step 512, then
the routine selects three of the four bar characters at
step 518. If the GF level is less than threshold 2 but
greater than the lowest threshold 3, step 514, then the
routine selects two bar characters at step 520. If the
GF level is less than threshold 3 then the routine
selects one bar character at step 522. The routine then
writes the information to the ~write" address at step 524
and exits the subroutine at step 526.
The terms and expressions which have been
employed in the foregoing specification are used therein
as terms of description and not of limitation, and there
is no intention, in the use of such terms and expres-
sions, of excluding equivalents of the features shown and
described or portions thereof, it being recognized that
the scope of the invention is defined and limited only by
the claims which follow.