Note: Descriptions are shown in the official language in which they were submitted.
WO 92/22802 PCI/US~2/05103
~ 1 0 9 .9 ~
MULTIPLE REACTION WELL CARTRIDGE
BACK~;ROI~ND OF THE INVENTION
The present invention relates generally to an
automated apparatus and method for performing assay testing
on specimens, such as biological specimens. More
specifically, the invention is directed to an automated
apparatus and method for assay performing procedures to
detect the compatibility of tissue or blood from a donor to a
recipient~
Modern test procedures for determining or measuring
the optical or electrochemical development of unknown
specimens are used extensively in a number of medical testing
procedures. In such tests, sample specimens are reacted with
reagents and other substances. Such known procedures involve
a variety of different assay steps but typically rely on
detection and measurement of optical changes in a sample or
label during the assay procedure. For example, a number of
well known procedures use single or multi-waveleng~h
fluorescence. These and other immunoassay techniques are
known as Fluorescence Polarization Immunoassay (FPIA), solid
phase agglutination, stained cellular morphology, enzyme
Immunoassay (EIA), chemoluminescence and spectrophotometric
assays.
Other currently used assay techniques are effected by
exposing the resulting sample to either transillumination or
W092/22802 PCT/US92/05103
~1~0~9~ 1 2 ~
reflectant illumination. These assay procedures involve ~;
detecting the intensity of colorization, detecting ratio of
multiple wavelengths of colorization, detecting the -
polarization in the sample, determining the size and quantity
of specific cells at certain wavelengths, the general cell
morphology or other optical characteristics of the results.
The data from these procedures is then processed in a known
manner to obtain the concentration or ratio of the component
(or components) of interest. These techniques, however, have
not been completely accepted and usually manual analysis is
also performed as a check or verification.
One assay procedure of particular interest is a
procedure known as Human Leukocyte Antigen (HLA) typing.
This procedure is employed in matching tissue, body organs or ~
blood from a donor to a recipient. In this HLA procedure, -
lymphocytes in samples containing human cells are first -
isolated and then reacted with different antisera. The
cell-serum mixture is then incubated with a complement. One
or more stains are added to the mixture, with one of the
stains staining dead cells. The reactions are then evaluated
by calculating the ratio of dead cells (lysed cells) to live
cells. The calculations are performed by using a microscope
and estimating the ratio. This ratio is converted into a
~score~ ranging from 1-8 by using a well-known value scale.
In this HLA procedure, as well as other assay
procedures, paramagnetic particles are coated with an
antibody. The paramagnetic particles are then mixed with a
sample to be analyzed. The antibody on the paramagnetic
particles binds to specific cells in the sample. These
specific cellular components may then be separated from the
other cells in the population which is being tested using
magnetic separation techniques. Alternatively the cells may
be separated by using a nylon wool column. After the cells
have been reacted with the antibody, the sample mixture is
subjected to a series of operations such as particle
W092/22802 PCT/US92/05103
2 ~ 0,t)~
exposure, reagent exposure, incubation, and washing. The
cells in the sample may also be stained with one or more
chemical markers as discussed above with respect to HLA
assays. The sample is then analyzed. Typically, the sample
will be analyzed manually by the technician. This manual
analysis usually involves a visual analysis to determine the
approximate percentage of the cells which have reacted with
the antibody.
A significant shortcoming of these and other
available assay techniques is that most of the steps in the
procedure must be performed manually. For example, most of
these procedures require manual preparation of the sample.
Further, steps such as dispensing, mixing, washing,
incubation, data collection, scoring and recording are also
performed manually. Thus, most available assay techni~ues
require a significant amount of human operator time.
As will be apparent to those skilled in the art,
manual performance of these steps is also undesirable since
it results in numerous opportunities for errors to occur.
This is especially true for highly repetitive functions. The
probability of errors is further amplified by the fact that
many of these procedures require pipetting of very small ~-`
volumes, i.e. usually of sub-microliter volumes. Further,
scoring of thousands of ~eactions using a microscope and
pencil also increase the probability of errors in the
analysis.
A further drawback is the subjectivity which is
permitted to the individual performing the test. This
subjectivity may lead to inconsistent results, not only from
assay to assay, but inconsistent analysis during the numerous
repetitions in the same assay.
Although some available HLA assay devices automate
individual steps, most of the steps in these devices are
still performed manually. For example, U.S. Patent No.
4,318,866 (Kawahara et al.) discloses an apparatus for HLA -
~ '
W092/22802 PCT/US92/05103
~99~ 4 ~`
typing which uses a phase-contrast microscope and an optical
image to generate a signal which is detected by an electrical
signal pickup unit. The image is then binarized and compared
with predetermined template patterns corresponding to reacted
or non-reacted lymphocyte. Although the scoring of the
results is automated, the preparation, incubation and washing
of the sample must still be performed manually by the
operator.
Further, this apparatus uses dedicated electronic
hardware to score the HLA typing test. As discussed in more
detail below, anomalies such as dirt or dust in the sample,
scratches in the sample container, or unusually large cells
would result in unreliable or erroneous results. In fact, ~-~
without redesign for such possible variations, many human
readable samples are unreadable by this apparatus.
Variations in the procedures used by the operator preparing
the samples may also lead to unreliable results without major
redesign of the system. In summary, any expansion of the
apparatus to score assays other than those that ic was
specifica~ly designed for is difficult and costly, requiring
major rede~ign of the hardware for each assay.
Another major disadvantage of available automated
systems, such as the one disclosed in U.S. Patent
No. 4,318,866, in that they are designed for a specific assay
procedure tsuch as HLA typing). It is not possible to
perform assays for which the instrument was not originally
designed without a major redesign of the hardware and or
software. Such major redesign is impracticable and thus the
use of available instruments is limited to a single type of
assay.
Precise dispensin~ of the sample in reaction wells is
also critical for accurate assay results. In HLA typing the
dispensing is usually performed manually. A certain manual
dispensing operation may include dispensing sample volume of
from 0.5 ~l to l.0 ~l into a volume of 0.5 ~l of a reagent `~
W092/22802 PCT/US92/0~103
2lo~9a1~
which is covered by 2.5 ~l of mineral oil. (The oil is used
to prevent evaporation of the reagents.) In the alternative,
larger volumes are necessary to reduce the effect of operator
error. It will be appreciated that performing this
dispensing step involves a significant amount of operator
time, which increases as the number of different reagents
increases. In addition, increasing volumes increases cost as
many of the reagents may be ~uite expensive. Further, the
operator will usually insert the tip of the pipette below the
bottom surface of the oil and into the reagent itself. In
order to prevent carryover from one reaction site to the
next, the operator will typically manually wipe the tip of -
the probe thus consuming more operator time and increasing
the chances for erroneous results.
If automated assay apparatus and methods are to be
used in HLA assay procedures, they must be capable of very
precise monitoring of liquid levels and precise control of
liquid dispensing mechanisms (such as a pipette). Precise
dispensing mechanisms are particularly important in HLA
typing since, as discussed above, very small volumes of
liquids (sub-microliters) have to be dispensed and usually
into a container which contains another liquid. Although -
some automated liquid dispensing systems are presently
available, they are not completely suited for dispensing
samples for assays such as HLA typing. Available automated
liquid dispensing systems usually work by detecting the
liquid level in a container and then determining the pos~tion
of the dispensing probe relative to the liquid surface. This -
information is then used to determine when the probe tip is
within the liquid in the sample container. After the liquid
surface has been detected and it has been determined that the
probe is in the fluid, fluid may be dispensed into or
aspirated from the container. The precision of the liquid
dispensing system will thus depend in part on the precision
of the liquid level detection.
, ~ ".
W092~22802 PCT/US92/05103
9 ~ 6
The limited potential for available liquid level
detection and fluid dispensing systems in HLA assay typing is
due to tlle fact that they typically use a capacitance method
to detect the liquid surface as a pipetting probe moves
towards the liquid in a sample container. Dispensing liquids
in volumes smaller than one mi.croliter is complicated in such
capacitive or conductance systems since the oil which covers -
the reagent has a low dielectric constant. The dielectric ~
constant of oil is only two times greater than the dielectric ;
constant of air rendering most capacitive detection methods
unreliable for detection of the oil surface. Further,
because of the high resistivity of the oil, available
conductance methods cannot be used accurately.
Available capacitive type dispensing systems also do
not have any means for determining when a droplet of the
sample is formed on the dispensing probe or when a droplet of
the sample has been separated or released from the probe tip.
The ability to detect the occurrence of one or both of these
events is important information which could be used to ~
improve the accuracy and reliability of the dispensin~ -
system.
Therefo~e, it would be desirable to have a liquid
level detection and liquid dispensing arrangement capable of ~;
detecting very small amounts of liquid (down to fractions of
a microliter) and with the capability of detecting the level
of a liquid having a low dielectric constant.
Another area of assay testing where significant
improvements are necessary is in the area of image processing
used for counting reactions. Although photomultiplier tubes
have been previously used in some HLA readers, they are not
without disadvantages and have not been readily accepted in
the market. These readers use the photomultiplier tube as a
fluorescent densitometer to measure the overall li~ht output
from the reaction site for each wavelength. This may be
acceptable for ideal samples but produces critical errors if
`:
W092/22802 PCT/US92/05103
21~99ll~
any contaminants, such as dirt, dust, or other interfering
substances or other anomalies, such as scratches, are in the
reaction site. The errors arise because this approach cannot
determine the features in an object, such as shape or size of
particulates in the reaction site. Therefore, there is a
need for an instrument with the improved capability for the
discrimination of features within the field of view of the
imaging device. Although higher magnification and selective
mask techniques may be developed for the photomu~iplier tube
to yield the desired selectivity, the cost, reliability and
throughput of such a device would make it impractical. In
addition, such devices do not produce an image to which a
human technician is accustomed and therefore that image could
not be scored by the technician to confirm the instrument -~
generated result. -
Therefore, in view of the above, it is a primary
object of the present invention to provide an apparatus and ;~
method for automatic processing of a qualitative, `
quantitative or morphological analysis of test specimens
including serum, plasma or cellular components as well as --~
other non-biological specimens.
It is another object of the present invention to
provide an automated instrument for performing HLA typing,
including automated cell separation, automated sample ;
processing, and automated reading of the results.
It is a further object of the present invention to
provide an apparatus and method for performing an assay on a
disposable or reusable cartridge on which the specimen to be
analyzed may be placed and which will be analyzed by an
automated instrument.
It is another object of the present invention to
provide an analytical instrument with a liquid dispensing and
liquid level detection system which can control liquid
dispensing of very small volumes, accurately determine liquid
W O 92/22802 PC~r/US92/05103
9'~ ~ 8
levels even in liquids with a relatively low dielectric
constant, and determine droplet formation and separation.
It is another object of the present invention to
provide a detection system which can detect the interface ~-
between liquids with different dielectric constants.
It is another object of the present invention to
provide an analyzing instrument with powerful, cost-effective
and efficient image processing for automated sizing and
counting of data.
It is yet another object of the present invention to
provide an apparatus which is field upgradeable to perform ~-
diLferent types of assays
SUMMARY OF TE~ INVENTION
To achieve these and other objects, the present
invention comprises an apparatus which automates the steps
required in an assay procedure including cell separation,
sample processing, dispensing and scoring of the assay `
results.
- The apparatus performs the assays on a reaction -
cartridge having a plurality of reaction wells having ~-
different reagents disposed thereon. At least one well is
provided in the reaction cartrid~e to receive a sdmple. The
cartridge includes a well for containing particles adapted to
bind to the s mple and which have the capability of being
separated from cells (such as paramagnetic particles) which
do not bind to the separation particles, a well with at least
one fluorophore adapted to bind to a specific type of cell in
the sample is also provided. The cartridge includes a wash
area adapted for washing a probe and reservoirs for retaining
liquid and waste.
The apparatus of the present invention includes an
optical or image forming arrangement is provided to detect
images which indicate whether specific reactions have
occurred in each of the reaction wells. The apparatus also
W O 92/22802 2 1 0 9 9 ~ 1 PCT/US92/05103
includes a mechanism for dispensing and aspirating liquids `
including a mechanism for detecting liquid levels. The
device further includes logic for analyzing the information
received from the image forming arrangement and for
processing the information to generate a visual indication of
the assays being performed and their results. A
microprocessor is provided to assist in the operation of the -~
device as well as in the image processing.
In another aspect of the invention, a particularly
novel configuration for a cartridge which may be used in the
apparatus and methods of the present invention is provided. -
The cartridge includes a plurality of reaction wells having
different reagents disposed therein. The cartridge may also
.. . .
includes unit volumes of separation particles, a well adapted
to receive a unit volume of the sample to be analyzed, and a
well for storing a unit volume of dye (such as a fluorescent -~
dye) which may be used in the analysis of the sample. The
cartridge also preferably includes a well which may be used
as a probe wash area.
In another aspect of the present invention, a
particularly unique arrangement is provided for detecting
multiple liquid levels and for dispensing fluids. T~he liquid
level and dispensing mechanism includes a probe through which
a fluid is dispensed. T~e system includes the ability to
detect when a droplet has been formed by the probe and when
the droplet has been separated from the probe. An oscillator -
provides a radio-frequency signal to the tip of the probe. A
conductive element connected to amplifying and analyzing
circuitry is disposed below the dispensing probe and the
reaction well. The conductive element receives the
radio-frequency signal from the probe and processes the
signal to determine when the probe has reached the surface of
a liquid in the well, when a droplet has been formed and
detached from the probe, and when the probe is inserted into
the liquid.
: . .
'":
W092/22802 PCT/US92/05103
' ' ~
The inventive instrument is a random access,
automated instrument system designed to perform HLA and PRA
(Panel Creative Antibody) testing for transplant diagnostics.
The instrument utilizes disposable or reuseable cartridges
which incorporate sample well(s), reagent well(s), reaction
well(s) and probe wash/waste~well(s) into a single unit.
Although the number and configuration wells changes depending
upon the assay the external size of the disposable is ~-
preferrably at 5.5~1. x 3.3~w. x 0.55~h. soth human readable
and machine readable (barcode) labels can be affixed to the
disposable for identification.
As illustrated in the Figures, the major sub-systems
which comprise the instrument are the pipette robot, read
robot, fluidics system, reader, load, unload and incubator
stations. The instrument functions are controlled by an on- -~
board PC based computer controller. The human interface and
data management functions are accomplished by an external PC -
based Human Interface Workstation. `
Additional objects, advantages and novel features of
the invention will be set forth in part in the description
which follows, and in part will become apparent to those
skilled in the art upon examination of the following or may
be learned by practice of the invention. The objects and
advantages of the invention may be obtained by means of the
combinations particularly pointed out in the appended claims,
including all equivalents.
BRIEF DESCRIPTION OF THE ~AWINGS
FIGURE 1 is one embodiment of a cartridge of the
present invention for~holding reagents and samples to be
analyzed.
FIGURE 2 is an embodiment of one of the reaction
wells in the cartridge illustrated in Fig~ 1 depicting
reagents and a droplet in the well.
W092/22802 PCT/US92/05103 ~
2 1 (~ '3 ~
FIGURE 3 is a block diagram of an embodiment of the
ma~or components of the analyzing arrangement of the present
invention.
FIGURE 4 is a schematic block diagram of a top view
of an embodiment of the apparatus and method illustrated in
Fig. 3.
FIGURE 5 is one embodiment of a three axis robot
including a gripper which may be used ~or the pipette and
image robots illustrated in Figs. 3 and 4.
FIGURE 6 is an embodiment of the gripper which may be
used in the three axis robot illustrated in Fig. 5.
FIGURE 7 iS a block diagram of an embodiment of the
liquid level sensing arrangement of the present invention.
FIGURE 8 is a block diagram of the liquid level
sensing and dispensing mechanism of the present invention.
FIGURE 9 iS one embodiment of the amplifying circuits
used for the li~uid level sensing and dispensing mechanism
illustrated in Figs. 7 and 8.
FIGURE 10 is an illustration of the output signal
from the li~uid level detection system of the present
invention for a first dispensing procedure.
FIGURE ~1 is one embodiment of a square wave
oscillator which may be used in the liquid level sensing and
dispensing arrangement i~lustrated in Figs. 7 and 8.
FIGURE 12 is schematic of one embodiment of the
optical or image forming arrangement of the present
invention.
FIGURE 13 i5 a schematic, in block diagram form, of
an embodiment of the image processing arrangement of the
present invention.
FIGURE 14 is an illustration of the output signal
from the liquid level detection system of the present
invention for a second dispensing procedure.
FIGURE 15 is front perspective view of the apparatus
in accordance with the invention presented with the cover
W O 92/22802 PC~r/US92/05103 ~:~
~99~ 12 :.
removed showing major components of the analyzing apparatus.
FIGURE 16 is a top view of the apparatus of Fig. 15
with the top cover removed.
FIGURE 17 is a side cross-sectional view of another
embodiment of the optical arrangement of the present
invention.
FIGURE 18 is a perspective view of another embodiment
of a three axis robot including a gripper which may be used
for the pipette and image robot illustrated in Figs. 3 and 4.
FIGURE 19 is an illustration for determining location
of the well within an image for software determination of
profiles AB, BC, CD, BC, CB, and DA.
FIGURE 20 presents the profiles for the image in Fig.
19 again utilizing the coordinates of Fig. 19. When a
profile is analyzed individually, it may be represented by
one of four possibilities:
~ Type 1 - all white pixels
Type 2 - all black pixels
Type 3 - one transition ~
Type 4 - two transitions
FIGURE 21 illustrates a grouping of differe~t ;
orientations of the well if the profiles have a 1-3-2-3
ordering~
FIGURE 22 shows the well orientations for a 4-2-2-2
ordering.
FIGURE 23 illustrates configurations of 1-1-3-3
ordering.
FIGURE 24 shows the images corresponding to a 2-~-3-3
ordering of the profiles.
FIGURE 25 is an illustration of the image in which
the software has detected an extreme position o~ the well in
the X-axis.
FIGURE 26 is an illustration of the results of the
software controlled movement of the cartridge so the position
W092/22802 PCT/US92/05103
2 1 0 994 ~
~f the edge of a well is centered in the frame.
FIGURE 27 is an illustration of the well being moved
to locate the extreme position at a predetermined coordinate
which will ensure that the well is centered in the frame.
FIGURE 28 shows a region of interest superposed on an
image of the well and frame.
FIGURE 29 shows a typical histogram and threshold for
the region of interest (ROI).
FIGURE 30 illustrates ideally a ~alue of the
threshold which would be set at location on the histogram.
FIGURE 31 illustrates a typical grey scale contour of
two cells and also illustrates the two cells with a different
threshold.
FIGURE 32 illustrates multiple thresholds calculated
during the process of cell counting.
FIGURE 33 illustrates images A-E going from a strong
negative, to weak negative, to weak positive, to positive and
to strong positive reaction.
F~GURE 34 presents on top a row of graphs A-E
illustrating process intensities with the X-axis being pixel -
position information and Y-axis grey scale intensity; the
bottom row of graphs in Fig. 34 illustrate derivative of the
intensity information and a method of classification and
scoring of the information.
DETAILED DESCRIPTION OF THE INVE~IQ~
Sys~em Architecture
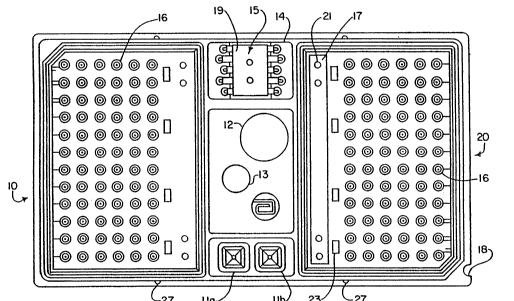
Referring now to the drawings, Figure l illustrates a
preferred embodiment of a test cartridge 10 which is used in
the analysis of the specimens to be tested. In the
embodiment illustrated in Figure 1, the cartridge 10 is
particularly suited for HLA tissue typing. Although this and
W092/22802 PCT/US92/051~3
~99~ 14 -
other embodiments which will be described are directed to HLA -
analysis, it will be readily apparent tO those skilled in the
art that the disclosed apparatus and methods may also be used
with other assay procedures.
The tray or cartridge 10 includes two sample wells
lla and llb. The second well~mày be used as a redundant
sample well which holds a sample for a second attempt at
using the cartridge if the first sample does not provide
satisfactory results. The sample cartridge 10 also includes
a reagent well 12 which is used for storing paramagnetic
particles and a fluorescent dye or fluorophore. The
fluorescent dye may be, for example, of blue excitation and
green emission wavelengths. A well 13 contains a complement
reagent and a second fluorophore. The second fluorophore -~`
preferably excites at green and emits at red wavelengths.
The cartridge 10 also includes a probe wash area is with a
plurality of separate wash basins 14 (ten shown). The wash
basins 14 drain off into the center of the probe wash
area 15. A blotter 19 can be disposed in the center of the
probe wash area. The blotter 19 absorbs excess fluid to
prevent splashing or spilling during transport of the
cartridge 10. Since the blotter 19 absorbs the waste fluid,
it also facilitates the disposal of these wastes since they
are now in solid form and may be disposed with the
cartridge 10 itself. Preferably the blotter material is
chosen to define a bi-axial transorb reservoir in the probe
wash area 15. A suitable blotter material is a bonded
cellulose acetate, such as is available from American
Filtrona Co. (Richmond, ~A).
As illustrated, the cartridge 10 includes a plurality
of reaction wells 16. In the embodiment illustrated in
Figure 1, the cartridge 10 includes 72 reaction wells on each
side of the center area of the cartridge 10. Thus, in an
embodiment a to~al of 144 or more reaction wells 16 are
provided. The reaction cartridge 10 may also include blotter
"~;
,
W092/22X02 PCT/US92/05103 ~
210~
material 17 to absorb reaction and wash fluids. The blotter
17 is held in the cartridge 10 by means of pins 21 and ribs
23.
Thus, the cartridge 10 advantageously provides an
arrangement where unit doses of the required reagents, dyes
and separation particles and a well for a unit sample can be
provided. Additionally, this confiyuration permits the
automation of the assay steps.
Referring now to Figure 2, a preferred configuration
for the reaction wells 16 of the cartridge 10 is illustrated.
Each of the reaction wells preferably has a 0.020 inch
diameter bottom and a 0.090 inch top diameter and a height of
0.090 inches. The reaction wells may be formed on a
cartridge made of mineral oil free, high-grade polystyrene by
known techniques, such as injection molding. The inner -
surface of the reaction wells 16 is preferably plasma treated -~
by known gas plasma (or gas ionization) treatment techniques,
such as by the techniques disclosed in the article entitled -
~Treating Plastic Surfaces With Cold Gas Plasmas~, P. Rose
et al., Plastics Engr., Oct. 1, 1980, which is hereby
incorporated by reference. In the em~odiment which is
illustrated in Figure 2, each reaction well 16 has 0.5
microliters of antisera covered with 2.0 microliters of an
oil ~such as mineral oil) to prevent evaporation. As will be
recognized by those skilled in the art, the amount of oil may
be varied in the well. For example, the well may contain 2.0
or 2.5 microliters of oil. Figure 2 also depicts a
droplet 25 containing 0.5 microliters of sample which has
been dispensed in the layer of oil 24.
Referring now to Figures 3 and 4, the major
components of an embodiment of the apparatus of the present
invention is illustrated in block diagram form. The
apparatus includes a load area 30 and a stat load area 32.
The stat load area 32 may be used to hold cartridges 10 with
a higher priority than those in load area 30. Thus the
W O 92/22802 PC~r/US92/05103
~ 16
cartridges 10 loaded into stat load area 32 will be processed
first. The cartridge 10 illustrated in Figure 1 is inserted
manually into either load area 30 or stat load area 32.
Preferably the cartridge 10 `includes a key 18 which is used
to align or orient the cartridge 10 in the gripper arm of a
robot (described in more detail below). A pipette robot 34
(discussed in more detail below) includes a gripper which
grasps the cartridge 10 from the load or stat area and
transports the cartridge 10 to an image capture area 42. The
image capture area 42 may include means for taking an image
of tray labeling information, such as barcode or optical ~
character recognition (OCR) type information. This -
information may be used to determine the desired assay or
assays for the particular cartridge which is to be analyzed,
and to record any sample or patient identification
information. The information may then be stored in a
database for subsequent management tasks. The image robot
can move the cartridge past the image capture area or a
` dedicated reader from the load area 30 or stat load area 32
so that the barcode can be read by the instrument.
The apparatus includes microcomputer and electronic
circuitry 44 which will schedule the operations required to
complete the desired assays after the assay requirements have
been identified in a mann~r known in the art.
Preferably, the apparatus also includes a user
interface 48 which may be used by the operator to manually
enter information into the microcomputer memory or to
download such information via a serial communications
interface or read such information from a removable magnetic
device.
AS illustrated in Figure 4, the apparatus also
includes a container for buffer 52, a power supply 41, a
sample pump 50 and may optionally include a wash pump 54.
- The apparatus or instrument illustrated in Figures 3
and 4 is more clearly shown as a working instrument in
,~ . .
, ~ .
W092/22802 PCT/U$92/05103
210994~
17
Figures 15 and 16. Figures 15 and 16 show the instrument
with major components identified as in Figures 3 and 4. The
front perspective view of Figure 15 and the top view of ~;;
Figure 16 are both presented with the covers remaved, thus
allowing views of the components in actual working
relationships rather than simple box diagram presentation as
in Figures 3 and 4.
The pipette robot 34 and the image robot 40 may be
any suitable three axis robot. Figures 5 and 18 illustrate
two different views of a presently used embodiment. The -
three axis robot comprises three stepper motors 201, 202, and
204 which cooperate with respective translating screws to
move a gripper arm 56 to a desired position. A brief
description of the movement assembly in the X-axis is given
here. It will be recognized by those skilled in the art,~
that the movement in the Y-axis and Z-axis will be performed
in a similar fashion.
The x-axis movement assembly comprises the stepper
motor 204 which is connected to a translating screw 208 to
provîde translational motion of a platform 203 which supports
the remaining robot assembly. Guide rails 210 and ~-;
cooperating linear bearings 206 are provided to stabilize the
trans-lational movement in the X-direction. Switches 212 are -~
provided to determine the position and to control
translational movement in the X-direction.
In one embodiment, the normal working stroke of the
X-axis and the Z-axis will be 7.75 inches while the working
stroke in the Y-axis will be 9.25 inches. Each axis would
preferably be capable of positioning with a minimum accuracy
of +/- 0.003 inches over the entire length of travel. The
assembled three axis robot will preferably be capable of -
positioning with a minimum accuracy of +/- 0.005 inches over
the entire travel of each axis. A minimum resolution of
0.001 inches per 1.8 degree step input (200 steps/rev.)is --
preferable for each axis. Each axis will be driven by a
W092/22802 PCT/US92/05103
~9~Q-~
~ 18
200 step/rev., 4 phase, 8 wire stepper motor. Each axis will
be capable of translating at a maximum velocity of 5.0
inches/sec. and be capable of translational accelerations for
each axis of 50.0 inches/sec./sec. and a maximum
translational deceleration, for each axis, of 50.0 inches/
sec./sec. Each stepper motor is connected to its
corresponding translating screw through a zero-backlash
coupling of the helical spring type or by direct connection.
The x-axis would have a position sensor at each end of
travel, and the Y-axis and the Z-axis shall have a position
sensor at the motor end of travel.
Suitable three axis robots may also be available from
commercial sources, for example one available as Model
No. 105073P-20E from DAEDAL (Harrison City, PA).
As illustrated, three axis robots 34, 40 include a
gripper arm 56. Referring to Figure 6, the gripper arm 56
includes a base member 58 which is attached to the respective
robot. The base member 58 is in turn attached to an angled
member 59 which is in turn attached to a jaw assembly.
- The gripper jaw assembly includes a fixed jaw 60 and
a spring-loaded jaw 62. The gripper arm 56 is configured
such that the jaws 60 and 62 are disposed perpendicular to
the axis of the base arm 58. Each of the gripping ends of
jaws 60 and 62 is angled to facilitate the gripping of a
cartridge 10.
Notches 64 and 66 are provided on gripper jaws 60 and
62, respectively. The notches 64 and 66 advantageously
engage ribs 27 on the cartridge 10 to grip and align the
cartridge 10.
During a gripping operation, the cartridge is
centered between the gripper jaws 60 and 62. As the arm 56
is moved along the Y-axis toward the cartridge 10, the ribs
27 engage the inner surface of each of the oripper jaws 60
and 62~ thereby slightly opening the spring~loaded gripper
jaw 62. The gripper arm 56 is advanced in the Y-direction
W092/22802 PCT/US92/0~103
19 210994~ `
toward the cartridge l0 until the ribs 27 engage the -
notches 64 and 66. When the ribs 27 have moved into the
notches 64 and 66, the spring-loaded gripper jaw 62 moves
back to its unbiased position.
Advantageously, sensors 68 are provided to detect the ~-
alignment of spring-loaded gripper jaw 62. The sensors 68
will determine if the gripper jaw 62 is in the unbiased
position when the cartridge l0 is inserted. This provides an
arrangement to detect whether or not the cartridge l0 is
properly positioned in the gripper arm before further
processing. Suitable detectors are slotted optical switches -
sold under Model No. OPB99OP5l such as those available from
OPTEK (Carlson, Texas). ~
In order to release the cartridge l0 from the -
gripping jaw assembly, the cartridge l0 includes a lip
portion which extends downwardly from the gripper jaw
assembly. The lip portion (not shown) may be, for example a
lip extending downwardly from one side edge of the
cartridge l0 such as the side indicated by arrow 20. This
lip portion is adapted to engage a fixed ledge (not shown) as
the gripper arm 56 is moved away from the cartridge l0 along
the Y-axis, the ledge and lip portion cooperate to release
the cartridge l0 from the gripper jaw assembly.
The carrier l0 is then transported to a closed loop
pipette area 36 where aspirating, mixing, dispensing, washing
and/or particle separation operations are performed based on
prestored information concerning the assay (discussed in more
detail below). The pipette area preferably includes a magnet
which is positioned near to the side or below the reaction
wells l6 during particle separation and washing procedures. -
The image robot 40 or the pipette robot 34 then
places the cartridge into an incubation transfer area 38.
The cartridge l0 is held in the incubation area 38 for a
predetermined incubation time period sufficient for the
required reactions to occur. The incubation area 30 is
W092/22802 PCT/US92/05103
~99~ 20
preferably accessible from both the pipette robot 34 side of
the device as well as from the side of an image robot 40.
After the pipette robot 34 has moved a cartridge l0 into the
incubation area 38 it is then free to begin processing
another cartridge. Preferab~y', the robots 34 and 40 have
random access capabilities to allow return of cartridge l0
from the incubation area 38 to the pipette area 36 or other
work areas as many times as needed, and as dictated by the
prestored requirements of each assay.
Once all pipetting and incubation area processing has
been completed for a specific cartridge l0, the image robot
40 then grabs the cartridge from either the
incubation/transfer area 38. The image robot 40 then
transports the cartridge l0 to an image capture area 42
where image information is determined and converted into
electrical information for further signal processing by the
microcomputer and electronic circuitry 44 (described in more
detailed below). Once all required images have been captured
for a specific cartridge l0, the image robot 40 transports
the cartridge l0 to an unload area 46.
The pipette robot 34 and the image robot 40
preferably operate independently of each other thereby
allowing for parallel processing of the cartridges l0.
Although the instrument, as described, has been
designed to run the HLA and PRA assays required for the
transplant diagnostics market, it should be appreciated that
the instrument is a very flexible automated pipettor and
reader which could accon~odate other test methodologies.
Some of the benefits of the instrument are discussed below.
Many alternate disposable configurations may be
accommodated. In a cartridge with an exterior size of 5.5~l.
x 3.3"w. x 0.55~h., many sizes and combinations of sample
wells, reaction wells, mixing wells, wash wells and reagent
wells can be designed into a disposable. Practically the
W092~22802 PCT/US9~/05103
21 21~99~ :
only limitation is that the disposable must be readable from
the bottom and illuminated from either the top or bottom.
Assay protocols and procedures may be varied and
mixed. That is any number of pipette steps, incubation steps
and read steps can be accomplished in any order. The
duration of the incubation steps may also be varied. The one
limitation to ~ixing assay protocols is tha~ throughput
usually is adversely affected.
The range of pipetting volumes is wide. Testing to
date has included 0.5 ~l to over 50 ~l per dispense. Due to
the small diameter of the dispense probe (0.010~), which is
required for the 0.5 ~1 dispenses, dispenses of 100 ~l and up
require excessive amounts of time. This limitation can be
overcome by replacing the dispense probe with a probe of the
optimum diameter for the volumes being dispensed. The means
of mixing on the instrument are throu~h aspiration/dispensing
of fluidics or mixing by movement of the disposable by the
robot.
Disposables which have had manually prepared
sample(s) placed in the a~propriate well(s) are placed in the
load station by the instrument operator. Up to ten
disposables may be loaded into the load station at one time. -
The station actuates to separate the bottom disposable from
the stack of disposables in the load station. ~y removing
the bottom most disposable it is ensured that the disposables
are run in the order in which they were placed into the
instrument. The pipette robot moves to the load station and
grasps the disposable in a gripper. The key on the
disposable aligns the cartridge in the gripper. Sensors
located in the gripper indicate to the computer controller
that a disposable has been properly located in the gripper.
The pipette robot then removes the disposable from the load
station and moves it to the barcode reader.
- The barcode reader is a fixed, LED type reader. The
pipette robot moves the disposable to scan the barcode label,
W O 92/22802 PC~r/US92/05103
~ ~ ~ 22
which is located on the end of the disposable, past the
barcode reader. Upon successful reading of the barcode
label, the computer controller identifies the disposable type
and schedules the instrument activities required to process
that disposable. Alternately, the imaging system can be
utilized for this process.
The pipette robot is a three-axis linear robot which
can move the disposable throughout the pipetting side of the
instrument. The pipette robot can access the load, barcode
reader, fluidics and incubator. If necessary, the pipette
robot can access the reader though reading is typically
accomplished using the read robot. The pipette robot does
not access the unload.
The fluidics system is capable of aspirating and
dispensing fluids, performing magnetic separations, probe
washing and liquid level sensing. In operation, the dispense
probe is fixed and the pipette robot moves the disposable to
the probe. An actuator is used to move a magnet into place
for magnetic separations. Probe washing is accomplished in a
probe wash well which is part of the disposable and all
liquid waste is carried out of the instrument with the
disposable. The liquid level sense is an RF ( radio
frequency~ system using the dispense probe as a transmitter
and having a receiving antenna disposed below the disposable
and in line with the dispense probe. In some cases, the
liquid level sense may also be utilized for dispense
verification.
The incubator is heated and controlled to 34C. +/~
2C. Up to ten disposables may be stored in the incubator at
any time. ;Either robot may place or retrieve a disposablç in
the incubator. "
- The read robot is identical to the pipette robot
except that the ~ripper is reversed. The read robot can
access the incubator, reader and unload. The read robot does
not access the load, barcode reader or fluidics. -
W092/22802 PCT/US92/05103
~10,99~ ~
23
The reader on the instrument is essentially an
inverted microscope having a CCD camera as a detector. A
motorized objective turret allows the selection of one of
four magnifications for the assay being read. Magnifications
in the range of lX to l0X have been tested. A quartz halogen
lamp in conjunction with a fluorescence filter pack provides
the foreground illumination used in the fluorescence assays
and a LED provides background illumination for the
agglutination assays. A motorized filter turret allows the
selection of one of six filter packs for a fluorescence assay
or no filter pack for an agglutination assay.
Each reaction well is automatically positioned and
focused prior to image analysis. Image analysis for the HLA
assays involves fluorescence imaging of stained white blood
cells onto the CCD camera. Image analysis algorithms are
used to count and size the cells in each image. For the -
agglutination assays, the agglutination pattern in the
reaction well b~ttom is imaged onto the CCD camera. The
result is then derived from the intensity profile across a
diameter of the image.
Upon completion and result determination of an assay,
the read robot moves the disposable to the unload. The
unload then actuates to add the disposable to the bottom of
the used disposable stack. ~p to seventeen disposables may
be stacked in the unload at any time. The load and unload
capacities provide up to four hours of walk-away automation `
time.
One area that the instrument especially excels in is
the ability to test one sample against many reagents. In the
Class 1 HLA assay, a single sample is tested against up to
200 different antigens. The instrument layout is optimized
to allow this type of testing to be accomplished in a minimum
amount of time. This optimization could apply equally well
to allergy testing, microbial susceptibility testing or any
W092~22802 9~. PCT/USg2/0~103
24
other type of testing which requires one sample to be tested
against many reagents.
Image processing and data management are also
strengths of the instrument. The use of CCD camera and image
analysis allows reactions tO be scored based on intensity,
size, pattern or any combination thereof. Through the use of
filters, or possibly the use of a color camera, color may
also be used to score reactions. A standard PC as a human
interface workstation provides an effective means of data
collection, analysis and management. The human interface
workstation may also serve as an interface to other lab
instruments or to an LIS (Lab Information System).
pIPET ROBOT. The pipet robot is a three-axis x-Y-z
robot which is used to move trays through the pipetting -
section of the instrument. Each axis is driven by a stepper
motor and a translating screw. Each axis also employs a home `~
sensor to detect the home position of that axis. The X-axis -~
is defined as left to right in the instrument and home for `-;
the X-axis is to the left. The Y-axis is defined as front to
back in the instrument and home for the Y-axis is to the
back. The Z-axis is defined as top to bottom in the
instrument and h,ome for the Z-axis is to the bottom. ~;
Attached to the Z-axis of both the pipet and read
robots is a passive gripper which is used to pick-up and hold ~;~
trays. The gripper has two sensors which detect the presence
and placement of a tray in the gripper. The no tray sensor
detects that there is not a tray in the gripper. The
misplaced tray sensor detects that a tray is in the gripper
but misplaced.
In order to detect step loss, all long moves be~in
and end with all three axes in the home position. From the
home position, the pipet robot can move to the load, the
pipettor, the incubator and the reader.
~ EAD ROBOT. The read robot is a three axis x-Y-z
robot which is used to move trays through the read section of
W0~2/22802 PCT/~S92/05103
21099~
the instrument. Each axis is driven by a stepper motor and a
translating screw. Each axis also employs a home sensor to
detect the home position of that axis. The X-axis is defined
as left to right in the instrument and home for the Y-axis is
to the back. The Z-axis is defined as top to bottom in the
instrument and home for the Z-axis is to the bottom.
In order to detect step loss, all long moves begin
and end with all three axes in the home position. From the
home position, the read robot can move to the incubator, the
reader and the unload. ~-
REa~E~. The reader is essentially an inverted ~-
microscope which images onto a CCD camera. Through the use
of an objective change wheel, a filter change wheel and two
light sources, the reader can be configured as a fluorescence ;
reader (for antigen assay) or an agglutination reader (for
antibody test).
The objective change wheel and the filter change ~-~
wheel are each driven by a stepper motor through a single set
of gears. A 5.76:l reduction is achieved by using a large
SST gear at the perimeter of each wheel and a smaller ~
urethane gear attached to the stepper motor. The center -
distance between the wheel and the motor is controlled to
provide a slight interference between the gears, thus,
producing a zero backlash drive.
The foreground illumination source is a quartæ
halogen lamp having an integral dichroic reflector. A
condenser lens is used to focus the illumination at the -
object plane. A normally closed, solenoid operated, shutter
blocks the fcreground illumination when not in use so that
the lamp may be left on continuously. A fan is used to cool
this lamp and the hot air is ducted directly out of the
instrument. The lamp is controlled by a constant voltage
drive. No intensity control is provided.
The background illumination source is a LED. The LED
is controlled by a constant voltage drive which is switched
W O 92/22802 PC~r/US92/05103
99 26
on when the LED is in use and off when not used.
For reading the antigen assay, the objective changer
is moved to select the 10x objective and the filter changer
is moved to select the first fluorescence filter pack ~red).
The LED is turned on to produce an image of the well which
has a high contrast between the well sides and bottom. The
auto-positioning and auto-focusing is now accomplished
(described below). The LED is now turned off and the ~
foreground illumination shutter is opened to image the dead -
cells (red) onto the camera and the first read image is --
captured. The filter changer is then moved to select the
second fluorescence filter pack (green) and the live cells
(green) are imaged onto the camera and the second read image
is captured. The foreground illumination shutter is closed
to complete the reading of one well. This process is ~
repeated for all wells. ~;
For reading the antibody assay (in the HLA mode), the
objective changer and the filter changer are moved to select
the proper magnification and filter set (magnification varies
from 1 - 4x depending upon well size). The backlight is
turned on to image the agglutination pattern onto the camera.
If needed, auto-positioning and auto-focusing is accomplished
prior to capturing the read image. This is then repeated for
all wells.
~ 5E$~Q~. The pipettor holds a fixed pipet tip which
also serves as a transmitting antenna for the li~uid level
sense system. A lower unit is actuated by a linear step
motor. This lower unit consists of a receiving antenna which
is spring loaded in the lower unit and a magnet arm for use
in the magnetic separation step. A home sensor detects the
home or down position of the lower unit.
Operation begins with the lower unit in the home
~down) position. This allows a tray to be placed between the
probe and the lower unit. The motor is then actuated to move
W O 92/22802 P ~ /US92/05103 :;
27 21099~
the lower unit to the proper height for the operation
desired.
~ . The pump is a dual syringe unit having a
smaller sample syringe and a larger buffer syringe. The two
syringes are connected to a single manifold having an inlet ~;
port and a discharge port. The inlet port is valve
controlled. In the closed position the valve connects the
buffer syringe to the manifold and closes the inlet port and
in the open position the valve connects the buffer syringe to
the buffer bottle and disconnects the buffer syringe from the
manifold. The discharge port is connected directly to the -~
dispense tip in the pipettor assembly. --
The syringes are actuated by a rack and pinion drive -
which is driven, via belt, from a stepper motor. The valve
is direct connected to a stepper motor.
Operation begins with the syringes in the hometup)
position and the valve in the home (closed) position. To
aspirate and dispense from the dispense tip, the valve
remains closed and after the tip has been placed in the fluid
the syringe is then moved upward (towards home) the
appropriate distance for the dispense requ~red.
To aspirate from the buffer bottle and then~dispense
out the dispense tip, the valve is first opened and then ~he
buffer syringe is moved downward (away from home), thus,
aspirating sample from the buffer bottle. The valve is then
closed and the buffer syringe is then moved upward (towards
home) the appropriate distance for the dispense required.
INCUBATOR. The incubator is a controlled temperature
storage location for trays being incubated. Up to ten trays
may be in the incuba~or at one time.
The conductive incubator is machined from a large
block of aluminum. The high thermal conductivity of the
aluminum minimizes the temperature differences from one area
of the incubator to another. The large mass of the incubator
W O 92/22802 ~ PCT/US92/05103
28
provides a large thermal mass to minimize temperature
fluctuations over time.
One of three heater configurations may be used. In
the first configuration, two 3~x5u pad heaters are attached
to the right and left sides of the incubator and the RTD
(Resistive Thermal Device) sensor is located in the center. ~-
Fore the second configuration, the heater is a rod heater
inserted vertically in the center of the incubator and the
RTD sensor is surface mounted on the side. The third
configuration uses a 2u wide heater wrapped around the top,
bottom and right and left sides and a RTD sensor in the
center.
Temperature control is provided by a stand-alone
controller which may communicate with the instrument
controller via serial link.
LQa~. The load station serves to accept a stack of
up to ten trays from an operator and present one tray at a
time, in a FIFO order, to the pipet robot. The load platform
assembly is actuated by a linear step motor. A load platform
assembly home sensor detects the home or up position of the
load platform assembly and a load platform extended sensor
detects the extended or down position. A tray-in-load sensor
detects the presence of at least one tray in the load
station. A door sensor detects whether the load/unload door
is open or closed.
From one to ten trays may be stacked on the load
platform assembly. As the load platform assembly is lowered,
cam-actuated stops move in to hold all trays but the lowest,
and continued lowering separates the bottom tray from the
stack for pickup by the pipet robot. After the bottom tray
is removed, the load platform assembly mo~es upward to hold
the remaining trays as the cam-actuated stops move away.
Below the load station are two fixed STAT slots are
for STAT trays. Trays placed in either of the STAT slots are -~
to be processed before trays in the load station. Tray-in-
...
. .
W092/22802 PCT/~'S92/05103 `~
2 1 (t ~ ~`3 ~ J ~.
STAT sensors (2) detect the presence of a tray in a STAT
slot. The pipet robot may remove trays directly from a STAT
slot.
Attached to the load station is a fixed, non-contact
bar-code reader. After a tray has been removed from the load
or STAT slot, the robot moves the tray to pass the bar-code
label on the end of the tray by the bar-code reader, thus,
reading the tray ID.
A solenoid actuated door lock is used to lock the
load/unload door during operation of the load or unload
station. This is to protect the operator from the load
mechanism.
UNLOA~. The unload receives used trays from the read
robot and stacks them into a stack of up to seventeen trays
for removal by the operator. The unload platform assembly is
actuated by a linear step motor. An unload platform home
sensor detects the home or up position of the unload platform
assembly and an unload platform assembly extended sensor
detects the extended or down position; An unload 75% full
sensor detects the presence of at least thirteen trays in the
unload station. An unload full sensor detects the presence
of seventeen trays in the unload station. An unload door
sensor detects whether the unload door is open or closed.
The unload remains in the home position until a used
tray is ready to be unloaded from the instrument. As the
read robot moves toward the unload with a used tray the
unload platform assembly actuator moves the unload pl~tform
assembly from home to the extended position. Trays already
in the unload are held in place above the unload platform by
spring-loaded stops. The read robot places the tray on the
unload platform and releases it or is disengaged from the
tray via release features in the unload assembly. The unload
platform assembly is then returned to the home position. As
the unload platform assembly moves upward, the tray on the
W092/22802 PCT/US92/051~3
~ 30
unload platform forces the spring-loaded stops open and adds
the tray to the previous stack.
A solenoid actuated door lock is used to lock the
load~unload door during operation of the load or unload
station. This is to protect the operator from the unload
mechanism.
LIOUID LE~IEL SENSING A~ LIQIlID DI~il?ENSING
As has been discussed above, the reaction wells 16 of
the cartridge 10 contain micro-volumes of the antisera
covered by a small micro-volume (approximately 2-3 ~l) of
oil. It is thus imperative that the liquid dispensing and
liquid level sensing system used to dispense the samples to
the reaction wells 16 be capable of detecting when the
dispensing probe is inserted below the top surface of the oil
(See Fig. 2).
In order to assure that a droplet of the sample (or
other fluid being dispensed) has in fact been deposited into
each reaction well 16, the apparatus preferably has the
ability to detect when a droplet ha,s been formed on the
dispensing probe, when the formed droplet has separated from
the dispensing probe, and when the dispensing probe has been
inserted into either the oil or the serum. In the presently
preferred mode of operation, the droplet is formed after the
dispensing probe has been inserted into the oil or serum such
that as the probe is pulled out of the liquid, the droplet of
~he sample will be ~wiped off~ of the dispensing probe. This
technique combined with a closed loop system which uses the
information regarding droplet formations and separations
assures that a sample has in fact been deposited in each
reaction well.
It will be, however, recognized by ~hose skilled in
this art that other modes of droplet formation and dispensing -
are possible. For example, the droplet may be formed on the
W092/22802 PCT/US92/05103
2109.9~ I
31
dispensing probe in air before the dispensing probe is
inserted into the liquid reagents.
An embodiment of the liquid dispensing system of the
present invention is illustrated schematically in Figure 7.
The liquid dispensing system includes a dispensing probe 70
for dispensing the liquid. As discussed above, the three
axis robot can move the cartridge 10 in any of the X, Y, or Z
directions by the use of stepper motors to position the
dispensing probe 70 relative to a reaction well 16.
A sine or square wave generator (oscillator) 74
generates a radio-frequency (RF~ signal which is amplified~by
an amplifier 76 and transmitted to the dispensing probe 70.
A conductive element 72 is provided to receive the RF signals -
from the dispensing probe 70. The conductive element 72 is
electrically connected to an amplifier 78. The amplifier 78
amplifies the signal received from the conductive element 72
for further processing as more fully described below. In
another embodiment, the conductive element 72 may be the
magnet used in the particle separation process and working
procedure described below.
The cartridge lO is positioned such that a reaction
well 16 is approximately centered under the dispensing
probe 70~ This positioning is achieved by initially training
the robot. In a preferred embodiment, the dispensing probe
70 is about 3 mm above the bottom of the reaction well 16.
In other embodiments the dispensing probe 70 may be
positioned at other locations. For example, it may be
disposed at the edge or rim of the reaction well such that
the droplet will be dispensed on the surface of the wall of
the well 16.
After the reaction well 16 is properly positioned,
the monitoring of the signal from the oscillator 74 is
initiated. The RF signal passes through the fluids inside
the reaction well 16 and through the container and is
received by the conductive element 72. The signal received
W092/22802 PCT/US92/05103
~ 32
by the condu ~ ive element 72 is amplified and filtered by an
amplifier and filter 78. The signal is then rectified,
preferably by a full wave rectifier 80, such that the output
signal is a DC value corresponding to the amplitude of the
received RF signal. The DC signal is then amplified by an
amplifier 82 and converted to a digital signal by an analog
to digital (~/D) converter 84.
Referring now to Figure 8, an embodiment of the
control system for the liquid dispensing system is described.
The DC signal which has been rectified and filtered may
optionally be applied to a sample and hold circuit 86. The
sam~le mode of the sample and hold circuit 86 occurs each
time a pulse from a stepper motor control unit 88 is ~:
generated, thus providing synchronization between the DC
signal value and the relative position of the sample
cartridge lO. The DC signal is locked on the falling edge of
the pulse from the stepper motor control unit 88 and a
logical signal is sent to a digitizer 90. The digitizer 90 :`
is preferably a twelve bit ADC. The DC signal digitized
value is then stored and analyzed by the microcomputer 44. -
Alternatively, the system may be implemented without ~-
the sample and hold circuit 86 and the synchronization signal
provided directly from the micro-computer 44. `~
The procedure described above of locking (from either
stepper motor control or a microprocessor signal), digitizing `
and analyzing the DC signal with each pulse coming from the
stepper motor control unit 88 continues until a sufficient
difference between two consecutive stepper motor steps
occurs. At this moment, the upward movement of the cartridge
lO may be stopped by a command sent to the stepper motor `
control unit 88. The relative position of the cartridge lO
is retrieved from the stepper motor control unit 88 by the
mi~rocomputer 44. If the relative position of the cartridge
lO is within a predetermined range ~which has been stored in
W092/22802 P~r/US92/05103
21099~ 1
the memory of the microcomputer 44), then the process
continues, otherwise an error condition will be reported.
After the liquid level has been identified as being
within a predetermined range, the process continues with an `
additional movement of the cartridge 10 in the same upward
direction for about 0.5 mm. During this movement, the DC
signal is continuously sampled, digitized and analyzed to
check for any unexpected conditions. At the end of this
movement, the end of the dispensing probe 70 is reasonably
assured to be inside of the oil 24 in the reaction well 16.
Next, a signal UMU from the microcomputer 44 is sent
to disable the flow of pulses synchronizing with the vertical
motion. The same signal ~M~ enables flow of the pulses
synchronizing the DC signal values with a stepper motor
driving and dispensing pump. A program command to run the
stepper motor which drives the dispensing pump for a
predetermined number of steps is issued and the DC signal
value is again sampled, digitized and analyzed by the
microcomputer 44. The process of dispensing a droplet
continues until an adequate increase in the DC signal is
encountered, or the process is tcrminated if there is no
increase or an unacceptable increases of the DC signal value.
After the droplet has been successfully produced or
dispensed, a program command is sent to the stepper motor
control unit 88 to move the cartridge 10 downward. During
this movement, the DC signal value is sampled, digitized and
analyzed by the microcomputer 44. When the tip of the
dispensing probe 70 approaches the surface of the top liquid
layer, such as the oil, the process of ~wiping-off" of the
droplet takes place and a rapid decrease in the DC signal
value is observed to confirm that the droplet has actually
been separated from the probe and dispensed into the reaction
well 16.
W092/22802 PCT/US92/05103
~99~- 34 ~
The output signal VDC from the liquid lev~l detecting
circuit of the present invention is illustrated in Figure 10.
In the example, the probe 70 was inserted into a reaction
well with reagent covered by a layer of oil and the droplet
was formed in the liquid. The section of the curve from the --
origin to the voltage labeled ~A~ corresponds to the signal
generated as the probe 70 approaches the upper surface of the
oil. The section of the curve between the voltages labeled
~A~ and NBU corresponds to the signal generated as the probe `~
70 is advanced through the layer of oil towards the reagent.
The section of the curve between the voltages labeled ~B~ and
~C~ corresponds to the formation of the droplet in the
liquid. The section of the curve which decreases in slope
.. . ~
after the voltage labeled uC~ corresponds to the signal
generated as the probe 70 is being withdrawn. The slope of
the curve continues to decrease steadily until a time TD when -
the droplet is released from the probe 70 and thus the slope
of the curve decreases sharply. -
It will be recognized that the signal illustrated in
Figure 14 may optionally be differentiated such that peaks
may be generated and detected when there is a sharp change in
slope. The differentiation may be performed by a suitable
differentiating circuit or by the microcomputer 44.
Next, the RF amplifying circuit will be described.
As shown in Figure 9, the amplifying circuit 100 is made up ~;
of two cascaded operational amplifiers 118 and 124. The
positive input terminal of the operational amplifier 118 is
connected to the conductive element 72 through resistor 111
and capacitor 110. The positive input terminal of the
operational amplifier 118 is connected to a voltage dividing
circuit formed of the resistors 112 and 113 keeping the
output working point A at 1~2 of the supply voltage 109. The
resistors 112, 113 and capacitor 110 acts as a high pass
filter to reduce circuit sensitivity to low frequency
W092/22802 PCT/US92/05103
21099~1
signals. The negative input terminal of the operational
amplifier 118 is connected to ground through the resistor 114
and capacitor 115 and is also connected to the output
terminal through the resistor 116.
A decoupling capacitor 115 allows a high AC gain of
the operational amplifier 118 with unity DC gain. The AC
gain of the operational amplifier 118 is defined by resistors
116 and 114.
The output terminal of the operational amplifier 118
is connected to ground through resistor 117 and is connected
to the input of the operational amplifier 124 through the
capacitor 119 and resistor 120. The positive input terminal
of the operational amplifier 124 is also connected to ground
through resistor 121. The negative terminal of the
operational amplifier 124 is connected to the ground through
resistor 122 and is connected to the output terminal through
the resistor 123. The gain of the operational amplifier 24
is defined by resistors 123 and 122,
Next, the full wave rectifying and filtering circuit
is explained. The rectifying circuit is connected to the
output terminal of the operational amplifier 124 through
capacitor 125. In the illustrated embodiment of Figure 9 of
the rectifying and filtering circuit 41, two operational
amplifiers 137 and 138 are connected in a generally known
configuration to various resistors, diodes and capacitor to
produce a DC signal 139.
For negative signals from the amplifying circuit 100,
the output of operational amplifier 137 is clamped to 0.7V by
a diode 128 and disconnected from the negative terminal of
the operational amplifier 138 by a diode 131. The
operational amplifier 138 functions then as an inverter with
input resistor 130 and feedback resistor 135 giving a
positive signal at the output terminal of operational
amplifier 138.
W092/22802 PCT/US~2/05103
9~
36
For positive signals from the amplifying circuit 100,
operational amplifier 137 acts as an inverter with input
resi~tor 126 and feedback resistor 132 and operational
amplifier 138 operates as a summing inverter, again giving a
positive output 139. When resistors 126, 129, 130 and 135
have the same value and resistor 132 is one-half the value of
resistor 130, circuit 101 acts as a precision full-wave ~-
rectifier. The circuit 101 becomes an averaging filter when :~
the time constant formed by resistor 135 and capacitor 134 is
much longer than the maximum period of the input voltage
which is to be averaged.
Referring now to Figure 11, one embodiment of a
square wave oscillator circuit is illustrated. The square `~
wavë oscillator circuit comprise 5 resistors 215, 216 and
218, capacitors 217 and 220 and an operational amplifier 219.
The oscillator which preferably operates at a 50 percent duty
cycle, TTL levels is connected to the capacitor 217 and
referenced to ground through resistor 215. A suitable
oscillator is the function generator available from Wavetek
as Model No. 145. The operational amplifier 21~ amplifies
the signal with a gain which is determined by the values of
resistors 215 and 216. The output of amplifier 219 is AC
coupled to the transmitting antenna through the capacitor -
220.
Next, a description is given of another embodiment of
apparatus and method according to the present invention.
This embodiment is different from the other embodiments
described above in that fluid dispensing takes place only
when another fluid with a high dielectric constant has been
detected. In the process described below, the two fluids
have similar viscosities and thus the process will cause the
two fluids to meld.
Again, the process starts with an upward movement of
the cartridge lOtafter a program command to move for a
predetermined number of steps is issued. The upward
W092/22802 PCT/US92/05103
37 21 ~ 9~q~ 1
movement continues until the oil surface is detected or end
of the upward movement is detected. Once the dispensing
probe 70 contacts the oil, the oil surface is detected and
the program may issue a command to stop upward motion. At
this time the relative position of the cartridge 10 is
checked. If the relative position in the Z direction of the
cartridge 10 is within a predetermined range (stored in a
microcomputer memory) another program command to move
cartridge 10 upward is issued. The number of steps to move
upward is now e~ual to the predetermined value and upward
movement continues until sufficient increase in the DC signal
value between two consecutive stepper motor steps exists or
when the end of the upward movement is detected. A rapid
increase in the DC signal value manifests presence of a fluid
with a dielectric constant greater than oil. The upward
motion is then stopped. The dispensing process described
above occurs. Figure 14 illustrates the signal from the
detecting circuit for this embodiment. The signal at voltage
level ~A~ represents the point where the oil surface is
detected. The signal between voltages ,~Bu and ~C" at time T
represents the dispensing process when the probe touches the
fluid on the bottom of the well. The curve between~Times Tl
and T2 represents a change in direction of the probe. At time -
T2 the droplet is "wipe-off~ when the lower surface of the oil
is reached. The signal does not decrease rapidly until the
oil surface is encountered.
OPTICS
Referring now to Figure 12, one embodiment of the
optical or imaging unit for the analyzing apparatus of the
present invention is illustrated. The optical unit
preferably includes a turret 177 containing at least two
filter blocks 171. The turret 177 is rotated by a motor 175. ~-
Each of the filter blocks 171 has an excitation filter 170,
W092/22802 P~T/US92/05103
38
emission filter 172 and a dichroic mirror 174. A light lamp
176 which is preferably a tungsten halogen lamp provides
white light. The light is passed through a condenser 173 to
condense the light before it passes through excitation filter
170 and is then reflected by a dichroic mirror 174 toward the
cartridge 10. The light is then provided to the reaction
wells 16 through a magnifying lens or objective 178.
Preferably the magnifying objective is a lOX magnifying
objective. The light is then reflected by objects within the
reaction well 16. The light reflected from the sample well
16 passes through the objective and through the dichroic
mirror 174 and then through the emission filter 172. The
light transmitted through the emission filter 172 is then
passed to a CCD element 185 of optical detector 180 where the
light is processed as discussed in more detail below. As
illustrated in Figure 12, the arrangement is similar to an
inverted microscope reading through the bottom of each
reaction well 16. As illustrated, the optical system also
preferably includes an objective turret 179 adapted to hold
at least two objectives 178. The optical system may also
optically include a back light source 181 (discussed in more
detail below).
In Figure 17, a side cross-sectional view of another -
embodiment of the optical unit is presented. The optical
unit of Figure 17 is presented with reduced overall
dimensions and shows additional elements not shown in Figure
12. For example, a CCD camera 190; a filter block turret
230; and filter block turret motor 232 are shown in addition
to the elements of Figure 12.
The filter block turrets 177 preferably have a range
of rotation of a full 360, with a radius allowing up to at
least 6 filter packs, such as filter packs available from
Nikon (Japan), to be rotated into the imaging position. The
lens block or objective turret 179 preferably also has a 360
range of rotation with a radius allowing up to at least four
W O 92/22802 PC~r/US92/05103
21 099~ i
39
standard microscope objectives, to be rotated into the
imaging position. Each turret must be capable of positioning
with a minimum o~ accuracy of ~/- about 0.003 inches over the
entire range of rotation. Each assembled optical module must
also be capable of positioning with a minimum accuracy of +/-
about 0.003 inches over the entire range of rotation of each
turret.
As illustrated, the optical module preferably
includes two direct/drive stepper motorized rotating
platforms. Preferably each axis is driven by a 400
step/rev., four phase, eight-wire stepper motor, such as one
available as Model No. PX24402DA, available from VEXTA
~Tokyo, Japan).
Each of the filter block and lens turret sub-
assemblies preferably has a position sensor at a ~homeU
rotational location such that the filter pack and lenses are
within + or - one step of the optimum optical path as
measured by the peak intensity of light into the camera with
a fluorescing test image. The sensors are preferably of the -~
non-mechanical type such as a slotted optical switch
available as Model No. OPB99OP51 from OPTEK ~Carlson, Texas).
..
For blue excitation-green emission, suitable filter
packs are commercially a~ailable. A suitable filter pack, for
example, is a B-2E Epi-fluorescence filter system
available from Nikon ~Japan~. The dichroic mirror 174
preferably is positioned at 45 to the illuminator 176 and has
a characteristic wavelength equal to about 510 nm. The ~
excitation filter main wavelength preferably is 470 nm and the -
band width is about 40 nm. The emission filter 172 has a ~
spectro- transmission range from to 520 to 560 nm. -
For the green excitation/red emission, the filter pack
is also commercially available such as a G-2A Epi-fluorescence
filter system available from Nikon~Japan).
The dichroic mirror 174 is also positioned at 45 with respect
W O 92/22802 ~ PC~r/US92/05103 :~
to the lamp 176 and has a characteristic wavelength equal to
about 480 nm. The excitation filter 170 has a main
wavelength of about 535 nm and the band width is about 50 nm.
The emission filter 172 spectro-transmission range is from
590 nm and up.
The magnifying objective 178 is also commercially
available and may be, for example, a Nikon Plan 10 DL with a
numerical aperture equal to 0.25 and a working distance of
5.2 nm. This objective lens with a large numerical aperture
is desirable to enhance the brightness of fluorescence
images.
Preferably, the lamp color temperature for the lamp
176 is at least 3000 K for the blue excitation. The lamp
light output is preferably greater than 400 lumens.
It may also be advantageous to provide a neutral
density filter (not shown) when using a combination of
microscope objectives and relay lenses. In this embodiment,
a 4.0 X perifocal magnifying objective may also be used in
conjunction with the relay lenses and neutral density filter ~
pack. A transmitting light source 181, such as an LED, may
also be provided for use in reading agglutination assays.
The optical system will preferably include
auto-focusing means for focusing the imaging. In one
embodiment which is presently contemplated, an LED 181 is ;``
used to focus on the rim of the wells. Severàl auto-focusing `~
algorithms for focusing with this technique are available in `~
the art. For example one suitable algorithm is based on the
NThreshold Gradient Magnitude SchemeU. This algorithm is -
described in a paper entitled n Implementation of Automatic
Focusing Algorithms for a Computer Vision System With Camera
ControlN, Schlag et al., Carnegie-Mellon University,
August 15, 1983 (CMU-RI-TR-83-14), which is incorporated
herein by reference.
Listed below in Table 1 are fluorophore excitation
and emission wavelengths for suitable fluorophore which may
W092/22802 PCT/US92/05103
41 21 09(~4~ ~
be used in conjunction with the apparatus and methods of the
present invention.
~L,~ 1 "
Wavelengths
FluoroDhore De~criDtion ~xcite ~mit
5(6) Carboxyfluorescein 490nm S20nm
Diacetate - (Mixed -~
isomers approx. 95%
by HPLC)
C25Hl6Og FW 460.4
Propidium Iodide - -
(approx. 95-98
by TLC)
C2~H34N4I2 FW 688.4 535nm (bound)* 602nm ~;
* - excieing at bound emission frequency
-.
~GE PROCESSING
As described above, the image processing unit used in
the apparatus and method present invention determines the
ratio of live to dead cells which have been stained with
green and red stain in each reaction well 16. The score of -
the reaction in each well is based on the percentage of dead
cells to the total number of cells. As currently practice in
the art with manual scoring, the scoring is performed using a
range of l to 8. A score of l indicates that mostly live
(green) cells which did not react with the antisera are -
present. Conversely, a score of 8 indicates that mostly dead
cells which did react with the antisera and fluoresce red are
present.
The size range of these cells of interest for HLAi
typing are from 6 to 12 microns in diameter,preferably with
lO0 to 300 cells per image. This translates into a minimum
of 9 pixel areas per cell using a 512 x 484 resolution at lOX
magnification and with bright fluorescence of some cells, a
:',; ' `:~
W092/22802 PCT/US92/OSl03
3~ 42
maximum of 81 pixel area for a single cell. The ratio of the
average fluorescing cell image to the background mean is
preferably at least 3 to 1.
AS illustrated in Figure 13, in one embodiment, the
image processing system includes a solid state charge coupled
device (CCD) camera 190. The CCD camera 190 is coupled to a
frame grabber 222. The frame grabber 222 preferably includes
an onboard arithmetic and logic processing unit. A suitable
frame grabber 222 is available from Coreco Montreal,
(Montreal, Canada~ as Model No. OC-300. Suitable software is
also available from Coreco as a FG3 software package. The
image procuring system is run by a PC computer with a display -
monitor 194. A suitable PC computer is an IsM AT Compatible
25 MHz 386 available from several commercial sources, such as
Compaq. The system includes a monitor 192 for viewing the ;~
resulting images, such as a standard RS170 image monitor. A
suitable monitor is available as Model No. VM-12016 from
Hitachi Denshi, Ltd. (Woodberry, N.Y.). Advantageously, a i
digital signal processing (DSP) card 224 is expected to
increase the system (discussed in more detail below). The
DSP card 224 increases the throughput of the frame
grabber 222 alone by a factor of 6. That is, using the frame
grabber 222 alone, processing would take at least 4 seconds
per image. With the DSP-card 224 processing is expected to
take less than 1/2 second.
Although data from the frame grabber 222 may be
transferred to the DSP card 224 via the standard AT bus, this
places a heavy load on the main microcomputer. Therefore the
DSP card 224 is preferably connected to the frame grabber 222
via a video bus (illustrated in the dotted line). This frees
the main processor for other tasks.
A CCD camera which has proved suitable for use in the
present invention is Model No. KPllO available from Hitachi
Denshi, Ltd. (Woodberry, N.Y.).
.
W O 92/22802 P ~ /US92/05103
210~9!.1 1
43
The following describes several algorithms which may
be used in the image processing stage of the present
invention. In one embodiment, the FG3 software may be used -
to control both the range/offset and live/capture operations
of the frame grabber. The range and offset may be, for
example, typically set 16 and 32 respectively, shifting the
value of zero 32~256 of full scale, and expanding 16/256 of -
the range to maximum intensity. It has been found that these
values yield the highest contrast images with the least -~
amount of noise. Once the image is focused as described m
above, the image is grabbed, then saved. From this point on,
all processing may be done completely in computer RAM, with ~-
the results displayed on either an EGA or VGA screen. ~-~
A row normalization technique may be used to
compensate for background light gradients. Each row of data
(512 points) is summed, then divided by 512 and stored as the
baseline for that row during thresholding. The total image
normalization ~row and column) at any point is the average of
the FOW mean and the column mean at that point subtracted
from the raw value at that point. To prevent any negative
values, this may be implemented here by adding the (row) mean
to a manually entered threshold.
A nearest neighbor filter convolution technique may
be used to eliminate small ~salt and pepper~ noise from the
image. For cells which are essentially round and at least 9
pixels in area, based on the 10X magnification, 1/2~ size of
the CCD element and a 6-12 M cell size, there is no interest
in pixels that do not have neighboring pixels of greater
intensity than a given threshold.
AS will be recognized by those skilled in the art,
there are many different kernels, or weighings, for this type
of filtering. One approach which may be used will require
any pixel to have at least one other pixel either above or
below its position ~either directly or diagonally) above the
selected threshold, or the pixel value became zero. This
W092/22802 . ' PCT/US92/05103
Q~
44
eliminates all single pixel noise elements, and requires all
~surviving~ elements to be two dimensional.
A more general approach is typically a 3x3 kernel UK"
mapped over a 3x3 area of the image ~ I ", where each pixel is ;
multiplied by the weighing in the corresponding value in the
kernel. The results are summed, then divided by the total
weighing.
Once the image has been normalized and filtered using-r''.,
the normalized value as the threshold, the algorithm `~
preferably prompts for a manually selected threshold. This
is determined by looking at the color of the background and
comparing the brightest background color with the colorbar.
Each color of the color bar has a value of 16 gray scale
intensities in the original image. This value generally
assures that all background is eliminated, at the possible
expense of shrinking some weaker cells, depending on contrast
and focus. Some experimentation may be needed to yield the "
best selection with minimum data loss. For example, the
value 48 has been shown to work well with this approach.
Once all parameters have been selected, a ~reverse
fill~ algorithm may be used to scan the image. This reverse
fill algorithm scans from top left to right, and stop when
the first non-zero pixel is detected. A counter is then
preferably initialized and incremented as the search
continues on that line until a (zero) background pixel is
detected. The search then moves back to the first pixel,
down one row, and searches to the left for the first
background pixel. Since prior filtering has guaranteed that
all elements are two-dimensional, ~his method is acceptable.
When the left-most non-zero pixel has been detected, the
counter again is incremented until the right-most pixel has
been reached. This process continues for each succeeding row
until there are no further pixels below the last row checked.
This approach works well as long as the elements are
more or less round, as are cells in the HLA assay. However,
W 0 92/22802 P ~ /US92/OStO3 ~
~ 1 0 ~99 4 ~
;~
if cell clusters or other non-round elements are in the
image, this version of the algorithm may have some
shortcomings, especially in a horizontal large and small
~dumbbell~ type of element, where the large element on the
left is properly sized except for a center row, but the right
element will be split in half. Although these and other
similar errors are possible, cell sizing and subsequent
counting has been found to yield scoring comparable to human
readings.
As each pixel is counted, its color is changed to the
bright value by adding 8 to the selected binary ~olor. Once
the processing of the element is completed, its size is
compared to the selected range. If the cell falls within
that range, the process is repeated, changing the color to
bright white ~color-lS). Raster scannin~ then continues
looking for the start of the next element until the entire
image has been searched.
Although this technique is suitable, it is very time
consuming, and filling time is added to border detection
time, causing even more overhead.
The above-described algorithms may be used on a
system with either a VGA or EGA display card. I f an EGA
display card is used some modifications may be necessary
since an EGA display card has 640 x 350 pixel by 16 color
resolution and the images grabbed are 512 x 484 pixels by 256
gray scale. The wide variation between the aspect ratios
will distort the cells to appear vertically elongated rather
than round. This may be solved by duplicating each pixel
twice in the x-axis, giving a viewing window of 320 x 350, or
nearly a one to one aspect ratio. The gray scale intensities
may shifted to the right 4 bits, or divided by 16, and then `-
mapped onto the 16 available colors. If desired, this
pseudo-color mapping may also be used in a Video Graphics
Adaptor ~VGA) where the available 640 x 480 resolution no
W092~22802 PCT/US92/05103
~ 46
longer presents an aspect ratio problem, and the full raw ;
image may be displayed.
In another embodiment, a ucontour feature extraction~
algorithm is used. ~here are two primary differences between
the "reverse-fill~ algorithm and the ~contour feature
extractionH approach. soth scan the image from top left to
right for the first non-zero element. The contour algorithm
then creates a vector map of the perimeter of the element by
searching counter-clockwise for adjacent, unhighlighted ~--
pixels until the contouring is completed. The size of the
element is then calculated from the vector map.
This technique, however, also highlights only the
perimeter of each element, rather than ever~ pixel in each
element. This, combined with processing in the frame grabber
222 rather than disk swapping of raw image data, and the
ability to perform a full-frame manually selected threshold
binariæation while executing the contour sizing/counting
algorithm greatly improve throughput and eliminate errors due
to element shape. ~he contour feature extraction algorithm
works well with an even background, high contrast image. The
algorithm, however, requires manual selection of threshold,
and does not take into account any background light gradient
or other filtering, all of which are desirable for automated
scoring.
In another embodiment, the frame grabber 222 is used
for real time image averaging. This technique sums a
selected number of frames of image data on the fly, keeping
the intermediate results in the second frame buffer. It has
been found that, for images of interest in assay procedures,
averaging two to four frames yields a substantial improvement
in signal to noise (cells to background) allowing these
images to be used without further filtering. This
dramatically increases throughput without adding processing
overhead to the main computer.
It is also desirable in aueomated scoring to have the
W092/22802 PCT/US92/05103 ~
2109'~ !
47
ability to perform localized auto-thresholding and
binarization within windows of the image. This may be
performed using software available from Coreco by performing
statistical analysis on a window of user-specified size, for
example 32 x 32 pixels, and deciding whether any cells exist
in the window by looking at the peaks of the histogram of the
window. If only one peak exists, than this is assumed to be ~-
the background peak, and no cells are in that region. If two
peaks are detected, than a threshold is selected by a user-
selectable percent distance between the background and
foreground peaks, and this value is used to binarize the
window. From here, the contour sizing/counting algorithm
described above may be used to complete the autoscoring of
the reaction wells 16.
In the most preferred embodiment, the DSP card 224 is
used to perform high speed auto-thresholding and ~`
binarization. The DSP card 224 preferably includes a
processor with a parallel high speed multiplier and adder and
separate instruction and data busses.
As discussed briefly above, in one embodiment the
frame grabber 222 captures the image and transfers them
across the A~r main computer bus in small blocks to a DSP
input buffer. As the DSP receives the data, it performs all
operations for determining the threshold automatically,
binarizes the image, and compresses the elements to be sized
and counted. As processing of each element is completed, the ~;~
results are placed in the DSP output buffer. From there, the
final sizing and counting are performed by the main computer.
More preferably, the data is transferred directly
from the frame grabber 222 via a video bus. This frees the
main computer for other tasks and takes full advantage of the
multi-processor configuration.
,~ .
.:
; ..
W092/22802 PCT/US92/05103
~ 48
,,~,9
AUTO-POSITI~ ~ ALGORITHMS
Two different algorithms have been investigated.
Both of the methods have been tested with positive results.
Method #l:
The objective of this method is to determine the
location of the well within the image by locating the edge of
the well within the image by locating the edge of the well
and then its center.
Software obtains a profile or line of pixel values -
from each side of the image. In Figure l9, these lines
correspond to the profiles of AB, BC, CD, and DA. The -
profiles for the image in Figure l9 are shown in Figure 20.
In the BC profile, the left edge of the well is indicated by
the black-to-white transition while the right edge is
represented by the white-to-black transition.
When a profile is analyzed individually, it may be
represented by one of four possibilities. A profile is
defined as a Type l if all of its pixels have a Uwhiteu
value. A profile is declared a Type 2 if all of its pixels
contain two such transitions.
Type l - all white pixels
Type 2 - all black pixels
Type 3 - one tr~nsition (white-to-black OR
black-to-white)
Type 4 - two transitions (white-to-black and
black-to-white OR black-to-white
and white-to-black)
~ fter each profile is assigned a type, the types are
analyzed collectively.~ The~set of profile types determine
the orientation of the object in the field of view. For
example, Figure 21 shows the different orientations of the
well if the profiles had a 1-3-2-3 ordering. Figure 22 shows
the well orientations for a 4-2-2-2 ordering. The
configu~ations of a 1-1-3-3 ordering is shown in Figure 23.
'~
W092/22802 PCT/US92/05103
49 2 1 0~J~.Ia l
Figure 24 shows the images corresponding to a 2-2-3-3
ordering of the profiles. Other orientations and, therefore,
orderings are possible depending on the physical and
geometrical relationships with the image and the object of
interest, i.e., the bottom of the well.
After the orientation of the well is known, its
coordinates in the image can be calculated. Since the
physical characteristics of the well and the field of view
are known a priori, the location of the transitions within
each profile along with the wellls orientation within the
image provide sufficient information to determine the ---
coordinates of the center of the well.
.. . .
Method #2
This method bounds the image of the well to one
dimension, finds the extreme of the well in that dimension,
reposition the extreme to a known location by moving the
tray, and repeats the process. The image of the well will be
centered in the frame with only two iterations. ---
The software finds the extreme position of the well
in the x-axis. (Point A on Figure 25). This is obtained by
analyzing every,horizontal profile in the image for an edge
transition. Of all the observed edges, the software selects ~`
the edge with the smallest X coordinate. The software moves
the well so the position of the edge is centered in the
frame. Figure 26. The minimum or maximum position in the X-
axis is determined again. Because of the geometric
relationships of the well and the frame, this new position
will represent the extreme position in the x-axis. (Point B
in Figure 26). The well is move to locate the extreme
position at a predetermined coordinate which will ensure that
the well is centered in the frame.
~` .
WO 92/22802 PCl/US92/0~103
9~t
AUTO-FO~US ALGORITHM
The purpose of the auto-focusing function is to
determine the maximum sharpness of the image. The basic
operation is to capture an image, measure the sharpness,
calculate the displacement in the z-axis to the optimal focal
point, and move the tray to the new position.
The following steps describe the auto-focus
procedure:
1. Capture an image.
2. Create a region of interest (ROI) along the edge
of the well. The ROI will constrain the area which the
image processing is performed and reduce the time required
for the computations. Figure 28 shows a region of
interest superimposed on an image.
3. Execute a Sobel edge filter on the region of
interest. This filter is a common image processing
function which gives an estimate of the magnitude of the
intensity gradient. Other filters such as the vertical
and horizontal edges could be utilized.
4. Calculate a histogram on the region of interest.
Determine a threshold for the histogram. To date, the
value for the threshold is determined empirically.
Additional research will lead to a dynamic threshold which
is calculated for each image. Figure 29 shows a typical
histogram and threshold for ROI.
5. Sum the number of pixels which have a value
between the threshold and the maximum limit. The sum is a
measure of the focus quality and will change as the d~gree
of focus changes.
6. Once the focus quality measurement is known,~ the
software compares it to previous measurements and
calculates a displacement from the optical focal point.
The tray is moved to this position and the steps are
repeated until the focus quality is maximized.
W092/22802 PCT/US92/05103
51 2107~9~ ~
CELL COUNTING ALGORITH~
The cell counting algorithm determines the number of
cells present in an image. -
The steps for the cell counting procedure is
described below:
l. Capture an image.
2. Calculate the histogram of the image.
3. Calculate the threshold. Ideally, the value of
the threshold would be set at location on the histogram as
shown in Figure 30. To find the threshold:
a. Average the histogram and calculate the
first derivative.
b. Average the first derivative and calculate
the second and third derivatives. -
c. Searching from low to high intensity, find
the intensity level where the values for -
the second and third order derivatives are
between 0 and l. This will ensure an area
on the histogram void of abrupt changes.
- d. Starting at the intensity level found in -~
Step C, and searching from high to low
intensity, find the intensity level where
the third order derivative changes from a
negati~e value to a positive value. This
value is the threshold and indicates the
di~ision of the background and foreground.
4. Scan the image for pixels with values equal to
or greater than the threshold value. When a pixel is
observed, contour the object with an edge tracking
algorithm. Calculate the area for the object.
5. Compare the area of the object to the maximum
and minimum limits for the area of a cell. If the
objectls area is within the range, classify it as a cell
and remove it from the image.
W092/22802 PCT/US92/05103
~9g Q~ 52
6. Repeat steps 4 and 5 until all of the pixels in
the image have been scanned.
7. Objects which exceed the maximum area limit may
actually be multiple cells in close proximity and,
therefore, must be considered~ To address these objects,
a de-clumping or decomposing algorithm has been developed.
The cells have a positive intensity gradient extending
from the perimeter to center, i.e., the center of the cell
appears brighter than the edge. Figure 3l shows a typical
grayscale contour of the two cells with a threshold value
of less than 153. If the threshold is set to a value
lower than the outmost region, the two cells would appear
as a single object. If the threshold is increased, the
cells would decrease in size and eventually appear as two
separate objects. Figure 31 shows the two cells with a
threshold set between 180 and 210.
To achieve the de-clumping effect, the current
threshold is increased a given amount and steps 4-6 are
performed. The cycle is repeated until certain conditions
are met, for example, no objects are observed or the number
of iteration is equal to set value such as five. Figure 32
shows the multi~le thresholds calculated during this process.
AGGLUTINATION I;)ETECTIQN ~ES~RI PI'ION
In one embodiment of the invention, the agglutination
detection of the instrument uses a CCD camera to take an
image of each well of a disposable similar to a standard 96
well microtitre plate. This image is digitized in such a
manner as to result in at least a 8x8 pixel array by 8 level
grey scale representation for each well, although 30x30 pixel
array by 256 grey levels is the minimal recommended, and
512x484 by 256 resolution or greater may also be used. These
images are shown in Fig. 33A through E, with 33A being a
strong negative, 33B being a weak negative, 33C being a weak
W092/22802 PCT/US92/05103 ~
21099~ l
53
positive, 33D being a positive, and 33E being a strong
positive reaction.
The digitized representation is then analyzed by
taking at least 1 cross-section of intensity data ( if only 1
section, this must be through the center), using low-pass
f iltering, if necessary, to eliminate noise, and a simple
data replacement technique to remove rim information. This
rim correction simply takes data known to be non-rim data by
pre-calibrated position, but be close to a rim, and extend
this value to its intensity transitions not caused by the
result of chemical reactions. These processed intensities ~-
are shown in the top row of graphs in Fig. 34, with the X-
axis being pixel positional information, and the Y-axis grey
scale intensity.
Although it is possible to perform pattern
recognition and image classification on intensity alone, this
technique is subject to several weaknesses, including high
positional repeatability requirements, intensity and
geometric variations caused by different cell concentrations
and pipetting inconsistencies, varyirg light sources, and
time of reaction.
For these reasons, a derivative of the intensity is
taken, and is the primary method of classification and `~
scoring of these reactions. The derivatives are shown in the
second row of graphs in Fig. 34. Note the monotonic
descending values from strong negative to strong positives of
these derivatives. By taking the sum of the absolute values
of the peak negative-going and positive-going spikes of the
derivative of each well, called the slope total, a numeric
value associated with the relative ~sharpness~ of the center
Ubutton~, any ~halo~' surrounding this button, and the
backround of each well is generated independent of any
absolute intensity values. This technique was developed as
an expert system model of trained laboratory technicians'
reading and scoring procedures.
W092/22802 PCT/US92/05103
~99 4~
The most important scoring task is discerning between
a weak negative B and a weak positive C. The center
intensity values are similar, and the button, halo and
backround transitions are more readily classifiable using the
slope information from the derivative than using the absolute
intensities.
Typical values for slope totals and center
intensities are shown below. The range of both the Slope
Totals and Center intensity values for each group is
approximately plus/minus lO units.
rYAO~ D~SCRIPTION S~OPE TOTAL C~TER ~COR~ :
~0-100) (0-2551 ~~~)
..
A Strong Negative 70 40 ~ 0
B Weak Negative 50 40
C Weak Positive 30 40 2
D Positive 20 55 3
E Strong Positive 10 70 4
As can be seen from these values, including the +/-
10 range, a scoring algorithm based on slope total ~-
information alone could distinguish, without overlap, between
strong and weak negatives, and positives as follows: ;
Strong negative= Slope Total > 60
Weak negative = Slope Total < 60 AND Slope Total > 40
Positives = Slope Total < 40
To distinguish between weak positives, positives~ and
strong positives using slope totals alone, however, can lead
to ambiguous scoring with a +~-lO range. If required, the
center values allow for easier classification of positives:
.:.
~.
: ~ .
, ~ , . .
W092/22802 PCT/US92/05103 ~
2 1 0 ~
Weak positive = Slope Total < 40 AND Center < 50 ~
Positives = Slope Total < 30 AND Center ~ 50 AND :~:
Center < 62
- Strong positive= Slope Total > 20 AND Center > 62
Actual cutoff values can be set by previous
statistical stored information or on-board calibration wells,
or both. Linear regression techniques can also be used for
scoring using slope total and center values, and it is -~
possible to adjust for run-to-run variations and reaction
times with on-board controls. Neural nets can also be
constructed using these parameters for scoring, as using the
slope total as a primary discrimination tool allows for a
robust and reliable detection environment not found in -~
intensity-only based techniques.
OPERATION OF THE APPARATUS
Operation of the apparatus of the present invention
is now described for HLA typing. The operator first isolates
the cells of interests by known techniques ~such as by the
Ficoll Hypaque method). Since the reaction cartridges 10
will typically be provided with ~he reagents in a frozen
state, the operator thaws the cartridge 10. The cartridge 10
preferably has a preprinted bar code containing assay type
and other information. The operator then logs in the patient
data by typing in the patient information using the
microcomputer keyboard. -
The operator places paramagnetic beads and a
fluorophore into well 12 of cartridge 10 for dispensing by a
pipette. 50 microliters of the sample cells are then
pipetted manually by the operator into the sample well lla,
llb or both. The operator then loads the cartridge 10 into
the automated instrument in the load area 30. The pipette
robot 34 retrieves and moves the cartridge 10 to a barcode
W092/22X02 PCT/US92/05103
99~
56
reader to read the information on the preprinted cartridge
barcode.
The pipette robot 34 transports the cartridge 10 and
places it under a pipette. The pipette then adds 50 ~1 of
paramagnetic beads and green fluorophore to the sample cells
from the well 12. A suitable green fluorophore is the 5,6
carboxyfluorescein disclosed in Table 1. The mixture is then
incubated in the incubation area 38 for 10 minutes at the
incubator's ambient temperature of 34C +/- ~C. The pipette
robot 34 then retrieves the cartridge 10 and moves it to the
pipette.
A magnet, such as a rare earth magnet (Permag, IL),
is then placed approximate to the sample well to hold the
cells which have now attached to the paramagnetic beads. The
sample wells lla, llb are then washed to wash off uncaptured
cells. 70 ~1 are aspirated from each of the sample
wells lla, llb into the waste blotter and an equal volume of
70 ~1 buffer is added to sample wells lla and llb. This
washing step is repeated 3 to 4 times, leaving a final volume
of 100 ~1.
The magnet is then removed and the cells are
resuspended and mixed in the sample well lla, llb. 0.5 ~1 of
cells are then pipetted into one of the reaction wells 16 on
the cartridge 10. The cells are counted in this reaction
well using a CCD and read at 490 nm. If the cell number is --
inadequate a signal is given to the operator and the
cartridge is rejected. If the cell number is too high, the
number of cells is estimated and must be diluted.
If the cell number was adequate or the cell number
has been di;luted, 0.5 ~1 of the cells are dispensed into each
reaction well 16. The cartridge 10 is then moved to the
incubator area 38, which is 34C +/- 2, for approximately 30
minutes. A rehydrated complement/red fluorophore mixture
with 480 ~1 of buffer are provided to the pipette. A
suitable red fluorophore is the propidium iodide disclosed in
W092/22802 PCT/US92/05103
2 1 0 .9 ~
57 ~;
Table 1. The cartridge 10 is moved to the pipette which then
dispenses 3 ~l of the complement per reaction well 16. After
all of the reaction wells 16 have been completed, the
cartridge 10 is moved to the incubator area 38 and incubated
for 30 to 45 minutes, depending on the samples being
analyzed. Optionally, the pipette may dispense 50 ~l of
buffer per reaction well 16. The cartridge 10 is then
retrieved by the image robot 40 and each well is image
processed at 490 nm/540 nm and the results and/or image is
then stored. After the samples have been image processed
(the cells have been counted and scored), the cartridge 10 is
then moved to an unload area 46 where it is unloaded manually -
by an operator.
: .
Examnles
The following examples are given to illustrate more
specifically use of the apparatus and methods of the present
invention.
Example 1 HLA Typing by Two Color Fluorescence Using
Complement Dependent
Microlymphocytotoxocity For Image Analysis
Referring to Figure 1, wells lla and llb designate -~
reservoirs for holding leukocyte suspension for which a HLA
determination was to be carried out. Lymphocyte purification
was carried out using paramagnetic particles purchased from
Advanced Magnetics Inc. ~Cambridge, MA) (under the BIOMEG ;;
tradename) conjugated with CD2, or CD8 monoclonal antibodies
according to the published procedures (Vartdal F. et al.,
Tissue Antigen 1986; 28: 30-1312). For Class II typing,
monoclonal antibody such as L243 could be conjugated to
similar paramagnetic particles purchased from Advanced
Magnetics Inc. (Cambridge, MA~. After the initial manual
loading of purified lymphocyte suspension into one of the two
sample wells lla or llb, all subsequent steps were handled by
W O 92/22802 PC~r/US92/05103
~ 58
the apparatus of this invention. Reagents including typing
sera, paramagnetic particles and 5,6 carboxyfluorescein
diacetate ~Sigma, MO) mixture, lyophiled complement (Pel
Freeze, Milwaukee, WI) and propidium iodide (Sigma, MO)
mixture that were necessary to complete a Class I or II HLA
Typing were included on the cartridge 10. A volume of 100 ~l
of the paramagnetic particles and 5,6 carboxyfluorescein
diacetate mixture was pipetted into 100 ~l of lymphocyte
sample. After 10 minutes incubation at room temperature, the
stained and rosetted cells were then separated from the
uncaptured leukocytes by placing the underside of the well
against a rare earth ~Permag, IL) magnet for 15 second.
Rosetted cells were subsequently washed with three changes of
300 ~l of 1 TDX~ buffer (Abbott Labs, IL) while keeping the ~-`
rosettes in place by the above-mentioned magnetic device. A
minimum of 0.5 ~l of rosetted leukocytes was pipetted into ~`
reaction wells 16 containing at least 0.5 ~1 of HLA typing
serum submerged in 2.5 ~1 of mineral oil. At the end of the -
30 minute incubation period, a minimum of 3 ~l of rabbit
serum (complement) containing 2 mg/ml of Propidium iodide was
added to each of the reaction wells 16. The reaction was
allowed to incubate for an additional 30 minutes at room
temperature. Positive reactions were indicated by varying
degree of lympholysis. 5,6 CDF stained cells were viewed
under a set of excitation (450 to 490 nm) and emission t520
to 560 nm~ filter (Nikon, Japan), while the PI stained cells
could be observed using a set of excitation (510 to 560 nm)
and emission filter (590 nm).
Example 2 Immunocytochemical Staining of Labeled
Cells for Biologic Markers in ~iopsy
Materials Or Tissue Sections
In another assay, human estrogen receptor expression
on normal and malignant breast tissues using immunoperoxidase
cytochemical method was used. Tissues were har~ested and
WO9~/22802 PCT/US92/05103
21 09~
59
prepared according to the Abbott-ER- ICA Monoclonal Assay
(Abbott Labs, Abbott park, IL) using immunoperoxidase
reaction. The nuclei of the cells that did not contain a
significant amount of estrogen receptor would show up light
blue. In contrast, tumor cells with elevated estrogen
receptor expression would appear reddish brown. Applications
of this technique can be extended to other cellular, or
subcellular biologic markers in conjunction with insitu
hybridization technique using DNA/RNA probes or other
immunostaining methodologies including various isotopes, -
chemical stains, immunologic reagents, or enzyme/substrate
combinations. Biologic markers can include protein,
carbohydrate, lipid or any of these combinations. Specimen
can either be a blood smear; biopsy materials or cytologic
smears; or thin tissue sections prepared by chemical
fixation, frozen, or paraffin section methodologies according
to standard methodologies. ~-
.:
Example 3 Front Surface Immunoassay For Analyte
Determination
As discussed in more detail below, a significant
advantage of the present invention is the ability to upgrade
the device to perform different types of assays. For
example, the apparatus and method of the present inven~ion `
may be used to enhance the precision and sensitivity of
fluorometric or coloramatric immunoassays. In one example of
a different assay type, reactions are carried out in a 96
well microliter-carriage (Abbot Labs, Abbott Parks, IL.)
Reagent mixing, incubation and signal development occur in
the reaction wells. In the sample reaction, paramagnetic
particles are coated with mouse IgG by procedures known to
those skilled in the art. Goat anti-mouse labeled with
B-Galactosidase is used for detecting the mouse IgG~ To
start a reaction, 50 ~l of mouse IgG coated paramagnetic
particles are mixed with e~ual volume of goat anti-mouse-B
W O 92/22802 PCT/US92/05103
9~ 60
Galactosidase complex in the reaction wells for twenty
minutes at room temperature. The unbound goat anti-mouse-B
Galactosidase complexes were washed away with a total of 500
~1 of TDX~ buffer (Abbot~ Labs, Abbott Park) while the
paramagnetic particles are held in place with a magnet. A
volume of 50 ~1 of a fluorogenic substrate such as
Di-B-Galactosylfluoroscein (Sigma, MO) are added to the
particles. Fluorescence densitometry or absorbance changes `
may be monitored through the image analysis arrangements -
described above.
: .
Example 4 Detection of Hepatitis B Surface Antigen
Through Agglutinatio~ -
Agglutination assays were performed in accordance
with the instructions provided using the Abbott Auscell~ kit --
commercially available from Abbott Laboratories, North
Chicago, Illinois 60064, which contains reagents and 96-
reaction well v-bottom agglutination plates. The Abbott
Auscell~ kit instructions are hereby incorporated by
reference and provide for reversed passive hemagglutination
for the detection of Hepatitis B surface antigen.
Lyophi~lized antibody-sensitized duracyte cells are
reconstituted with reconstitution solution. 25 ~1 of
specimen dilution buffer were then added to each reaction
well. 2 ~1 of test serum were added to appropriate wells.
25 ~1 of the antibody-sensitized duracytes were then added to
each reaction well. The reactants in the reaction wells were
mixed by tapping the sides of the plate or carriage tray, the
plates were incubated without vibration for two hours and
then read using ins`trù-mentation used in the present
invention.
:
. .
, . . .
~ .
~ - ~
:: :
W092/22802 PCT/US92/05103
2~09.9/1~
61
FIELD UPGRADES
The apparatus and method of the present invention
provide significant advantages over the prior art devices.
These advantages have been described in part throughout the
text of the above description. Another significant
advantage, which is de.scribed in more detail here, resides in ;
the expandability of the apparatus to perform different
assays, and the minimum amount of modifications which must be ~,
made to upgrade the apparatus in order for the device to
perform different assays. -
As discussed above, variation in sample preparations -
and other anomalies limit the usefulness of most, if not all,
av~ilable systems since these systems require major hardware
redesign to accommodate these variations. Further, available
automated assay instruments are dedicated to a single type of
assay. Again, major hardware redesign is needed to upgrade
the instrument to perform assays other than the one it was
originally designed for.
The system of the present invention provides an
arrangement which does not have these limitations. The
apparatus and method of the present invention can be easily
reconfigured to accommodate variations in an assay test or to
perform different assays. The modification will simply
require changing the optical filters and objectives and/or
modifying the algorithms for the image processing and other
minor modifications. The algorithm can be developed and the
appropriate filters and objectives selected before the field
upgrade is performed. As will be appreciated these
modifications or upgrades can then be performed in the field
without a significant amount of effort by the person
performing the upgrade in the field.
Since the assay steps are performed automatically, a
significant amount of human operator time is also eliminated.
It is expected that an HLA assay performed using the ;
instrument of the present invention will result in a saving
W092/22802 PCT/US9?/05103
~ 62
of between 63%-80% of the operator time required to perform ~-
the steps manually. ~;
The reader on the instrument could be adopted to read
fluorescence, agglutination, absorbance and chemiluminescence
assays. Also, cell morphology could be determined. Other
assays could require higher resolution and better sensitivity
and stability. This could be overcome with different cameras
which require different computer hardware and even more
processing time.
The foregoing description of the preferred
embodiments has been presented for purposes of illustration
and description. They are not intended to be exhaustive or
to limit the invention to the precise forms disclosed. It is
intended that the scope of the invention be defined by the
following claims including all equivalents.