Note: Descriptions are shown in the official language in which they were submitted.
21~0~~~
DOWNHOLE DEPTH CORRELATION AND COMPUTATION APPARATUS AND
METHODS FOR COMBINING MULTIPLE BOREHOLE MEASUREMENTS
This disclosure is directed in general toward the determination of
geophysical and other parameters of interest by combining multiple sensor
measurements obtained from within a borehole. Alternate embodiments of the
invention include wireline operations in which telemetry capacity may be
limited.
The sensors are preferably axially spaced within a downhole subassembly which
is
located near the drill bit and is conveyed within the borehole with the drill
string.
Sensor responses are first correlated to a common depth reference and vertical
resolution values, and then combined to obtain parameters of interest using
downhole computing means. This disclosure is directed more specifically toward
methods of depth correlation of multiple axially spaced sensors, vertical
resolution
matching of these sensors, and the combination of multiple sensor responses to
obtain downhole computations of parameters of interest. In one embodiment of
the
invention, computations are controlled for changing formation and borehole
environmental conditions using commands from the surface. Computed parameters
of interest are then telemetered to the surface in real time or stored
downhole for
subsequent retrieval. Briefly stated, downhole depth correlation and
resolution
matching is a necessary precursor to meaningful downhole computations
involving
multiple sensor responses. Although the invention is directed toward
measurements which are made while drilling a borehole, the concepts are
applicable to other operations such as wireline logging.
1
216668
BACKGROUND OF THE INVENT10N
Various embodiments of electromagnetic, nuclear and acoustic
measurements have been made for many years to determine geophysical properties
of earth formations penetrated by a borehole. These measurements are usually
displayed as a function of depth within the borehole at which they were
measured
forming a display known in the industry as a "log" of the borehole. The log of
spontaneous potential of earth formations penetrated by a borehole was made in
1927 using a wireline device. In the following decades, borehole measurements
using wireline devices were expanded to include nuclear and acoustic
measurements, as well as more sophisticated electromagnetic measurements, to
determine additional geophysical parameters of interest, and to also determine
certain properties of the borehole.
In the late 1960's and early 1970's, two or more wireline sensor
responses were combined to obtain parametric measurements which were more
accurate that measurements from either single sensor, and to obtain measures
of
additional parameters not obtainable from the response of either single
sensor. As
an example, measures of the acoustic travel time of the formation was combined
with a measure of formation porosity derived from a scattered gamma ray device
to
obtain not only an improved measure of formation porosity but an indication of
the
lithology of the formation not obtainable from the response of either
individual
measurement. U.S. Patent No. 3,590,228 to Jack A. Burke teaches the
combination
of neutron porosity, formation density and acoustic travel time wireline logs
to obtain
an improved formation porosity measurements and fractional components of as
many as three minerals. U.S. Patent No. 3,638,484 to Maurice P. Tixier teaches
the
2
combination of neutron porosity, formation density, acoustic travel time,
natural
gamma radiation, spontaneous potential and resistivity wireline logs to obtain
even
more formation information including effective and shale fraction porosity.
The first
such combining "combination" logs were generated from individual logs, each
being
made with a given type of downhole sensor and an individual pass within the
borehole. As the technology matured, multiple sensors of different types were
combined within a single downhole instrument thereby allowing the input
parameters
of the combination log to be measured in a single pass within the borehole.
This
advancement provided advantages in that drilling rig time devoted to logging
was
reduced. In addition, some of the depth correlation problems encountered in
combining multiple logs made at multiple borehole passes were eliminated.
Serious
depth correlation problems still exist even though all sensor measurements are
made with a single pass of the logging instrument. This topic will be
discussed in
detail in later sections of this disclosure.
In the intervening years, increasing numbers and types of basic
wireline sensors combined with increasingly complex response processing
algorithms have been used to obtain new and improved determinations of
geophysical parameters of formations penetrated by a borehole and the
properties
of the borehole. Most sensors used in current wireline technology are very
data
intensive. When such measurements are made simultaneously with a single pass
of
a multiple sensor wireline device, massive amounts of raw data are generated
per
depth interval of borehole traversed. These data are transmitted to the
surface of
the earth over the logging cable for depth correlation and other subsequent
processing to obtain the combination logs of multiple parameters of interest.
3
2l~a~GB
Current conventional wireline telemetry systems using seven conductor
electrical
logging cable can telemeter data to the surface at a rate of 500 kilobits to
1000
kilobits per second. Using emerging fiber optic logging cable and telemetry
technology, these transmission rates are expected to increase by orders of
magnitude. Because of the large telemetry bandwidths available in current and
emerging wireline systems, data intensive multiple sensors can be employed and
the raw data can be transmitted to the surface for processing. There are
situations,
however, in which wireline logging systems employ a single conductor cable,
either
for economic or operational reasons. These cables are often relatively small
in
diameter and are often required in the logging of wells under high pressure. A
single conductor cable limits telemetry band width. Using this type of cable,
raw
sensor data generated by modern combination logging tools can exceed the
telemetry capacity of the system.
The previous background discussion has been directed to wireline
type measurements wherein the measurements are usually made after the borehole
has been drilled. In some drilling operations, wireline logs are made
intermittently
during the drilling operation, but such logging requires that the drill string
be
removed from the borehole prior to logging. Logging after completion of the
drilling
operation often reveals that the target formation or formations have been
missed by
either drilling too shallow or too deep. In addition, unexpected zones, such
as high
pressure formations or salt zones, can be encountered during, and adversely
affect,
the drilling operation. Such encounters can be quite costly and can be fully
analyzed with wireline logging only after the encounter. Intermittent logging
is
likewise costly in that the drilling operation must cease during logging
operations.
4
21~~~~~
Possible damage to the borehole can occur during intermittent logging and
costly
drilling rig time and logging equipment time is wasted during stand-by periods
for
each operation.
The economic, technical, operational and safety advantages of
measuring geophysical parameters as well as drilling management parameters,
during the actual drilling of the borehole, was recognized in the early
1950's.
Commercial measurements-while-drilling (MWD) became available in the late
1970's and early 1980's. These measurements included directional information
and
a limited number of formation evaluation type services. Additional sensors and
services have been added as MWD technology matures. U.S. Patent No. 5,250,806
to Erik Rhein-Knudsen et al discloses a MWD apparatus for measuring formation
characteristics and is more specifically directed to the simultaneous
measurement of
neutron porosity and formation density with suitable borehole corrections for
each
measurement. Methods for downhole depth correlation and resolution matching
are
not addressed. In many respects, the sophistication of MWD sensors are
comparable to their wireline counterparts in spite of the harsh environment
experienced in using such sensors in the drilling environment. It is feasible,
at least
in principle, to utilize multiple sensor, data intensive, combination logging
methods
developed for wireline tools to obtain new and improved parametric
measurements
while drilling. Furthermore, it is feasible, in principle, to utilize
additional sensors
responding to drilling related parameters simultaneously with formation
evaluation
type sensors. In practice, however, the combination of multiple sensor
response
techniques, comparable in sophistication to corresponding wireline
applications, is
limited by current MWD telemetry rates and downhole storage capacities. The
s
~16~~~8
simultaneous transmission of drilling dynamics sensor information such as
directional information, weight on the drill bit, and other non-formation
evaluation
type measurements further overloads current MWD telemetry transmission rates
which are of the order of 2 to 60 bits per second. Furthermore, it is not
feasible to
store copious amounts of raw sensor data downhole for subsequent retrieval and
processing due to relatively limited storage capacity of current MWD systems.
MWD means for making formation evaluation combination logs comparable to
current wireline logs require the computation of the desired parameters
downhole,
and the transfer of the computed parameters of interest to the surface. By
using
downhole computational means and methods, the transmission requirements are
reduced by orders of magnitude in that only "answers" are telemetered, or
alternately stored, rather than raw data. This type of downhole computation is
also
applicable to other types of non formation evaluation type measurements such
as
signals indicative of the operational characteristics of the downhole
equipment as
well as measurements indicative of drilling direction and efficiency.
Furthermore,
downhole processing is applicable to wireline systems with limited telemetry
capacity.
Attention is again directed to depth correlation of multiple sensors
conveyed along the borehole within a single downhole subassembly. It is
virtually
impossible to position all sensors in the same plane intersecting the downhole
subassembly perpendicular to the axis of the borehole. The varying dimensions
of
different types of sensors as well as associated power and control circuitry
require
that multiple sensors be positioned axially along the major axis of the
downhole
subassembly which is parallel with the axis of the borehole. With the downhole
6
21~~~~'~
subassembly positioned at a given depth within the borehole, each sensor is
responding to a different depth interval of formation penetrated by the
borehole.
Using terminology common in the industry, each sensor has a different "measure
point". Furthermore, the physics of many types and classes of sensors
introduce
different "effective" measure points. Nuclear detectors such as thermal
neutron
devices and scatter gamma ray devices used to obtain porosity and density
measurements comprise a nuclear source and one or more radiation detector
spaced axially from the source. The sensors respond primarily to formation
between
the source and the one or more detectors. The effective measure point is,
therefore
between the source and detectors. Likewise, electromagnetic and acoustic
sensors
often comprise multiple, axially spaced, transmitters and receivers with the
effective
measure point lying within the axial within the axial array. Even
electromagnetic
sensors comprising a single transmitter and a single receiver with the
transmitter
operating at multiple frequencies can exhibit different effective measure
points
within a given formation. The effective measure point is not usually at the
mid point
of the axial array and, in fact, can vary with the type of intervening
formation and/or
the environmental conditions of the borehole such as the mud weight.
In combining the responses of multiple sensors to obtain one or more
parameters of interest, variations in the vertical resolutions of the various
sensors
must be also addressed as well as variations in effective measure points. Some
sensors respond rapidly as a formation bed boundary is crossed while others
respond more slowly. Vertical resolution is governed by many factors including
the
physical arrangement of the sensor, the basic physics of the sensor and the
physical properties of the formation and borehole environment being traversed.
As
21~~~~8
an example, a measure of formation photoelectric factor will exhibit better
defined or
"sharper" vertical resolution than a formation bulk density measurement even
though the same gamma ray source and gamma ray detector are used to make both
measurements. Unless vertical resolutions of all sensors are matched or
otherwise
processed, parameters computed from the combined responses of multiple sensors
will be erroneous, especially in intervals of rapidly changing geology such as
laminated sand-shale sequences.
The above discussion of sensor measure points, effective measure
points and vertical resolution is applicable to both wireline and MWD devices.
U.S
Patent No. 5,282,133 to Charles C. Watson teaches adaptive filtering and
deconvolution of primarily gamma ray spectra in obtaining optimum measures of
bulk density and formation photoelectric factor; however these teachings are
directed toward wireline measurements. Effective measure points of all sensors
responses from a downhole subassembly must first be shifted or correlated to a
common reference point along the axis of the downhole subassembly before
meaningful combination logs can be computed. The common reference point is
preferably selected to be near the midpoint of the multiple sensor array. The
depth
reference point is defined as the depth within the borehole at which the
cor~imon
reference point of the subassembly is positioned. Vertical resolutions of all
sensors
are also normalized to a common value as will be detailed in subsequent
sections of
this disclosure. If the effective measure points and vertical resolutions of
the
sensors are not properly correlated to a common reference, erroneous
combination
logs will result especially in the regions of bed boundaries where one or more
8
~1~~~~8
sensors may be responding to one formation and the remaining sensors may be
responding to different formations.
Before discussing the depth correlation of multiple sensor
measurements, a brief background of techniques used to measure the depth of
the
downhole subassembly as well as the movement of the subassembly within the
borehole will be provided. In wireline measurements, the depth of the downhole
subassembly or logging "sonde" is determined by passing the logging cable over
a
calibrated measure wheel at the surface of known circumference. Often, the
stretch
of the cable is compensated for by the use of a microprocessor which uses as
an
input the length of cable in the borehole, the weight of the cable in the
borehole, the
weight of the sonde and even the history of the cable whose stretch
characteristics
can change with usage. Logging speed is also determined by the rate of
rotation of
the calibrated measure wheel. In MWD operations, the depth and rate of
penetration of the downhole subassembly is determined from a calibrated
measure
wheel which contacts the drill string at the surface. If logging sondes and
downhole
MWD subassemblies were conveyed smoothly along the borehole, multiple sensor
responses could be correlated, at least to a first order of approximation, by
simply
shifting all sensor responses measured as a function of depth to a common
reference point using the known physical spacings of the sensors and an
assumed
or computed effective measure point of each sensor. In practice, however,
logging
sondes and downhole MWD assemblies are not conveyed smoothly along the
borehole. In wireline logging, which is usually performed with the sonde being
conveyed up hole, the sonde often sticks within the borehole and subsequently
releases or "jumps" as the cable is retrieved. Although the surface measure
wheel
9
~~~0~~~
indicates a constant velocity, the logging sonde and sensors therein are
actually
moving sporadically up the borehole. In MWD operations, the drill bit and
nearby
sensor subassemblies often "bounce" as the borehole is being drilled. Even
though
the surface measurement indicates a constant rate of penetration, the sensors
are
likewise moving sporadically down the borehole. First order sensor depth
correlations mentioned above can be erroneous since each sensor measurement is
recorded as a function of depth using depth measurements made at the surface.
As
an example, assume that two axially spaced sensors are sensing two different
formations. Further assume that the lower sensor is in a thin formation bed
and the
upper sensor is in a relatively thick formation bed. If the sensors
sporadically drops
within the borehole, the upper sensor could move past the thin bed at an
abnormally
high velocity and obtain an abnormally small number of measurements within the
this bed. The upper sensor could conceivably drop through the thin bed and
obtain
no measurements within the thin bed. If the surface measurement indicates a
constant sensor array velocity, the log produced by the second sensor will
indicate
an abnormally thin formation bed or, conceivably indicate no bed if the second
scenario is encountered. Any combination log computed from the combination of
the two sensors responses would obviously be erroneous in the vicinity of the
thin
bed unless depth correlation methods are designed to handle such situations.
Resolution matching was originally accomplished in the prior art by
"smearing" vertical resolutions to the sensor exhibiting the poorest vertical
resolution. Although simple to execute, the obvious disadvantage of this
technique
is that logs of computed parameters exhibit vertical resolution no better than
the
poorest resolving sensor in the combination array. Deconvolution techniques
based
to
~16~~~8
upon model sensor responses are now employed to enhance resolution of the
poorer resolving sensors thereby yielding computed log response with
significantly
improved vertical resolution. Deconvolution algorithms are a function, to some
extent, of the borehole and formation environment in which the sensors are
operating. In order to obtain maximum vertical resolution enhancement through
deconvolution, a continuous update of deconvolution parameters based upon
current environmental conditions is desirable.
The correlations of depth and vertical resolution of multiple wireline
sensors are performed at the surface in the prior art. Raw response data from
each
sensor, which exhibits the maximum vertical resolution from that sensor, is
telemetered to the surface and first recorded as a function of depth as
measured by
the calibrated measure wheel. Assuming that the downhole geology is varying,
each raw sensor response log will exhibit characteristic excursions or
"signatures"
as a function of depth. Various correlation techniques are used to correlate
the
response signatures as will be discussed in a following section. Should the
sensors
be moving along the borehole at a velocity as indicated by the calibrated
measure
wheel, depth correlation will comprise simple depth shifts to align the
effective
measure points to a common reference point. Should the sensors be actually
moving sporadically along the borehole, correlation will be required to
"stretch" or
"shrink" as well as depth shift the individual raw sensor responses logs for
reasons
cited and illustrated previously by example. Once the raw sensor response logs
have been properly depth correlated and aligned with respect to resolution,
combination logs of parameters of interest are computed and exhibited as a
function
of measured depth which is usually the depth reference point as previously
defined.
a
CA 02160968 2004-11-19
The above discussion assumes, of course, that the wireline telemetry bandwidth
is
sufficient to handle the transmission of raw data fogs from all sensors to the
surface.
In principle, the methods of wireline sensor correlation can be applied
to the response of multiple MWD sensors. The application of these wireline
techniques to MWD measurements has been prevented, however, by limited
telemetry and downhole data storage capacity of current MWD systems, Using
current MWD telemetry and storage capacity, raw sensor measurements exhibiting
suitable vertical resolution can not be telemetered to the surface for
correlation or,
alternately, stored downhole for subsequent retrieval and processing. This
disclosure is directed toward overcoming these problems so that MWD multiple
sensor measurements can be properly correlated downhole in order to provide
combination logs of maximum accuracy, precision and vertical resolution.
SUMMARY OF THE INVENTION
The current invention is directed toward the use of a downhole
computer and buffer storage within a MWD downhole subassembly to process data
from the response of a plurality of sensors of different type. Alternate
embodiments
of the invention include wireline operations in which telemetry band width is
limited
by components such as a single conductor logging cable. Classes or types of
sensors applicable to the invention include, but are not limited to,
electromagnetic,
acoustic, and nuclear.
Sensor measurements are made essentially simultaneously. First, the
sensor responses are correlated to a common reference point and reference
vertical
resolution. This correlation is performed using downhole models of the sensor
12
2~~~~~~
responses stored within a first downhole storage means along with downhole
computing means. In one embodiment, response models are computed theoretically
or are determined from sensor responses measured in test facilities with known
environmental conditions. These sensor response models are initially stored
within
the first downhole storage means. As an alternate embodiment, sensor response
models are calculated while drilling using the downhole computer and sensor
responses in portions of the borehole where conditions are known. These models
are then stored in the first downhole storage means and subsequently used for
correlation in the portions of the borehole in which conditions are unknown.
The
depth and resolution correlated sensor responses are then processed, using
combination sensor response models stored within the first storage means along
with downhole computing means to obtain logs of formation parameters of
interest
as a function of depth within the borehole which is preferably a depth
reference
point. These computed log parameters are then transmitted to the surface by a
suitable MWD telemetry system such as a mud pulsed system. In an alternate
embodiment, the computed logs are stored in a second downhole data storage
means of the MWD system for subsequent retrieval at the surface when the drill
string is removed or "tripped" from the borehole. In another embodiment, the
answers are both telemetered to the surface and simultaneously stored within
the
second downhole storage means. In still another embodiment of the invention, a
down link communication system is used to update parameters of the sensor
response models and combination sensor response models based upon
telemetered formation parameters telemetered to the surface. In addition,
changes
in borehole conditions such as increases or decreases in mud weight are
13
2~.6~~J~'~
telemetered to the downhole subassembly thereby updating sensor response and
combination sensor response models for these changes in borehole conditions.
Both of the example down link communications result in combination logs with
maximized accuracy and vertical resolution as will be detailed in subsequent
sections of this disclosure..
The computer, buffer storage, first storage means, and second storage
means are located within a MWD subassembly which is preferably located in the
general vicinity of the drill bit. Sensors are also preferably located within
the
downhole subassembly as well as power supplies to furnish power to the
computer,
sensors, and control circuitry. In addition, the sensors are axially spaced
along the
axis of the downhole subassembly which is parallel to the axis of the
borehole. The
downhole subassembly is preferably a drill collar. For purposes of definition,
the
term "sensor" includes both the transmitter and receiver components for
acoustic
and electromagnetic sensors and nuclear source and detector for induced
nuclear
sensors.
Raw responses from each sensor are collected over a relatively short
depth interval which might be five to ten feet of borehole. These data are
stored
temporarily as a function of depth within the buffer storage and then
retrieved and
correlated, using the stored sensor response models and downhole computer, to
a
common depth and resolution reference point using sensor response models
initially
stored, or calculated downhole and subsequently stored, within a first
downhole
storage means and suitable correlation techniques. Correlated sensor data are
next
combined using the stored combination response model and the downhole computer
to obtain the computed log parameters of interest. The resulting computed log
14
CA 02160968 2004-11-19
parameters of interest are then telemetered to the surface where they are
recorded
as a function of the reference measure point of the sensor array. Alternately,
the
parameters of interest are stored within downhole memory as a function of
depth for
subsequent retrieval at the surface. The entire process is repeated
sequentially as
the sensor array is conveyed along the borehole. That is, the data array
stored
within the buffer is continually updated by the addition of new measurements
while
the least current elements of the array are discarded.
It should be noted that the MWD systems acquires data as a function
of time rather than depth using the embodiment with no down link communication
befween the surface and downhole subassemblies to transmit previously
discussed
depth measurements acquired at the surface. 1n using the current invention in
this
embodiment, the correlation of raw sensor measurements and the computation of
parameters of interest must be performed in the time domain and then converted
to
the depth domain when the parameters of interest are transferred to the
surface
either by telemetry or storage and subsequent retrieval, Altemateiy, raw
sensor
response can be collected and processed in the depth domain as originally
described. Depth and rate of penetration information measured at the
surface is telemetered to the downhole subassembly thereby allowing the
conversion of data processing from the time to the depth domain. As mentioned
previously, the down link communication system can be used to update sensor
response model parameters and sensor combination model parameters thereby
improving the combination logs.
is
2~~~~~8
As discussed previously, depth correlation of multiple sensor
responses not only involves depth shifting to a common measure point but also
requires vertical resolution matching of responses either resulting from
sporadic
movement of the sensors along the borehole or from inherent differences in
vertical
resolution of the sensors. In situations where sensor movement is so sporadic
that
one or more sensors can bypass a thin bed without obtaining any measurements,
extrapolation techniques must be used or synthetic data must be generated.
Synthetic data are generated from the combination of stored response models of
the
sensors which obtained no measurements within the bed and response models of
the sensors which obtained measurements within the bed. An alternate solution
to
the latter problem is simply to indicate that no combination parameters could
be
computed in the bed with missing data. Such missing data is denoted as "no
record" in seismology.
Advantages of the invention over prior art MWD systems are
significant. One advantage is that raw data from a plurality of sensors can be
correlated downhole to a reference point by using downhole buffer storage and
computational means. Raw data can be depth correlated to a resolution
approaching the inherent resolution of the sensors thereby greatly improving
the
accuracy and precision of subsequently computed combination logs. This feature
is
especially important in working in formations with thinly bedded zones. Prior
art
systems require that raw data be either telemetered to the surface for
correlation or
stored downhole for subsequent retrieval and correlation. Because of limited
telemetry and storage capacity of current MWD systems, the vertical resolution
of
the telemetered or stored raw sensor data must be much coarser than the
inherent
16
2~.~~9~~
vertical resolutions of the sensors. As a result, much vertical resolution is
lost in
subsequently computed combination logs. A further advantage of the current
invention is that the downhole computational means can be used to directly
compute
the parameters of interest of the combination logs from downhole correlated
raw
sensor responses. Since the number of computed parameters or "answers" per
unit
depth of borehole is much smaller than the corresponding amount of raw sensor
data used in the computation, usage of limited telemetry and storage capacity
is
further optimized by transferring only "answers" rather than raw data to the
surface.
When operating in the telemetry mode, the current invention can provide more
computed log parameters with vastly improved vertical resolution. This feature
is
very important when the formations of interest comprise thinly laminated beds
such
as hydrocarbon bearing sand-shale sequences. A further advantage of the
current
invention is that additional parameters can be telemetered to the surface in
real time
since previously discussed downhole correlation and computational means
conserve available telemetry capacity. These additional parameters might
include
drilling dynamics measurements or the operational status or "health" of all
downhole
measuring systems. This reduces drilling costs and insures that measured data
and
resulting computations are valid. A still further advantage of the current
invention is
that, when embodied with down link telemetry, changes such as variation in mud
weight can be used to update sensor response model and combination sensor
model parameters yielding more accurate combination logs with maximized
vertical
resolution. A further advantage of the current invention is that it is
applicable to
wireline systems which have limited telemetry band width such as those
employing a
m
~l~~~r~
single conductor logging cable. Additional advantages of the current invention
will
be defined and become apparent in following sections of this disclosure.
BRIEF DESCRIPTION OF THE DRAWINGS
So that the manner in which the above cited features, advantages and
objects of the present invention are attained and can be understood in detail,
more
particular description of the invention, briefly summarized above, may be had
by
reference to the embodiments thereof which are illustrated in the appended
drawings.
It is to be noted, however, that the appended drawings illustrate only
typical embodiments of the invention and are therefore not to be considered
limiting
of its scope, for the invention may add to other effective embodiments.
Fig. 1 depicts an overview of the invention in an MWD environment;
Fig. 2 illustrates in block diagram form the key elements of the downhole
subassembly;
Figs. 3A-3D depict in graphical form the depth correlation of two axially
spaced electromagnetic sensor arrays, with each sensor exhibiting the same
vertical
resolution;
Fig. 4 illustrated the preferred overall data processing method in flow chart
form; an
Fig. 5 depicts in graphical form the depth correlation and vertical resolution
matching of two axially spaced nuclear and electromagnetic sensors.
1s
~1~' ~WJ8
DETAILED DESCRIPTION OF THE PREFERRED EMBODIMENT
Attention is first directed to Fig. 1. which depicts the invention in a
MWD embodiment The downhole subassembly 20 is suspended within borehole 14
by the drill string 16. In the preferred embodiment, the subassembly 20 is
position
as close as practical to the drill bit 12. The drill string is rotated by a
kelly depicted
by the numeral 26. The power source to drive the kelly as well as many other
components of the surface drilling rig are not shown in order to clearly
disclose the
key elements of the invention. Data are telemetered from the downhole
subassembly to an uphole telemetry element 30. The telemetry system can
comprise one or more types of drilling fluid or "mud" pulse systems which are
well
known in the art. The data telemetry path is indicated by the broken line 27.
Data
from the downhole subassembly 20 are received by the up hole telemetry element
30 and passed to a surface processor 32. The processor controls the output 34
such that the parameters of interest are recorded and displayed in the desired
manner which is usually a plot of the parameters of interest as a function of
depth
within the borehole at which they are determined. The processor 32 also
receives
data from the input element 36 which is telemetered downhole to subassembly 20
as
will be discussed in subsequent sections. The processor 32 also receives depth
information from the depth measure wheel and associated circuitry depicted by
the
numeral 28.
The borehole 14 is shown as penetrating relatively thick formations 18
and 24 on either side of a relatively thin zone 22. This situation has been
discussed
earlier as well as the problems associated with measurements computed from
multiple sensor responses should the sensors pass sporadically across such
19
216~~~8
bedding. The effective measure point of the subassembly 20, as defined
previously,
is indicated by the numeral 40.
Fig. 2 illustrates in block diagram form the major elements of the
downhole subassembly 20 and further illustrated with arrows the paths of
cooperation between the various elements. It should be understood that Fig. 2
illustrates only one physical arrangement of the -elements and one system for
cooperation between the elements. Other equally effective arrangements can be
utilized to successfully practice the invention.
A plurality of m sensors of one or more types arranged axially within
the subassembly are identified by the numeral 52. A predetermined number of
discrete data points output from the sensors 52 are stored within a buffer
which, in
Fig 2, is included as a partitioned portion of the memory capacity of the
computer
50. Alternately, the buffer storage means can comprise a separate memory
element
(not shown). The sensor response relationships or "models" are stored within
memory means 48. A two way communication link exists between the memory 48
and the computer 50. The responses from sensors 52 are transformed into
parameters of interest within the computer 50 using methods which will be
detailed
in the following section. The parameters of interest are then passed to the
down
hole portion of the telemetry system 42 and subsequently telemetered to the
surface
as illustrated generally by the broken line 27. The power sources 44 supply
power
to the telemetry element 42, the computer 50, the memory modules 46 and 48 and
associated control circuits (not shown), and the sensors 52 and associated
control
circuits (not shown).
CA 02160968 2004-11-19
Attention is now directed toward correlation and resolution matching of
the responses of one or more sensors within downhote subassembly 20. Depth
shifting will first be addressed and then resolution matching. Depth shifting
accomplishes two purposes which are (1 ) the alignment of measure points of
axially
spaced sensors such that the sensor responses can be properly combined to
obtain
parameters of interest and (2) the measure of rate of penetration (ROP) of the
bit 12
using only data obtained and processed downhole. Excursions of sensor
responses
to varying environmental conditions are a necessary condition for depth
correlation.
Responses of different types of sensors can be used in some situations for
correlation, as will be subsequently illustrated. Correlation is, however, not
possible
if one sensor responds to a change i~ geophysical conditions while
another.sensor
does not. As an example, the response of a gamma ray sensor would not change
appreciably in crossing an oillsalt water interface within a sand of constant
porosity.
The response of a resistivity sensor would, hcwever, vary significantly when
crossing the interface. As a result, there would be no correlation across the
oillwater interface. The crossing of a sandlshale interface by the two types
of
sensors would, in all probability, yield excellent excursions of both types of
sensors.
To obtain the maximum vertical density of correlatable excursions, It is
preferable to
use responses from the same types of sensors for depth correlation purposes.
Fig. 3A depicts a portion of the downhole subassembly 20 comprising
two electromagnetics sensors with each further comprising a transmitter .and a
receiver. The transmitter 140 and the receiver 144 comprise the first sensor
with a
measure point illustrated by the arrow 134. The transmitter 142 and the
receiver
146 comprise the second sensor with a measure point illustrated by the arrow
132.
21
CA 02160968 2004-11-19
The transmitter-receiver spacings for both sensors are the same for purposed
of
illustration. The separation of the two sensor measure points is defined as eD
and
is identified by the numeral 130. Fig 3A illustrates an actual sensor pair
used in an
MWD system where 0D = 39 inches.
It should be recalled that generally sensor responses of MWD systems
are initially measured as a function of time. The response, r,, of the first
sensor
array is plotted as a function of time in Fig. 3B. The response is depicted as
a curve
150 with excursions identified by the numerals 157 and 155. Data over N
discrete
time intervals Ot; illustrated by the numeral 156, are collected and stored
within the
previously defined buffer storage means. The data r, are, therefore, discrete
measures represented by the points 152 plotted at the mid point of each
corresponding time interval 0t. In the illustrated example, 0t represents a
time
interval of 100 seconds. The response q, of the second sensor is shown in Fig.
3C
as curve 160 plotted as a function of time. The curve 160, like curve 150, is
actually
an array N of discrete measurements 162 over time intervals 0t. depicted by
the
numeral 162 and are likewise stored within the buffer memory. Excursions 167
and
165 correspond to the excursions 157 and 155 of curve 150, but occur at
earlier
times since the subassembly 20 is moving downhole during drilling and the
second
sensor "leads" the first sensor. For purposes of illustration, it will be
assumed the N
and ~t are the same for both the first and the second electromagnetic sensors
although this is not a necessary condition for processing data according to
the
methods of the invention. Because of the different measure points 134 and 132
of
the first and second sensors, respectively, all excursions of curve 150 will
be
22
CA 02160968 2004-11-19
displaced from corresponding excursions on curve 160 by a time differential
DT,
assuming that the ROP is constant over the correlated interval.
The next step in the data processing sequence is to correlate the
responses of the two electromagnetic sensors which, in this particular
illustration,
are still recorded in the time domain. Many correlation techniques can be used
but
the well known cross correlation technique is presented as the preferred
embodiment. The normalized cross correlation coefficient, C(j), is given by
the
relationship
N N N
E~riqi-j) ~ET Z X ~q 2)I/1
i=1 i=1 i=1
where C(j) = 1.0 for exact correlation and C(j) = 0.0 for no correlation of
the data r,
and q;. The N incremental measurements r, and q; are recalled from the buffer
and
C(j) is computed for each possible combination. Defining jm~ as the index for
which
C(j) is maximized, then
~2) eT = j",~. et
By shifting curve 160 to the right by OT/2~t time increments and by shifting
curve
150 to the left by OT/2dt time increments, the curves are correlated in the
time
domain. This step is illustrated in Fig 3D where the shifts of curves 160 and
150 are
23
CA 02160968 2004-11-19
designated by the numerals 176 and 174, respectively, and DT is denoted by the
numeral 172. !t should be noted that for purposes of illustration, the
amplitudes of
the curves have been normalized at a value in time denoted by the numeral 179.
This normalization is only to illustrate the high degree of correlation. The
lowest
values of r, and q, are then discarded as the subassembly traverses the
borehole
over the time interval ~t and new values of sensors measurements rN+, and
qN,., are
added to the buffer storage forming a new data set o~ N values for each
sensor.
.This procedure is repeated as the subassembly 20 is conveyed along the
borehole.
Several observations are appropriate at this point of the data
processing sequence. For the example of Fig. 3, DT - 505 seconds. The
incremental velocity w, which is defined as
(3) 4v = OD / ~T
is computed for each increment Ot since DD is a known design parameter of the
subassembly and 0T is measured. Over the correlation interval illustrated in
Fig. 3,
ROP = ev~ = 39/505 = 0.0772 inches/second = 23.2 feet/hour which agrees with
the
ROP measured at the surface to within three significant digits. Should the ROP
change significantly, the sample intervals Ot and the number of measurements N
collected for correlation can be changed automatically without commands from
the
surface. As an example, if the ROP increases significantly, it might be
desirable to
reduce 0t to increase the resolution of excursions and thereby optimize the
sensor
cross correlation. The computer 50 is programmed to automatically vary N and
et
based upon downhole computations of w without commands from the surface.
24
CA 02160968 2004-11-19
The matching of vertical resolutions of multiple sensors is nexf
addressed. For reasons stated previously, the vertical density of correlatable
excursions is largest for sensors of the same type. One of the primary
applications
of the invention is, however, the combination of sensors of different types to
obtain
parameters of interest: Resolution matching will; therefore, be illustrated
using
responses of two detectors of different types. Fig. 5A depicts a portion of
the
downhole subassembly comprising a nuclear sensor and an electromagnetic
sensor.
Only two sensors are used to illustrate this step of data processing although
it
should be understood that the techniques to be described are applicable to any
number of sensor responses. The nuclear sensor comprises a nuclear source 60
and a nuclear detector 62. The effective measure point of the nuclear sensor
array
is denoted by the arrow 65. The electromagnetic sensor used in the example
comprises a single transmitter 66 and a single receiver 64. The effective
measure
point for the electromagnetic sensor array is denoted by the arrow 67. The two
effective measure points are displaced axially along subassembly 20 by the
known
distance, again defined as DD identified by the numeral 68.
Using the nomenclature of the previous example, the response, r,, of
the nuclear sensor is plotted as a function of time in fig. 5B. The response
is
depicted as a curve 70 with a major excursion 74 induced possibly by a thin
formation 22 as illustrated in Fig. 1. Data over N discrete time intervals Ot,
where
Dts are illustrated by the numeral 72, are.collected and stored within the
previously
defined buffer storage means. The data r, are again discrete measures
represented
by the points 76 plotted at the mid point of each corresponding time interval
Ot. The
response q; of the electromagnetic sensor is likewise shown in Fig 5B as curve
80
CA 02160968 2004-11-19
plotted as a function of time. An excursion 84 is depicted which exhibits
poorer
vertical resolution than the nuclear sensor across the same geological
feature. The
curve' 80, like curve 70, is actually an array N of discrete measurements 85
over
time intervals dt depicted by the numeral 82 and are likewise stored within
the
buffer memory. For purposes of illustration, it will again be assumed that N
and Ot
are the same for both the nuclear and electromagnetic sensors although this is
not a
necessary condition for processing data according to the methods of the
invention:
Because of the different measure points 65 and 67 of the nuclear and
electromagnetic sensors, respectively, the excursions 74 and 84 are displaced
by a
time differential DT denoted by the numeral 79.
The next step in the data' processing sequence is to depth shift the
responses of the nuclear and electromagnetic sensors using the cross
correlation
described in the previous example. Results of depth shifting are illustrated
in Fig 5C
where the line 90 denotes a time which corresponds to the effective measure
point
of the combine sensor array in the depth domain.
As mentioned previously, it is preferred to resolution match multiple
sensors with the sensor response data in the depth domain. Absolute depth can
be
supplied to the downhole computer at several stages of the drilling operation.
As
examples, absolute depth can be supplied each time the mud pump is cycled, or
each time the drill bit is tripped, or both. The preferred method is to supply
absolute
depth information each time the mud pump is cycled which, of course, occurs
each
time a joint of drill pipe is added to the drill string and possibly more
often.
Subsequent incremental depth commands based upon the. readings of the surface
depth indicator 28 are telemetered down to the computer by means of the
computer
2b
CA 02160968 2004-11-19
down link element 30. These incremental depth signals are used to update
surface
entered absolute depth values thereby allowing downhole sensor readings to be
converted from the time domain to the depth domain with a reasonable degree of
accuracy. Being incremental depth indications, these signals are not data
intensive
and can be transmitted downhole using methods well known in the art. Should,
however, a relatively long interval occur between trips of the bits,
significant error is
propagated using the incremental depth measurement technique. For vertical
depth
shifting and resolution matching purposes, the use of incremental depths
.rather than
absolute depths has been found to be satisfactory. If, however, parameters of
interest measured in the drilling welt are correlated downhole with reference
data
from surrounding wells, absolute depth tracking becomes important. This is
because the reference data is usually supplied as a function of absolute
depth.
Fig. 5D illustrates the nuclear and electromagnetic sensor data which
have been resolution matched by using a response model of the electromagnetic
sensor, stored within memory module 48, to "sharpen" the resolution of the
electromagnetic sensor as depicted by curve 82 to match the resolution of the
nuclear sensor, identified again by the numeral 70. An alternate method which
is
less computational intensive, but which yields poorer vertical resolution of
eventually computed parameters of interest, comprises "smearing" the
resolution,of
the higher resolution measurement to match the resolution of the poorer
resolved
measurement. In the example under discussion, the response of the nuclear
sensor
27
is smeared by averaging a subset of a elements within the larger set N using
the
relationship
i+u
(4) r'; - (Sr;) , 2u
i-a
and plotting the smeared response r'; at the mid point of depth increment u.
The
result of this type of resolution matching is shown in Fig 5E where the
vertical
resolution of the response of the nuclear sensor 74 has been degraded to match
the
resolution of the electromagnetic sensor as depicted by curve 80.
At this point, data measured by the sensors 52 have been correlated
and resolution matched. Geophysical, drilling dynamics and other parameters of
interest are now determined by combining these responses using combination
sensor response models which are stored either internally within the computer
50 or
within an additional memory module (not shown) contained within the downhole
subassembly 20. The computed parameters of interest are telemetered to the
surface by means of the telemetry element 42 cooperating with telemetry
element
30. Computed parameters of interest are displayed in an appropriate form as a
function of depth by output element 34. Alternately, the parameters of
interest can
be stored downhole within memory module 46 for subsequent retrieval at the
surface when the drill string is tripped. An additional option is to both
telemeter to
the surface and store either all or portions of the computed parameters of
interest.
28
21~~9~8
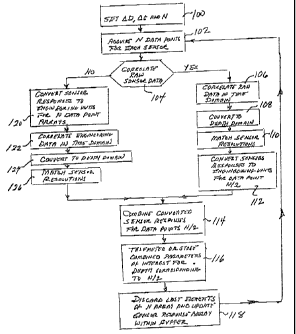
One overall data processing method is summarized in the flow chart of
Fig. 4. It should be understood that various steps can be changed and still
preserve
the spirit of the data processing objectives of the invention. At step 100,
the known
spacings between the effective points of a plurality of sensors, the number of
data
points N from each sensor to be stored in the storage buffer, and the
incremental
time intervals over which raw data will be accumulated are stored in the
downhole
computer 50. N data points are acquired for each sensor as depicted at step
102.
At 104, a decision is made whether to convert the N raw data points into
engineering
units prior to correlation or whether to correlate raw data. In this context,
an
"engineering unit" is defined by example using the response of a epithermal
neutron
porosity sensor. Raw data from the sensor would be counting rate which would
exhibit excursions as the formation parameters vary. Apparent formation
porosity,
computed from measured counting rate using a predetermined calibration
relationship ( i.e. the sensor response model) between counting rate and
porosity, is
defined as the sensor response in "engineering" units. Apparent porosity will
also
yield correlatable excursions. If the decision is made to correlate raw data,
which is
preferred in that less computing capacity is required, correlation is made at
step
106. The correlated data are converted from the time to depth domain at step
108.
Sensor resolution is matched at step 110. At step 112, raw sensor data for the
NI2
depth point in buffer storage are converted to corresponding engineering units
using
sensor response model stored in memory module 48. Sensor responses are
combined to compute parameters of interest at step 114 for the depth
represented
by the buffer elements N/2. In an alternate embodiment, step 112 is omitted
and
raw sensor data are combined directly to obtain the parameters of interest.
29
216~9~8
Parameters are telemetered to the surface or alternately stored downhole for
subsequent retrieval at step 116. At step 118, the arrays of N elements for
each
sensor are updated as the sensors move along the borehole by discarding the
"oldest" measurements and adding the most recent measurements. The process is
repeated sequentially again starting at step 102. If, at step 104, the
decision is
made to correlate sensor response in engineering units, sensor responses are
converted at step 120 to the corresponding engineering units for each set of N
data
points in buffer storage. Correlation is performed at step 122 in the time
domain
and the correlated data are converted to the depth domain at step 124. Sensor
resolution is matched at step 126 and the steps depicted in blocks 114 through
118
have been described previously.
While the foregoing is directed to the preferred embodiments, the
scope thereof is determined by the claims which follow.