Note: Descriptions are shown in the official language in which they were submitted.
-
21~2~85
A USER INTERFACE FOR A GRAPHICAL DISPLAY DEVICE
Background of the Invention
The present invention relates to an interface
for a graphical measuring device to simplify the opera-
tion of the measuring device for measuring electrical
signals.
An oscilloscope is a device which displays a
graph of voltage or current over time. In order to
display meaningful information, the oscilloscope must be
configured to measure voltage or current over a meaning-
ful range of magnitudes during a proper time duration.
The start of the time period for measuring voltage or
current must be selected by choosing a proper triggering
event based on the anticipated electrical signal to be
measured. The triggering event may include the trigger
level voltage and the trigger slope. For example, a
triggering event could be a voltage signal rising above
0.1 volts. The time duration and voltage range should be
selected so that a full electrical signal (waveform) is
visible on the display. To make a meaningful interpreta-
tion of the displayed waveform, the user must know what
the waveform should look like.
For example, if the user is measuring a square
wave signal that varies between 0.01 volts to 0.06 volts
every 100 microseconds, then it would be useless to view
the square wave signal on a voltage scale set to display
signals between 0 to 0.005 volts. Also, it would not be
optimal to measure the square wave signal over a time
duration of 10 microseconds. Further, if the triggering
event was set to sense an increasing signal greater than
0.1 volts, then the square wave signal would never trig-
ger the device and hence no waveform would be displayed.
It is apparent that to simply make a proper measurement,
the user must select the scaling, time duration, trigger
level voltage, and the trigger slope, all for an elec-
trical signal for which the user presumably has a prior
2162085
knowledge of its characteristics. If the user does notknow or can recall the anticipated signal's character-
istics then the process to properly sense and display a
waveform requires experimentation in an attempt to set
all parameters. This experimentation may require
considerable time and be frustrating to the user.
For the aforementioned example, a properly
configured measuring device should have the voltage scale
range set to 0 to 0.1 volts to permit viewing the height
of the entire waveform. The time period should be set to
either ~00 or 1000 microseconds so that at least one
entire waveform time period is displayed. The triggering
event could be selected to trigger with an increasing
voltage over 0.015 volts, which is above the minimum
anticipated voltage of 0.01 volts. The trigger slope, if
needed, would be set accordingly.
Many technicians, including automobile
technicians, are likely to be unfamiliar and untrained
with respect to the proper operation of such an oscillo-
scope. With all their other concerns, it is a timeconsuming burden for such technicians to be properly
trained to correctly configure an oscilloscope to perform
-~ various tests and measurements. In particular for auto-
motive technicians, many tests have become necessary with
the advent of microchip controllers within automobiles.
A traditional desktop oscilloscope may be used
by technicians to display measurements for testing and
troubleshooting. However, as previously explained, many
technicians may be unfamiliar with the proper operation
of an oscilloscope. Further, it is burdensome for the
technician to move desktop oscilloscopes to remote
testing locations to take measurements.
Fluke Corporation of Everett, Washington, has
designed and is marketing a handheld 860 series GMM
(Graphical Multimeter) that displays electrical waveforms
in a manner similar to that of a desktop oscilloscope.
However, unlike an oscilloscope, the 860 series GMM is
2162085
not capable of sampling at over lOO,ooO Hz which provides
an inadequate display resolution for many applications.
In essence, the graphical multimeter is only capable of
sensing the general trends of electrical signals. In
general, oscilloscopes sample at rates in excess of 1 MHz
and thereby can display transients of electrical signals
that the 860 series GMM, and similar graphical meters,
are incapable of doing. Most oscilloscopes operate at
frequencies of 5 MHz or more. Like an oscilloscope,
Fluke's 860 series GMM is complicated to configure,
particularly when used by an untrained technician
unfamiliar with its operation. Accordingly, for tech-
nicians, and in particular automobile technicians, a
graphical measuring device that is easy to configure to
perform tests and measurements is desirable. Further-
more, if the technician does manage to properly configure
the measuring device, the technician may still be unable
to interpret the meaning of the waveform, for example,
whether or not the waveform indicates the existence of a
problem, without prior knowledge of how a proper waveform
should appear.
Olsen, U.S. Patent No. 3,789,658 discloses an
automobile engine performance analyzer which includes an
oscilloscope and three selectable scale test meters for
displaying certain operating characteristics of an engine
under test. In particular, a program switch is provided
with a rotary selector knob for positioning the switch at
any selected position for measuring and displaying one of
the characteristics A-L. However, the oscilloscope uses
the same scaling of the graphical display for all the
different tests. This does not allow optimum viewing of
all waveforms (if any waveform is displayed at all),
because each waveform may have a different magnitude,
time duration and trigger point.
What is desired, therefore, is an interface for
a graphical display device that frees the user from
setting the scaling, time duration, trigger level
4 2162085
voltage, and trigger slope for one or more user-selected
tests. Furthermore, the display device should assist the
user in determining whether the displayed waveform is
correct.
Summary of the Present Invention
The present invention overcomes the
aforementioned drawbacks and shortcomings of the prior
art by providing a measuring device that displays wave-
forms representative of electrical signals that includesa selector, at least one input terminal, and a graphical
display suitable for viewing a waveform thereon. In a
first aspect of the present invention, the measuring
device receives an electrical signal from the input
terminal and displays a first waveform on the graphical
display which is representative of the electrical signal.
The selector typically may be in the form of a rotary
selector knob cooperating with a dial containing indicia
associated with respective angular positions thereon.
The selector is moveable to one of a plurality of posi-
tions and the measuring device then selects waveform data
in response to the respective position chosen. The
-~ measuring device then displays a second waveform on the
graphical display which is taken from a reference wave-
form data library and is representative of the waveformdata type selected.
Preferably the first waveform and second
waveform are simultaneously displayed on the graphical
display. By displaying the second waveform, preferably
indicative of a reference signal, the user can visually
compare his measured signal (first waveform) to the
reference waveform (first waveform) to assist in
troubleshooting and testing determinations.
In a second aspect of the present invention,
the measuring device is selectable to one of a plurality
of positions and the measuring device selects trigger
data and scaling data in response to each of the
5 21~2085
positions. The measuring device receives an electrical
signal from the input terminal and displays a received
waveform representative of the electrical signal on the
display where the measuring device is configured in
accordance with the trigger data and scaling data.
Selecting the appropriate scaling data and
trigger data for the measuring device by different selec-
tor positions permit the user to simply select the test
to be performed and the measuring device is consequently
automatically configured. This alleviates the user from
the necessity of being familiar with the operation and
configuration of the measuring device aside from simply
choosing the appropriate test to be performed.
The foregoing and other objectives, features,
and advantages of the invention will be more readily
understood upon consideration of the following detailed
description of the invention, taken in conjunction with
the accompanying drawings.
Brief Description of the Drawings
FIG. 1 is a pictorial front view of a measuring
device that includes a user interface constructed in
accordance with the present invention.
FIG. 2 is an operational flow diagram of the
measuring device and user interface shown in FIG. 1.
Detailed Description of the Preferred Embodiment
Traditional oscilloscopes are designed as
general purpose devices with extensive functionality and
versatility but, as previously described, technicians may
be unfamiliar with its operation and hampered by the
versatility of such instruments. To cater to the need
for a powerful yet simple to use measuring device, an
interface is needed to free up the technician from the
complicated details regarding the device's operation. An
important consideration accomplished by the user inter-
face of the present invention is that the measuring
216208~
device may be specifically designed to exploit the fact
that there are typically only a limited number of meas-
urements that are performed by a specialized technician,
such as an automobile technician. Ideally, the measuring
device should permit the technician to merely identify
the particular test to be performed and the measuring
device would then properly sense and display the waveform
of the electrical signal associated therewith. To sense
an electrical signal which has predetermined character-
istics, a good trigger level voltage and trigger slopeshould be automatically selected by the measuring device.
In addition, to properly display the electrical signal
the measuring device should automatically select a proper
voltage (or current) range and time period.
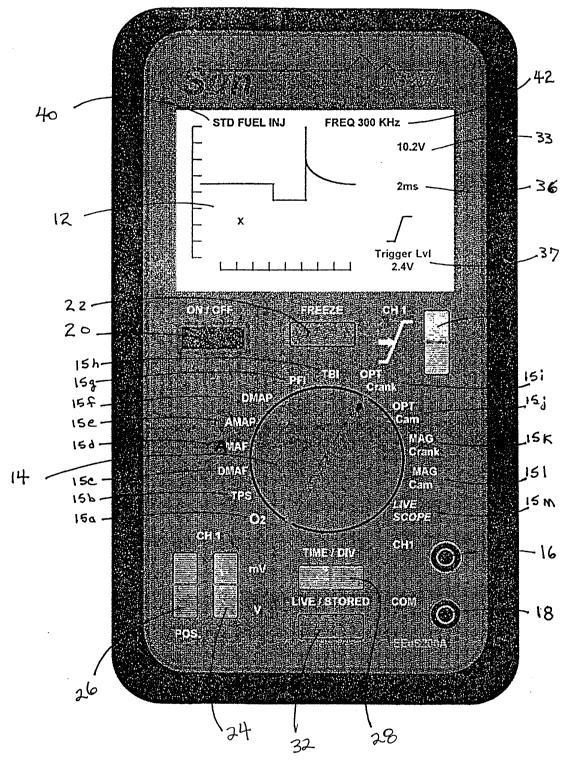
Referring to FIG. 1, the measuring device 10,
which is preferably an oscilloscope, is a portable
battery-powered handheld device to facilitate making
measurements at remote locations. For an automotive
technician, only about twelve measurements, one for each
of the vehicle diagnostic sensors feeding into the
vehicle's microchip, are typically performed. It turns
out that the magnitude of the voltage and/or current
signals detected by these sensors, when measured over a
time period, varies little among different vehicles.
However, the electrical signals that need to be observed
do have steady state and transient characteristics which
require a fast sampling rate in order to obtain an accu-
rate waveform. The sampling rates of graphical multi-
meters are not fast enough to provide a waveform with
sufficient resolution for such automotive testing.
Accordingly, an oscilloscope which has a much higher
sampling rate is necessary to properly sense and display
the electrical signals of the vehicle's diagnostic micro-
chip. (However, where the required sampling rates for
the particular application are significantly lower, a
graphical multimeter or some other measuring device may
be adequate.)
216208~
The oscilloscope 10 preferably has about the
same size, shape, and appearance as a handheld multimeter
to provide portability and maintain its familiarity in
appearance with technicians that are already familiar
with such instruments. A graphical display 12 is located
at the upper center of the oscilloscope 10. Centrally
located on the oscilloscope 10 is a rotary snap-to dial
14, which in the exemplary embodiment shown has thirteen
selectable positions 15a-15m. The dial may be chosen
with any suitable number of positions for the particular
application. The presence of the dial 14 makes the
oscilloscope 10 appear familiar and acceptable to tech-
nicians who are familiar with multimeters. In the
exemplary embodiment the cost of designing and manufac-
turing the oscilloscope is reduced because existingtooling is available for multimeters with a similar
appearance.
The dial 14 provides an aspect of the user
interface to simplify the operation of the oscilloscope
for a technician. Each position of the dial is pro-
grammed to correspond to a particular test that is
frequently performed by the technician. As shown in
FIG. 1, twelve of the thirteen selectable positions
correspond to individual electrical tests 15a-151
typically performed by an automotive technician in
vehicle diagnostic and repair work. The thirteenth posi-
tion 15m permits the oscilloscope 10 to operate in the
same manner as traditional oscilloscopes, as will be
described in detail later. Turning the dial 14 to one of
the twelve positions corresponding to a respective one of
the automotive tests, configures the oscilloscope to
properly sense and display the anticipated electrical
signal. The configuration performed by the oscilloscope
includes automatically selecting the scaling (voltage or
current), time duration, trigger level voltage, and
trigger slope for the anticipated electrical signal
corresponding to the dial's selected position. In this
2162085
manner, the technician only needs to select the desired
test as indicated by the dial, and the oscilloscope is
then automatically configured to properly sense and
display the anticipated electrical signal.
To measure the electrical signal an active lead
is attached to input port 16. A common lead provides a
point of comparison for the active lead potential and is
connected to common port 18. For most measurements the
common lead is generally connected to ground. The off-on
switch 20 permits the oscilloscope to be turned off and
on. When pressed, the freeze button 22 stops the move-
ment of waveforms on the display 12 and displays the
waveform currently on the display as a still frame until
the freeze button is pressed again. As is conventional,
the freeze button allows time for the technician to
examine the waveform.
Brief descriptions of the measurements
typically associated with an automobile microchip, as
indicated around the dial 14, are as follows.
02(15a) The measurement of oxygen in the
exhaust stream. If the auto-
mobile is operating properly,
-~ the electrical signal should be
a slow sine wave varying between
100 and 900 millivolts and
centered at approximately 450
millivolts.
TPS(15b) The throttle position sensor
provides a measurement of the
opening of the fuel throttle
plate. As the accelerator pedal
is depressed, a potentiometer is
turned, resulting in a greater
voltage across the potentiometer
and thus a greater throttle
aperture. When the potentiom-
eter is worn, spikes or glitches
2162085
may occur as the accelerator is
depressed. When operating
properly, the measured voltage
should rise smoothly from 0 to 5
volts as the accelerator is
depressed.
DMAF(15c) The digitized measurement of the
airflow into the engine. When
operating properly the measured
signal should be a 0 volt to 5
volt square wave with frequency
proportional to the air flow
measured.
AMAF(15d) The analog measurement of the
airflow into the engine. When
operating properly the measured
signal should be a sine wave
which varies between 0 to 5
volts.
AMAP(15e) The analog manifold absolute
pressure of the air pressure at
the manifold (it should be a
-~ consistent vacuum). The meas-
ured voltage level is an analog
representation of the air
pressure.
DMAP(15f) The digital manifold absolute
pressure of the air pressure at
the manifold. The measured
signal should be a square wave
with a frequency that is
proportional to the pressure.
PFI(15g) The port fuel injector measures
the voltage at fuel injector
opening. The port fuel injector
measurement may include spikes
up to 100 volts.
2162085
TBI(15h) The peak and hold fuel injector
measures the voltage at the fuel
injector opening for peak and
hold variety injectors which
peak twice.
OPT Crank(15i) The optical crank takes an
optical measurement of the crank
shaft. A proper measured signal
is a O volt to 5 volt square
wave that has a frequency equal
to that of the revolutions per
minute of the crank shaft.
OPT Cam~15j) The optical cam takes an optical
measurement of the cam shaft
(the cam shaft is the little
shaft that operates the cylinder
valves). A proper measured
signal is a O volt to 5 volt
square wave that has a frequency
equal to that of the revolutions
per minute of the cam shaft.
MAG Crank(15k) The MAG Crank is a magnetic
-~ measurement of the crank shaft.
A proper measured signal is a O
volt to 5 volt sine wave with a
frequency proportional to the
revolutions per minute of the
crank shaft.
MAG Cam(lSl) The MAG Cam is a magnetic
measurement of the cam shaft. A
proper measured signal is a O
volt to 5 volt sine wave with a
frequency proportional to the
revolutions per minute of the
cam shaft.
LIVE Scope(15m) This position allows the user
the full (i.e., wholly
2162085
11
unconfigured) flexibility
generally available with an
oscilloscope.
The following controls are available when the
dial 14 is in the LIVE Scope 15m position.
The volts per division button 24 sets the
voltage (vertical) range of the oscilloscope 10
in terms of volts per horizontal division. In
this instance a dual button 24 is provided,
where pressing the top end of the button 24
increases the scale and pressing the bottom end
of the button 24 decreases the scale. The
preferred scaling uses a one-two-five sequence.
Such a sequence may include 1 millivolt; 2
millivolts; 5 millivolts; 10 millivolts; 20
millivolts; 50 millivolts; 100 millivolts; 200
millivolts; 500 millivolts; 1 volt; 2 volts; 5
volts; lo volts; 20 volts; 50 volts.
The position button 26 establishes the zero
-$ volt position on the vertical scale. For some
measurements it would make sense for zero volt
position to be at the very bottom of the scale
(i.e. in the case where the voltage always
exceeds zero), whereas for other measurements
zero volt position should be in the middle of
the vertical scale (i.e. for the cases where
the voltage is centered at zero).
The Time/Div button 28 allows the user to set
the time scale (horizontal) in terms of time
per division. If the voltage varies over the
course of microseconds, this should be set to
approximately a microsecond per division.
Where the voltage varies over the course of
2162085
seconds, this should be set to approximately a
second per division.
The trigger setting button 30 permits the
triggering event that starts the scan to be
fixed by the technician. In a typical imple-
mentation, the scan is always set to begin when
the voltage increases above some predetermined
amount. Alternatively, the trigger button
could be configured to trigger on any other
condition. The trigger feature allows a stable
image to appear on the oscilloscope lO and
permits the capture of a rare event.
The live/stored button 32 allows the user to
adjust the stored reference signal, described
later, or the live image. When the button 32
is in "live" position, the other buttons act
to adjust the live signal display. When the
button 32 is in "stored" position, the other
buttons 24, 26, 28, 30 act to adjust the
display of the stored reference waveform.
The volts per division selected 33 is shown on
the upper right of the display 12. The time per division
selected 36 is displayed on the middle right and the
trigger level voltage selected 37 is displayed at the
lower right. The title of the test selected 40 is
displayed at the upper left and the frequency of the
signal acquired 42 is shown at the upper right of the
display.
As previously mentioned, the sensing and
displaying of electrical signals corresponding to each of
the dial positions frees the user from configuring the
oscilloscope. However, the user may still not be able to
interpret the displayed waveform, or know how it should
properly appear. To assist the user, a reference (i.e.,
2162085
exemplary) waveform corresponding to each test position
on the dial is shown on the display when the dial is
turned thereto. Each position on the dial corresponding
to a particular test selects a set of waveform data from
the internal memory of the oscilloscope which is repre-
sentative of the reference waveform to be displayed. The
oscilloscope then depicts this reference waveform on the
display. The waveform data preferably includes more than
merely the graphical image of the reference waveform.
For example, the waveform data should also include the
scaling data (voltage or current) and time duration data
to properly configure the oscilloscope to display the
reference waveform and to also properly display the
sensed (live) waveform. Additionally, the waveform data
should include the trigger level voltage and trigger
slope so that all the proper settings are available for
sensing and displaying the anticipated electrical wave-
form from the vehicle microchip or other test location.
In other words, the reference waveform data selected by
positioning the dial 14 will be displayed and the oscil-
loscope is properly configured to sense and also display
the "live" electrical signal corresponding to the refer-
ence waveform. Preferably, the reference waveform and
the live (actual) waveform are both displayed at the same
time. However, if desired, a toggle switch may be used
to select between the two waveforms. With both waveforms
available, the user may compare the live waveform with
the reference waveform to determine if the live waveform
is proper.
An alternative to the dial 14 is to use one or
more buttons to permit the user to scroll through test
options that are preferably simultaneously displayed on
the display and select the desired test. However, such a
display system requires the pressing of several buttons
to select the desired test and the user is more likely to
inadvertently select the wrong test than if a rotary dial
selector is used.
14 2162085
Referring to the operational flow diagram of
FIG. 2, as the user turns the dial to the desired posi-
tion a hardware interrupt 50 triggered by the dial is
received by a Software Executive Module 52 which includes
an Interrupt Handler 54 and an Executive Handler 56. The
Dial and Keypad Decoder Module 58 receives the interrupt
from the Software Executive Model 52 and then issues and
passes to the Reference Data Module 60 an interrupt with
a memory address corresponding to the graphical data for
the reference waveform, as indicated by the dial 14. The
Reference Data Module 60 uses the memory address to
access a reference data library located in memory within
the oscilloscope to retrieve the appropriate graphical
data. The Reference Data Module 60 then passes the
graphical data to the Graphic Display Driver and Update
Module 62 which communicates with a graphical display
microprocessor (not shown) by sending formatted data
thereto, which in turn displays the reference waveform on
the display 12. The graphical data also includes the
name of the reference waveform which is shown in the
upper left portion 40 of the display 12.
The Dial and Keypad Decoder Module 58 passes
data to the Analog-to-Digital Converter Set Up Module 64
to set the analog-to-digital converters in the oscillo-
scope. These converters select the proper voltage scale,time duration, trigger level voltage, and trigger slope
so that the input port 16 may properly sense the antici-
pated electrical signal and thereafter properly display
it on the display 12. The digital data from Set Up
Module 64 is passed to the Live Waveform Data Module 66,
which in turn properly formats the data for the Graphic
Display Driver and Update Module 62. The live data is
then passed to the display through the Graphical Display
Microprocessor. Both waveforms may be shown side-by-
side, or up-and-down, or superimposed on-top-of-each-
other on the display 12.
2162085
The terms and expressions which have been
employed in the foregoing specification are used therein
as terms of description and not of limitation, and there
is no intention, in the use of such terms and expres-
sions, of excluding equivalents of the features shown anddescribed or portions thereof, it being recognized that
the scope of the invention is defined and limited only by
the claims which follow.