Note: Descriptions are shown in the official language in which they were submitted.
1~ WO95/14431 2 ~ 7~4 7~ PCIIUS94113180
--COMPUTERIZED RADIOGRAPHIC ANALYSIS OF BONE--
Method and System for the Computerized Radiographic
Analysis of Bone
The present invention was made in part with U. S .
Government support under NIH grants/contracts CA48985 and
CA47043, Army grant/contract DAMD 17-93-~J-3021, and American
Society grant/contract FRA-390. The U.S. Guv, has
certain rights in the invention.
Technical Field
The invention relates generally to a method and system
for the computerized radiographic analysis of bone structure.
Specific applications are given for the analysis of the
trabecular mass and bone pattern for the assessment of
osteoporosis and as a predictor of risk of f~racture. Novel
techniques involve a directional analysis of the Fourier
spectrum relative to many texture measures. Additional
techniques include the a one-shot dual energy exposure for the
assessment of bone mass while simultaneously obtaining an
image for the texture analysis for bone structure.
Backqround Art
Osteoporosis is a widespread medical condition that
affects about 15 - 20 million people in the Ur~ited States and
accounts for about 1.3 million new fractures per year in
people greater than 45 years of age. Osteoporosis manifests
as a loss in bone mass, a tendency to fracture and as a
structural alteration of bone. Quantitative measures of bone
mass bone mass serve as important diagnostic indicators for
~1~t,-~;n1n~ the risk of fracture and in following the progress
of patients on therapy for osteoporosis. The most widely used
methods of assessing bone mass are by bone mineral
densitometry (BMD) that involves dual photon absorptiometry
with either an x-ray or nuclear source, and quantitative
computed tomography. These methods are very accurate in
determining bone mass, which has been shown to be a very good
.
WO 9~114431 PCT/US94/1328~
~177~7~
--2--
predictor of fracture risk in o~steoporosis. There is,
however, considerable overlap of the measurement3 of BMD for
patients with oEteoporosis who have, or go on to have
atraumatic fractures compared to age-matched controls who do
not have, or do not go on to have, atraumatic fractures. In
addition to bone mass, bone structure is probably also
important in determining the mechanical strength of bone and
thus fracture risk. A few pr~l ;m;n~3ry studies have been
perf ormed in relating certain textural measures to bone
structure.
Disclosure of the Invention
Accordingly, an object of this invention i8 to provide a
computerized method and system for the radiographic analysis
of bone structure and risk of future fracture.
Another obj ect of this invention is to provide a method
and system for texture analysis for use in quantitating the
bone structure and risk of future fracture.
Another obj ect of this invention is to provide a method
and system for incorporating directionality information in the
analysis of the bone structure ~texture).
Another object of this invention is to provide a method
and system for using dual energy imaging in order to obtain
measures of both bone mass and bone structure with one exam.
These and other ob; ects are achieved according to the
invention by providing a new and improved method and system
for the analysis of bone structure and future risk of
fracture. Specific applications are given for the analysis of
regions within the vertebral bodies on conv,ont;~ n~l spine
radiographs. Techniques include novel features that
characterize the power spectrum of the bone structure and
allow extraction of directionality features with which to
characterize the spatial distribution and thickness of the
bone tr;~hPc.~ . These features are then merged using
WO9~/~4431 ~ 7 8 PCTIUS94113280
--3--
artificial neural networks in order to yield a 1 ikf~l ;h~od of
risk of future fracture. In addition, a method and system is
presented in which dual-energy imaginy techniques are used to
yield measures of both bone ma9s and bone structure with one
low-dose radiographic examination; thus, making the system
desirable for screening (for osteoporosis and risk of future
f racture ) .
Brief Descri~tion of the Drawinqs
A more complete appreciation of the invention and many of
the attendant advantages thereof will be readily obtained as
the same becomes better understood by reference to the
following detailed description when considered in connection
with the accompanying drawings, wherein:
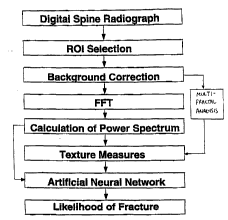
FIGl~RE 1 is a schematic diagram illustrating the method
for analysis of bone structure according to the invention;
FIG~RE 2 is a schematic diagram illustrating the
placement of ROIs on the vertebral bodies in digital lumbar
spine images.
FIGURE 3 is schematic illustrating corrections for the
possible n~nl; n~ nature of the detector system~ 8
characteristic response (~ ~ D curve for film) and for
background within t~e ROI image data.
FIGURE 4 is a ~chematic diagram illustrating the power
spectrum (with sectors indicated) obtained from the Fourier
transform of the corrected ROI image data.
FIGUR13 5 is a schematic diagram listing the various
measures including dir~ n~l; ty measures obtained from the
power spectrum of the image data.-
FIGURE 6 is a schematic illustrating some of the texturemeasures for nonosteoporotic ( "healthy" ) bone and for disea~ed
bone .
FIGURE 7 is a graph showing measures of bone mass for 43
patients: some with a fracture elsewhere in the spine and some
WO 95/14431 PCTIUS9411328~
~177~7~
--4 --
without fracture.
FIGTJRE 8 is a graph ahowing the relationship between BMD
measures (bone mass) and RMS variation (bone structure) for
patients: some with a fracture elsewhere in the spine and some
without f racture . - :
FIGI~R13 9 is a graph showing the relationship between BMD
measures (bone mass ) and f irst moment of the power spectrum
(bone structure) for patients: some with a fracture elsewhere
in the spine and some without fracture.
FIGURE 10 is a graph illu8trating the relationship
between RMS variation and f irst moment of the power spectrum
for ROIs selected from the L3 level for patients with and
without f racture elsewhere in the spine .
FIGURE 11 is a graph illus~rating the relationship
between the standard deviation of the angular dependence of
the RMS variation and the minimum value of the angular
dependence of the first moment of the power spectrum for ROIs
selected ~rom the L3 level for patients with and without
fracture elsewhere in the spine.
FIGI~R13 12 is a graph showing ROC curves calculated for
the measures of bone mass (BMD), RMS variation and first
moment of the power spectrum.
FIGURE 13 is a graph showing ROC curves calculated for
the measures of bone mass (BMD), the 9tandard deviation of the
angular dependence of the RMS variation and the minimum value
of the angular dependence of ~ the first moment of the power
spectrum .
FIG~RE 14 is a graph showing the average values for the
texture measures for cases with fracture elsewhere in the
spine and for cases without fracture.
FIGURB 15 is a graph indicating the performance of the
individual texture measures in the task of distinguishing
those cases with fractures elsewhere in the spine from those
without fracture.
FIGURE 16 i8 schematic diagram of the artificial neural
WO 95114431 PCrlUS94113280
~1774~
~;
network used in merging the various bone structure f eatures
into a 1 i k--l i hnod of risk of future fracture.
FIGURE 17 is a graph showing ROC curves calculated for
three neural network combinations. Two of the combinations
include measures of both bone mags and bone structure; one of
the combinations includes only measures of bone structure.
FIGURE 18 shows two graphs indicating the histogram
(distribution) of the output values from the art;f;ri~l neural
network for two of the neural network comb;n:~;nn~.
FIGURE l9 is a schematic block diagram illustrating a
system for impl - - ; nJ the method for the computerized,
radiographic analysis of bone structure and risk of future
f racture .
FIGURE 2 0 contains tables showing the ef ect of pixel
size on four of the texture measures in terms of Az in
predicting fracture elsewhere in the spine.
FIGURE 21 is a schematic illustrating a method for the
measurement of both bone density (bone mass) and bone
structure from a single-projection, dual-energy radiographic
image of the some bony body part such as the spine, hip or
extremities according to the invention.
FIGURE 22 is a schematic diagram illustrating two
possible methods of obtaining the dual-energy radiographic
images .
FIGURE 23 is a schematic diagram illustrating two
possible methods for energy subtraction as it relates to the
measures of bone mass.
FIGURE 24 is a schematic diagram illustrating one
possible calibration method for measuring bone~ mass from
dual-energy images, including compensation or the heel effect
and calibration for body thickness.
FIGURE 25 is a schematic diagram illustrating a
calibration phantom and its positioning during a patient exam.
FIGURE 26 is a graph showing the rPl~;nnqh;r between
gray values obtained f rom low and high energy images of a
Wo 95/14431 PCr/US94/~3280~
217747g
--6--
lucite phantom; illustrating the calibration method.
FIG~RE 27 is a graph showing the relat;r.n~h;E~ between the
measured values for bone mass (from a BMD phantom) and the
accepted values for the particular phantom, and thus
indicating the potential for Using the technique for measuring
bone mass (along with bone structure).
FIGI~RE 28 is a schematic block diagram illustrating a
system for impl~mPnt;n~ the method for the radiographic
analysis of both bone mass and bone structure, and thus, risk
of future fracture.
Figure 29 illustrates the logarithmic relat;rnqh;r
between "surface area" and effective pixel length for a ROI.
Two distinct linear portions are demonstrated and each is
fitted with a straight line of different slope, which is used
to calculate fractal dimension.:
3eet Mode for CarrYinq Out the Invention
Referring now to the drawings, and more particularly to
Figure l thereof, a schematic diagram of the analysis of bone
structure is shown. In this example, the aim is to extract
the characteristics of the bone trabeculae using texture
analysis of image data from digital images of bony parts of
the body such as the spine. The overall scheme includes an
initial acquisition of a radiograph of the spine (step l0) and
digitization (step 20) (or a direct digital acquisition of the
radiographic image of the spine) . A region of interest (ROI)
is then placed over a vertebral body on the image and the
corresponding image data are stored in memory (step 30).
Background trend correction (step 40) is performed to yield
the underlying fluctuations, i.e., the trabecular pattern.
The image data in the ROI are then input to a Fast Fourier
Transfcrm (step 50) and the power spectrum is calculated (step
60). Various textures measures are calculated from the power
spectrum data (step 70) and these are merged using an
9~ 431 ~ ~ 7 ~ ~ 8 PCTIUS94113280
--7--
artificial neural network (step 80) to yield a 1 ;k~l ;h~od of
risk of future fracture (step 80). Other texture analyses can
be used such as fractal analysis.
Figure 2 illustrates the placement of ROI6 on the
vertebral bodies in the digital lumbar spine images. Shown
here are ROIs, 64 pixels by 64 pixels in size, placed at the
L2, L3, and L4 levels on th~ splne. Pl ~ t is performed
such that the ROIs avoid overlapping edges, bowel gas, and
soft tissue folds. In general, ROIs placed at the h3 level
had the least interference from edges and bowel gas, and thus
precise placement of the ROIs within the vertebral body is not
necessary at the L3 level.
Figure 3 illustrates the corrections for the possible
nr~nl;n~l~ ~ature of the detector's characteristic response
(the H & D curve for radiographic films as detector) and for
the background trend within the ROI image data. Background
trend connection is necessary since the variation in optical
density within the ROI in spine images includes that due to
the gross anatomy of the human body and to the presence of
bowel gas (background treads ) and that due to the f ine
underlying texture which is related to the trabecular pattern
of the bone The nonuniform background trend can be
determined using a 2-dimensional surface fitting technique
(such as one with a second degree polynomial function). The
f itted trend is subtracted f rom each ROI in order to yield the
underlying f luctuations, i . e ., the trabecular pattern .
Figure 4 illustrates the power spectrum of ROI image
data. The axes are in terms of spatial frequencies. It
should be noted that strictly speaking, however, the power
spectrum needs to be determined from an ensemble average of
the square of the Fourier transform over an infinitely large
area. The sectors indicate the method used in dividing the
power spectrum into pie-shaped sectiorls. Texture measures are
calculated for the entire power spectrum as well as for the
individual sectors, thus, yielding directionality measures.
Wo 95/14431 PCT/US94/132~0~
~ 77~ 7~
--8--
The power spectra of the trabecular bone pattern may contain
low-frequency components due to~some residual uncorrected
background trend and very high-frequency components due to
radiographic mottle in the original bone radiographic image.
Thus, the power spectra may be f iltered by the human visual
system response function with acts as a band-pass filter.
Figure 5 is a schematic diagram listing the various
measures obtained from the power spectrum data. The texture
analysis process initially involves two measures: the
root-mean-square (RMS) variation (R) and the first moment of
the f iltered power spectrum (M), which represent the magnitude
and the coarseness of trabecular pattern, respectively. These
measures are given by
_ _ .
R= ~ JJ V2 (U, V) ¦F(U, V) 12dUdV
..
JJ~/u2+v2v2 ( u, v) I~(u, v) ¦2dudv
M=
J-J~V2 (u, v) ¦F(U, V) 12dUdV
..
where V(u,v)and F(u,v) correspond to the visual system
response and the Fourier transform of the trabecular pattern,
respectively. Higher moments of the power spectra can also be
calculated. Xigher moments are.not conceptualized visually as
easily as the rms variation and f irst moment values, however .
Due to the strong directional appearance of trabecular
patterns, the RMS variation moments of the power spectra will
be calculated also as a function of angle in the Fourier
domain as given below by the inegualities and tables.
~ Wo95/14431 ~ 47~ PClrUS94113280
_g_
Angular dependence of R~tS variation:
31 5 ~3 < ~32) =,~2 ~ ¦Fm,n¦2 f~ ~31 s tan~1 ( n ) < 132
Angular ~ r~n~n~e of Fir~t Mo~ner t
of the Power Spectru~L:
~ 2 ~ Fm, n l 2
Me(el S ~3 < ~32) 2 2 ¦F 12 fo~ ~31 s tan 1( m) < ~32
m n
The angul~r dependence of the two measures (RMS and FMP) are
~mi n~l by dividing the power spectrum into several sectors
and performing the summations within each sector. From
studies, we have found that those with fracture elsewhere in
the spine exhibit a higher minimum value of the angular
dependence o~ FMP. By taking the minimum value we force the
directionality measure (i e., perpendicular to the trabeculae)
for normal patients since the bone trabeculae without
osteoporosis is assumed to not show a "washed-out" appearance
and thus the directionality is strong as schematically shown
in Figure 6. Since the trabeculae are not "washed-out" for
normal patients, their spatial distribution would contain
lower frequency struc.ures in a direction perpendicular to the
trabeculae. Osteopor~tic patients would tend ~o exhibit a
more isotropic distribution due to the washed-out appearance
of the trabeculae Edge gradient analysis on the ROI data can
also be performed to extract the direction perpendicular to
the major trabeculae. The angle exhibiting the largest
cumulative edge gradient i9 expected to indicate the direction
perpendicular to the major trabeculae within the ROI. In
addition, due to the possibility that quantum mottle and x-ray
scatter may "hide" the underlying texture pattern of the bone
trabeculae, the power spectra of uniform tissue regions within
wo 95/14431 PCTiUS94/13Z8~
~7~
--10--
the medical image are also -determined and used to normalize
the power spectra obtained from the ROIs in the bony regions,
prior to calculation of the texture measures. These analyses
are expected to be useful in analyzing both the primary
(apprnlr;m-t~oly horizontal) trabeculae and the secondary
(approximately horizontal) trabeculae and the secondary
(approximately vertical) trabeculae.
Studies were done using 43 patient cases in which some
had a f racture elsewhere in the spine and some did not . This
method for evaluation was used~since the texture measures here
are being ~ ml n~l at one point in time and it has been shown
that the presence of pre-existing vertebral body fractures is
a powerful predictor of future risk for vertebral body
fracture. Figure 7 is a graph~showing the distribution of BMD
measures (bone mass) for patients with fracture elsewhere in
the spine and for those without fracture. Notice that the BMD
values are low in nearly all the fracture cases as expected;
most of the nonfracture cases also, however, have low BMD
values, thus, demonstrating the need f or a measure with higher
specif icity .
Figures 8 and 9 demonstrate the relationships between BMD
measures (bone mass) and the RMS variation for the same
ri~tion~c and between sMD and the first moment of the power
spectrum. It is apparent that there is not a strong
correlation between bone mass and bone structure using at
least these measures for bone mass and bone structure. Note
that in the following example, normalization of the power
spectra was not included.
Figure lO is a graph illustrating the r.ol~t;nn~hiE,
between the RMS variation and the f irst moment of the power
spectrum for ROIs selected from the L3 level for patients with
and without fractures elsewhere in the spine. It is apparent
that patients with fractures elsewhere in the spine tend to
have a high f irst moment measure and a low RMS variation .
Figure ll is a graph illustrating the relationship between the
WO 9511~1431 PCTIUS9~1~3~8û
~77~78
--11 -
standard deviation of the angular dependence ;of the RMS
variation and the minimum value of the angular ~ rPnf~nr~ of
the first moment of the power ~pectrum for ROIs selected from
the L3 level for patients with and without fractures elsewhere
in the spine.
Figure 12 is a graph showing ROC curves calculated for
the measures of bone mass (BMD), RMS variation and first
moment of the power spectrum, Here the ROC analysis was
performed with respect to the task of determining whether or
not the patient had a fracture elsewhere in the spine. The Az
values (area under the ROC curve) for RMS variation and the
first moment are superior when compared to the Az value for
the measure of bone mass (BMD). Figure 13 is a graph showing
ROC curves calculated for the measures of bone mass (BMD), the
standard deviation of the angular ~r~ntl~nre of the RMS
variation and the minimum value of the angular dependence of
the first moment of the power spectrum.
Figure 14 is a graph showing the average values for the
texture measure~ for cases with fracture elsewhere in the
spine and for cases without fracture. Note that the values
have been normalized between O a~d l. Figure 15 is a graph
indicating the performance of the individual texture mea~ureg
in the taak of distingui~hing tho9e cases with fracture
elsewhere in the spine from those without fracture. Note the
higher the Az value the better the performance.
Once the texture measures are calculated they can be
merged using an artif icial neural network in order to yield a
l; k~l; h-~od of future risk of fracture . Figure 16 is a
schematic diagram of the artif icial neutral network used in
merging the various bone structure features into a 1; k,ol ' h~od
of risk of future fracture.
Figure 17 is a graph ahowing ROC curves calculated for
three neural network combinations. Two of the combinations
include measures of both bone mass and bone atructure; one of
the combinations includes only measures of bone structure.
Wo 95/14431 PCrlUS94/13280~
2~7~7g
--12 -
Figure 18 shows two graphs indicating the histogram
(distribution) of the output values from the artificial neural
network for two of the neural network combinations. The
output f rom the neural network can be thresholded so that only
cases with a certain value from the neural network output are
noted as having a higher risk for future fracture.
Figure 19 is a more detailed schematic block diagram
illustrating a system for implom~nt;n~ the method of the
invention for analysis of the bone trabecular structure.
Referring to Figure 19, radiographic images of an object are
obtained from an image ac~[uisition device and input to the
system 1000. Each bone image is digitized and put into memory
(1001). If the radiographic image is obtained with a direct
digital device ~then there is no need for digitization. The
image data i5 first passed through the ROI selection circuit
(1002), the nnnl ;n~Ar detection system correction circuit
(1003) and the background trend~correction circuit (1004).
The data is passed to the FFT circuit (1005) and the power
spectrum circuit (1006). Power spectrum data are passed to
the texture measure circuit (1007) and to the optional ANN
circuit (1008) in order to determine the l;k~l;hnod for risk
of future fracture, during which time the data are retained in
image memory (1009). In the superimposing circuit (1010) the
resultE are either superimposed onto images, stored in file
format, or given in text format The reæults are then
displayed on the display system (1020) after passing through a
digital-to-analog converter (1030).
The particular image ac~uisition system used may affect
the texture measures, so the ability of the computerized
scheme to assess osteoporosis and risk of fracture as a
function of pixel size of the digitization system was
investigated. Use of a smaller pixel size allows higher
spatial frequency components to be f~ m; n~, The results
shown earlier were obtained from digitization of film at a
pixel of 0.175 mm with 10-bit c~uantization. If the texture
WO 95/14431 PCrlUS941S3280
~177~8
--13--
meaaures can still be reliably obtained at larger pixel size
then direct digital systems for imaging the bone will be more
easily produced. Figure 20 1-f~nt~1 nF: tables showing the effect
of pixel size on four of the texture measures in terms of Az
in predicting fracture elsewhere in the spine. Results are
given for variations in the aperture size (blur) and sampling
distance for the same 43 cases used in the earlier samples.
Figure 21 i8 a schematic illustrating a method for the
mea~u~ n._llL of both bone density (bone mass) and bone
structure from a single-projection, dual-energy radiographic
image of some bony body part such as the spine, hip, or
extremities according to the invention. Such a system
produces a high-energy image and a low-energy from either a
"one shot" exposure techni~ue that employs two detectors
sandwich together or a ~two-exposure~ technigue that l~t; 1 i '7~R
two exposures to the patient. Figure 22 is a schematic
diagram illustrating two possible methods of obtaining the
dual energy radiographic images. Such systems utilize ~energy
subtraction" tl~hn; q~ to yield "bone-cancelled~ images and
~'soft-tissue-cancelled" images. Such "dual-e~ergy" systems
have been developed for moderately-high-spatial-resolution
imaging of the soft tissue in chest and for very-low-spatial-
resolution ac~uisition of bone mass (BMD) in, for example, the
spine. However, such "dual-energy~ systems have not been
developed for moderately-high-spatial-resolution imaging of
bone due to the large amount of quantum mottle that results in
the bone image (i.e., the soft-tissue-cancelled image).
Moderately high spatial resolution is desirable for the
analysis of the bone structure, though in the past, only bone
mass was of interest, and thus, the low-resolution system was
acceptable. However, now with the new method presented
earlier in this invention application that yields measures of
bone structure, it is desirable to have a system that can
measure both bone mass and bone structure (as opposed to
subjecting the patient to two examinations: one for bone mass
Wo g~/14431 PCrll~ss4/13280~
~7~78 -14-
(BMD) and one for bone structure (spine radiograph). The
following presents such a system using computed radiography as
the detector in the example. However, the method is not
limited to computed radiography as the detector.
Computed radiography (CR) is a digital radiographic
imaging system that uses plates consisting of BaFBr phosphor,
a st; 1 ~hl e phosphor, to image the radiographic x-ray image .
The pixel value in a CR image can be converted directly into
x-ray exposure. The method uses dual-energy computed
radiography (CR) imaging to obtain bone mass in a manner quite
similar to that of DXA (BMD). Differences include a
dependence on scatter due to the fact that conv-~nt;~n~31
radiographic spine images are obtained with a broad area beam
whereas the DXA scans are obtained with a low-resolution,
pencil-beam geometry. However, the CR images are of high
spatial resolution thus allowing for the low-energy image to
be used f or the texture measures of bone structure . Note that
texture analysis is not possible on the tissue-cancelled
images due to the presence of large quantum mottle (and the
inability of increasing the exposure a lot due to patient does
considerations). The measure for bone mass is performed in a
way that the region on the bone image that encloses the
spongiosa will be integrated. All this accomplished with just
one examination.
In this example, dual-energy bone images of the spine,
hip and extremities are obtained using the CR system and the
"one-shot" e~ ,UU:--UL~: technique. The method uses conv~nt~on;,l
x-ray equipment to produce "bone" and "soft tissue~ images in
exact temporal and spatial registration with a single x-ray
exposure. Use of the one-shot technique eliminates motion
artifacts between the high- and low-energy images and also
avoids rapid switching of the x-ray tube voltage.
With the one-shot technique, it is advantageous ~or the
input x-ray spectrum to be double peaked. Thus, K-edge
filtration is used to a produce double-peaked x-ray spectrum.
~ WO 95/14431 2. 1 ~ ~ 4 7 8 PCrlUS94113280
--15-
The CR plates con6ists of BaFBr phosphor, and thus the broad
beam x-ray spectrum emitted from the x-ray tube is prefiltered
80 that the absorbed spectrum for the ront CR plate will peak
in the region of high barium attenuation coefficient. A
prefilter of 300 mg/cm2 ~ l;n;um can be used. In order to
compen3ate for the attenuation of the x-ray tube output by the
K-edge prefilter, the tube loading (mAs) of the x-ray tube is
increased.
Another f ilter is sandwiched between two imaging plates
(made of the stimulable phosphor) having wide exposure=
latitude characteristics. The front CR plate~ of the 6andwich
prefPrPnt;Al]y absorb low-energy x-ray photons and transmits
high-energy photons. The high-energy photons are absorbed
partially in tl1e back plate yielding two simultaneously
acquired images with different effective energies. The filter
serves to increase the effective energy of the x-ray spectrum
incident on the second imaging plate. Readily available
materials for this filter are copper foil or the CR plates
themselves (which contain barium). In the result6 pre6ented
later in thi6 application, the filter consisted of two CR
plate6 (200 mg/cm2 BaFBR) for thi6 intermediate filtration.
Figure 23 is a 6chematic diagram illu6trating two
pos6ible methods for energy subtraction as it relates to the
mea6ure6 of bone mass. In method A, the low-energy image and
the high-energy images are first registered, passed through
energy subtraction and then ROIs in the bone image that are
within the vertebral body are integrated to yield a measure
related to bone mass. In method B, the low-energy image and
the high-energy image are each 6eparately 6ubj ected to ROI
placement and integration, and then a weighted 6um of the two
integrated value6 (with correction6 for patient body size,
scatter radiation present, etc. ) i6 calculated to yield a
mea6ure related to bone ma6s. An advantage of method B, is
that image registration in the conventional (high resolution)
sense is not nPcPP~ry. However, a way (such a6 manual
Wo 9~114431 PCTrUS94rl3281~
2~ ~7~
-16 -
placement) to insure location of corresponding lumbar ROIs on
the low and high energy images i8 necessary. In this
application, are presented results using bone ~hAnt. ~. The
pair of digital images, obtained f rom the two CR plates in the
sandwich cassette, are read digitally by the CR 3ystem.
Figure 24 is a schematic diagram illustrating one
possible calibration method for measuring bone mass from dual-
energy images, including compensation for the heel effect and
calibration for body thicknees. Figure 25 is a schematic
diagram illustrating a calibration phantom and its positioning
during a patient exam. In the example, two phantoms were
used. One of these rh~nt~ is used to calibrate and consists
of three cylinders of synthetic bone material. The other
phantom was also made of synthetic bone, but was shaped to
look like f our lumbar vertebrae and encased in lucite . Lucite
was added to the top of the ~h;lnt,_ to simulated additional
soft tissue, i.e., patients of varying thickness. The
rh;~nt~ ~ were imaged with the one-shot, dual-energy technique
and quantities such as thickness of lucite and energy of the
x-ray beam were varied in different trials.
Figure 2 6 shows graphs of the relationship between gray
values obtained from the low and high energy images of the
phantom. The linear fit of these data is used to determine
the weights for the weighted sum of the integrated value of
the ROI on the low-energy image with that of the ROI on the
high-energy image. Values form these graphs are then used in
a look up table for different imaging techniques (i.e., kVp)
and for patients of different thicknesses. The value obtained
from the weighted sum is related to the bone mass. In a
particular region of the image, both bone and soft tissue
contribute to the attenuation of the x-ray beam. The amount
proportional to the thickness of the bone can be ~tPrmlnPrl by
a weighted sum (or could be thought of as a weighted
subtraction), pixel by pixel , of the high and low energy image
data, namely,
Wo 95/14431 ~ ~ 7 ~ PCTIUS94113280
--17-
B(x,y) = L~x,y) - W-X(x,y),
where x,y i8 the location of the pixel, and L and H are the
values in the low and high energy images, respectively. W is
the weight ~t~ n~d from the slope of the linear fit, as
demonstrated in Figure 26. For bone mass, the integration of
a region on a bone-only image is of interest. Thus, the
method either does the weighted summation on the image data as
shown in the above equation and then integrates on the noisy
bone image (in which it may be difficult to define edges of
the bone, such as the edge of the vertebral body) or
integrates on the low-energy and high-energy images separately
prior to the weighted summation, namely
B = sum over ROI of [L (x, y) ] - W sum over ROI of
[H (x, y) ],
where B here is proportional to the bone mass within the ROI.
The edges of the vertebral bodies are easier ~ 1; n~ t~t:l on
both the low-energy and high-energy images, thus making
locating the ROI ea3ier
Figure 27 i8 a graph showing the relationship between the
measured values for bone mass (from a BMD phantom) and the
accepted values for the particular phantom, and thus
indicating the potential for using the technique for measuring
bone mass. Since the measured values are not scaled, one can
only look at the general trer,d of the data. The measured
values from the weighted sum of the integrated ROIs from the
low- and high-energy images follow the same order as does the
BMD measure8 obtained from a Lunar DPX system. This is
especially BO in the images with only l0 cm of lucite on top
of the phantom. Those with 20 cm were less stable, as
expected due to increased scattering. This can be improved
with the use of better antiscatter grids in the radiographic
protocol or with a direct digital acquisition device (which
have been shown to be 9996 in scatter rejection).
The computerized texture analysis for bone structure
(that was presented earlier in this applicatiorl) is then
Wo 95/14431 PCTNS94/1328(~
-18 -
performed on the low-energy images in order to measure the
quality and architecture of the~ bone trabeculae. The texture
measures are not det~rm; nf~d on the bone images (i . e ., tissue-
cancelled images) since the large amount of radiographic
mottle can "hide" the underlying texture of the bone
structure Thus, this dual-energy technique allows
quantization of both bone mass and bone structure, as
demonstrated earlier in Figure 21.
Figure 28 is a more detailed schematic block diagram
illustrating a 3ystem for implementing the method of the
invention for analysis of both the bone mass and the bone
trabecular structure. Referring to Figure 28, two
radiographic images (low-energy and high-energy) of an object
are obtained from an image ac~uisition device and input to the
system 2000. ~ach bone image is digitized and put into memory
(2001). If the radiographic images are obtained with a direct
digital device then there is no need for digitization. The
image data are first passed through the ROI s~lect;~-n circuit
(2002), the nonlinear detection~ system correction circuit
(2003), and is then passed to the entry circuit for bone mass
(2004) and to the entry circuit: for bone structure (2005) .
For bone mass, the data are passed to the integration circuit
(2006) and calibration circuit (2007). From there, the data
are passed to the weighted sum circuit (2008) and saved in
memory ~2009). For bone structure, the data from the low-
energy image are passed from 2005 to the background trend
correction circuit (2010). The data is passed to the FFT
circuit (2020) and the power spectrum circuit (2030). Power
spectrum data are passed to the texture measure circuit
(2040). Measures of both bone mass and bone structure are
then passed to the ANN circuit (2050) in order to determine
the 1 ;kr~ od for risk of future fracture, during which time
the data are retained in image memory (2060). In the
superimposing circuit (2070) the results are either
superimposed onto images, stored in the file format, or given
_
~ WO g5/1443l 217 7 ~ 7 g PCTIUS94J13280
-19-
in text format. The results are then displayed on the display
system (2080) after passing through a digital-to-analog
converter (2090).
Fractal analysis has also been pr~l ;m;n~rily investigated
as a means of analyzing the bone texture. U3ing the bone ROIs
shown in Fig 2, the surface area of each of the ROIs was
computed at 7 different levels of resolution using pixel gray
level analogously to height in the f ractal calculations .
Different levels of resolution (pixel length) were obtained by
successively averaging larger and larger groups of adjacent
pixels. Figure 29 shows the log plot of surface area vs.
pixel length for one ROI. The presence of the two distinct
linear portions suggests a multifractal structure. Slopes of
the overall graph of each ROI, as well as the slopes of each
of the two portions of each graph were then used to obtain an
estimate of the overall fractal dimension as well as an
estimate of the fractal dimension at stronger and weaker
levels of resolution corresponding to the 2 distinct portions
of the graphs. Using ROC analysis with the fractal dimension
of each ROI as the decision variable, the Az obtained using
overall fractal dimension was 0.65, using the fractal
dimension at the finer resolution portion was 0.76 and using
the ractal dimension at the coarser resolution was 0 . 87 as
compared to an Az of O . 6 obtained using BMD.
Multifractional analysis can also be used to characterize
the bone texture within the ROIs. The fractal dimension of
these ROIs will be estimated using a surface area technique,
modified from one described for the computerized analysis of
_ dl,l8. The gray level of each pixel will be regarded as
a ~height'~ with pixel size as "length'~ and "width" to
calculate a "surface area~ for each ROI. Adjacent pixels will
be then combined to yield an ef f ectively larger pixel size
with a new gray level averaged from the3e combined pixels. A
new "surface area" will be calculated for each ROI, and the
process will be successively repeated, combining adj acent
WO 95/14431 PCr/US94/13280~
~1 7~ 7~
--20 -
.
pixels from earlier steps, and calculating the resultant
surface area for each new effective pixel size. The fractal
dimension (D) for each ROI is calculated, using:
D = 2 - H
where ~I is the slope of a least-s~uares line fitted to a plot
of log surface area versus log l?ixel size for each ROI. The
number 2 is the topological dimension of the gray level
surface. The plot (as we have found) may exhibit a
multifractal nature by indicating two linear regions - a
textural (fine) fractal dimension and a structural (coarser)
f ractal dimension . Both the f ine and the coarse fractal
dimensions can be used as texture measures.
In two prsl; m; n~ry studies using separately the ROIs of
the spine described above and ROIs from normal and
osteoporotic hands, artif icial neural networks (ANN) were
employed. The input to the neural network was the normalized
power spectrum data from the background-corrected ROI. Using
ROIs of size 32 by 32 pixels, the successful ANN c~nt~;n.od 512
(32 * 16) input units, 40 hidden units and one output unit.
The value of the output unit served as the ~r; A~ ~n variable.
The ANN was trained using an output of l for abnormal
(osteoporotic) and O for normal. Using the 43 cases, the ANN
successfully classified all abnormal ROIs as osteoporotic.
Artif icial neural networks (ANN) can also be applied to
the differentiation of texture patterns of bone trabeculae.
ANN is a non-algorithmic approach to information processing.
Unlike many artif icial intelligence techni5~ues, which require
extensive knowledge of the many parameters involved, ANNs
learn directly from examples that are provided repeatedly.
Once trained, a neural network can distinguish among input
patterns on the basis of its learning experience. The
analysis of the texture patterns will be performed using the
image data in the spatial f re~[uency domain in order to
~1 ;m;n~te the ghift-variant nature of the image data. The
ROIs will be evaluated by calculating the power spectra by
O 95/14431 ~ 8 PCTIUS94113280
--21--
Fourier transformation of the background-corrected ROIs and
scaled. The scaled power spectra will then he used as input
to the neural network. Thus, for ROIs of size 32 by 32
pixels, the resulting number of input units is 16 by 32; due
to the symmetry in the Fourier transformation and subsequent
calculation of the power spectrum. A three-layer, feed-
forward neural network can be used with one output unit. A
back-propagation algorithm with generalized delta rule will be
employed in the training process. The input, which
corresponds to the corre9ponding power spectrum, is provided
to the input layer of the neural network. The desired output
(truth) is provided to the output layer during the training
process. The hidden layer, which is the key element in
mapping of the input patterns to the output values, is located
between the input and output layers . A nr~nl ' n~;3~ logistic
function will be used as the activation function for each
processing unit in the neural network, in which
P~ 1 + exp(21w~iOp~+~
where OPi is the j th element of the actual output pattern
produced by the presentation of input pattern p, w~i is the
weight from the ith to the jth units, and ~ is the threshold
of the jth units. in the training procesg, the ;nt~n;,l
parameters of the connections between layers ( including
threshold values of each unit) are aajusted iteratively so
that the difference between the output values and the desired
results is minimized. This can be accomplished by the
following rule:
aw~i (n+l) = ~ pPpi) + ~w~i (n),
where n indexes the number of iterations, 71 is the learning
rate, ~p~ is the error signal, which is related to the
dif f erence between the output of the neural network and the
desired output, and ~ is a ~ u"~ term that determines the
effect of past weight changes on the current direction of
wo 95/14431 PCTIUS94/1328~
~17~78
--22--
,v~ t in weight space. The desired ~'truth~ for use in
training the ANN will initially be either a 1 or a 0, where 1
correeponds to the patient having a fracture elsewhere in the
spine and 0 corr~p~ n~1;n~ to the patient not having such a
f racture .
Obviously, numerous modifications and variations of the
present invention are possible in light of the above
techni~ue. It is therefore to be understood that within the
ecope of the appended claims the invention may be practiced
otherwise than as specifically described herein. Although the
current application is focused on radiographic medicinal
images, the concept can be -~n~-d to segmentation in other
imagee of the human body.