Note: Descriptions are shown in the official language in which they were submitted.
~17777~ 3333~CA
NON-UNIQUE SEISMIC LITHOLOGIC INVERSION
FOR SUBTERRANEAN MODELING
This invention relates to combined lu.u~,cs,i..~ of seismic data and
lithologic dat~, amd more 1)~ , to a computer program- ~ ' ' method
for modeling ~ ll; f~ nc using synthetic s~ gr. 1~, and wherein
perturbation t~hni~l~ P~ are applied to ~"1 llrl I ;~ models.
BACKGROUND OF THE INVENTION
For many years seismic ~ . ", - ;. .., for oil and gas has mvolved the
use of a source of seismic energy and its reception by an array of seismic
detectors, generally referred to as geophones. When used on land, the source of
seismic energy cam be a high explosive charge electrically detonated rn a borehole
lû located at a selected point on a terrain, or another energy source having capacity
for delivering a series of impacts or - 1 ^ I vibrations to the earth's surface.
33334CA
217777~
The acoustic waves generated in the earth by these sources are ~ -";llrd back
from strata bo--n~ and reach the surface of the earth at varying intervals of
time, depending on the distdnce and the .I,A.,..Ir,i~ s of the s~lhsllrf~e
traversed. These returning waves are detected by the ~.oophf.n~c, which function
5 to transduce such acoustic waves mto ~ live electrical signals. In use an
array of geophones is generally laid out along a line to forln a series of observation
stations with-in a desired locality, the source injects acoustic signal into the earth,
and the detected signals are recorded for later processing usmg digital computers
where the data are generally quamtized as digital sample points such that each
10 sample point may be operated on mdividually. Accu-dil.~ly, seismic field records
are reduced to verlical and horizontal cross sections which ~ lULilll~lt~ ~"l.~, r~ e
features. The geophone array is then moved along the line to a new position and
the process repeated to provide a seismic sulvey. More recently seismic surveys
imvolve geophones and sources laid out in generally rectangular grids covering an
15 area of interest so as to expand areal coverage and enable construction of three
lim~ nci~)n~l views of reflector positions over wide areas.
It is also well known to employ well logs, such as wireline well logs,
to accurately determine valuable p~llu~ ,dl properties associated with a
~b(~ I formation of interest. reilu~ h,dl properties of ~ r~,A..~
20 f~A,rmAti~-nc which cam be obtained from well logging or core sample operations,
33334CA
217777~
such as porosity, water or hydrocarbon saturation and lithologic composition, also
give valuable inf~ qti~ n in ~' ~ the presence and extent of hydrocarbons
in the area of interest. Such well logs and core data, however, are very limited in
areal extent e.g. to about six to twelve inches around the borehole in which the
t;lllt;lltv were taken. ~urther the petrophysical properties of a vul-i ~
formation can vary widely at different locations in the formation.
If there is a well within an area to be seismically surveyed, depth
well logs of direct ..ea,tu, of geological information may be made. ~or
cxample, from the sonic and formation density logs, a synthetic time scale seismic
10 trace may be computed. The synthetic seismic trace is useful for ~lr~ .g
to the geophysicists what a seismic time scale trace should be in the presence of
the geologic conditions near the well. As used herein a synthetic seismic trace is
an artificial seismic signal developed m~fh^--qtir.:llly from a model of v .1,~... r~,t..
strata and an assumed signal source. At,ctvl~lh.~ly, multiple synthetic traces can
15 be developed by using petrophysical properties measured at the well as an initial
model (or reference point) and making desired perturbations to the measured
vublt properties to obtain model traces which are lt,~lt~ talivt~ of the
lithology near the borehole. This perturbation technique can be expanded to
suggest lithologic models farther away from the borehole. Therefore, additional
20 synthetic traces, which are sometirnes herein referred to as model traces, may be
33334CA
217777~
computed which typify a forward model, i.e. the lithology at some horizontal
distance from the borehole.
While synthetic seismic traces may readily be calculated based on
actual lithologic data or assumed perturbations to the lithologic data, these traces
5 are subject to certain 1imit~tion~ For example, a formation made up of a 30 ft
thick sand having a porosity of 15% could produce the same synthetic seismic
trace as a 10 ft thick sand formation having a porosity of 30%. Accordingly, there
exists a r . I of seismic traces with respect to reseIvoir structure. In the
past seismic lithologic inversion techniques have either: (I) directly Ll ~ -
10 a seismic trace mto a pseudo-log (usually ;"~i,e~ ) via some algorithm such as
trace mtegration, deconvolution or solution of ' - equations, or (2)
iteratively perturbed models, for forward modeling, on an individual trace basis
umtil synthetic traces generated from them ~IPI. Iy matched the actual seismic
data. Since both of these methods fail to address the non . ~l~n~ limitation
15 of synthetic seismic traces with respect to reservoir acoustic properties, confi~l~ni~e
in the reservoir models based on these synthetic traces is lacking.
In the inverse case, from a recorded time-scale seismic trace or a
synthetic seismic trace, and assuming certain initial cf.n~liii~ , one can derive a
depth scale well log showing lithologic data. Such a derived well log may be
20 termed a pseudo-log. As used herein a pseudo-log is an artificial log of shale
33334CA
217777~
volume, porosity, pay flag, water saturation, sonic or density which may be
derived by inverting a seismic trace based on assumed petrophysical properties or
by perturbing petrophysical properties of an initial well log. While pseudo-logs
may be readily calculated based on a seismic trace, these pseudo-logs are also
5 subject to non- mi,l in the ~ rO~ liOn of petrophysical p~ to
acoustic imre~li^n.^c
In activities such as reservoir mapping, ~ll~;ill~tlillg production
simllh tion and horizontal drilling, detailed ' information about the
thickness, geomet[y, porosity, shaliness, l~y(L~,.,Abu~l saturation, and permeability
10 of reservoir rock formations is required. This data is needed in areal spacings of
thirty to three-hundred feet, however, borehole penetrations are usually thousands
of feet apart in reservoirs. Three--lim~n~inn~l seismic surveys take ~"l.~... r~
readings at areal spacings of tens of feet and so can help guide the creation of the
~lrulr ~ ;...lr~l p~ lly~;~dl maps if the seismic trace records can be matched to
15 pseudo well logs.
Therefore a need remains to accurately convert the c ,mhinqtion of
lithologic data and seismic data into detailed displays of reservoir rl~ rl i~ ^s
such as porosity etc.
33334CA
2~77771
Accordingly, it is an object of this invention to utilize seismic data
irl providing displays of various ~ rl~ reservoir characteristics over
relatively wide regions.
Arlother object is to merge the ;ll~ lr.l~lr.l~ knowledge of the
5 geologist, geophysicists and the p~llu~ rah~i~la into a method for predicting
reservoir rh~r~ri~tirs
Arlother more specific object of this invention is to create a catalog
of synthetic time scale seismic recordings that bracket the lithology of the studied
region.
A further object is to match pseudo well logs and seismic data.
Still another more specific object of this invention is to provide a
lithologic model of a portion of the ~ 1l earth showing sufficient
resolution of ~ Ir- ;~l ;r~ to guide drilling of extended horizontal wellbores.
A still further object of this invention is to produce a computer
15 program which generates a high resolution image of sllhs-lrf~re formations.
SUMMARY OF THE INVENTION
According to this invention, the foregoing and other objects are
attained by a method of modeling petrophysical properties of aubl~
formations which yields a high resolution image Ic:,u-c;s~ ive of ch~ud~ l;aiics
33334CA
2177771
of ,.,l llr~ I stlucture. A first step is obtaining data including a seismic survey
along with lithologic infi)rrn~fir)n for example, from a well log. The method
defines am initial lithologic model which agrees with measured sonic, density and
layer thickness well logs. Seismic trace data corresponding to the well location
5 is associated with the initial model such that the lithologic data is paired with
seismic data. Forward model perturbation techniques are then used for
Gu~ uu~ g pseudo-logs at a desired number of forward model sites away from
the well. Based on these pseudo-logs, a corresponding number of synthetic
seismic traces are d~PtPrrninPd so that each forward model is associated with a
10 synthetic seismic model trace that matches the lithologic parameter of the
pseudo-log. In this manner a catalog of synthetic seismic model traces and
cu..~.uu..d;..g pseudo-logs is generated and stored in computer memory for further
processimg. Then, usmg the computer for comparing every synthetic model trace
in the catalog to each real trace of the seismic survey, several (e.g., 10 to 50)
15 different synthetic seismic model traces are selected for each real seismic trace
that "best fit" the real seismic trace in some malmer. Next, the p~lluplly~;-,dl
properties modeled in the several pseudo-logs -,~ ", r~ ;"~ to the several "best
fit" synthetic seismic traces Cu~ ulldulg to a specific forward model site are
uulu~ ,dlly compared to the corresponding p~ uplly~h,dl properties modeled by
20 the pseudo-logs at adjacent forward model sites. Finally, a single pseudo-log is
33334CA
21777~1
chosen for each forward mode! site based on the numerical values ~lrtprmin~d in
the coherence analysis scheme for comparing p~,LIo~ yDicdl properties at adjacent
forward model sites, and the chosen property for each model site is assigned to a
display model which is a visual ~ a~ Lion of lithologic r1~qr:7rtrri~tirs of
s ~"~ -, rS~ forn~o~lnn~
In ac~o~ F with another aspect of this invention, apparatus
comprises a computer ~ ^1 to carry out the above described method. In
acco.d~ulcc with yet another aspect of this invention, a program storage device
comprises a computer readable medium having computer program code means
embodied thereirl for causing the computer to carry out the above described
method.
BRIEF DESCRIPTION OF THE DRAWINGS
The file of the patent contains at least one drawing executed in color.
Copies of this patent with the color drawing will be provided by the Patent and
Trademark Office upon request and payment of the necessary fee.
FIG. lA represents a typical seismic section.
FIG. lB represents model traces corresponding to the section of
FIG. l~
FIG. 2 illustrates a lithological log suite pertinent to this invention.
~ 33334CA
2177771
FIG. 3 is a Cl . of seismic and model traces.
FIG. 4 illustrates the coherence analysis scheme according to the
imvention.
FIG. 5 is a simplified computer flow chart according to the
5 invention.
FIG. 6 is a color display, which is a product of the invention.
DETAILED DESCRIPTION OF THE PREFERRlED EMBODIMENT
The abundance of three-dimensional seismic data that is available,
and the increased attention by ~;~u~lly~ to reservoir "l. ,~ ;on studies,
10 have provided ~ ' on.~ of basic data from which improved seismic inversion
schemes can be applied. The basic data to which this mvention is applied is in the
form of a spacial sequence of seismic time scale traces, which have been recorded,
stacked and properly migrated over a restricted time window as known in the ar~f,
and geological and p~ u~ l information from one or more wells. Synthetic
15 seismograms and pseudo-logs can be computed from the basic data. Details of
wavelet processing for producmg synthetic sf;.,.l~, r, is disclosed with
reference to FIG. 3. in U.S. Patent No. 5,487,001. Also explained with reference
to FIG. 4 of U.S. Patent No. 5,487,001 are details of producing pseudo-logs
33334CA
~77771
irlcluding lithologic (Vs~, saturation (Sw), porosity (O, pay zone, sonic (~t) and
density (p) logs.
In the preferred embodiment of this invention, the lithologic
pa~ cl~l a of the respective known formation at well locations are sy,~ lly
5 perturbed and Gu~ Julldillg synthetic s~ gr~rn~ are (lrlr. Ill;"~d in order to
build a catalog of synthetic model traces of sufficient size that irlcludes a range of
lithologic amd pci~ l parameters that bracket known conditions around the
well. The process of matching the synthetic seismic model traces to real traces
includes a calculation of three factors which establish a measure of the similarity
10 between synthetic and real traces. These factors irlclude an absolute average
difference factor, RB factor and a ~loaa~ lalion coefficient, where any of these
factors may be weighted depending, for example, on cnnfi(1~ n~e in the basic data.
The .,~ L.Iion technique is usually limited to a small time window of about
thirty milli~con(1~ (ms) to one-hundred ms of the seismic trace, as illustrated in
15 ~IG. 3. This time window is adjusted to include the reservoir zone of interest
plus any ov~-b~ or I ' 1, .1~,1l zones that could influence seismic
reflections. Because many of tbe solutions that satisfy the seismic data alone can
be ruled out as being ~ gi~lly ~ , a coherent analyses scheme is
then used to compare the pseudo-logs which are paired with the selected "best fit"
20 seismic model traces selecte~ for a given location (i.e., ~IG. 4, at 0,0) to the
3333~CA
2~77771
11
pseudo-logs which are paired with "best fit" seismic model traces of llc;~ bo, u.~
locations. A numerical coherence analysis then selects the single pseudo-log that
best describes the litbologic p~ s for the specified location and that
pseudo-log is accepted for use in the image display model illustrated in ~IG. 6.Referrmg now to FIG. lA, there is illustrated a seismic section of
recorded and processed seismic traces, and FIG. IB shows cu11c~,vl1L11~ model
traces, which would typically be synthetic traces. Seismic station numbers 0-30
are indicated at the top of the sections on the horizontal axis. Intervals of two-way
seismic wave travel time in milliseconds are marked on the vertical axis. ~IG. 2shows a typical computer workstation display for the suit of logs including
lithologic p ~ rlr~ ~ of shaliness (~Ts~, saturation (Sw), porosity (~4), pay zone,
sonic (Qt) and density (p). Appropriate scales for the illustrated logs are marked
on the horizontal axis, and the well depth in feet is indicated on the vertical axis.
Also shown in ~IG. 2 by the dark horizonal lines are the definition of layer
boundaries for reflecting horizons indicating the cross section of a volume which
could be selected for detailed modeling according to this invention.
Parameters of interest for modeling include those which indicate a
~ub~ 1 layer containing h~/dlucdllJu~s in sufficient quantity to justify
commercial production such as layer thickness, porosity, water saturation, etc
In the method of this invention seismic traces corresponding to a well location,
217 ~ 7 ~1 33334CA
such as trace 6 in FIG IA, are associated with petrophysical p~ t..~ which are
known, for example, from well logs. A statistical or .1~ 1~ .,,,;,,;~I;c wavelet is
derived, and then tested by computing a set of synthetic time scale traces which
are compared to the original seismic trace by ~,lu~scul~ iiorl and further by an
5 average absolute value difference between synthetic and real seismic traces at the
maximum ~,-u~scu~ ion position. The wavelet is typically adjusted until a
crosscorrelation value of .98 or better is achieved for synthetic S.,;~l~lO~lh.ll~ at
well locations.
Forward modeling is then employed where perturbations ir
10 prllu~lly~k,dl properties are Ir,ul~ iv~ of probable and l~sulldl~l~ variations
of the property or properties of the irlitial model, without regard to analysis of
seismic traces at the forward model site. Paring of a pseudo-log and a model
seismic trace will n~ alignment of the two traces, which will generally
imvolve shifting the time axis of either with respect to the other to determine the
15 aligrlment that gives the best match. Typical initial and Ir~ ~ values for the
various logs are illustrated in FIG. 2, where solid lines indicate the initial value
and light gray lines indicate Ir~ values. The depth scale for the logs,
such as illustrated of FIG. 2, are converted to the time scale of a corresponding
seismic section for ~. ,,,,1, -- ;~. ." since the more prominent reflections on a seismic
20 section will ~,ulu~ t~,ly corr~spond to gross excursions of the sonic log trace.
3333~CA
2~77~7i
13
Referring now to FIG. 3, there is illustrated a cnmrllli~orl of seismic and
model traces, where ten "best fit" model traces Go~ Jull~illg to a specific seismic
trace are selected. The selection method shown utilized two reference horizons.
However, a single hûrizon which serves as the zero lag positiûn for
5 ~-u~,u~lul~ion operations and as a reference time for the positioning of pseudo
time logs may be employed. The length of the uIu~,oll~ ion window includes
the time thiclmess of the reservoir layer plus the time for 1/2 wavelength above
and below the reservoir. The seismic data volume is relative amplitude and
preferably zero phase. lFrequency content and signal-to-noise ratio are, ~ ; I "; ,.~d
10 tbrough standard wavelet processing schemes. If desired, relative weighting
factors can be applied to the c,u~ ull~ ionJ absolute difference and/or RB factor
terms mcluded in the following table.
2177771 33334CA
1~
Table I
Seismic Trace Comparison
Model CDP X-Corr Coefficient X-Corr Lag Avg abs Diff RB-Pactor
0 9858 2 0 0100 0 9841
5 2 0 9903 2 0 0091 0 9885
3 0 9864 2 0 0104 0 9834
4 0 9855 2 0 0104 0 9830
0 9843 3 0 0090 0 9858
6 0 9867 3 0 0089 0 9871
7 0 9841 2 0 0093 0 9850
8 0 9851 2 0 0088 0 9865
9 0 9852 2 0 0098 0 9842
0 9862 1 0 0080 0 9890
Table I shows the numerical cu~ u~uisul~ of the traces illustrated in
PIG 3 where all of the ~,~u~u--~ ion coefficients are greater than 984;
correlation lags are 3 or less; average absolute difference is 0104 or less; and the
RB factor is greater than 983 A ~,~u~co~ lion value of 1 0 with an average
difference value of 0 0 represents a perfect match The most robust comparison
of model and seismic traces occurs, however, when the u~u~,u~ lion and
absolute value differences are ;~ r~ ly nr~nnslli7r~d to a scale of -1 0 to 1 0
and then ranked upon a comblned value which is called the RB factor, which is
~ ~ 7 ~ 7, 1 33334CA
show in Table I. An RB factor of 1.0 represents a perfect match and values less
than 1.0 reflect progressively less similar w;lv~rull.lS.
Referring now to PIG. 4, there is illustrated nine forward model
station sites withm an area to be modeled, where the sites are identifled according
5 to x, y coordinates shown by the numbers in pcu~ siD. A third axis labeled z
is also shown which is indicative of time or alternately depth. For each forward
model site there is shown the several pseudo-log traces, illustrated at reference
numerals 40-45, which were previously paired with the real seismic survey trace
which is cl.a.~ -;DliG of that site.
Comparison of the pseudo-logs Gull~D~.~,l.dil.g to the "best fit"
synthetic seismic model traces for a given location, such as (0, 0) in PIG. 4, to the
GOIl~_r lin~ pseudo-logs of adjacent sites is ærcomrl -~ using a numerical
average difference analysis. At the central location, the pseudo-log with the
lowest composite difference value is selected for use m the image display model
15 illustrated m FIG. 6, and the relative ranking of the other "best fit" model traces
is adjusted acculdi.l~ly. FIG. 4 illustrates use of pseudo-logs from eight adjacent
locations which are considered for choosing the single pseudo-log for use in the
image display model for the central location. The areal coherence scheme
mcludes criteria such as: (a) which pseudo-log (i.e. porosity, i~"l-~rl~ , etc.) to
20 compare; (b) the number of pseudo-logs at each location; (c) the depth or time
2i77771 33334CA
16
interval(s) used for CU111~U;DOn; (d) quality of the seismic match; and (e) radial
distance from the central location. Relative weighting factors may also be used
im c~-nj~n~ti~n with the above criteria. For example, diagonal corner traces, such
as (1, 1) and (~ 1) in FIG. 4 are preferably weighted at 70%. Ln general, the
5 same time window is used for coherence testing of pseudo-logs, and
.,luDDco..uLILion of seismic traces. This time window is illustrated in FIG. 3 for
~-UDDCU~ iUII of seismic waveform, and is illustrated in FIG. 4 for coherence of
lithologic logs.
The coherence matching scheme results in maps and three
10 dimensional image model displays of ~ rl l ~ l volumes having more
e~ ~r~lly reasonable trends, while still ~ e high resolution and detail.
FIG. 6 illustrates a three ~1imPnci~ ~l color display of a I volume
showing porosity values according to a color code where red indicates high
porosity, yellow indicates in~PrmP ' and blue indicates low porosity. This
15 image display is a product of this invention.
Since the number of synthetic model traces contained in a typical
catalog may range from 1,000 to about 30,000, the above described iterative and
selecting processes require a c~ - IPr?1lle amoumt of detailed computation.
Because of the great number of c ~ l ni~ r needed, these processes are preferably
20 computer i ,~ " -.,~-d in a~-,u.ddllce with the simplified flow diagram of FIG. 5.
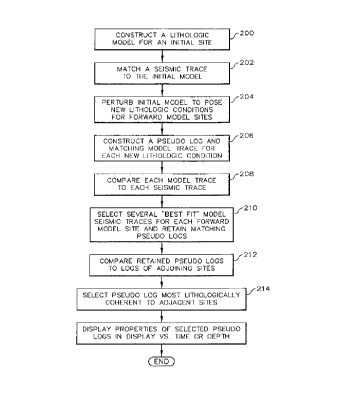
217777 33334CA
17
In FIG. 5, initially all seismic data, which typically includes a three-
dimensional seismic survey, and all available lithologic data which generally
mcludes one or more well logs, are quantized as digital samples and assembled for
input into a computer suitable for l~lu~,G;,,-~Ig the volume of data, such as a
Sparc-10 computer. In block 200 a log suit, as illustrated in FIG. 2, which, for
example, includes lithologic pal such as shaleness (VSE~3; porosity (O;
saturation (Sw); pay zone; sonic (~t); and density (p), is defined based on the
input well log data. A model, which includes a reflectivity series (lPfprminpd from
velocity (sonic) and density logs, as known in the art, is calculated for the initial
location. In block 202, standard wavelet ~loG~ g tP~hni~ Pc are used in
c-~njl-n~ti~-n with the initial model to produce synthetic traces which are compared
to real seismic traces at the initial site until a synthetic seismic model trace is
found which matches the real seismic trace within a ~lc~ ,..;"Pd threshold, such
as a ,~u~S~,ull~lalion value of 0.98. In block 204, perturbation t~P~h-:q~lPs are
15 applied to the initial model. Fo} e~ample logs selected from the suit shown in
FIG. 2, may be perturbed in amplitude or layer thickness. Also these logs may be
perturbed co~ y, individually or a comhin~tinn of two or more properties
could be modified. These modification steps are more fully described in step
number five of U.S. Patent N~. 5,487,001.
.
33334CA
21~7771
18
~ 'or each new lithologic condition proposed in block 204, a
pseudo-log and iu -, -r ~' ~7~ synthetic seismic model trace are ,l u.,l~d using
known tP~.hniqllPs for csllrlll~fin~ a reflectivity series for the new lithologic
conditions, and known wavelet processing tP~-iquP~ The pseudo-logs and
5 cù..~u..d;..~, seismic model traces are aligned irl time for maximum correlation.
Next, in block 208 each model trace is independently compared to each real
seismic trace by ~,luaa~;ull~LIlion, etc., and several "best fit" seismic model traces
are selected in block 210 for each real seismic trace based on data such as shown
in Table I. The pseudo-logs palred with the "best fit" seismic traces are retained
10 for c~ , in block 212, where the pseudo-logs CUll~a~U~ g to the "best fit"
synthetic seismic traces for each site are compared with corresponding
pseudo-logs of adjoining sites. In block 214, the most likely pseudo-logs to
describe the combination of lithologic amd seismic data for each forward model
site are selected based on numerical difference calculation yielding the lowest
15 composite difference between Coll~a~Jolldiul~ pseudo-logs of adjoining sites.
There has accù-diu-~,ly been described a system and method for
detailed modeling of ' volumes, and a computer ~)-u~ u~u~ed to carly
out the method. In this disclosure, there has been described only the preferred
embodiment of the invention, but, it is to be understood that the invention cam
33334CA
~7777~
19
serve various other ~IIVil~ which can include changes or modifications
within the scope of the inventive concept as expressed herein.