Note: Descriptions are shown in the official language in which they were submitted.
217917
R'0 95116901 ~ ~ PC1YUS94/14465
_1_
1 Specification
2
3 SIMPLIFIED APPARATiTS FOR DETECTION OF
4 LEAKS IN PRESSURIZED PIPELINES
6 ~C1CGROUND OF THE INVE_lsTION
7 Field of the Invention
8 The present invention relates generally to a method
9 and an apparatus for the reliable detection and
quantification of the flow rate produced by a leak from
11 pressurized pipeline systems containing petroleum,
12 solvent, or other chemical liquids.
13
14 Brief Discussioa of the prior Art
There are a wide variety of pressurized pipeline
i6 systems carrying petroleum, solvents, and other chemical
17 products that may contaminate or seriously damage the
18 surrounding environment in the event of a leak. In
19 underground or underwater pipelines, where visual
inspection is not possible, a leak can be a significant.
21 problem. Small leaks in these pipeline systems (e. g.,
.22 several tenths of a gallon per hour) can go undetected
23 for long periods of time and result in a large cumulative
24 release of product into the soil or groundwater, or into
fresh or ocean water.
26 The need for leak detection capability in
27 pressurized pipelines associated with underground storage
28 tanks containing petroleum products has recently been
29 identified. This need is an important one because the
number of tanks involved is very large, and so is the
3I volume of product dispensed through the pipelines
32 associated with these tanks. The pipeline systems in
33 question are most commonly made of steel or fiberglass;
34 they are typically 2 inches in diameter, 50 to 200 feet
long, buried 1.5 to 3 feet below grade, and are
36 pressurized at 20 to 40 psi while product is being
37 dispensed. In September 1989, the United States Environ-
38 mental Protection Agency (EPA) issued technical standards
39 for the detection of leaks in underground storage tanks
wo 9ms9oi 2 ~ ~ '~ ~ $ l rc~rms9anaass
_2_
1 containing petroleum or other hazardous chemicals and
2 solvents. This regulation established the minimum
3 performance standards that must be met by any Ieak
4 detection system designed for testing the integrity of
underground tanks and/or the greasurized pipelines
6 associated with these tanks.
7 The EPA requires that underground storage tank
8 (UST) pipeline systems that contain petroleum products be
9 tested for leaks either on a monthly or an annual basis.
To satisfy the criterion for monthly testing, a system
11 must have the capability to detect leaks as small as 0.20
12 gal/h with a probability of detection (PD) of 0.95 and a
13 probability of false alarm (PFR) of 0.05. To satisfy the
14 criterion for annual testing, a system must be capable of
detecting leaks as small as 0.10 gal/h with the same PD
16 and PFA required of the monthly test.
17 There have been a number of approaches to leak
18 detection in pipeline systems. Some leak detection
19 systems are designed to operate while. product is being
moved through the line; others require that the flow of
2i product be stopped forthe duration of a test. Leak
22 detection systems generally use one of three methods:
23 they measure the drop in pressure in the pipeline over a
24 period of time,they measure the difference in pressure
or flow rate at two or more points along the pipeline, or
26 they measure the change in the volume of the product over
27 a period of time. Detecting small leaks is difficult
28 because there are many physical phenomena present in
29 pressurized pipeline systems that produce pressure,
volume, and flow-rate fluctuations that are as large as
31 or larger than those produced by a leak. These normally
32 occurring fluctuations degrade the performance of the
33 leak detection system and result in false alarms or
34 missed detectiona. As a consequence, a number of
compensation schemes have been proposed to reduce them.
36
37 Pipeline Leak Detectors That Measure Pressure:
38 The most common approach to the detection of leaks
39 in a pressurized underground pipeline containing an
Image
R'O 95116901 ~ PCTliTS94114465
-4-
1 modulus of the pipeline system. These temperature-
2 induced pressure changes occur frequently in both leaking
3 and nonleaking-pipelines. When the pressure changes in a
4 leaking pipeline are no greater than these normally
occurring temperature-induced changes, it is difficult to
6 detect a leak by monitoring the line for drops in .
7 pressure.
8 Accurate detection of a leak demands (1) that both
9 the instrumentation and protocol have sufficient
sensitivity to detect the smallest leaks of interest, (2)
11 that the temperature changes in the line be measured and
12 compensated for, and (3) that the pressure changes be
13 related to the flow rate of the leak. All three require
14 that the range of the elasticity properties of the
pipelines that will betested-be known. The second
16 requires that the temperature of the product be measured.
17 The third requires that the pressure-volume relationship
18 be measured each time for each line being tested.
19
Bulk Modulus:
21 ~ The bulk modulus of a pipeline is defined by the
22 relationship, between pressure and trolume within that
23 line. The bulk modulus of both the line and the product
24 must be known before one can convert the pressure and
temperature changes to volume changes or before one can
26 interpret the meaning of a pressure drop. One can
27 estimate the bulk modulua by simultaneously measuring the
28 pressure of the line and the volume of product released
29 through a valve in the line. Errors in determining this
relationship occur if the line is leaking, if the
31 temperature of the product in the line is changing, or if
32 vapor or-air is trapped in the line. Accurate
33 calibration is difficult because the integrity of the
34 line is unknown, as are the temperature of the product in
the line and the volume of trapped vapor. Furthermore,
36 the bulk modulus of the pipeline system changes over time
37 as the volume of trapped vapor and air changes, and as
38 the elasticity of the flexible hosing, the mechanical
39 leak detector, and the pipe material changes.
WO 95116901 PC1'IUS94114465
-5-
1 Thermally Iaduced Pressure Changes:
2 Thermally induced fluctuations in pressure are the
3 major source of error in detecting a liquid leak with a
4 pressure detection system. The magnitude of the error
depends on the magnitude of the coefficient of thermal
6 expansion and the bulk modulus of the liquid and the line
7 material. For gasoline motor fuels, whose coefficient of
8 thermal expansion is 6 to 7 times larger than that of
9 water, even small temperature changes have been shown to
0
produce large pressure changes. (E.g., a 0.1 C
11 fluctuation in temperature can cause the pressure to
12 change by 10 psi.) Furthermore, both theoretical and
13 experimental analysis demonstrate that the rate of change
14 of temperature in an underground pipeline system can be
high and complicated.
16 From the standpoint of petroleum-dispensing
17 operations, it is difficult to distinguish temperature-
18 induced pressure changes from those that are leak-
19 induced, because the rate of change o~ pressure varies
exponentially both with the volume of product released
21 through a hole in the line and with the change in the
22 temperature of the product. The temperature of the
23 product varies exponentially when product from the tank
24 is brought into the line, because the temperature of this
product differs from the temperature of the backfill and
26 soil around the pipeline. This temperature difference,
27 which can be many degrees, results in an exponential
28 change as the product in the line attempts to come into
29 equilibrium with its surroundings. In lines that are 100
to 200 feet long and 2 inches in diameter, it may be 6 to
31 12 hours before the rate of change of temperature is low
32 enough to permit accurate testing.
33 The traditional methods of compensating for
34 temperature effects, which require the measurement of the
rate of change of temperature of the liquid and the
36 pipeline, are impractical because (I) the temperature
37 distribution of the product in the line is spatially
38 inhomogeneous, and a large number of temperature sensors
39 would have to be retrofitted along the line in order to
WO 95116901 PCTlUS94114465
-6-
1 measure it; and (2) installing, maintaining, and
2 calibrating a large number of sensors would be difficult.
3 The best method of compensating for the effects of
4 temperature fluctuations is to wait until these fluctua
tions are small enough to be negligible. For accurate
6 pressure tests, this waiting period should be-between 6
7 and I2 hours.
8
9 Summary:
Detecting-small leaks in a pressurized pipeline by
11 monitoring the pressure changes in the line is very
12 difficult. Eiigh performance requires (1) that the test
13 be long enough to allow the pressure to drop by a
14 specified amount, suitable for detecting the smallest
leaks of interest over the full range of pipeline systems
16 to be tested, and (2) that the waiting period between the
I7 last dispensing ofproduct and the beginning of the test
i8 be long enough for the temperature changes in the line to
19 become negligibly small. To obtain accurate results in
the case of the 2-inch-diameter lines found at a typical
21 retail-service station, dispensing operations might have
22 to be terminated up to 12 hours before beginning the
23 test. Thus, the total time required to conduct a test
24 becomes quite long.
26 Pipeline Leak Detectors That Attempt to Compensate for
27 Thermal Changes:
28 In U.S. Patent 4,608,857, Mertena describes a
29 method for detecting leaks as small as 1 L/h in a
pressurized pipeline without waiting for fluctuations in
31 the temperature of the product to subside. (As we have
32 seen, such fluctuations induce pressure changes that can
33 be mistaken for a leak.) Mertena establishes three
34 measurement periods of equal length. Initial line
pressure is the same during the first and third periods
36 but is lower during the middle period. Pressure changes
37 are measured during all three periods. The middle
38 measurement is then subtracted from the average of the
39 first and third. The difference is compared to a
t WO 95/16901 PCT/US94114465
_7_
1 threshold, and in this way the existence of a leak is
2 determined. Mertens indicates that the volume of product
3 in the line must be small for the method to work
4 properly. Furthermore, according to Mertens, the method
accurately compensates for temperature providing that
. 6 "the sum of the consecutive measurement periods is very
7 small compared to the half value period of a temperature
8 equalization process."
9 Analysis of this method shows that, when a leak is
present in the line, the average pressure change that
11 occurs during either the first or third periods will
12 always be greater than that during the middle period.
13 Furthermore, depending on the bulk modulus of the
14 pipeline system, the actual volume change that occurs
during these measurement periods will vary from one
16 leaking line to another, even when these lines have the
17 same initial starting pressures and identical leaks.
18 Mertens's method does not require that the bulk modulus
~ 19 be measured and does not attempt to interpret the test
,results in terms of the actual leak rate. Mertena's
21 method declares a leak in the pipeline if the difference
~ 22 between the high- and low-pressure measurements exceeds a
23 predetermined threshold value. However, a wide range of
24 volume changes could produce this same pressure change,
and therefore, the accuracy of his method will vary from
26 line to line.
27
28 Pipeline Leak Detectors That Attempt to Detect Leaks
29 Whiles There Is Flow in the Lines:
The method described by Mullen in U.S. Patent
31 3,702,074 detects leaks in pressurized pipelines while
32 product is flowing through the line. Mullen measures
33 flow rate at two different points along the line (either
. 34 the inlet and the outlet or any other two points
sufficiently distant from one another) and at two
36 different pressures, one high and one low. The
37 difference in flow rate between the two measurements made
38 at the lower pressure is subtracted from the difference
39 between the same measurements made at the higher
WO 95/16901 PCTIUS94/14465
_g_
1 pressure. The result is then compared to a threshold
2 leak rate, which, if exceeded, is the basis for declaring
3 a leak in the pipeline. Mullen contends that because his
4 measurements are closely spaced in time, he prevents
long-term dynamic trends, such as those produced by the
6 thermal expansion and contraction of the product, from -
7 affecting the results. However, while the temperature
8 changes, the rate of change remains the same. For
9 example, if measurements are made one minute apart the
temperature change is much less than if they are made one
11 hour apart; however, the rate of change is the same over
12 any interval, whether it is a minute or an hour.
13 Mullen's approach does not work because it confuses the
14 rate of change with the actual change, which has no
bearing on the results. Mullen's method will effectively
16 compensate for-temperature changes only if they happen to
17 be the same during the high- and low-pressure
18 measurements. This is unlikely to be the case, however,
19 because, as stated above, the change in temperature in a
pipeline is generally not- constant (i.e., it tends to be
21 exponential with time).- Furthermore, the fact that
22 Mullen does not account for inventory changes also
23 affects the accuracy of his method. Mullen minimizes
24 short-term transient effects, such as those due to
pressure, by taking several readings at each pressure and
26 averaging them.By isolating different sections of line
27 and by repeating the test at each segment of the line, he
28 can locate the leak. He eliminates false alarms due to
29 faulty equipment by comparing the test results for each
segment of pipe tested; if the equipment is faulty, the
31 flow-rate threshold will be exceeded in all of the
32 segments tested.
33
34 SlIMI~IARY OF THE INVENTION
It is an object of this invention to provide a
36 method, and a device, for the reliable detection of small
37 leaks in pressurized pipelines containing liquids,
38 including water, petroleum, solvents, and other chemical
39 products.
WO 95/16901 PC1YUS94114465
_g_
1 Another object of this invention is to provide a
2 method of and a device for quantitatively estimating the
3 volume change and the flow rate of a leak in a pipeline
4 at any pressure in the line.
Yet another object of this invention is to provide
6 a method of and a device for compensating for the thermal
7 expansion and contraction of the product in the pipeline
8 and of the pipeline itself.
9 A-further object of this invention is to provide a
method of and a device for quantitatively estimating the
11 thermally induced volume change and flow rate of the
12 product in a pipeline at any pressure in the line.
13 The invention is designed to detect small leaks in
14 pipelines that contain any type of incompressible liquid
and that are either pressurized or can be placed under
16 pressure for the duration of a test. The invention is
17 particularly useful in underground or underwater pipeline
18 systems, but can also be used on pipeline systems located
19 above ground, such as those found in buildings or placed
in specialized containment systems.. The major
21 application of this invention is for the detectioz~ and
22 quantification of the flow rate produced by a leak in UST
23 pipeline systems containing petroleum and other chemical
24 products.
The invention requires that a leak detection test
26 of the line be performed when the fluid in the line is at
27 rest. Because the device will compensate for thermally
28 induced changes in the pressure or volume of the product
29 during a test, it is particularly useful for liquids that
have a high coefficient of thermal expansion compared to
31 water.
32 All references to the pressure of the pipeline
33 system or pressure vessel made in this specification
34 refer to gauge pressure. When the gauge pressure of the
pipeline system is zero, the absolute pressure of the
36 pipeline system is equal to atmospheric pressure. The
37 claims made in this patent are based on absolute
38 pressure. Thus, when the pressure is atmospheric, the
39 gauge pressure of the pipeline system is zero.
WO 95116901 PCTIUS94114465
-10-
1 Briefly, the preferred embodiment of the present
2 invention is a simplified apparatus for detection of
3 leaks in pressurized pipelines which utilizes a large
4 pressure vessel and a small measurement vessel. The
measurement vessel magnifies level changes during leak
6 detection tests. The apparatus is connected to a
7 pipeline through the measurement vessel. The entire
8 system can be filled with liquid from the pipeline by
9 opening a valve between the measurement and pressure
IO vessels. Leak detectian tests are conducted by measuring
Ii changes in volume with the measurement-vessel over time
12 while the pressure over the liquid in the pressure vessel
13 and measurementvessel is maintained approximately
i4 constant. During tests, liquid communication between the
measurement vessel and pressure vessel is prevented by
I6 closing the valve between them, but vapor communication
17 between the vessels is permitted.
18
I9 BRIEF DESCRIPTION OF THE DRAWINGS
Fig.'1 illustrates the preferred embodiment of the
21 present invention, in which an acoustic sensor system
22 located inside a pressure vessel measures product-level
23 changes and in which the vapor space above the product is
24 used to maintain constant pressure during a-leak
detection test;
26 Figs. 2(a) and 2(b) show side and top views of the
27 preferred embodiment of the acoustic sensor system;
28 Figa. 3(a) and 3(b) show side and top views of an
29 alternative embodiment of the acoustic sensor system;
Figa. 4(a) and 4(b) show four possible shapes for
31 .the cross-section of the bar-shaped fiducial, the
32 preferred triangular shape and three alternatives
33 (rectangular, half-circular and circular);
34 . Figs. 5(a) and 5(b) show side and top views of a
second alternative embodiment of the acoustic sensor
36 system;
37 Fig. 6 shows an alternative embodiment of the
38 pipeline leak detection system in which the acoustic
39 sensor system housed inside the pressure vessel shown in
217917
R'O 95116901 pCTI0S94/14465
-11-
1 Fig. 1 has been replaced by an electromagnetic sensor
2 system attached to a float that rests on the product
3 surface;
4 Figs. 7(a) and 7(b) show side and top views of an
alternative placement of the electromagnetic sensor, in
6 this case outside and along the neck of the pressure
7 vessel;
8 Fig. 8 shows a second alternative embodiment of the
9 pipeline leak detection system in which a pressure
regulator and a container of inert gas are used to keep
11 the pressure constant in the vessel that contains the
12 acoustic sensor system;
13 Fig. 9 shows a third alternative embodiment of the
14 pipeline leak detect system in which the acoustic sensor
-system shown in Fig. 8 has been replaced by an
16 electromagnetic sensor system;
17 Fig. 10 shows a fourth alternative embodiment of
18 the pipeline leak detection system in which the pressure
19 vessel and pressure regulator in Figs. 8 and 9 have been
replaced by a pressure sensor and a positive displacement
21 pump that is used to pump liquid into or out of the
22 pipeline as a means of keeping the pressure constant;
23 Fig. 11 shows a fifth alternative embodiment of the
24 pipeline leak detection system in which the positive dis-
placement pump in Fig. 10 has been replaced by a piston
26 that is used to displace a volume of liquid in the
27 pipeline as a means of keeping the pressure constant; .
28 Fig. 12 shows a simplified version of the preferred
29 embodiment of the present invention;
Fig. 13 shows an alternative embodiment of the
31 simplified apparatus shown in Fig. 12;
32 Fig. 14 illustrates a typical leak detection test
33 sequence, with four 5-minute level measurement segments
34 separated by 2-minute intervals;
Fig. 15 illustrates the simplified apparatus
36 implemented with an electronic sensor for measuring level
37 changes; and
WO 95/16901 ~ ~ ~ 91$ 7 PCT/US94J14465
-12-
1 Fig. 16 illustrates the simplified apparatus
2 implemented with capability for both manual and
3 electronic level measurements.
4
~F'gCRIPTION OF THE PREFERRED EMBODIMENT
6 In order to measure the volume change that is due
7 to a leak (i.e., the flow rate), it is necessary to
8 compensate for the temperature-induced volume changes.
9 The present invention compensates for the thermal
expansion or contraction of the product in the line
11 without having to measure the temperature of that
12 product. The time it takes to test a line is less than
13 an hour. Unlike most of the methods currently in
14 operation, this new technology is not based on measuring
pressure changes in the pipeline system. Instead, it
16 calls for a measurement of the change in the volume of
17 product in the pipeline system. At least two consecutive
18 measurements are made, one at the operating pressure of
19 the line, and the other at zero pressure; for accurate
temperature compensation, the pressure must be constant
21 or nearly constant during the measurement. The invention
22 compensates for temperature changes by differencing the
23 volume changes noted during each of these measurements.
24 A high degree of temperature compensation is achieved if _..
the thermally induced volume changes are nearly the same
26 during measurements at each pressure. Since this may or
27 may not be the case, and since there is no way to verify
28 it, a third measurement is made at the same pressure as
29 the first measurement; it is then averaged with the first
measurement before the volume changes obtained at zero
31 pressure are subtracted.
32 The methodology used to measure the temperature-
33 compensated volume rate due to a leak takes advantage of
34 the fact that the flow rate (volume change) due to a leak
is not linear with pressure, but the flow rate (volume
36 change) due to temperature fluctuation is. The preferred
37 approach is to make one volume measurement when the line
38 pressure ie near zero and a second measurement at a
39 higher pressure, preferably in the vicinity of the
2119181
WO 95116901 PCT'/US94114465
-I3-
1 operating pressure ofthe line. At zero pressure, the
2 flow rate due to a leak is zero; thus, the only volume
3 change that occurs is due to thermal expansion and
4 contraction of the product, vapor, or pipeline. The
difference between the zero-pressure and the nonzero-
6 pressure measurements represents the thermally
7 compensated flow rate due to a leak at the nonzero pres-
8 sure.
9 In general, to determine whether a pipeline system
1D is leaking, the mass flow rate should be estimated from
11 the change in mass of the liquid product in the pipeline
12 system measured over the duration of the leak detection
13 test. For detection of leaks in underground storage
14 tanks and pipelines, it is the industry practice to
measure and report the volumetric flow rate estimated
16 from the change in volume of the product in the tank or
17 pipeline system over the duration of the test. For the
18 accuracy required for tests on underground storage tank
19 pipeline systems, the mass flow rate and the volumetric
flow rate can be assumed to be approximately equal., The
~ 21 difference between the mace flow rate and the volume flow
22 rate is small, because the liquid product is
23 incompressible at the pressures that an underground
24 ,storage tank pipeline system is operated and the
temperature of the product during a leak detection teat
26 does not change sufficiently to change the density of the
27 product. Th'e volumetric flow rate can also be accurately
28 estimated from measurements of the change in the level of
29 the liquid product in a pressure vessel, which is
attached to and in communication with the pipeline system
31 and contains both liquid product and trapped gas, during
32 a leak detection test, because level changes can be
33 easily converted to volume changes using a calibration
34 factor. This specification measures and reports
volumetric flow rate. There is a wide range of devices
36 that can be used to implement the temperature
37 compensation approach described above. Each device
38 requires a sensing system to measure the change in volume
39 of the product in the line. These devices can use any
WO 95/16901 PCfJITS94/14465
-14-
1 type of mass, volumetric, level, or density sensing
2 system to measure and report volumetric flow rate. The
3 sensing systems- described in this specification measure
4 either volume or level, but mass or density measurement
systems could ba used interchangeably.
6 In the preferred embodiment of the present
7 invention, a test is conducted at the operating pressure
8 of the line and at a pressure near zero. The basic
9 measurement scheme is to divide the test into three
segments of equal length, and to make measurements at one
11 pressure during the first and third segments and
12 measurements at the other pressure during the middle
13 segment. The operating-pressure measurement can be made
14 during the first and third segments and the zero-pressure
measurement during the middle segment, or vice versa.
16 The averaging of the two operating-pressure measurements,
17 which bracket the lower or zero-pressure measurement,
18 minimizes any nonlinear changes in the temperature field .
19 during the total test period. It ie acceptable to use
more than three test segments providing the three-segment
21 data collection and data analysis procedures are
22 followed; doing so actually improves the accuracy of the
23 system, and for this reason there is no upper bound on
24 the number of tests. Mathematically, there are a number
of equivalent ways to process the multiple-segment data.
26 This three-segment approach assumes that the
27 product temperature changes determined from averaging the
28 temperature changes during the first and third segments
29 is approximately equal to the temperature changes that
occur during the middle segment. This assumption is
31 valid for underground pipelines because the temperature
32 changes in the line tend to increase or decrease exponen-
33 tially over time when there is a temperature difference
34 between the product in the pipeline and the surrounding
ground.
36 The accuracy of a single test of the line will
37 depend upon i1) the precision of the instrumentation used
38 to measure the volume or volume-related changes in the
39 line, (2) how constant the pressure can be kept during
2179t87
R'O 95/16901 PC1'/US94/14465
-15-
1 the measurements, (3) the duration of each measurement,
2 (4) the number of data samples used to compute the volume
3 change at each pressure, and (5) the temperature changes
4 that occur in the liquid over the duration of the test.
To improve performance, a multiple-test strategy is
6 used. This minimizes false alarms and missed detections.
7 Three tests are conducted, although the waiting period
8 described below is applied only to the first test. A
9 temperature-compensated volume change is estimated from
each three-segment test, or from an average of two or
11 more three-segment tests. Providing that no product has
12 been dispensed between the first and last test sequences,
13 the rate of change of temperature should be decreasing
14 over time, and the volume rate measurement should
approach a constant value.
16 Accuracy can be somewhat degraded if the test is
17 conducted immediately after new product has been brought
18 into the~pipeli,ne and if the temperature of this new
19 product is significantly different from that of the
surrounding ground. The initial exponential change in'
21 temperature that occurs immediately after product is
22 brought into the line is highly nonlinear. Even though a
23 test conducted during this period can still meet the EPA
24 release detection standards, a short waiting period
(approximately 15 minutes) can minimize this nonlinearity
26 and improve performance dramatically. For UST pipeline
27 systems, the waiting period starts immediately after
28 dispensing has ceased.
29 There are four approaches that can be used to
implement this method. The approach taken will depend on
31 the size of the pipeline, the maximum allowable size of
32 the detector, the accuracy of the test, and the cost
33 tradeoffs. These approaches are.
34 (a) Level sensor and reservo'r (passive Method) A
reservoir, in this case a closed pressure vessel,
36 is filled with fluid from the pipeline until the
37 pressure in the vapor space of this container is
38 equal to the line pressure of interest. A sensor
39 is then used to measure changes in the level of the
WO 95116901 PCT/US94J14465
-16-
1 liquid in the vessel. The vessel is designed so
2 that the level changes, and therefore the pressure
3 changes, remain small during the measurement.
4 Measuring the level changes in the vessel requires
a high-precision sensor.
6 (b) Level sensor and reservoir (Active Method). As in
7 the Passive Method, a closed container is partially
8 filled with fluid from the pipeline. The remaining
9 space is filled with a gas and maintained at a
constant pressure equal to the line pressure of
11 interest. Again, a sensor is used to measure the
12 changes in the level of the liquid in the con-
I3 tainer.
14 (c) Piston-disx~lacement device. An object of known
volume is inserted into or removed from the liquid
16 in the pipeline to maintain a constant pressure in
17 the line.
18 (d) Pumn and reservoir. A small, two-way pump is used
19 to move fluid back and forth between the line and a
reservoir or container to maintain a constant.
21 pressure in the line. The volume changes are
22 measured-directly by the pump.
23
24 The first two devices measure level changes and convert
these to volume changes. If there is no vapor in the
26 line, one can calculate these changes from the geometry
27 of the container; otherwise, one can generate a
28 calibration curve by draining the container and measuring
29 the volume of the liquid taken out of the container. The
size of the container used to add or remove liquid from
31 the line should be proportional to the size of the line,
32 the amount of thermally induced volume change, the
33 elasticity properties of the pipeline system, the volume
34 of vapor in the line, and the-afze of the leak (although
the leak is generally responsible for only a fraction of
36 the volume changes contributed by all the other factors
37 listed here). Conversion from level to volume changes is
38 done most easily if the cross section of the container
39 does not change with level. A vertical cylinder is an
2119187
WO 95116901 PCTYUS94114465
-17-
1 example of such a container. The reason for keeping the
2 pressure constant during a te9t is that the pressure
3 changes iri the vapor apace are small when the level
4 changes are small. The pressure changes in the container
can be calculated from the perfect gas law. The vapor
. 6 acts as a highly elastic spring. Any sensor that can
7 measure liquid level independently of pressure with
8 sufficient precision and accuracy to detect the smallest
9 leak rates of interest will suffice (for example, an
acoustic, optical, electromagnetic, or capacitance
1I sensor). For reliable detecti~ of leaks as small as
12 0.05 gal/h, these level sensors need to have a precision
13 of approximately 0.002 inches or better.
14 An automatic pipeline leak detection system (PLDS)
is illustrated in Fig. 1 as it would be used in an -
16 underground storage tank 220 in accordance with the
17 preferred embodiment of the present invention. The PLDS
18 has three main components: The probe assembly 122, a
19 transducer controller 112, and a system controller 100.
.The transducer controller 112; which is mounted adjacent
21 to the probe assembly 122 within an explosion-proof
22 housing, controls the acoustic transducer 30. The system
23 controller-100 is mounted to an above-ground support and
24 is in electrical communication with the transducer
controller 112 through a cable 90. The cable 90 carries
26 power and command data from the system controller 100 to
27 the transducer controller 112, and acoustic data from the
28 transducer controller 112 back to the system controller
29 100.
Tha transducer controller 112 contains the pulse
31 waveform shaping, transmitting and receiving, and digital
32 preprocessing electronics for the PLDS system. The
33 system controller 100 contains the remainder of the
34 hardware and software necessary to control the desired
operational modes from the transducer controller 112,
36 acquire the acoustic data, process the data in terms of
37 product level, product-level changes, and leak rate, and
38 display the results. The system controller 100 can also
39 be equipped to control other sensor systems, such as
WO 95116901 PCTIUS94114465
-18-
1 those that provide overfill protection and alert, an
2 automatic tank gauging system, detection ofleaks in the
3 annular space of a double-wall tank, detection of
4 petroleum floating on the groundwater outside the tank,
and detection of vapors in the soil and backfill outside
6 the tank.
7 The transducer 30 is in electrical communication
8 with the transducercontroller II2 by means of a
9 conductor 92. With reference to Fig. 2(a), the
transducer 30 receives command data from the transducer
11 controller 112 and transmits a series of accurately timed
12 acoustic pulses up the probe,- through the product, and to
13 the various fiducials (acoustically reflective targets).
14 Fiducials 24 and 22 comprise the bottom circumference of
two concentric thin-walled nylon tubes (the "sleeve")
16 separated in the vertical by a known distance; the nylon
17 sleeve fits into a cylindrical tube, preferably a 1.5-
18 inch-diameter plastic tube, that holds the probe
19 assembly. The lower fiducial 24, F1, is preferably
positioned at a height, hl, about 2 inches above the,
21 transducer 30, while the upper fiducial 22, F2, is
22 preferably positioned at a height, ha, about 4 inches
23 above the transducer. Inoperation; acoustic pulses
24 emitted by the transducer 30 are reflected from the
fiduciala 24 and 22 and from the interface between the
26 product and the vapor, whether the product level is high
27 40 or low 50:
28 Referring to Figs. I and 2(a), the probe assembly
29 122 consists of a cylindrical pressurized-vessel 10, the
acoustic sensor 31 (which includes the transducer 30
31 mounted on a base 32, a tube 20 with a hole 26 located
32 near the bottom of the tube, and two fiducials 22 and 24
33 separated by a known distance and mounted on a sleeve
34 comprised of two concentric nylon tubes 28 and 34), and a
series of valves, pipes, and cables linking it to the
36 tank, pipeline and controllers. A valve62 connects a
37 pipe 60 from the pressure vessel to a pipe 70 attached to
38 the pipeline 200; this valve 62 is the means by which
39 product from the pipeline enters the pressure vessel.
r R'O 95116901 PC1YUS94/14465
-19-
1 Another valve 64 connects the pipe 60 from the pressure
2 vessel to a pipe 80 that drains into the tank 220 or
3 another holding container; this valve 64 is the means by
4 which product is removed from the pressure vessel during
a test. The trapped vapor 33 in the pressure vessel is
6 used to maintain a constant or nearly constant pressure
7 during the measurements at each product level in the
8 pressure vessel. An electric cable 92 connects the
9 transducer to its controller unit 112. Because the fluid
in the pipeline must be at rest during a leak detection
11 test, the pipeline 200 has a flow switch 120 to monitor
12 whether product from the tank enters the line during a
13 test. It also has a high-performance check valve so that
14 pressure in the line can be maintained during a test.
Valves 66 and 68 are used in the calibration of the
16 sensor.
17 The acoustic sensor 31 (Fig. 2), which measures
18 level changes within the pressure vessel, is housed in a
19 tube 20 that supports both the transducer 30 and the two
reference fiduciala 22 and 24. The transducer is located
21 at the bottom of the tube, and the fiducials are mounted
.22 at a known distance from the transducer on a sleeve
23 (comprised of nylon tubes 28 and 34) that is inserted in
24 the tube above the transducer. A hole 26 near the bottom
of the tube allows product from the pressure vessel to
26 enter or leave.
27 Figs. 3(a) and 3(b) show another alternative
28 embodiment of the acoustic sensor 31. The fiducials 322
29 and 324, which are affixed to the tube, are thin bars
positioned such that their long axes are perpendicular to
31 the transducer. Four of many acceptable cross-sectional
32 shapes 330, 332, 334, and 336 for the fiducials 322 and
33 324 are shown in Fig. 4(a). The triangular bar 330 has
34 the preferred cross-section, because (1) the bottom edge
of the bar is flat and perpendicular to the transducer so
36 that the acoustic energy reflected from the fiducial is
37 maximized, and (2) the top edges of the bar are not '
38 perpendicular to either the transducer or surface, so
R'O 95/16901 PCTIUS94/14465
-20-
1 that the acoustic energy reflected from the top of the
2 bar is minimized.
3 In yet another alternate configuration of the
4 acoustic sensor system (Fig. 5), the transducer and
fiducials are not housed in a tube; the transducer 30 is
6 mounted on the bottom of the pressure vessel 10 and the
7 fiducials 342 and 344 are mounted on a rod 340 suspended
8 vertically from the top of the pressure vessel. Some
9 acceptable cross-sectional shapes for the fiducials 342
and 344 are shown in Fig. 4(a).
11 It is convenient but not absolutely necessary for
12 the pressurized vessel 1D to have a cross-sectional area
13 that does not change with height. A cylinder is
14 preferred, because the height-to-volume conversion factor
is then the same regardless of the level of product
16 within the vessel. If the cross-sectional area changes
17 from top to bottom, such as in a spherical vessel, the
18 height-Go-volume conversion factors is a function of the
19 level of the product, and a table of .conversions is
required.
21 ' Referring to Fig. 2(a), three measurements are made
22 with the acoustic sensor subsystem 31. First, an
23 estimate of the speed of sound through the product
24 between the transducer and the liquid surface is made;
when the speed of sound is known, an acoustic pulse can
26 be used to measure the height of the product in the
27 pressure vessel and to measure the rate of change of
28 level. The pulse travels from the transducer to the
29 fiducial closest to the product surface.- The lower
fiducial 24 is used to measure sound speed when the
31 product surface is at the lower level 50, and the upper
32 fiducial 22 is used when the product surface is at the
33 higher level 40. The speed of sound with one fiducial
34 can be measured by
36 Ui = hi/(2ti). (1)
37
38 where
217~1~7
WO 95/169D1 PCTYUS94114465
-21-
1 Ui = the speed of sound in inches/second between
2 the transducer and either the upper fiducial
3 22 or the lower fiducial 24
4 hi -- the known distance in inches between the
transducer and the upper fiducial 22 or the
6 lower fiducial 24
7 ti = the round-trip travel time in seconds between
8 the transducer and the upper fiducial 22 or
9 the lower fiducial 24
i = either 1, which represents measurements made
11 between the transducer and the lower fiducial
12 24, or 2, which represents measurements made
13 between the transducer and the upper fiducial
14 22
If the product surface is above the upper fiducial
16 22, both fiducials can be used, with the following
17 algorithm, to estimate the speed of sound U1-zc
I(hz - hl))
UI-a~ a _-'2 (tz - tl) 1 (2)
3 Second, an estimate of the surface level of the
4 product in the pressure vessel is made; this ensures that
5 the product is at the correct level, either the higher
6 level 40 for measurements made at the operating pressure
7 of the pipeline or the lower level 50 for measurements
8 made at zero pressure. The liquid level in the pressure
9 vessel changes because of the contraction or expansion, of
10 the vapor in the pressure vessel as the pressure in the
11 pipeline system increases or decreases, respectively.
12 This estimate is repeated for each segment of a leak
13 detection test. The height of the surface above the
14 transducer in inches, ha, is then calculated from
16 hD c VS(ts)/2. (3)
17
18 where
19 h8 = the measured distance, in inches, between the
transducer and the product surface 40 or 50
WO 95/16901 PCT/U594/14465
-22-
1 is = the round-trip travel time in seconds between
2 the transducer and the product surface 40 or
3 50
4 U$ = the speed of sound in inches/second between
the transducer and the product surface; U$ is
6 estimated from either Ui (the speed of sound
7 in inches/second between the transducer and
g the fiducial 22 or 24 that is closest to the
g product surface) or Uy_a (the speed of sound in
inches/second between fiducials 22 and 24)
11 The speed of sound through the product varies as
12 the density of the product changes. For a product of
13 uniform chemical composition, the change in density is
14 dependent on the change in the temperature of the
product. As a consequence, the speed of sound through a
16 given product can be accurately determined from the
17 average temperature of the product aver the propagation
18 path of the acoustic signal. For the liquids of
19 interest, changes in the speed of sound vary linearly
over the range of ambient temperatures that will be
21 ,encountered during underground pipeline tests and can 3~e
22 determined from
23 '
24 U m mT + b, (4)
26 where
27 U = speed of sound speed in meters/second
28 T = temperature in degrees Centigrade
2g m = dU / dT in meters/second/degrees Centigrade
b = sound speed in meters/second at T = 0 degrees
31 Centigrade
32 Third, the change in the level of the product is
33 determined from
34
bhe = 39.37~,uZ-S~Ibt$ - bti] ,
36
37 where
38 Ug = Ui ~--speed of sound in meters/second between
3g the transducer and the surface; the fiducial
. W095l16901 ~ PC1'IUS94/14465
-23-
1 closest to the product surface (either
2 fiducial 22 or 24) is used in estimating the
3 speed of sound
4 bte = the change over time in the round-trip travel
time in seconds between the transducer and the
_ 6 surface
7 bti = the change over time in the round-trip travel -
8 time in seconds between the transducer and the
9 fiducial closest to the product surface
(either fiducial 22 or 24)
11 The first term in the square brackets in Equation
12 (5), btB, is a measurement of the product-level changes,
13 and the second term, bti, is used to correct the level
14 changes for errors due to sound speed changes. The
product in the pressure vessel is subject to thermal
16 expansion and contraction. In general, however, no
17 correction is made for this phenomenon because the error
18 associated with it is usually smaller than the precision
19 required of the sensor for measuring level changes. If -
the pressure vessel were large or if the temperature
21 changes of the product in the vessel were, great, the
22 height changes would be estimated with the following
23 equation, which compensates for the thermal expansion and
24 contraction of the product in the pressure vessel:
26 bhs = 39.37~~5~[bt$ - bti - CA h~Ceta~T]
27
28 where
29 V = volume, in cubic inches, of the product in the
pressure vessel at a surface height of h
31 h = height, in inches, of the liquid surface in
32 the pressure vessel above the transducer
33 A = cross-sectional area, in square inches, of the
34 , surface of the product in the pressure vessel
at a height of h above the transducer
36 Ce = coefficient of thermal expansion of the liquid
37 in the pressure vessel
38 ~T = change in the average weighted temperature
39 between the transducer and the fiducial that
R'O 95116901 PCT/US94114465
-24-
1 is located closest to the product surface
2 during the measurement
3 An estimate of--the average temperature change is made
4 from -
s QT =_ St; Ci dU ~-~
s t; UsdT
7
8 where ti is the round-trip travel time between the
9 transducer and either fiducial 22 or 24. The third term
in Equation (6), involving:~T, is the one that
11 compensates for-the thermal expansion and contraction of
12 the product in the pressure vessel.
13 An alternative yet similar equation that can be
I4 used to estimate the temperature-compensated level
changes inthe pressure vessel is
is
17 bh$ _ ~ Lbt$ - t$ ~ -CA h~Cete~Tl
18
19 The only difference between Equations (6) and (8) is the
term that is used to correct the level changes for sound
21 speed. Once the speed of sound through the layer of
22 product between.the transducer and the fiducial 22 or 24
23 has been estimated, the quantity (te/ti) in Equation (8)
24 is used to extrapolate that estimate to the layer of
product between-this fiducial 22 or 24 and the surface.
26 Another method of estimating bh is to use the speed of
27 sound through the layer of product between the two
28 fiducials 22 and 24 when the product is at the higher
29 level 40 and above the higher fiducial 22 to estimate the
sound speed changes in the layer above this upper
31 fiducial 22. This method uses
32
33 bhB = ~ Lbt9 - CA ~~Cet$~Tl 2 ~S LtiU$ + (t$-ti) Uy_2]
34
where U1-2 = speed of sound between fiducials 22 and 24.
36 The protocol for conducting a pipeline leak
37 detection test with the preferred embodiment of the '
38 invention shown in Figs. 1 and 2 is as follows:
279187
~ WO 95/16901 PCTIUS94114465
-25-
1 I. During the installation of the leak detection
2 system, it is determined what the height of the
3 liquid in the pressure vessel 10 will be (1) when
4 the pressure is zero and (2) when the pressure is
at another, higher level that will be used during a
6 test. This is done as follows. The first step is
7 to establish the height of the product when the
8 pressure is zero (i.e., atmospheric). All valves
9 62, 64, 66 and 68 are closed except for the one 62
that allows product to enter the pressure vessel
11 from the pipeline 200 via connecting lines 70 and
12 60. Valve 62 is then closed and valve 66 is
13 opened, allowing the vessel to come to atmospheric
14 pressure. The valve 64 at the juncture of the
connecting lines 60 and 80 is then opened, allowing
16 product to drain from the pressure vessel into the
17 tank or other appropriate holding container until
18 the level,of the product in the vessel falls to a
19 point as close as possible to, but still above, -
fiducial 24. Valve 64 is closed. Next valve 62 is
21 ~ opened and a submersible pump 240 is turned on and
22 allowed to pressurize the pipeline 200. The
23 pressurized product from the pipeline flows into
24 the pressure vessel via connecting line 70 and
rises to the upper level 40 (pipeline pressure
26 greater than zero). If the pressure vessel and the
27 fiducials have been properly designed, the level
28 should rise above the upper fiducial 22 until it is
29 approximately the same distance from this fiducial -
as it was from the lower fiducial 24 when the
31 pressure was zero. Once the levels have been
32 checked by means of Equation (3), a calibration can
33 be performed to establish the height-to-volume
34 conversion factor for the system.
2. The height-to-volume conversion factor, which
36 relates the level of the product in the vessel to a
37 corresponding volume, is then determined. When the
38 pressure in the vessel 10 is zero, valve 68 is
39 opened and a known quantity of product is removed
VVO 95/16901 PCT/US94114465
-26-
1 from the container. The change in level resulting
2 from this change in volume is measured with'the
3 acoustic transducer 30. The height-to-volume
4 conversion factor is obtained by dividing the _
volume change by the level change.
6 3. A leak detection teat is initiated from the system _.
7 controller 100. The system controller instructs
8 the submersible pump 240 via cable 110 to
9 pressurize the pipeline 200. However, no product
is dispensed from the line. The system controller
11 then opens valve 62 via cable 102 to allow product
12 from the pipeline to enter the pressure vessel
13 until it reaches the upper level 40 and the
14 pressure in the vapor space 33 is the same as that
in the pipeline. The pump is then turned off via a
16 command from the system controller100 via cable
17 110. The. height of the product in the pressure
18 vessel is then checked. It should be above the
19 upper fiducial 22. at the upper level 40.
4. The system controller 100 then instructs the ,
21 transducer controller 11.2 to collect data on level
22 changes over a specified period of time, nominally
23 5 minutes. The rate of change-ofthe level is
24 calculated by fitting a least-squares line to the
data. The slope of the line, when multiplied by
26 the height-to-volume conversion factor, is the rate
27 of change of volume at the higher pressure.
28 5. The system controller 100 then lets the pressure in
29 both the pipeline 200 and the pressure vessel 10
drop to zero by opening valve 64 via cable 104.
31 T~lhen zero pressure has been reached, another check
32 on the height of the product is made. It should
33 now be above fiducial 24 at the lower level 50.
34 6. The system controller 100 then instructs the
transducer controller 112 to collect data on level
36 changes over a period of time identical to the one
37 used in step 4 (for the high-level measurements).
38 The rate of change of the level is calculated by
39 fitting a least-squares line to the data. The
2179187
WO 95116901 PCTIUS94/14465
-27-
1 slope of the line, when multiplied by the height-
2 to-volume conversion factor, is the rate of change
3 of volume at the zero pressure.
4 7. The system controller then closes valve 64 via
cable 104, opens valve 62 via cable 102, and
6 instructs the submersible pump 240, via cable 110,
7 to pressurize the pipeline system. Again, the
8 level of product in the pressure vessel rises until
9 the pressure in the vessel is the same as that in
the pipeline. The height of the product in the
11 pressure vessel is again checked. Then the system
12 controller I00, via cable 110, turns off the
13 submersible pump and instructs the acoustic
14 transducer controller 112 to collect data on level
changes over a specified period of time. The rate
16 of change of the level is calculated by fitting a
17 least-squares line to the data. The slope of the
18 line, when multiplied by the height-to-volume
19 conversion factor; is the rate of change of volume
at the higher pressure (being measured now for the
21 . second .time) .
22 8. Via cable I08, the system controller 100 checks the
23 flow switch 120 continuously throughout the test to
24 determine whether any product is being dispensed.
If there has been no flow, data analysis can
26 proceed. If there has been flow, the test is
27 terminated.
28 9. Thermal fluctuations in the rate of change of
29 volume must be compensated for. The temperature-
compensated volume rate is calculated as follows.
31 The average of the two measurements of the rate of
32 change of volume obtained when product is under
33 pressure and at the upper level 40 is subtracted
34 from the rate obtained when the pressure is zero
and the product is at the lower level 50.
36 I0. If the temperature-compensated volume rate exceeds
37 a predetermined threshold, the pipeline may be
38 leaking.
WO 95116901 PCTfUS94114465
-28-
1 11. If in the first test, the threshold is exceeded,
2 two more tests identical to the one described above
3 are conducted. It is determined on the basis of
4 the last two teats whether the line should be
declared leaking. In this way the possibility of
6 false alarms is reduced. _
7 The test procedure is identical for the alternative
8 embodiments, shown in Figs. 3 through 5, that use an
9 acoustic sensor, and for the alternative embodiments
shown in Figs. 6 and 7 in which the level changes are
lI measured with a linear variable-differential transformer
12 (LVDT) and LVDT controller 312, rather than with an
13 acoustic system.
14 The primary function of the acoustic sensor 31 is
to measure-the level of, the product in the pressure
16 vessel and to detect and measure any changes in this
17 level. Any level-measurement sensor system can be used
18 providing it has sufficient accuracy, precision and
19 resolution to meet the performance standard for measuring
level and Changes in level. The acoustic sensor 31 shown
21 in Figs. 1 through 5 has been replaced in Fig. 6 by a
22 system 380 that uses an electromagnetic float 360 to
23 track the surface. The float 360 is attached to a
24 vertical rod 370 that in turn is attached to a cylinder
386 with a ferromagnetic core; the cylinder moves up and
26 down inside a linear variable-differential transformer
27 (LVDT) 382, a Commercially available device. The LVDT
28 measures the change in the magnetic field as the cylinder
29 386 moves up and down. Level changes of better than
0.001 inches can be measured. The length of the LVDT
31 depends on the difference in the levels 40 and 50 to be
32 measured. The LVDT Can be completely contained within
33 the pressure vessel as shown in Fig. 6, located on top of
34 the pressure weasel as shown in Fig. 7, or placed in any
position in between. The.LVDT measures only level
36 changes, so in order to measure absolute height, the
37 changes in level,must be continuously summed by the
38 system controller 100. Although the shape of the float
39 does not affect the performance of the measurement
R'0 95116901 ~ PCT/US94/14465
-29-
1 system, the vertical dimension of the pressure vessel can
2 be minimized if the shape of the float matches the shape
3 of the vessel. To minimize evaporation and condensation
4 effects, the float should have a crass-sectional area
nearly as wide as that of the pressure vessel. -
6 The present invention quantitatively estimates the
7 flow rate from a leak at the operating pressure of the
8 pipeline; compensates for thermal expansion and
9 contraction of both the product and the pipeline without
the need for measuring temperature .directly; can conduct
11 a leak detection teat in a short time (approximately 15
12 minutes); is self-calibrating, because it measures volume
13 directly, or measures level changes, which can easily be
14 converted to volume changes from the height-to-volume
calibration measurements or from the cross-sectional area
16 of the pressure vessel; only requires level or volume
17 measurement sensors in order for the invention to measure
18 volume changes; and increases its.performance when a
19 multiple-test strategy is used.
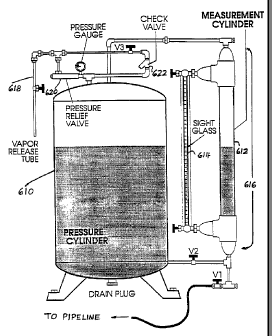
21 pESCRIPTION OF ALTERNATIVE EMBODIMENTS
2.2 ~ Four alternative embodiments of the present
23 invention are shown in Figs. 8 through 11. Each of these
24 embodiments measures the volume changes at zero pressure
and at the operating pressure of the line, keeping the
26 pressure constant during these measurements. The three- .
27 segment procedure is then used to compute the
28 temperature-compensated volume rate. The devices shown
29 in Figs. 8 and 9 measure level changes in a pressure
vessel, while those in Figs. 10 and 11 measure volume
31 changes directly. The devices shown in Figa. 8 and 9 are
32 nearly identical to the ones shown in Figs. 1 and 6,
33 except that a pressure-regulating subsystem 414 is used
34 to raise and Tower-.the pressure within the vapor apace
and to maintain a constant pressure within the vessel.
36 The devices shown in Figs. 1 and 6 maintain constant
37 pressure without any additional devices, while the ones-'
38 in Figs. 8 and 9 include a device intended for this
39 purpose. The pressure-regulating subsystem 414 consists
WO 95/16901 PCfIUS94114465
-30-
1 of a pipe 420 connecting the gas in the pressure vessel
2 to either a high- or low-pressure regulator. When the
3 valve 410 is opened, an inert gas enters the pressure
4 vessel 350. This gas is used to establish and maintain
constant pressure at the higher level. If the pressure
6 in the vessel drops below this level, a regulator 430 _
7 raises it; if the pressure rises, another regulator 432
8 lowers it appropriately. When the valve 412 is opened,
9 the inert gas is allowed to escape; thus, the gas is also
used to establish and maintain a pressure of zero in the
11 vessel 350_ If the pressure in the vessel drops below
12 zero, a regulator 440 raises it back to zero; conversely,
13 if the pressure rises above zero, a regulator 442 lowers
14 it back to zero. The acoustic sensor subsystem in Fig. 8
requires only one fiducial 462, which is located as close
16 as possible to the underside of the surface of the
17 product 39D in the pressure vessel. The device in Fig. 9
18 is identical tQ the one in Fig. 8 except that the
19 acoustic transducer measurement system has been replaced
by an electromagnetic float system like the one described
2I iri Fig. 6. _
22 The test procedure for the alternative embodiments
23 shown in Figs. 8-and 9 is very similar to that for the
24 embodiments shown in Figs. 1 and 6, except that the
pressure in thepipeline 200 and the vapor space 33 in
26 the pressure vessel is controlled with a pressure--
27 regulating subsystem 414. The higher pressure is
28 maintained constant during both measurements (Steps 4 and
29 7) by the high 430 and low 432 regulators, and the zero
pressure (Step 6) is maintained by two additional high
31 and low regulators 440-and 442.
32 Figs. 10 and 11 show a measurement system that
33 maintains a constant pressure by adding or removing a
34 known volume of product from the pipeline, and that then
sums the volume changes. In Fig. 10, the sensor 122
36 (shown in Fig. I) is replaced by a positive-displacement
37 pump 500, a motor 510, and a pressure sensor 520.
38 Product is added to the pipeline 200 through a pipe 82 or
39 removed from the pipeline through a drain line 80. The
2179187
R'O 95/16901 PCT/US94l14465
-31-
1 valve 501 is used to calibrate the positive-displacement
2 pump 500 and motor 510. The pressure sensor 520, which
3 is connected to the pipeline via a pipe 528, is used to
4 maintain the proper pressure conditions during a test.
The controller 100, which is connected electrically to
6 the pressure sensor via a cable 522 and to the motor 510
7 and positive-displacement pump 500 via cables 524 and
8 526, establishes both the high pressure and the zero
9 pressure and maintains pressure by reading the pressure
sensor and turning the displacement pump's motor on or
il off. -When the pump removes product from the pipeline
12 200, the pressure in the line drops. When the pump adds
13 product to the pipeline, the pressure rises. The volume
14 change in the line at the higher pressure or at zero
pressure is measured directly by the pump 500.
16 The device in Fig. 11 is substantially the same as
17 the one in Fig. 10, except that the motor 510 and
18 positive-displacement pump 500 have been replaced by a
19 displacement piston device 530 and a linear actuator 540.
The linear actuator is connected to the system controller
21 100 via a cable 542 and to the displacement piston 530
22 via another cable 544. The motor and positive dis-
23 placement pump have been replaced by a displacement
24 device 530 that uses a piston 532 to displace a known
volume of fluid in the containment volume 534. The
26 volume changes are determined directly from the movement
27 of the piston 532.
28 The alternative embodiment of the invention shown
29 in Fig. 10 measures volume changes directly. The
protocol for conducting a pipeline leak detection test
31 with this embodiment is as follows:
32 1. The motor 510 and positive-displacement pump 500 in
33 Fig. 10 are calibrated over the range of volume
34 measurements expected during a test. This is done
by withdrawing known amounts of liquid from the
36 line 82 via valve 501 and measuring the resulting
37 change in volume. An alternative location of the
38 valve 501 is in the line 80 connecting the pump 500
39 to the container or tank 220. A calibration curve
R'O 95/16901 PCTlUS94114465
-32-
1 is then generated by fitting a least-squares line
2 to the data that identify the measured volume and
3 the actual volume withdrawn from the line.
4 2. A leak detection test is initiated from the system
controller 100. The system controller instructs
6 the submersible pump 240 via cable 110 to,
7 pressurize the pipeline 200. Once the test
8 pressure is reached ("test pressure" meaning the
9 onehigher than zero), a command from the system
controller turns off the submersible pump via cable
11 110.
12 3. The system controller 100 then instructs the
13 positive displacement pump controller--512 to record
14 data on the change in volume over a specified
period o~ time, nominally 5 minutes. The pressure
16 in the pipeline is measured via the pressure sensor
17 520, and the system controller maintains a constant
18 pressure in the pipeline by providing instructions
19 to the motor 510 and positive-displacement pump 500
to add or remove product to maintain this pressure
21 . at a constant level during the test. The rate of
22 change of volume is calculated by fitting a least-
23 squares line to the data. The elope of the line is
24 the rate of change of volume at the higher
pressure.
26 4. The positive-displacement pump 500 removes product
27 via the drain line 80 until the pressure in the
28 pipeline 200 drops to zero. This is confirmed by
29 the pressure sensor.
5. The system controller 100 then instructs the
31 positive displacement pump controller 512 to record
32 data on the change in volume over a period of time
33 identical to the one used in Step 3 (for the high-
34 pressure measurements). The rate of change of
volume is calculated by fitting a least-squares
36 line to the data. The elope of the line is the
37 rate of change of volume at the higher pressure.
38 6. The system controller100 then pressurizes the
39 pipeline 2D0. Via cable 110 it instructs tkre
~ WO 95116901 ~ PCTIUS94114465
-33-
1 submersible pump 240 to add product to the pipeline
2 until the desired pressure has been reached. The
3 system controller then turns off the submersible
4 pump and activates the motor 510 and the positive-
s displacement pump 500, which adds or removes
6 product from the pipeline 200 over the specified
7 period of time so that the pressure remains
8 constant during this measurement, as verified by
9 the sensor 520. The rate of change of level is
calculated by fitting a least-squares line to the
11 data. The slope of the line is the rate of change
12 of volume at the higher pressure (being measured
13 now for the second time).
14 7. Via cable 108 the system controller 100 checks the
flow switch 120 continuously throughout the test to
16 determine whether any product is being dispensed.
17 If there has been no flow, data analysis can
18 proceed. If there has been flow, the test is
19 terminated.
8. Thermal fluctuations in the rate of change of
21 volume must be compensated for. The temperature-
22 compensated volume rate is calculated as follows.
23 The average of the two measurements of the rate of
24 change of volume obtained when the line is
pressurized is subtracted from the rate obtained
26 when the pressure is zero.
27 9. If the temperature-compensated volume rate exceeds
28 a predetermined threshold, the pipeline may be
29 leaking.
10. If, in the first test, the threshold is exceeded,
31 two more tests identical to the one described above
32 are conducted. It is determined on the basis of
33 the last two tests whether the line should be
34 , declared leaking. In this way the possibility of
false alarms is reduced.
36 The alternative embodiment of the invention shown
37 in Fig. 11 also measures volume changes directly. The
38 protocol
for
conducting
a
pipeline
leak
detection
test
R'O 95116901 PCTIUS94114465
-34-
1 with
this
embodiment
is
similar
to
the
embodiment
shown
2 in Fig. 10 and ie as follows:
3 1. The displacement piston device 530 and linear
4 actuator 540 in Fig. Ii are calibrated over the
S range of volume measurements expected during a
6 teat. This is done by withdrawing known amounts of
7 liquid from the line 82 via valve 501 and measuring
8 the resulting change in volume. A calibration
9 curve is then generated by fitting a least-squares
line to the data that identify the measured volume
11 and the actual volume withdrawn from the line.
12 2. A leak detection teat is initiated from the system
13 controller 100. The system controller instructs
14 the submersible pump 240 via cable 110 to
pressurize the pipeline 200. Once the test
16 pressure is reached ("test pressure" meaning the
17 one higherthan zero), a command from the system
18 controller turns off the submersible pump via cable
19 110.
3. The system controller 100 then instructs the
21 displacement piston device and linear actuator
~
22 controller 552 to record data on the change in
23 volume over a specified period of time, nominally 5
24 minutes. The pressure in the pipeline is measured
via the pressure sensor 520, and the system con-
26 trolley maintains a constant pressure in the
27 pipeline by providing instructions to the dis-
28 placement piston device 530 and linear actuator 540
29 to add or r=emove product to maintain this pressure
at a constant level during the test. The rate of
31 change of volume is calculated by fitting at least-
32 squares line to the data. The slope of the line is
33 the rate of change of volume at the higher
34 presaur~. -
4. The displacement piston device 530 removes
36 product from the pipeline via the line 82
37 until the pressure in the pipeline 200 drops
38 to aero. This is confirmed by the pressure
39 sensor.
2179187
~ WO 95/16901 PCTfUS94l14465
-35-
1 5. The system controller 100 then instructs the
2 displacement piston device and linear
3 actuator controller 552 to record data on the
4 change in volume over a period of time
identical to the one used in Step 3 (for the
6 high-pressure measurements). The rate of
7 change of volume is calculated by fitting a
8 least-squares line to the data. The slope of _
9 the line is the rate of change of volume at
the higher pressure.
11 6. The system controller 100 then pressurizes
12 the pipeline 200. Via cable 110 it instructs
13 the submersible pump 240 to add product to
14 the pipeline until the desired pressure has
been reached. The system controller then
16 turns off the submersible pump and activates
17 the displacement piston device 530 and linear
18 actuator 540, which adds or removes product
19 from the pipeline 200 over the specified
period of time so that the pressure remains
21~ constant during this measurement, as verified ,
22 by the sensor 520. The rate of change of
23 level is calculated by fitting a least-
24 squares line to the data. The slope of the
Line is the rate of change of volume at the
26 higher pressure (being measured now for the
27 second time).
28 The remaining steps necessary to complete a teat are the
29 same as steps 7 through 10 described above for the motor
510 and displacement pump 500 in Fig. 10.
31
32 ALTERNATIVES FOR COLLECTING AND ANALYZING VOLUMETRIC
33 DATA:
34 There are many alternative embodiments of the basic
method of collecting and analyzing volumetric data for
36 the conduct of a pipeline leak detection test. It is
37 required that the volumetric'data be collected at two or
38 more different pressures and during two or more
39 measurement periods (i.e. segments) that are contiguous
wo 9s1169o1
-3 6 - PCT~S94114465
1 or nearly contiguous and have the same or nearly the same
2 duration. For a high level of performance, data should
3 be. collected at two pressures using three measurement
4 segments in which the pressure separation is maximized.
A two-pressure leak detection test with only two segments
6 can be conducted, but in order to achieve a high level of
7 temperature compensation, and therefore a high level of
8 performance, the rate of change of temperature must be
9 uniform or nearly uniform. The accuracy of the two-
segment approach, which can be effective under some
li pipeline temperature conditions (especially if one
12 observes a waiting period before conducting a test), is
13 controlled by the ambient rate of change of the
14 temperature of the product at the time of the test. If
the rate ofchange of product temperature is not constant
16 during a test, the results will be in error. When a
17 third measurement segment is added, accurate temperature
18 compensation can be achieved even when pipeline
19 temperature conditions during a test are not uniform,
provided that the rate of change of temperature during
21 data collection is monotonic (i.e. that it only increases
22 or only decreases during a teat). Such temperature
23 conditions are typically encountered in underground
24 pipelines, especially those associated with storage tanks
at petroleum fuel storage facilities; thus, the two-
26 pressure, three-segment volumetric data collection and
27 analysis method will have wide application.
28 The two-pressure, three-segment approach works well
29 because the rate of change of temperature of the product
in the pipelinedoes not change with pressure but the
31 flow rate due to a leak does. The flow rate due to a
32 leak, which is usually defined at a specific line
33 pressure, can be determined directly by testing first at
34 some operationally useful test pressure and then at
atmospheric pressure (i.e. zero gauge pressure). The
36 value chosen for the test pressure, which can be either
37 below or above atmospheric pressure, is usually the same
38 as the operating pressure of the pipeline, or it is some
39 pressure specified in an environmental regulation or
2179187
W 0 95116901 PCT/US94/14465
-37-
1 professional society testing standard. The flow rate due
2 to a leak at a specific test pressure can be determined
3 even if neither of the two pressures is atmospheric,
4 provided the relationship between leak rate and pressure
is known or can be estimated empirically. For flow under
6 pressure through an orifice or hole, the relationship
7 between leak rate and pressure is well known; it is
8 proportional to the square root of pressure for liquids
9 with viscosities near water and is linear for more
viscous liquids.
11 Since it takes a finite time to change the nominal
12 pressure in the line, the two (or three) measurement seg-
13 ments will not be absolutely contiguous. For a variety
14 of reasons, the time interval between measurement
segments may need to be longer than the time required to
16 change the pressure. For example, the added time may be
17 needed to allow any pressure transients and instabilities
18 produced by the pressure change to subside before a
'19 volume measurement is made, which is particularly
important when testing long or complicated lines.
21 Additional time might also be required to insure equal
22 intervals between measurement segments when the pressure
23 changes are done manually. For best performance, the
24 segments should be of equal duration, as should the time
intervals) between them. If they are not, it does not
26 mean that a leak detection test can not be conducted, but
27 it will produce an error in the final test result. The
28 magnitude of the error is dependent primarily on the rate
29 of change of temperature of the product in the line.
It is important to note that more than three
31 measurement segments may be used. when the three-segment
32 pattern is repeated, multiple estimates of temperature-
33 compensated volume rate can be made and averaged, a
34 technique that increases the accuracy of the final test
result. It is also important to note that the nominal
36 pressure can be different during each measurement seg-
37 ment, regardless of the number of segments. If this is
38 the case, however, more stringent precision requirements
39 of the sensor used to measure volume may be needed, and
2179187
WO 95116901 PCT/US94/14465
-38-
1 the magnitudes of any errors in the final test result
2 will also be larger than a test conducted when the
3 pressures of the first and third measurement segments are
4 the same and equal to the highest (or lowest) pressure of
a three-pressure test and the pressure of the second
6 measurement segment is equal to the lowest (or highest)
7 pressure of a three-pressure test. Whether this error is
8 significant depends on what performance must be achieved
9 by the leak detection system.
The two-pressure, three-segment volumetric
11 measurement method described above can be modified either
12 for other applications or to accommodate some important
13 operational constraints that may be placed on a test.
14 One especially useful application, in which pressure is
maintained at the same level during any two consecutive
16 measurement segments in a three-segment test, has
17 operational advantages for several scenarios: (1) when
18 pressure transients occur each time the pressure is
19 changed, as is the case when testing large pipelines; (2)
when the storage, handling, or~disposal of product, which
21 might occur when pressure is changed, is.difficult'; and
22 (3) for simplification of the test-protocol when a manual
23 or semi-automatic implementation of the test methodology
24 is, used. The pressure sequence may be high-low-low, low-
high-high, high-high-low, or low-low-high, which hereaf-
26 ter will be referred to as the 'high-low-low' protocol.
27 In the implementation previously described; the pressure
28 is kept constant or nearly constant in the first and
29 third measurement segments, but is changed during the
second, or middle, segment. The pressure sequence can be
31 either high-low-high or low-high-low. The same algorithm
32 for computing the magnitude of the temperature-
33 compensated flow rate for the "high-low-high" imple-
34 m~ntation is applied for the "high-low-low"
implementation, i.e. averaging the volumetric flow rate
36 estimated during the first and third measurement segments
37 and subtracting the volumetric flow rate computed during
38 the second segment. If.one of the pressures is
39 atmospheric, the absolute value of the magnitude of the
217187
H'O 95/16901 PCT/US94/14465
-39-
1 temperature-compensated volume rate computed according to
2 the "high-low-low" protocol is equal to one-half the flow
3 rate due to a leak. The absolute value of the magnitude
4 of the temperature-compensated volume rate computed
according to the "high-low-low" protocol is equal to one-
6 half the flow rate computed with the "high-low-high" -
7 protocol if both test sequences are conducted using the
8 same pressures. If both pressures are non-zero (non-
9 atmospheric), the temperature-compensated flow rate is
equal to one-half the difference in the flow rates that
11 are estimated at both pressures. If a leak is present,
12 the flow rate is due to the leak and any errors in the
13 test; if the line is not leaking, then any nonzero flow
14 rate is due to these errors. Again, the pressures can be
positive or negative or a combination of both.
16 A manual or a semi-automatic implementation of the
17 two-pressure, three-segment test using the "high-low-low"
18 protocol, is attractive for underground pipelines
19 associated with underground storage tank (UST) and
aboveground storage tank (AST) facilities that dispense
21 petroleum with a pump, where in order to change pressure
22 in the line one must normally have control of the
23 dispensing pump. For convenience, the leak testing
24 apparatus can be attached to the line at a valve
connection located at or near the fuel dispensing pump.
26 When this pump is turned on, which can be done manually,
27 the line is pressurized. For example, this is easily.
28 done using the pump handle on a dispenser at a retail
29 motor fuel service stations. A high-low-low test can be
initiated once the pump is turned off. The decreasing
31 pressure levels required for the second and third
32 segments can be attained by removing product from the
33 line or pressure vessel or by releasing the vapor trapped
34 in the pressure vessels of three of the four test
apparatuses described above. If possible, sufficient
36 product (or vapor) should be removed so that the pressure
37 drops to atmospheric level (i.e zero gauge pressure).
38 This can be done automatically or manually by an
39 operator. Once this has been accomplished, the test can
PCTIUS94114465
WO 95!16901
-40-
1 be completed without any further pressure changes. No
2 further access to the fuel dispensing pump is required, a
3 factor that has cost, safety, and operational benefits.
4 This approach is particularly amenable to portable.~nd/or .
battery operated implementations.
6 The difference in flow rate (also called the .
7 temperature-compensated volume rate, or TCVR) between the
8 average pressure of the first and third segments and the
9 second segment is obtained by averaging the rate of
change in the volume of product as measured during the
11 first and third segments and subtracting this average
12 from the rate of change computed for the second segment.
i3 The TCVR obtained in this manner is
14
TCVR(P1,P2,P3) = L(VR1(P1)+ VR3(P3))/2l - ~2(Pa) (10)
16
17 where P1, P2, and P3 are the line pressures that are main-
18 tamed constant or nearly constant during each
19 measurement segment and VR1(P1), VR2(P2), and TIR3(P3) are
the volumetric flow rates determined for each measurement
21 segment at pressures P1, P2, and P3, respectively. ,
22 Assuming that the volume changes due to the thermal
23 expansion or contraction of the product in the line are
24 perfectly compensated for by the analysis algorithm, then
Eq. (IO) reduces to
26
27 TCVR(Py,Pa.P3) = L(LRy(P1)+ LR3(P3))./27 - LR2(P2) (lI)
28
29 where LRl(Pl). LRZ(Pz). and LR3(P3) are the volumetric
leak rates determined for each measurement segment at the
31 designated pressures. If P1, Pz, or P3 is equal to
32 atmospheric pressure, then LR1, LR2, or LR3, respectively,
33 would be aero....._
34 In practice,.there will be some type.of error due
to residual compensation errors, as well as sensor noise
36 and other sources of noise not compensated for by this '
37 technique. For best performance, the difference between
38 the lowest and highest pressures should be as great as
39 possible, and the precision (i.e. volumetric sensor
2179187
WO 95/16901 PCT/US94/14465
-41-
1 noise) should be smaller than the error in estimating the -
2 TCVR that is determined in Eq. (10) and that is due to
3 the leak rate of interest. In all of the implementations
4 described above, whether they are based on two pressures
and three segments or on three pressures and three
6 segments, the flow rate can be derived from Eq. (10).
7 The error in compensating for the thermal expansion -
8 or contraction of the liquid product in the pipeline can
9 be estimated as part of the test procedure if there is
time to permit the addition of one or more measurement
11 segments to the leak detection test. The approach is to
12 use the same analysis algorithm, but to apply it to three
13 segments in which the pressure is the same or nearly the
14 same. Since the flow rate due to a Leak would be the
same in each segment, any non-zero estimate of flow rate
16 would be due mainly to the error in compensation. This
17 calculation would also quantify other errors (E. a. sensor
18 errors). There are many ways to incorporate this error
19 calculation into the test procedure. For example, if a
low-high segment is added to the end of a high-low-high
~ 21 two-pressure, three-segment test, then the first, third,
22 and fifth segments can be used to estimate-the error in
23 temperature compensation and the first three, middle
24 three, last three, or an average of any of these three -
segments can be used as the basis for the leak detection
26 test. If the error is substantial, especially in
27 comparison to the estimated TCVR, the teat should be
28 considered invalid and should be repeated. Another
29 example is to add a low-pressure segment at the end of a
high-low-low sequence. The first three segments are then -
31 used as the basis for the leak detection test, and the
32 last three to estimate the error in temperature
33 compensation. The estimate is less meaningful this way,
34 because the data used as the basis for the test have been
collected over a somewhat different period in time than
36 those used to estimate the temperature compensation
37 error.
38 Another method for obtaining an error estimate uses
39 the difference between two temperature-compensated volume
PCTlUS94114465
wo 9sns9oi
-42-
1 change or flow rate tests. If two tests are conducted
2 (whether or not the tests have overlapping measurement
3 segments), the volume of flow rate due to a leak should
4 be the same if the leak rate remains constant over the
period of time in which the two tests are made.
6 Therefore, any difference between the two test results
7 will provide an estimate of the error in the test
8 results. Comparisons of multiple test results will
9 provide a more accurate error estimate, but will also
take more time to obtain.
11
12
13 SIMPLIFIED APPARATBS FOR LEA& DETECTION:
14 The technology described above-can be implemented
very simply if (1) the level changes that occur in the
16 pressure vessel shown in FIGS. 1 and 6, which are due to
17 volume changes in the pipeline, are magnified so that
18 they can be made manually with a ruler or electronically
19 with an inexpensive, low-precision level sensor; and (2)
the need to transfer liquid in and out o~,the pressure
21 vessel for the purpose ofchanging line presaure,from one
22 measurement segment to the next can be eliminated. Both
23 goals can be accomplished with the embodiment shown in
24 FIG. 12. This device is simple and inexpensive to make
because there is no need for a high-precision level
26 sensor or for electronic access to the transfer pump; it
27 is also inherently safe to use in pipelines containing
28 potentially combustible liquids such as petroleum
29 products, because it does not use electrical power.
Furthermore, these advantages can be realized without any
31 sacrifice in the overall performance of the system in
32 detecting pipeline leaks. The leak detection system can
33 be permanently attached to a pipeline or,it can be a
34 portable system attached to a line only for the purpose
of conducting a test.
36 The key functional features of the embodiment shown
37 in FIG. 12 for conducting a leak detection test are as
38 follows: (1) a large-diameter, cylindrical pressure
39 vessel (pressure cylinder 610), (2) a small-diameter,
2179187
W0 95116901 PC1YUS94/14465
-43-
1 cylindrical pressure vessel of similar height
2 (measurement cylinder 612), (3) a sight glass with a .
3 ruler or tape marked in increments of approximately 1/16
4 inch for measuring the level of liquid in measurement
cylinder 612, and (4) three manually operated valves V1,
6 V2, V3. Measurement cylinder assembly 616 includes both
7 measurement cylinder 612 and the Level gauge (i-ee. sight
8 glass 614 with measurement tape). Pressure cylinder 610
9 and measurement cylinder 612, as well as connecting
piping, are preferably constructed of steel; however, any
I1 material that can withstand the maximum expected pressure
12 can be used. Sight glass 614 is preferably constructed
13 of glass, which is clear to permit the liquid level to be
i4 read but sufficiently robust to withstand the pressures
at which the system is used (typically 30-I00 psi).
16 The purpose of pressure cylinder 6I0 in FIG. 12,
17 which is also the main purpose of the pressure cylinder
18 in the embodiments shown in FIGS. 1 and 6, is to maintain
19 constant pressure in the pipeline during each of the
measurement segments that comprise a Leak detection test.
21 The~purpose of measurement cylinder 614 is to magnify
22 those volume changes occurring in the pipeline that are
23 due either to a leak or to thermal influences in such a
24 way that small changes in volume are converted into large
changes in level that can be measured easily through
26 sight glass 6I4. For this purpose, sight glass 614 (with
27 its measurement tape) is attached to measurement cylinder
28 6I2. If measurement cylinder 612 is 1-5/8 inches in
29 diameter and sight glass 612 is 5/8 inch in diameter,
then volume changes of 3 ml occurring in the pipeline can
31 be measured by reading the level changes in sight glass
32 612 to I/16 inch. A crucial difference between the
33 embodiment shown in FIG. 12 and those shown in FIGS. 1
34 and 6 is that during a test the liquid in the pipeline
communicates only with the liquid in measurement cylinder
36 612 and not with the liquid in pressure cylinder 610.
37 The function of measurement cylinder 612 is not to
38 measure level changes, but rather to magnify small
39 changes in volume occurring in the pipeline. In the
wo:9s,mvoa ~ ~ ~ ~ ~ 8 ~ rc~rmssanaass
-44-
1 embodiment in FIG. 12, it is sight glass 614 and its
2 measurement tape that are used to measure the level
3 changes in measurement cylinder 612. It should be noted,
4 however, that measurement cylinder 612 itself could be .
used for this purpose if it were made of a transparent
6 material and a tape measure were attached to it.
7 Each of the three valves on the embodiment shown in
8 FIG. 12 has a specific purpose. V1 must be open to ,
9 pressurize the pipeline and leak detection system for a
test and to conduct a test. When V1 is closed, the leak
11 detection system is completely isolated from the
12 pipeline. When--open, VI lets liquid from the pipeline
13 into measurement cylinder 6i2 or from measurement
14 cylinder 612 into the pipeline. Pressurization is
accomplished by pumping liquid product-into the
16 measurement and pressure cylinders 612 and 6I0; V2 must
17 also be open during the pressurization process. For beat
18 performance during the ensuing leak detection test, both
19 cylinders should be nearly empty before the presauriza- -
tion process begins; this results in the maximum volume
21 of-vapor being trapped at the: test pressure,which means
22 that the pressure can be ,better maintained at a constant
23 level during each measurement segment. V2 is used to
24 isolate level changes that occur in pressure cylinder 610
from changes in the level of liquid-in measurement
26 cylinder 612 and pipeline. This valve must be closed
27 during each measurement segment of a leak detection test.
28 As noted above, when measurement cylinder 612 is isolated
29 from pressure cylinder 610 by closing V2, very small
changes in the volume of liquid in the pipeline can be
31 accurately meaaured at a constant pressure. V3 is used
32 to lower the pressure in both the pipeline~and the leak
33 detection system (i-ee. the measurement and pressure
34 cylinders 612 and 610). When V3 is opened, vapor is
released from both cylinders through vapor release tube
36 618; if all of the vapor is released, the pressure in the
37 pipeline returns to atmospheric level (i.e. zero gauge
38 pressure). For safe operation, the apparatus also
39 includes pressure relief valve 620 to prevent inadver-
wo 9sns9ol 21 l 918 7
PCT/US94114465
-45-
1 tent over-pressurization of the system and liquid check
2 valve 622 to prevent the possibility of liquid
3 overflowing during a test.
4 The embodiment shown in FIG. 12, as well as those
in FIGS. 1 and 6, uses a pump to pressurize the pipeline.
6 A slight modification to the embodiment in FIG. 12 will
7 allow pressurization by means of bottled gas such as
S nitrogen, thus eliminating the need to use the transfer
9 pump or another pump dedicated to this purpose. This
modified embodiment is shown in FIG. 13. One advantage
11 of pressurizing the line with bottled gas 624 such as
12 nitrogen is that the operator can conduct the entire test
13 without leaving the site of the leak detection system.
14 Another advantage is that once the pressure and
measurement cylinders 610, 612 have been filled with an
y6 amount of liquid sufficient for conducting a teat, they
17 do not have to be emptied and refilled again to repres-
18 surize the line for the conduct of a test. The bottled
19 gas 624 can be permanently attached to the leak. detection
system or it can be a portable unit that is attached to
21 the system any time a test is conducted. When V5 and V3
' 22 are open and V4 is closed, the pipeline can be
23 pressurized. Once the, line has been pressurized, V5 and
24 V3 are closed and V4 is opened; from then on the steps
for performing a leak detection test are identical for
26 the embodiments shown in FIGS. 12 and 13.
27 Using the bottled gas pressurization technique,
28 however, requires that there be sufficient product
29 already present in the apparatus before a leak detection
34 test is initiated. It should be noted that once the test
31 pressure is reached, the gas bottle 624 is isolated from
32 the pressure cylinder by means of a valve, and no further -
33 pressurization of the pipeline is required. In contrast,
34 in theembodiments shown in FIGS. 8 and 9, gas is
continuously added or removed as the means of maintaining
36 constant pressure during each measurement segment. In -
37 the embodiment shown in FIG. 13, the volume of vapor in
38 the pressure cylinder 610 (which is in direct
39 communication with measurement cylinder 612) is large
PCTIUS94/14465
wo 9s/1s9o1 ~ ~ ~ ~ ~ g
-46-
1 enough to maintain approximately constant pressure in the
2 pipeline without any active adjustments in pressure.
3 The embodiments in FIGS. 12 and 13 can be designed
4 for applicability to a wide range of pipelines of
different sizes-and diameters. One of the most important
6 is the kind of large underground pipeline found at
7 terminals for aboveground storage tanks (ASTa) that
8 contain petroleum products. These lines are typically 4
9 to 10 inches in diameter and 100 to 500 feet in length.
Both embodiments are also applicable to. the smaller lines
11 associated with underground storage tank (UST)
12 facilities, fog example, the lines found at retail gas
13 stations. These are typically 2 inches in diameter and
14 50 to 200 feet-3n length. These embodiments can be used
to test lines larger than those found at terminals. The
16 main difference between the embodiments for use oa
17 smaller lines and those for use on larger lines is in the
18 size of the pressure and measurement cylinders 610, 612.
19 Both the diameter and the height of the two cylinders
must be increased as the diameter and/or length of the
21 pipeline increases. The correct size of the pressure and
22 measurement cylinders 610, 6i2 for a given line can be
23 calculated analytically using the perfect gas law.
24 The diameter and height of the two cylinders should
be such that they can (1) accommodate the anticipated
26 changes in the volume of product in the line, regardless
27 of whether these changes are due to a leak or to thermal
28 expansion and contraction of the product, and (2) limit,
29 during any given measurement segment, the pressure
changes due to such volume changes while (3) still
31 maintaining an acceptable level of precision. The
32 pressure cylinder 610 must be large enough that any
33 pressure changes occurring within it (and resulting from
34 volume changes in the line) are small in relation to it.
Similarly, the measurement cylinder 612 and sight glass
36 614 must be large enough height-wise to handle the
37 product volume changes that might occur during a
38 measurement segment, yet small enough in diameter that
39 level changes can be measured precisely. If the diameter
2119187
. WO 95116901 PCTIUS94/14465
-47-
1 of the measurement cylinder 612 is too large, there is a
2 loss of precision in the ability to measure volume
3 changes in the pipeline. If its diameter or length is
4 too small, the apparatus may not be able to accommodate
the volume changes that occur during a measurement
6 segment (whether due to a leak or to thermal influences).
7 The measurement cylinder 612 can be configured so that it
8 is longer than the pressure cylinder 610, extending above
9 and/or below it; this will permit the leak detection
system to accommodate even larger leaks and larger
11.-thermally induced volume changes.
12 As indicated above, the size of the pressure and
13 measurement cylinders 610, 612 will depend on the
14 application. Several examples of typical cylinder
geometries are given below. When used to test the
16 larger-capacity pipelines associated with ASTs containing
17 petroleum products, the pressure cylinder might be
,18 apprpximately 16 inches in diameter and 36 to 48 inches
19 high, and the measurement cylinder 2 to 2-1/2 inches in
diameter and at least the same height as the pressure
21 cylinder. When used to test the smaller-diameter lines
22 associated with moat USTs containing petroleum products,
23 the pressure cylinder would typically be 4 to 6 inches in
24 diameter. and 12 to 24 inches high, and the measurement
cylinder 1 to 1-1/2 inches in diameter and approximately
26 the same height as the pressure cylinder. Both of these
27 typical cylinder geometriea can be shown to accommodate a
28 wide range of testing conditions at AST and UST
29 facilities.
The general approach to testing a pipeline with
31 either of the two embodiments of the device shown in
32 FIGS. 12 and 13 is, as with the other embodiments shown
33 in FIGS. 1 and 6, to divide a teat into three or more
34 distinct 'measurement segments". The measurement
segments are used in different combinations to obtain
36 both the temperature-compensated volume rate between the
37 average of the highest and the lowest pressures (test
38 result) and an estimate of the error in the test result
39 (test error). For example, when two of three measurement
WO 95/16901 ~ PCTIUS94114465
-48-
1 segments are conducted at two different pressures, an
2 estimate can be_made of the difference in temperature-
3 compensated flow rate between the two pressures; when
4 three contiguous or three alternating measurement
segments are conducted at the same nominal pressure, an
6 estimate can be made o~ the error in temperature ,
7 compensation volume rate. This error estimate includes
8 the error in temperature compensation, level readings,
9 and uniformity of leak rate. The number of segments, the
level of pressure during each segment, and the sequence
11 of high- and low-pressure segments are all application-
12 dependent.
13 For a manually conducted Leak detection test, a
14 high-low-low-low data collection protocol can be used,
where the higher pressure is the test pressure and the
16 lower one is atmospheric (i-ee. zero-gauge pressure). The
17 test pressure can be established by means of either a
18 pump or bottled gas, and the lower pressure is obtained
19 by simply opening V3 and allowing the.vapor to be
released. Provided that the pressure cylinder 610 has a
21 large enough diameter-and that it contains a Targe enough
22 volume of vapor, pressure in the line will not change
23 significantly during any of the four measurement segments
24 unless there is._a very large change in the volume of
liquid in-the line.
26 When the apparatus in FIG_ 12 is to be used to
27 conduct such a high-low-low-low test, V1 and V2 are
28 opened, V3 is closed, and the transfer pump is turned on
29 until both the pipeline and apparatus have been
pressurized. Eroduct will enter the pressure cylinder
31 610 until the pressure in the vapor space of that
32 cylinder is equal to the pressure in the line. (As
33 stated above, if pressure cylinder 6I0 already contains
34 enough liquid for the conduct of a test, it can be
pressurized with a bottled gas such as nitrogen using the
36 apparatus in FTG. 13.) Once the liquid in sight glass
37 614 reaches a constant level, the apparatus is fully
38 pressurized and the test can begin. At this point, the
39 transfer pump (or the connection to the bottled gas) is
2179187
WO 95116901 PCTlUS941144fi5
-49-
1 turned off and V2 is closed. Any volume changes in the
2 line during the measurement segment are reflected as
3 level changes in the measurement cylinder assembly 616.
4 V3 is then opened, releasing vapor, and the pressure is
lowered to zero. Once the system has beendepressurized,
6 V3 is closed, and V2 is opened so that the liquid in the
7 measurement cylinder 612 comes into equilibrium with that
8 in the pressure-cylinder 6I0. V2 is then closed in
9 preparation for the next segment, conducted at
atmospheric (zero gauge) pressure. The process is
11 repeated twice more to complete a test.
i2 FIG. 14 illustrates a typical test sequence. The _
13 data collection portion of this leak detection test takes
14 26 minutes. There are four 5-minute segments during
which level measurements are made. Each 5-minute segment
16 is separated from the next by a 2-minute interval that
17 allows the test operator to depressurize the line by
18 opening and closing the appropriate valves. This 2-
19 minute interval also serves to let the level of liquid in
the measurement cylinder stabilize after the line has
21 been depressurized. '
22 At the beginning and end of each level-measurement
23 segment, the test operator reads and records the level of
24 the liquid product in the sight glass 614 attached to the
measurement cylinder 612. For high performance, this
26 reading should be made to the nearest 1/16 inch or
27 better; even if the manual readings are not this
28 accurate, system performance may still be acceptable. .
29 This leak detection test requires eight measurements in
all, one at the beginning and one at the end of each of
31 the four measurement segments. The first six (made in
32 this teat sequence at 0, 5, 7, 12, I7, and 21 minutes
33 after the start of a test and shown on the time line in
34 FIG. 14) are used to compute the test result. The last
six (made in this test sequence at 7, 12, 17, 21, and 26 -
36 minutes) are used to compute the test error.
37 FIG. 15 illustrates an embodiment of the device
38 implemented with an electronic sensor for measuring the
39 level changes in the measurement cylinder. This
WO 95116901 PCT/US94114465
-50-
1 embodiment is similar to the one in FIG. 12, but can be
2 implemented using the apparatus shown in FIG. 13 as well.
3 In this electronic embodiment, a differential pressure
4 sensor 626 is used; however, any type of level sensor
with acceptable precision would be usable. The only
6 difference between the embodiment in FIG. 12 and that in
7 FIG. 15 is that the former uae a tape and a sight glass
8 614 for measuring level changes and the latter uses an
9 electronic sensor 626. This sensor has one port 628
connected to the measurement cylinder below the liquid
11 level and one port 630 connected to the measurement
i2 cylinder above the liquid level. The difference in
I3 pressure can be used to determine changes in liquid
14 level, and the sensor need only have a precision equal to
that obtained by a person reading an inexpensive ruler.
16 As mentioned above, when the measurement cylinder is
17 properly sized, it makes little difference whether the
18 level readings are made manually or electronically; the
19 performance of the leak detection system will be very
nearly identical in either case. FIG. 16.shows an
21 embodiment with a capability for both manual and ,
22 electronic measurements. This embodiment allows a manual
23 test to be conducted and the level-change data to be
24 collected and archived for later data quality assurance
and auditing.
26 What is claimed is: