Note: Descriptions are shown in the official language in which they were submitted.
WO 95/22048 PCT/US95/01777
.
2 ~ 8286~
t -
FLUORESCENT SPECTRAL DIFFERENTIAL MEASUREMENT
OF A SUBSTRATE COATING
Cross Reference to Co-pending Applications
This invention is related to, and filed concurrently with, U.S.
Patent application Ser. No. 08/193,599 entitled MULTIPLE LAYER
CALIPER MEASUREMENTS USING PHOTOISOMERS and assigned to
the same assignee.
Field of the Invention
The present invention relates generally to spectroscopic
measurement of fluorescent compounds and particularly to exploiting a
characteristic of a class of fluorescent compounds that are readily identified
from a first derivative analysis of the emissions spectrum of the
fluorescent compound.
Background of the Invention
~0 95/22048 PCI-/US95/01777
2 1 &2`865
.
In the discussion below, the term "fluorescence" refers to
luminescence in general and encompasses fluorescence and
phosphorescence. Fluorescent spectrophotometry refers to those devices
and methods used for measuring the intensity or the wavelength spectra
of the fluorescent light emitted from a fluorescent compound. The
purpose for measuring these emissions is to analyze the measured
material qualitatively or quantitatively. A representative method is
disclosed in U.S. Patent No. 4,922,133 issued to Melancon where
fluorescent probes are added to functional compositions or coatings and
the intensity of fluorescence is correlated to the weight or thickness of the
functional composition.
In general, a fluorescent spectrophotometer includes a light
source having an output wavelength suitable for exciting a fluorescent
compound. The output light from the light source is directed onto the
material specimen raising the electron state of the fluorescent compound
contained within the material specimen. Fluorescence occurs when the
shifted electron returns to its previous state emitting photons of radiant
energy. Light emitted from the fluorescent compound is collected and
directed toward a spectrophotometer or monochromator for dispersing the
emitted fluorescent light into monochromatic wavelengths. The
monochromated light is directed at a photodetector and the intensity and
wavelength of the light can be tested and measured. Fluorescent
spectrophotometry is well known in the art and represented in U.S. Patent
No. 3,832,555 issued to Ohnishi. U.S. Patent No. 4,877,965 issued to
Dandliker et al. discloses a time gated method of acquisition of fluorescent
light as a method for discriminating the fluorescence from unwanted
background noise.
The existing art is not capable of distinguishing two or more
fluorescent emissions sources with similar overlapping emissions spectra.
Where there is a need to measure more than one component, existing
WO 951220~8 PCT/US95/01777
21 ~2&65
practice is to employ dissimilar fluorescent compounds. This necessitates
the use of multiple light sources, monochromators, detectors, and
associated optics.
Summary of the Invention
The invention comprises a method for measuring a
fluorescent emission value of a functional coating of a substrate. The
method comprises the steps of providing a functional coating with an
effective amount of a fluorescer that absorbs radiant energy in a
wavelength range A and emits radiant energy in an emission wavelength
range B and contains within the emission wavelength range B a narrower
wavelength range C wherein the amount of emitted radiant energy
changes abruptly from the emission in that part of range B which is just
below range C and the emission in range C. The functional coating is
excited with radiant energy of the wavelength of range A and the radiant
energy emissions of wavelength range B, including the wavelength range
C emitted by the functional coating are detected. A derivative calculation
of the detected wavelength range C is performed to obtain a differential
change in radiant energy emissions of the functional coating.
The invention also comprises an apparatus to detect the
fluorescent emissions of a functional composition applied to all or part of
a substrate having a known absorption wavelength range and a known
Pmi.~sjon wavelength range. The ~ys~em comprises fluorescer means with
an emissions wavelength range containing an included narrower
fluorescent emissions wavelength range within which the intensity of the
emissions changes abruptly. This narrower range is useful for measuring
the fluorescent emissions intensity of a functional coating containing the
fluorescer. Detection means is adjusted to the narrower included
fluorescent wavelength range of the fluorescer detects the level of
fluorescent emissions in this narrower included wavelength range when
radiant energy in the absorption wavelength range of the fluorescer excites
WO 9St22048 PC'r/US95/01777
2t821365
the fluorescer. An analyzer analyzes the fluorescent emission change of
the narrower included fluorescent wavelength range to obtain a value and
a correlator correlates the value obtained from analysis of the fluorescent
emissions intensity to a physical characteristic of the functional coating.
Brief Description of the Drawings
Figure la is a graphic representation of the emissions
wavelength spectrum for 9-ICF.
Figure lb is a graphic representation of the first derivative of
the curve in Figure la.
Figure 2 is a graphic representation of the emissions
wavelength spectra of several hot melt adhesives.
Figure 3a is the emissions wavelength spectra of the same
several hot melt adhesives with the addition of the fluorescer 9-ICF as a
fluorescent probe.
Figure 3b is a graphic representation of the first derivatives of
each curve in Figure 3a.
Figure 4a is a graphic representation of the emissions
wavelength spectrum for the fluorescer a-NPO.
Figure 4b is a graphic representation of the derivative of
Figure 4a.
Figure 4c is a graphic representation of the emissions
wavelength spectrum for the fluorescer Uvitex OB.
Figure 4d is a graphic representation of the first derivative
curve of the graph in Figure 4c.
Figure 4e is a graphic representation of the emissions
wavelength spectrum for Kraton adhesive from two layers, one layer
containing the fluorescer a-NPO, the second layer containing the
fluorescer Uvitex OB as fluorescent probes.
.
- WO 95/22048 PCTIUS95/01777
2 1 82~365
Figure 4f is a graphic representation of the first derivative of
the curve in Figure 4e.
Figure 5 is a schematic representation of an embodiment of
the present invention.
Figure 6 is a side schematic view of an exit slit for a
monochromator.
Figure 7 is a schematic view of a narrow port chopper used in
the invention.
Figure 8a is a graphic representation of a demonstrative
10emissions wavelength spectrum of a fluorescer.
Figure 8b is a graphic representation of the emissions
wavelength spectrum obtained through a narrow port chopper.
Figure 8c is a graphic representation of the first derivative of
the curve in Figure 8b.
15Figure 9a is a schematic view of a wide port chopper as used
in the invention.
Figure 9b is a view similar to Figure 9a demonstrating the use
of a wide port chopper.
Figure 10a is a graph of the emissions wavelength spectrum
20of a demonstrative fluorescer.
Figure 10b is a graphic representation of the emissions
wavelength spectrum output through a wide port chopper.
Figure 10c is a graphic representation of the first derivative of
the curve in Pigure 10b.
25Figure 10d is a graphic representation of the second
derivative of the curve in Figure 10c.
Figure 11 is a graphic representation of the emissions
- wavelength spectrum for a demonstrative fluorescer.
Figure 12 is a schematic view of a ~y~lem embodiment of the
30invention.
WO 95/22W8 PCT/US95/01777
2 ~ 82~5
6 ;
Figure 13 is a side schematic view of an embodiment of the
invention.
Detailed Description of the Invention
The graph of Figure la depicts the fluorescent intensity curve
for the emissions spectrum of 9-isocyantofluorene (9-ICF) through the
wavelength range from 280 nm out to 330 nm. Using existing methods
and sy~lems, if 9-ICF is the only fluorescent compound emitting in the
wavelength region being detected, then a single simple measurement of
emission output intensity at any point within the emissions wavelength
range is representative of the amount of 9-ICF within the functional
composition, for example a thin film. However, the present invention is a
different apparatus and method for evaluating the emissions output of a
fluorescer and is especially useful in those circumstances where there is
more than one fluorescent compound emitting in the same or similar
overlapping emissions output wavelength range.
In Figure la, a region 20 depicts approximately a 7 nm
spectrum range from 302 nm to 309 nm. Within region 20 there is an
abrupt change in emissions intensity from 9-ICF. As depicted in Figure lb,
performing a first order derivative, or differential, on the curve in Figure
la produces a dramatic peak 22 centered on about peak slope point 24
corresponding to the 305 nm wavelength. The curve immediately to
either side of peak 22 and bounded by region 20 represents the change in
the slope of the emissions output curve depicted in Figure la through
region 20. The curve in Figure lb is representative of the emissions
output for 9-ICF. Since it was 9-ICF that caused the change in emissions
output through range 20, the values obtained for the peak slope of the
curve in Figure lb can be compared to known standards of various
` concentrations of 9-ICF to obtain the absolute amount of 9-ICF detected. If
9-ICF is used as a fluorescent probe in a functional composition then the
thickness or weight of the functional composition is determinable by
- WO 95122048 rCT~/US95/01777
2 ~ ~2~65
. ; , . .
knowing the concentration of 9-ICF in the functional composition after
applied to a substrate.
Some circumstances encounter more than one fluorescent
compound. If the emissions spectra for the fluorescent compounds
overlap then each fluorescent compound will compete or interfere against
the others. Existing art using the simple single measurements of an
emissions output at any of the wavelengths within the overlapping
emissions wavelength range will not be able to distinguish the individual
contributions made by each of the competing compounds.
A practical limitation due to competing or interfering
fluorescent compounds is evident in Figure 2 depicting the emissions
output curves 30, 40 and 50 for three different hot melt adhesives. These
hot melts are used as adhesive backing to a substrate which can either be a
thin film itself or a substrate for an additional application of thin films. As
is evident from the fluorescent e`mission curves in Figure 2, hot melts
vigorously fluoresce throughout the 285 nm to 330 nm range. A
fluorescent probe, such as 9-ICF, mixed within a functional composition, is
a weak fluorescent emitter by comparison to the strongly emitting hot
melt adhesives represented by curves 30, 40 and 50.
Figure 3a depicts the respective emissions output intensity
curves 32, 42 and 52 containing the addition of the 9-ICF fluorescent probe
as a thin film functional coating with each hot melt adhesive. The
additional effects of the 9-ICF fluorescent probe are virtually undetectable
against-the competing background emissions, even through the narrower
wavelength range of region 20. Consequently, a fluorescent probe and any
other component of the product that emits within the same broad
wavelength band of emissions will compete throughout that broad
wavelength band. The fluorescent probe will likely be undetectable by
existing means.
WO 95/220~8 PCT/US95/01777
.
2 1 ~2865
- . . . .. -
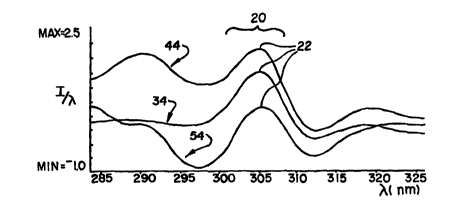
Figure 3b depicts the present invention's ability to detect the
abrupt change in fluorescent emissions output contributed by fluorescent
probe 9-ICF despite the competing emissions of the hot melt adhesives. As
depicted in Figure 3b, first order derivative curves 34, 44 and 54, or
differentials, are plotted from the respective emissions curves 32, 42 and 52
of Figure 3a. The peaks occurring at point 22, the 305 nm wavelength, for
each hot melt plus fluorescer probe corresponds to the peak for 9-ICF as
demonstrated in Figure lb. Point 22 of curves 34, 44 and 54 in Figure 3b
represent the peak slope point 24 of the emission curves 32, 42 and 52 of
Figure 3a. The fluorescent intensity of the 9-ICF probe is proportional to
the peak slope minus the average of the side slopes. Consequently, the
peak slope is also directly proportional to the amount of 9-ICF present in
the functional coating. Since the concentration of the fluorescent probe 9-
ICF in the functional coating will be known, the intensity of 9-ICF will be
proportional to the total amount of functional coating applied as a thin
film to the substrate.
It is recognized that, within the context of this invention,
functional coatings or compounds may be selected for/from various uses.
Some uses include protective coatings, adhesive backside coatings,
radiation-sensitive imageable coatings, release coatings, and barrier
coatings. Preferred coatings permit fluorescent probes for use in the
coatings to be chemically bound to the coatings, soluble in the coating, or
dispersed in the coating composition. Proper selection of coatings and
probes, when utilized according to the teachings of this invention, permit
correlation of the derivative values of emissions to certain characteristic(s)
of the coating(s). These characteristics include, for example, thickness,
weight, uniformity, defects, and other markings
Many manufacturing processes can use multiple fluorescent
probes within the different functional compounds as aids to measuring
the weight or thickness of each functional compound. In this way, one can
WO 95/22018 PCT/US95/01777
- 2 1 82865
g
.
have manufacturing control and quality assessment as each functional
compound is added to the product. The ability to detect simil~r competing
fluorescers used as probes allows the convenience of working within the
same wavelength region. As an example, each fluorescer 9-ICF, a-NPO,
and Uvitex OB are excited at 325 nm. Thus, only a single light source for
excitation of the probes is needed and only a single monochromator and
detector are likewise needed.
If unable to use similar and thus competing fluorescers, then
the fluorescent probes must operate in dissimilar wavelength ranges each
requiring its own setup for excitation and emissions detection in separate
portions of the spectrum. Use of dissimilar probes often requires using
one probe that absorbs and emits in the ultraviolet range and a second
probe that both absorbs and emits below the absorption and emissions of
the first probe. This avoids inappropriate excitation of the second probe
and undue quenching of the first probe as a consequence of the second
probe absorbing the emissions of the first probe. The second probe is
usually from a group that absorbs and emits in the visible spectrum.
Unfortunately, use of fluorescent probes that emit in the visible spectrum
will also affect the color purity and clarity of the final product which may
be undesirable. Circumstances of manufacture may require the application
of more than one functional composition. Existing methods do not
provide for, or anticipate, simultaneous measurement of two fluorescent
probes with overlapping emissions spectra.
Another embodiment of the present invention allows
simultaneous discrimination and measurement of multiple fluorescent
probes. Figure 4a depicts an emissions curve 60, the emissions spectrum
for the fluorescer a-NPO. A region 62 of curve 60 denotes a narrower
wavelength range of curve 60 where fluorescent emissions change
abruptly for a-NPO. Figure 4b depicts curve 64 which is a first order
W 095/22048 PCT~US95/01777
21 ~2865
10 . .
derivative of curve 60 from Figure 4a. A peak 66 of curve 64 corresponds
to the abrupt change in emissions output and is representative of a-NPO.
Figure 4c depicts an emissions curve 70, the emissions
spectrum for the fluorescer Uvitex OB. A region 72 of curve 70 denotes the
narrower wavelength range of curve 70 where fluorescent emissions
change abruptly for Uvitex OB. Note that region 72 of curve 70 includes
the wavelength band of approximately 395 to 405 nm. From curve 60 in
Figure 4a, a point 68 corresponds to the peak emissions wavelength for a-
NPO which is also in the wavelength range of curve 70 corresponding to
region 72 in Figure 4c. Existing methods would not be able to measure the
presence of the fluorescer Uvitex OB in the presence of the fluorescer a-
NPO. Due to this competition between these two fluorescent probes,
existing methods would teach away from using these two fluorescers
simultaneously.
Figure 4e depicts an emissions curve 80 obtained from the
fluorescers a-NPO and Uvitex OB used as fluorescent probes in separate
functional coating layers of Kraton adhesive applied to a polypropylene
thin film substrate. a-NPOis depicted at a concentration of 0.1% of solids
and Uvitex OB is depicted at a concentration of 0.3% of solids. Kraton
adhesive and polypropylene do not appreciably absorb or fluoresce in the
wavelengths measured for these two fluorescent probes. In Figure 4e,
region 62 represents the abrupt change in fluorescent wavelength
emissions for a-NPO, which is discernable but not useful. Region 72
corresponds to the abrupt change in fluorescent wavelength emissions for
Uvitex OB and is indistinguishable from the peak emissions generated by
a-NPO in this same wavelength range.
Figure 4f depicts a curve 82 which is the first derivative of
curve 80 from Figure 4e. In Figure 4f, peaks 66 and 76 representing a-NPO
WO 95/22048 PCT/US~5/01777
21 828~5
11
and Uvitex OB respectively are evident and easily measured. Since each
peak is proportional to the amount of its respective fluorescer then each
peak is proportional to the weight or thickness of the Kraton adhesive
layer represented by each individual fluorescent probe applied to the
polypropylene substrate.
Data suggests that for 9-ICF, a-NPO and Uvitex OB the
invention is sufficiently sensitive to be able to detect a fluorescer with as
little as a 1% change in the total emissions output over the narrower
included wavelength range. The sharper or more dramatic the abrupt
change in fluorescent output through this narrower range the more
sensitive the detection. For a fluorescer with an abrupt change over
approximately a narrow 15 nm wavelength range, the fluorescer should be
of sufficient quantity or concentration in the functional composition to
contribute to approximately a 5% change in the overall emissions
intensity. For more abrupt changes approaching a narrower wavelength
range of 3 nm, a change of only 1% from the overall emissions intensity is
detectable. It is anticipated that other fluorescers are available or will be
developed to take advantage of, and fall within the scope of, the present
invention and also expand the sensitivity.
Figure 5 depicts an embodiment of the present invention as
system 100 comprising a monochromator 102, a chopper 104, a
photomultiplier tube (PMT) 106, a light source 108, an optical filter 110, a
projection lens 112, an object lens 114, a computer sub~y~lem 116, and a
signal processor 118.
Light source 108 emits in a wavelength band suitable for
exciting fluorescent probes in functional coatings and functional
compositions such as a light adhesion coating 122, a backing substrate 120,
and an adhesive 124. Alternatively, one or more layers 120, 122, or 124
may contain a compound that fluoresces in the same wavelength band
WO 95/22018 rCI~/US95/01777
12 2 l 82 865
and therefore competes with a fluorescer added as a measuring probe to
another layer.
Optical filter 110 removes unwanted frequencies from the
excitation light emitted from light source 108. Projection lens 112 focuses
the excitation light to a spot on the material to be measured. The
fluorescent emissions from the material are focused by object lens 114 into
monochromator 102.
With the use of diffraction gratings and prisms,
monochromator 102 separates the fluorescent emissions from the material
being tested into discrete wavelengths which leave monochromator 102
through an exit slit and are directed to chopper 104. Chopper 104 in system
100 is a revolving wheel with a port aligned to scan past the exit slit of
monochromator 102. As chopper 104 spins, the port will move past the
exit slit of monochromator 102 allowing selected wavelengths to reach
PMT 106. PMT 106 measures the intensity of light for each wavelength
and a signal is sent to signal processor 118 which is linked directly with
computer subsystem 116. Computer subsystem 116 performs all
calculations and provides results for analysis.
Figure 6 depicts monochromator 102, as seen from the
direction and perspective of chopper 106, having an exit slit 130. For
~y~teln 100, a useful exit slit 130 has a resolution of 8 nm per mm of slit
width. If a 4 mm wide exit slit 130is used, then a 32 nm wavelength band
width is dispersed at exit slit 130 at representative center wavelength ~c of
monochromator 102. Representative border wavelengths ~1 and ~2 are 16
nm above and below ~c respectively.
There are several embodiments of the invention useful in
distinguishing one or several fluorescent probes. Various embodiments
are also useful for distinguishing fluorescent probes from an interfering
background.
WO 95/220-18 PCI'/US95/01777
13 ~ 1 82865
Referring to Figure 7, an embodiment of the present
invention uses a narrow port 140 in chopper 104 moving across exit slit
130 of monochromator 102. The representative wavelength ~c of exit slit
130 is chosen to correspond to the middle wavelength in the abrupt change
region of the fluorescent probe to be detected. In this way the rapid
transition spectrum region of the fluorescent probe is sampled. Using the
9-ICF emissions wavelength range as an example, monochromator 102
representative wavelength ~c would be centered at 305 nm and scan 16 nm
above and below representative wavelength ~c-
As narrow port 140 sweeps across exit slit 130 as shown in
Figure 7, the light intensity at each wavelength can be measured by PMT
106. This is graphically represented in Figures 8a and 8b. Figure 8a graphs
the emission spectrum of a hypothetical fluorescer. Figure 8b is a graphic
representation of the emissions output generated by revolving narrow
port chopper 140. In Figure 8b, ~l and ~2 represent the upper and lower
wavelength values chosen such that the narrow region of abrupt
wavelength change is contained within the ~1 and ~2 boundaries. In the
case of fluorescer 9-ICF and using a 32 nm band width at the exit port, ~l is
289 nm and ~2 is 321 nm. Figure 8c is the graphic representation of the
first order derivative, or differential, taken of the values in Figure 8b. The
peak slope would be proportional to the amount of fluorescer within the
functional composition.
Another technique is to use a wide port 150 as depicted in
Figure 9a that is slightly wider than exit slit 130 of monochromator 102. In
this fashion the light intensity output is proportional to the integral
fluorescent intensity value for that part of the spectrum output at exit slit
130. As shown in Figure 9a, as wide port 150 approaches full exposure of
all of exit slit 130, the light intensity measured by PMT 106 is proportional
WO g5t22018 PCI/US95/01777
2 1 82865
14
to the integral value of the fluorescent intensity measured from
representative border wavelength ~1 to the representative wavelength ~sl
at the leading edge of wide port 150. As wide port 150 begins decreasing the
exposure of exit slit 130, as seen in Figure 9b, the light intensity measured
by PMT 106 is proportional to the integral value of the fluorescent
intensity measured from representative wavelength ~52 at the trailing edge
of wide port 150 to representative border wavelength ~2.
Figure 10a graphs the fluorescent spectrum output intensity
of a hypothetical fluorescer. However, wide port 150 produces the
representative graph of the scan seen in Figure 10b. Differentiating the
signal graphed in Figure 10b returns the original signal and its
complement and produces the graph of Figure 10c. Compare Figure 10c to
Figure 8b. Differentiating the signal again will produce the plot
represented by the graph of Figure 10d. The peak slope value of Figure 10d
will be proportional to the concentration of the fluorescer within the
functional composition. Compare Figure 10d with Figure 8c.
This wide port chopper technique is superior in performance
to the narrow port chopper technique because of the significantly greater
light intensities seen by PMT 106. This improves the signal-to-noise ratio.
Since the overall effect contributed by the fluorescent probe to the total
.qmi~sions of all components within the product may only change the total
emissions by as little as 1%, the improved signal-to-noise characteristic of a
wide port chopper technique improves the ~yslelll's ability to accurately
detect changes due solely to the emissions of the fluorescent probe. The
wide port chopper technique requires the additional differential step,
increasing the need for computing capacity.
Another technique uses a two point linear approximation.
Figure 11 depicts an emissions intensity curve. Two points 160 and 162 on
the curve are chosen so that the slope of the line between the two points
.WO 951220~8 rCT/US95/01777
2 1 82&65
will closely approximate the peak slope value. In Figure 11, the emissions
intensity points 160 and 162 are determined and intensity is then
calculated by the relationship:
intensity z slope - (I at point 162 minus I at point 160)/
(the wavelength of point 162 minus the wavelength of
point 160).
As depicted in Figure 12, this technique is incorporated into
apparatus 200, which includes a light source 202 with appropriate filter 204
and lens 206 to fluoresce product 208, two monochromators 210 and 212
adjusted to chosen wavelengths 160 and 162 respectively, photomultiplier
tubes 214 and 216 to measure the intensities, and a rotating polygon mirror
218 with appropriate optics 220 to image the same point from product 208
surface into each monochromator 210 and 212. Outputs of
photomultiplier tubes 214 and 216 are coupled to a computer, not shown,
and are used to calculate the slope. An advantage shared by the narrow
and wide port choppers over the two point linear approximation is the
elimination of the second monochromator and the rotating mirror and
optics to focus both monochromators on the same spot.
A fourth technique uses an optically sensitive linear array 230
as depicted in Figure 13 that replaces the chopper wheel and
photomultiplier tube. This system also works by allowing the light
dispersion 231 from an exit slit 232 of a monochromator 234 to fall directly
onto linear array 230. The outputs of the discrete elements of the array are
fed to a computer sub~y~Lelll 236 and generate a graph similar to the output
for the narrow port chopper technique as depicted in Figures 8a, 8b, and 8c.
The linear array technique would require only one differential
computation step and eliminates most of the optical components. It is
mechanically simpler as well. Drawbacks are differences in individual
array elements and stability of the array as a whole.