Note: Descriptions are shown in the official language in which they were submitted.
~:V0 95/30266 2 1 8 8 6 7 8
--1--
METHOD FOR PE:RFORMING A
VOLTAGE STABILITY SE~:UKIl Y A.~.~l;A~.~.l~T
FOR A POWE~ TRANSMISSION SYSTli~M
Technical Field
This invention relates generally to plAnnin~
O'A' electrical power trAncm; qqi An systems, and more
p~Articularly, to a Dethod for per~orming a voltage
~tabi1itY A--- t for power trAncm; Csi~n systems.
R~ ,ulld ~rt
There are a number of potential voltage
in~tability problems which can arise within an electri-
cal power system. Some of these instability problems
occur in distribution systems used for distributing
Qlectrical power to utility ,u:~L 6. Nany of the
sources of these distribution system voltage stability
problems have existed for years, and their causes and
3A~l.,t;,Anq ~Are well known in the art.
Other problems occur in tr~nAmiq~itAn systems,
which are used for LLrAn~uLLing bulk power from genera-
tion ~tations to load centers. These stability problem~
result rrO~ such causes as facility outages, clearing of
short circuit faults, and increases in load power or
inter-area power transfer in a trAn-m;~qinn network.
25any of these trAn~mi qqit~n system voltage instability
problems have been Pn~ uu"~- d only in recent years.
These instability problems have O~;~ ULL-a A as a result of
recent trends toward: locating generation stations
dist~ntly from load centers which limits the effec-
tiveness of their voltage controls, requiring utilities
W0 95/30266 ~ ~ 8 8 ,~ 7 8, ,, r_".J~ s ~72s
--2--
to allow power 8h; 1 across their trAn~"ics;on system
by ;nA~l-Q~ ent power ~L.JdU~,~L~ or other utilities, and
dQterring c.,.._LLu-i~ion of needed transmission neL .Lks,
to namQ a few.
A slow-spreading, u~ Lullable decline in
voltage, known a5 voltage collapse, is a specific type
of trAn~; C~ n 5y5tem voltage instability. Voltage
col 1 ~r~o results when generators reach their f ield
current limits which causes a .1; 5Ahl; n~ of their exci-
tation voltage control systems. Yoltage coll ~rse has
recently caused major blackout5 in a number of different
countries around the world.
In order to reduce the pogcih; l; ty of voltage
col l~p-e in a power system, and more generally, improve
the Dtability of the power system, system planning is
per~ormed by many utility ~~;~. First, a mathemat-
ical model repre5entative of the ba5ic el~ o~ the
power system, and their inteL-.v--~ ion, is ~o--L.u~.~ad.
ThQse basic el~ - include generating stations,
transformers, transmission line5, and sources of reac-
tive ~;ese.~ such as Dyll~l~L~-uu voltage c~n~l~nC~rs and
capacitor }~anks. Next, various computational te~hn;-~_es
~or an~lyzing system 5tability are performed using a
~uitably ~L~L - ~ computer. Based on this analysis,
~ os~d ~nh~r ~5 are formulated in an ad-hoc manner
~or improving voltage stability security. The m~ll` t-
ical model can be updated based upon these ~Lu~ose~
so that the resulting system stability
security can be analyzed. Fnh~ s which attain
pr~A~t~rm;n~A design objectives are then physically
impl~ ed in the actual ~ower system. The process Or
wo ssr30266 218 8 6 7 8 r~ 725
--3--
system plAnn;n~ is continual in that it must be regular-
ly perfor~ed in light of changing circumstances.
In mathematical terms, voltage collapse occurs
5 when equilibrium equations associated with the mathemat-
ical model of the tr~n-micsi~n system do not have unique
local solutions. Thi5 result5 either when a local
solution does not exist or when multiple solutions
exist. ~he point at which the equilibrium equations no
10 longer have a solution or a unique solution is often
as_ociated with some physical or control cAr~hil ity
limit o~ the power system.
Current methods for AecPe5;nq proximity to
classic voltage instability are based on some measure of
15 how close a load ~low Jacobian is to a s;n~lArity
cpndition, since a sin~ll~r load flow Jacobi~n implies
that there is not a unique sol lt; ~n . These proximity
measures include: (i) the smallest eigenvalue
~y~ ~ol.ing zero, (ii) the minimum c;nr~lAr value, (iii)
20 various sensitivity matrices, (iv) the reactive power
flow-voltage level (Q-V) curve margin, (v) the real
power ~low-voltage level (P-V) curve margin, and (vi)
eigenvalue approximation ~ 3 of load flow Jacobian
~; nq-- 1 A rity .
The eigenvalue and minimum s;n~Ul~r value
methods are disadvantageous in their lacking an indi-
cation of the actual locations and causes of voltage
instability. IIJLt:~V~ these methods have been known to
produce micleA~;n~ results with respect to causes of
voltage instability as well as the locations and types
of Dnh~-- -~ necessAry to improve voltage stability
security. Fur~h~ ~, the computational requirements
Wo 9~/30266 2 1 g 8 ~ 7 8 ~ t ~
(
--4--
for the eigenvalue and minimum singular value methods
~re relatively high. The sensitivity matrix methods
have many of the same difficulties as the eigenvalue and
~ln~-lAr value methods resulting from being linear
S ir._-- Al measures for a highly-nri~ni ;n~Ar ,l;ccr~rlt;
uous procefis.
Regardless of the method e~ployed f or as-
sessing proximity to classic voltage instability,
exi5ting methods employed by many utility r n; ~'S
10 assume that there is only one voltage instability
problem. Purther, it is assumed that one distributed
rQactive power loading pattern test detects the one
voltage instability problem.
It is known that a voltagQ control area may be
15 defined as an electrically isolated bus group in a power
~ystem. RQactive L eS~=L veS in each voltage control area
may be distributed via ~e~ y voltage control so that
no ~ ~tur or station would exhaust I ~ L ~I ~S bef ore
~ll the other generators in the voltage control area.
20 Although this s~on~3Ary voltage control is effective in
preventlng classic voltage instability, previously
defined voltage control areas are no longer valid
the originally existing transmission grid is
~r,hJ~r..~ o that bus groups are no longer as isolated.
25 A ~urther disadvantage of this approach is that the
rR_ctive L~ 5 for controlling each voltage control
area are limited to be within the voltage control area.
Methods are also known which employ a voltage
zone def ined as a group of one or more tightly-coupled
30 g~nerator P-V buses together with the union of the sets
of load buses they mutually support. In such methods,
Wo 95/30266 2 1 8 8 6 7 8 r~l, r o47~
the amount of reactive power supply to maintain an
~cceptable voltage level is controlled. A disadvantage
of this approach, however, i5 that characterizing a
- voltage stability margin in terms of voltage does not
S protect ~against classic voltage col 1 ~r-e .
Current engineering methods of locating
potential voltage instability problems ;nrl~A~ simula-
ting all single line outage cont;nq~n~ i~C, and identi-
rying those that do not solve as causing voltage insta-
10 bility. However, the lack of a solution is not aguarantee of voltage instability; a lack o~ a solution
can occur because: the load rlow ~le ~ u~ aphson-based
algorithms are not guaranteed to ~ul~tLye from any
particular starting solution, but cu,.vel~e only when the
15 starting point is su~riciently close to the solt~t ~ ~n;
the load rlOw Cù~lvéL~3el~Ce is not guaranteed even when
the 5ystem is close to a solution if the solution is
clofie to a bifurcation; ru-."d o~r error arfects the load
rlOw ~.ull~L~e~ ; and discontinuous changes due to
20 switching Or shunt ~1- , or outages of ~-.leL~tUL:i or
lines can have a dramatic ef f ect on whether the load
flow algorithm will COI~Ve:LYè to a solut;^n. The con-
verged 501~1~ ionC ror all single outages only indicates
that there are no bifurcations. In order to attempt to
25 prov~ that the absence of a C~ V~:LYed 8O1~t~ i5 caused
by voltage instability, substantial ~ L and comput-
er proc~C;r~q time are required. In one such method,
the absence of a c~ L~ed solution i8 d~t~rm;n~ to be
due to voltage collapse if one can add a f ictitious
30 ,_~ ~UL with infinite reactive supply at some bus to
obtain a cu,.veL4ed load flow sol~ n. This method is
not foolproof, and furfh~ ~:, does not indicate the
Wo 9~30266 2 1 8 8 6 7 8 P~1l.J~. '472s
--6--
cause of voltage instability nor indicate where it
occurs .
However, current methods are ;n~ArAhle of
identifying all of the many diiferent voltage stability
5 problemfi th~t can occur in a tr~n~ inn system. A
very routine operating change or D~ C~ y insigniSi-
cant rnnt;nq~ncy in a remote region of the system,
~ollowed by another contingency, can cause voltage
instability. Furth~ ~, voltage instability may occur
10 in many different sub-regions of the system. Current
methods lack diagnostic ~LoceduL~s for identifying
causes of specif ic voltage stability problems, as well
as D,~D~ tlc and int~lllgent ~nhAn~ L ~Loce-lu~s for
preventing voltage instability problems.
~ of the ~n~ Liull
For the foregoing reasons, the need exists for
a method o~ identifying potential locations of voltage
instability problems, and det~n~n;nq corrective mea-
sures to reduce the l ikPl ihnod of voltage instability.
It is thus an object of the present invention
to provide an i uv.:d method for ~ t~mlninq potential
voltage instability problems in an electrical power
tr~n-~C~ion system.
~nother object of the present invention i5 to
provid~ a method of identifying single conti n~n~
that cause voltage instability in an electrical power
L. i r~ lon system .
o 9~l30266 !- 2 1 8 8 6 7 8 P~ 72s
, .
--7--
A further object is to provide a method of
identi~ying multiple cont;n~Pn~ s, transfer patterns
and levels, and loading patterns and levels that cause
voltage instability in an electrical power transmission
5 system.
In carrying out the above objects, the present
invention provides a method of perf orming a ~nnt; nqPnry
analysiD for a region of an electric power transmission
system having a plurality of buses and a plurality of
10 sources of reactive reserves coupled thereto. The
plurality of buses are grouped into a plurality of
voltage control areas such that each of the buses within
each voltage control area has a similar CULL. ~r -inq
rcactive power versus voltage ~elat;c~nch~. A corre-
15 ~rnntl~n~ reactive reserve basin for each o~ at least oneof the voltage control areas is detP~;n~d. Each
reactive reserve basin comprises at least one of the
sources of reactive reserves sP~Pct~d in ~ e upon
a measure of the reactive ~e SeL v~s depleted at a prede-
20 tP~m;nPd operating point o~ the power system. A singlecontingency analysis is performed by _ ,_ ;nq a corre-
~rnn~nq quantity rOr each reactive reserve basin in
r~ ul-De to each of a plurality of single ~ont;nqpn~-ipq.
The UULL~-lJ'"'~7;nq quantity is lc~L~se~.L~tive of a
25 r~ t j nn in the reactive ~-:S-:L ~._6 within the reactive
reserve basin. A multiple contingency analysis is per-
~ormed for each reactive reserve basin based upon the
~ingle con~;n7Pnl~ipc whose c~LL- ,L~ in~ quantity
exceeds a predetPrmi ~Pd threshold.
~he present invention further provides a
method Or performing a voltage stability A~ ' for
a region of an electric power trAn--;qqion system having
~09sl30266 218~78 r~ s l72s ~
--8--
a plurality of buses and a plurality of sources of reac-
tive Le3_L~,~s coupled thereto. The plurality of buses
are grouped into a plurality of voltage control areas
such that each of the buses within each voltage control
5 area has a similar correcpnn~; nq reactive power versus
voltrAge relat i nn_h; r . At least one of the voltage
control areas whose buses therewith in have a voltage at
th~ minimum of the CULL ~ ;nj reactive power versus
voltage relat;~AnAh;p which exceeds a voltage threshold
10 i8 selected. A CuLL~ i nj reactive reserve ~asin is
':tDrm;n~d for each of the at least one of the voltage
control areas, wherein the reactive reserve basin
comprises. at least one of the sources of reactive
L~ ~eS selected in darDr' e upon a measure of the
15 r~active LQse~s depleted at a predetDrm;n-~3 operating
point of the electric power tran-~; C~inA system. A
single c^nt;nqDnAy analysis is performed by computing a
nq yuantity for each reactive reserve basin
in ,~ se to each of a plurality of single fault
20 cont. ;nqanAi~ae~ wherein the CVLL r~ ;nq quantity is
r.~L~ Lative of a re~ rt j r~n in the reactive reserves
within the reactive reserve basin, and wherein the
pluraAlity of single Cont;nqenAiD~ inAl~ DA~ at least one
ingle generator outage and at least one single line
2S outaAgQ. The single cont;nq~-~Aia- whose C~LL ~ .,.1;nq
quantity exceeds a predet-~m;nD~ thre ` ~]~ are select-~.
Thc voltage stability for single ~nd multiple coAt;nAJDn-
cie~ with a plurality of transfer and loading patterns
ar~ ~c~ d, wherein the single and multiple contingen-
30 cie~ are based upon the selected single cont;nq~n~ c.
These and other objects, features and advan-
tages will be readily ~ ale"~ upon cnn~ Aration of the
W0 95130266 2 1 8 8 ~ 7 8 ~ 5'~ 1725
_g_
following description, a~ ded claims, and n~ ,-nying
drawings .
Brief Des~ ,lion Of The Drawi~c
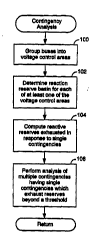
FIGURE 1 is a f low chart of perf orming a
5 ~nn~;n.~nry analysis according to the method o~ the
present invention;
FIGURE 2 is a f low chart of grouping buses
into voltage control areas according to the method of
the present invention;
FIGURE 3 is a flow chart of detonnin;nq a
reactive reserve basin according to the method of the
present invention;
FIGURE 4 is a f low chart of performing a
single contingency analysis according to the method of
15 the present invention;
FIGURE 5 is a f low chart of perf or~ing a
multiple contingency analysis according to the method of
the present invention;
FIGURE 6 is a flow chart of ~l~t~m;n;
20 voltage control areas according to the method of the
present invention;
- FIGURE 7 is a flow chart of performiny a
contingency ~^leot;nn according to the method o~ the
present invention;
Wo 95/30266 ~ r~ s ~ l725
2~88'67~
--10--
FIGI~RE 8 is a f low chart perf orming a reactive
reserve basin security ~-s~~ according to the
method of the present invention;
FIG~RE 9 is a f low chart ' LL c.ting ro-
5 bustness of the reactive reserve basins according to themethod of the present invention; ~nd
FIGURE 10 is a f low chart per~orming a sta-
bility security A-g L according to the method of
the present invention.
lo Best Modes For Ca~ryin~ Out The l.. ~ n
The method of the present invention u ~ L ~ -
the disadvantages of previous security
methods and systems by intn~ nntly selecting single
cont~n~nn~ used in performing a multiple contingency
15 analysis. Nore specifically, the single contin~nnci~s
used in performing the multiple c~nt;n~r~nry analysis are
selected based upon the rn~ t i l~n in reactive reserves
in ~ region of the electrical power trAn~ irn system
known as a reactive reserve basin. rlû- :uve:I, the method
20 of the present invention p~udu~ i a hierarchical control
3~LL~U~UL~: wherein a lack of controlli~h;lity provides
~vidence of a potential voltage instability problem.
In general, the method of the present inven-
tion i8 capable of identifying totally inrl~L.~ ,L
25 voltage st~bility problems that affect ~airly isolated
Le-' irn~ of one or more utilities. A unique voltage
stAbility problem occurs when a Q-V curve computed at
any bus in a suf~iciently coherent group has the same
shape, minimum, and reactive reserve basin. The neigh-
~ W<~ 9S~30266 218 ~ ~ ~7 8 r~, !'1 ~72S
--11--
boring voltage control areas with reactive supplydevices that exhaust nearly all reactive reserves upon
I~-'' in-J the minimum of the Q-V curve computed in some
critical voltage control area is a reactive reserve
5 basin for that critical voltage control area. A global
voltage stability problem occurs when the reactive
I L~ in a large number of voltage control areas are
QYhausted. Global reactive reserve basins for different
voltage stability problems do not contain any of the
10 same voltage control areas. Each global voltage stabil-
ity problem is prevented by a unique and nu.. uv~llapping
set of reactive supply devices belonging to its reactive
reserve basin.
For each global stability problem, a large set
15 of local stability problems lie nested therewithin. In
turn, eac~ local stability problem has a different
reactive reserve ~asin associated therewith. However,
these local reactive reserve basins overlap. As a
result, the po~ih~lity exists that a generator, switch-
20 able shunt capacitor or SVC belongs to several localreactive reserve basins.
When the reactive reserves in a voltage con-
trol area are exhausted, all reactive reserve basins to
which that voltage control area belongs eYperience a
25 significant step change toward voltage instability. The
local reactive reserve basin that exhausts all reactive
r~ in all voltage control areas due to contingen-
cies or operating changes is the local reactive reserve
basin that e2cperiences voltage instability, as long as
30 the cnnt ;n~an~ or operating changes directly impact
the critical voltage control area where the Q-V curve is
~ to determine that reactive reserve basin. The
~o 95130266 ~ 18 8 6 7 8 r~ 1725 ~
--12--
exhaustion of all reactive reserves for all voltage
control areas in a local reactive reserve basin produces
voltage instability for that critical voltage control
area because that critical voltage control area cannot
s obtain all the reactive supply needed to cope with the
c~nt~nqPn~-iP~ or operating changes. As used herein, a
c~nt~n7Pn~y may be any unexpected discrete change in the
tr~n~ ion system due to equipment 10s8 (such as a
tULr tr~n~ sinn line, or transformer) or a short
lO circuit ltypically referred to as a fault contingency).
A locally most vulnerable critical voltage
control area and reactive reserve basin is one that
belongs to almost every local reactive reserve basin
al~o belnnq1nq to a global reactive reserve basin. This
lS locally most vulnerable reactive reserve basin ha6
relatively small res~Lv~s that exhaust rapidly for Q-V
curve stress tests computed for almost every local
critical voltage control area which has local reactive
reserve basins that are subsets of a global reactive
20 reserve basin. Such locally most vulnerable reactive
reserve basins should be the ~ocus of any system en-
~ _ 1,5
It should be noted that local voltage sta-
bility problems are those brought on by continqQnriPs or
25 operating changes and not the global voltage stability
problems which would most often only develop out of a
spreading local voltage stability problem. Generally,
all such local voltage stability problems need be
ad~ Qd, not just the locally most vulnerable. This
30 is 80 because each local stability problem, inrl11~in~
the locally most vulnerable, may be brought on by
dirrerent continqPr~riP~ or operating changes that caus~
. .! ' ~,
~ WO 95130266 218 g 6 7 8 r~ 725
--13--
reduction of, or partially cut off, the reactive re-
serves associated with the critical voltaqe control
area .
Nore specifically, the method of the present
5 invention employs Q-V curve tests for de~Qrm;nin~ a
hierarchical control structure which indicates that
voltage instability occurs when a lack of controlla-
bility is evident . Perf orming a multiple contingency
analysis i5 illustrated by the f low chart shown in
10 Figure 1. The multiple contingency analysis is to be
performed for a region of a power system having a
plurality o~ buses and a plurality of sources o~ reac-
tive reserves coupled thereto.
In block 100, the plurality of buses are
15 grouped into voltage control areas in ~loron~lpnre upon a
CULL-- L------1;n~ reactive power versus voltage rela~inn~ h;~
i~or each of the buses. More specifically, each voltage
control area is def ined as a coherent bus group where
adding a reactive load at any bus in the group ~L UdUCeS
20 nearly identical Q-V curves in both shape and magnitude.
AB A result, each voltage control area has a unique
voltage ~ n~t~hi l; ty caused by a local ir.-_,, Lal
r~active supply problem.
In block 102, ~otonm;n;nlJ a cGLL~~L ~ in ~
25 reactive reserve basin f or each o~ at least one of the
voltage control areas is performed. Each reactive
reserve basin comprises at least one source of reactive
L~ qlocted in r3oron~onre upon a quantity repre-
sentative of the reactive ~es~- v- s exhausted at a
30 predeto~m; nod operating point of the power system. The
at least one source of reactive res~L v~:s c~nt:~; nod
W0 95/3~266 2 1 8 8 ~ .7 8 ~ 5C l725
--14--
within the reactive reserve basin form a set of stabi-
lizing controls for the cvLL~-~v~ ;n~ voltage control
arQn. Prererably, the predetPrm;no~l operating point of
the power system is the minimum of the Q-V curve. It i8
5 also preferred that the total reseL veS in a voltage
control area be dêpleted by a certain percentage and/or
below a certain level before the reactive 60urces in the
voltage control area added to a reactive reserve basin.
A single contingency analysis is performed by
10 block 104. Nore specifically, a quantity r~res~..Ldtive
of the reactive ~CS_~VèS depleted in response to each of
a plurality of single cont;n~onr1~c is _ L-'. These
~ingle cnnt; nqon~-ioC include single line outages and
~ingle generator outages. Using the information comput_
15 ed in the single contingency analysis, a multiple
cnn~;n~ ry analysis is performed in block 106. The
multiple contingencies solecto~ for analysis comprise at
least two of the single cont;n~Pnc ios whose CVL~ ~VI~d
ing reactive reserve deplet;~n guantity exceeds a
20 procle~orm;nod threshold. The multiple contingency
analysis is performed for at least one reactive reserve
basin.
In Figure 2, a flow chart illustrates grouping
the buces into voltage control areas in accordance with
25 the present invention. Voltage control areas are
def ined as coherent bus groups where the Q-V curve
' at any bus in that coh~ L group has virtually
identical voltage and reactive margin at the Q-V curve
m1n~ . Furthermore, the shape and slope of the Q-V
30 curve . _ e~ at any bus in the voltage control area
should be nearly identical . Based on the above def ini-
tion, the voltage control areas ~re deto-m;necl using a
wo ssl30266 2 1 8 8 6 7 8 PC ., ~ ' 'D47~
--15--
coherent group clustering algorithm. An initial value
of a control parameter, alpha, for the clustering
algorithm is selected in block 120. The coherent group
cluctering algorithm employed is based on eliminating
5 the weAkest cnnnDcti9nc from each network bus until the
~um of reactive ~ L v~,ltage Jacobian Dl~ Ls ~or
eliminated branches is less than a parameter alpha ti_es
the largest d i AqnnA l element of the reactive power-
voltage Jacobian matrix. The isolated bus groups
10 identified for a particular alpha are the coherent bus
groups for that alpha value. This step of isolating bus
groups in dDrDn~lDn-e upon the alpha paL D-r is illus-
trated by block 122.
For smaller values of alpha selected in block
15 120, the bus groups are contin~ cly split until each
- bus group comprises a single bus. On the C~.IIILL-LY, ir
alpha is sDI~DrtPd to be relatively large in block 120,
all buses belong to one bus group. In block 124, a
level of co~.e.ell- y within bus groups as well as a
20 concomitant incoherency between bus groups is DYAminDd
based upon the Q-V curves. In particular, the Q-V
curves are ~YAm j nD~ to determine whether all buses in
uach bus cluster have substantially the same Q-V curve
minimum. If the Q-V curve minima are not substAntiA~ly
25 the ~ame, then flow of the routine is directed back up
to block 120 where a new value of alpha is select~Dd. If
the Q-V curve minima are substantially the same, then
the routine is exited by return block 126.
DetDrminin~ the reactive reserve basin rOr
30 each of at least one of the voltage control areas is
illustrated by the rlow chart in Figure 3. In block
140, a selt of test voltage control areas is selected.
W09~/30266 218~ 8 ~ l72S ~
--16--
The solec~oA test voltage control areas are those that
have large shunt capacitive supply, or an increase in
reactive loss or reactive supply as Q-V curves are
computed in ~P; qhhoring test voltage control areas .
5 Line charging, shunt capacitive withdrawal, series I2X
series reactive loss, increased reactive inductive or
capacitive shunts due to under load tap changers, or
~witchable shunt capacitors or reactors cause the
increase in reactive loss or supply in a voltage control
lO area. A Q-V curve is _ ~ed in each test voltage
control area that has satis~ied these conditions as Q-V
curves were computed in other voltage control areas.
Reactive reserve basins are only Ao1 o~inod for those
te~t voltage control areas, called critical voltage
15 control areas, with Q-V curves having a large voltage
and a small reactive marqin at the minimum of the Q-V
curve. In practice, the minimum of the Q-V curve can be
obtained using a standard Newton-Raphson algorithm.
For each critical voltage control area, the
20 voltage control areas which experience a reduction in
~seL~ greater than a prodetorminod threshold at the
Q-V curve minimum is selected in block 142. In prac-
tice, the pred~oto~minoA threshold is ~ -- d on a
relative scale and is sole~ted to be less than 100%. In
25 one o~hoAi- , the reactive reserve basin
voltage control areas which experience greater than 75%
reAllrt~on in ~ eSel veS in computing the Q-V curve down to
the Q-V curve minimum. This logic is aimed at guaran-
teuing that every reactive reserve basin is robust in
30 the sense that no contingency or operating change that
causes voltage instability on the test voltage control
area can exhaust all o~ the reactive supply and voltage
control reserve in a voltage control area outside those
~ Wo 95130266 ~ 2 1 8~ 6 7 B I ~ 72~
--17--
voltage control areas contained in the reactive reserve
basin ~d.
In the ~low chart o~ Figure 3, the reactive
reserve basins are computed only for the selected subset
5 of voltage control areas that are predicted to be
vulnerable to voltage instability by having large
capacitive supply, experiencing large shunt capacitive
supply increases, or experiencing inductive increases as
Q-V curves are computed in other test voltage control
10 areas having Q-V curve voltage minima greater than a
threshold and reactive minima smaller than another
threshold. IIJI è~ve~ ~ the use of reactive reserve
~Iuantities provides an a~- 1 Ative proximity measure
that makes voltage stability ~ practical
15 because it is an exhaustible ~,u .;e that always
correlates well with proximity to voltage instability
and is easily computed for a contingency.
In such a manner, unique global voltage
stability problems can be identif ied that have large
20 numbers of voltage control areas and are nearly dis-
~oint. Most, if not all, voltage stability problems
that ever occur are local. ~IOL~:G~ a multiplicity o~
local voltage stability problems are associated with
e~ch global voltage stability problem. Indeed, local
25 voltage stability problems may be ~t~rm;n~d with a
local reactive reserve basin that is substantially a
subset of some global reactive reserve basin. Identify-
ing critical voltage control areas for each local
stability problem and their reactive reserve basins
30 identifies the location of each stability problem, what
reactive Lese~ ~s prevent each local stability problem
WO g5130266 r~ 1725
2~88678 ~
. .
--18--
from occurring, and why each local voltage instability
occurs .
still further, the locally most vulnerable
re~ctive reserve basin, may be ~7PtPnmi nPd that lies
S within virtually every other local reactive reserve
basin according to the Q-V curve with nearly the largest
voltage maxima and nearly the ~mallest reactive minima.
Thereafter, its reserves are rapidly exhausted for the
Q-V curve - _~ed in the critical voltage control areas
10 associated with the global and all nested local reactive
reserve basins. ~lowever, despite the fact that the Q-V
curve may have the largest voltage minima and the
largest reactive margin, it may not be the most probable
local voltage stability problem because there may not be
15 severe contin~pnripq that directly impact its critical
voltage control area because it lies in a remote and low
voltage part of the ~ystem. This leads to contingen~y
a^l~ct~l~n for each local reactive reserve basin where in
some utilities the same cont1n~nriPC affect the global
20 and all locals, and yet in other utilities different
cnnt;ngenriPc affect different locals within a global
rRactive reserve basin.
Performing a single contingency analysis is
ill~z,LL~ted by the flow chart in Figure 4. This single
25 ront1n7Qnry analysis is performed for each critical
voltage control area and its associated reactive reserve
ba~in. In block 160, a single ~nntin~pnry is simulated.
SpPr~f~r- types of single cnntin~enripc include single
generator outages and single line outages. ~rhe reactive
30 reserves in each reactive reserve basin are computed for
the single contingency in block 162. Conditional block
164 ~YA~inPC whether there are more single contin~Pnri~c
~ Wo 95/30266 ~ ~ 1 8 8 6 ~ 8 P~ "72~
--19--
to be simulated. If so, flow of the routine is directed
back up to block 160 where another single contingency is
simulated. I~ no further contingencies are to be
simulated, then the con~;n~nri~ in each reactive
S reserve basin are ranked from smallest to largest ba6ed
upon the reactive reserves exhausted by block 166. In
block 168, the single line outages which exhaust more
than a pr~ et~-m;n~d pc--,c~ ge of the L~-LVCS in each
voltage control area ~re listed.
In block 170, the two largest reactive ca-
pacity generators in each reactive reserve basin which
exhaust more than a ~r-'~ - ";n^~ pe~v~..L~tc of its
reserve for some c~n~inq~n~y are 5~ rt~rl. These
generators are placed on a y_.~creLtuL~, list. The two
lists formed in blocks 168 and 170 are used in forming
multiple con~in~nl-ies in a suLs~u_..~ multiple contin-
gency analysis.
Per~orming multiple c-lnt;n~Qnry analysis is
illustrated by the flow chart in Figure 5. Using the
list Or single confin~n~ formed in block 168, a list
of double line outages is ~ormed in block 180. Similar-
ly, using the list of generators ~ormed in block 170, a
list of double y~ e~ ~tUL outages is formed in block 182.
In block 184, a combination of line and g_~,_r c~toL
outages from the list5 formed in blocks 168 and 170 are
used to form a combination list. The step of performing
an analysis of contingencies based upon the lists
~-vducc~ in blocks 180, 182, and 184, is illustrated by
block 1860
Software for det~rmining the voltage control
areas is llustrated by the f low chart in Figure 6 . In
Wo 95/30266 218 8 6 7 8 F~ l725
. - ;r ~
--20--
block 200, an initialization step is performed wherein
a ~eed bus, a number of br~}ches, and a minimum voltage
lQvel are 6P~ectP~ in ';order to define a region of
inter~5t. Next, th;e Q-V curves are run and reactive
5 reserve basins are dPtarminP~l at all buses in the region
o~ interest in block 202. In block 204, a voting
~JLOC:~duL~ is employed to select alpha where the Q-V
curves computed at all buses in each bus cluster has
~ubstantially the same Q-V curve minimum and reactive
10 reserve basin. The parameter alpha decides the size of
the ~ -,t bus clusters which form voltage control
areas. As alpha decreases, the size of the ~ul~elc ..l. bus
clusters increases through a~ yc-tion of coherent bus
clusters identi~ied for larger alpha values. Thi6
15 ~earch ~ lu,~ eliminates the need for a user to make
a J, '_ ~ on where the differences in voltage changes
at buses within coherent bus groups increases from very
~mall values, and the voltage change differences between
buses in different bus groups for a di-,Lu,Lance suddenly
20 increase to large values as alpha decreases.
In the search ~Loc~-lu,~ for alpha, a bounded
interval of potential values of alpha is first sQ~Pcted.
me ~LOC~luL~ places a dist~rh~n~-e, namely a voltage
change at some ~eed bus, and calculates the changes in
25 voltage and angle at each bus due to the di~uLl,e,nce.
The ~Loc6.1uL-: finds bus clusters for ten e~ually-spaced
alpha values in this bounded interval, and then f inds
the smallest alpha value where the voltage and angle
ch7~nqes within the bus group satisfy the following
30 equations:
-
Wo 95130266 2 ~ 8 8 ~ ~ 8 P~ l725
--21--
~'V,~ V~ s 1~ AV
S ~Ca ~l
where ~V is a voltage change, ~ i5 an angle change, iand j are indices representing two buses within a bus
group, and kl and k2 are f ixed p~-L ~S .
The results are conf irmed as voltage control
5 areas by running Q-V curves at all buses in the voltage
control areas to establish if alpha was selected proper-
ly such that the minima of the Q-V curves and the
reactive reserve basin obtained from the minima of the
Q-V curves are identical. If the alpha value wa6 chosen
10 correctly so that the Q-V curve minima and reactive
reserve basins computed at every bus in the bus clusters
selected are id~n~i CA l, the user has obtained the
voltage control areas and proper alpha value for obtain-
ing these voltage control areas. If the alpha value was
15 not correctly selected because the Q-V curve minima and
reactive reserve basins are not identical for buses in
a voltage control area, several larger values of alpha
that produce smaller bus cluster groups can be C~Y Im; n~
until bus clusters which have nearly identical Q-V curve
20 minima and reactive reserve basins are found. Hence,
computing voltage control areas in this manner i5 based
on both the level o~ coherency within bus clusters and
the level of incoherency across bus clusters.
Alternative rmho~ can be formed which
25 explicitly use the definition of voltage control area in
order to find alpha. ~ore specifically, an alternative
- . -'; L would search for the value of alpha that is
as small as possible, i . e . which yL u luces the largest
bus cluster, and yet assures that the Q-V curves comput-
Wo 95130266 2 ~ 8 ~ 6 7 8 - P~ 0~72~ ~
--22--
ed at every bus in each bus cluster has nearly identical
Q-V curve minima and reactive reserve basins. The
search for alpha would only,~u~ .LLate on bus clusters
in some region of intere5t, which are buses nbove a
5 cOEtain voltage rating and at most three circuit branch-
es from ~ome seed bus.
Turning now to Pigure 7, a f low chart of a
crmt ;n~erlry selection program is illustrated. As seen
therein, a contingency selection and ranking for con-
10 tingencies and operating changes that bring a particulartest voltage control area and its reactive reserve basin
closest to voltage instability is performed. The
cr~ntimJonry gelection and rankings are peLL~ --' for
each critical voltage control area and associated
15 reactive reserve basin.
In block 210, a single line outage cnnt~nqonry
i8 simulated. The reserves in each reactive reserve
basin are computed for that contingency in block 212.
In conditional block 214, it is detormi nPd whether or
20 not there arQ àny other contin~onriPC to be simulated.
~r there are further con~in~Pnri~os to be simulated, then
flow of the method is L-:LuL-Ied back to block 210. If
th~re are no additional r~nt;n~onrio~ to be simulated,
then ~low o~ the routine advances to block 216.
In block 216, the continr~onriP~ are ranked in
~ach reactive reserve ba5in based upon reactive re-
serves. In block 218, the line outages that exhaust
more than P9~ of the reserves in each voltage control
area nre 5P1 ectP~ and placed in a list. Further, the
lnrgest two reactive capacity ~ cLatUL~, in each reac-
tive reserve basin that ~xhausts P% of its reserve f or
~vo 9sl30266 2 1 g 8 ~ 7 8 P~ 472~
--23--
some line outage are also selected. These generators
are placed in another list. The list of generators is
uLed to produce a set of 6evere single and double
L~tUL outage cont;n~n~ ies. The list of line
5 outages are used to produce a set of severe single and
double line outage cont;n~J~nri.~e. The list of genera-
tors and line outages is used to produce a set of
combination line outage and loss of generation contin-
gencies .
In block 220, the severe single and multiple
cont-;n~n~i~C are simulated and ranked based upon the
reactive reserve in a reactive reserve basin. The
~nnt-; ngrnry selection routine can be run several times
in 6~ to obtain all of the information on why
15 particular reactive reserve basins are vulnerable to
voltage instability. The initial run would entail
taking all single line outages in one or more areas, or
in one or more zone6 or areas where voltage instability
is to be studied, or in the entire system model.
In a preferred o~ho~ , the contingency
E~ql~c~;on routine would output a report summari~ing the
effects of the worst five cont;n~nri~C for each criti-
c~l reactive reserve basin. The output for each reac-
tive reserve basin has an initial summary Or the status
in the ~L~ ingency case, ;nrll~3;ng the bus names and
numbers for all buses in each of the reactive reserve
basin voltage control areas, the reactive supply capaci-
- ty and L~_3~LVC:S for yclleL-tuL~ y~ lrv.. ~,us u~ c_.
and switchable shunt capacitors at the bus where the
30 L is located.
Wo 9s/3026~ 218 8 6 7 8 - r~l" ~ ~725 ~1
- ~ --24--
After the initial status of a reactive reserve
basin i5 provided, the five worst contin~onril~ for that
reactive reserve basin are given. Each contingency i5
described and the reac,tive supply reserves at all
5 generators and switchable shunt capacitors in each
reactive re6erve basin voltage control area are given.
The order of voltage control areas in the report of
voltage control area reactive supply les~. v~:5 for a
particular reactive reserve basin is based on the
10 ~ e of re6erve exhaustion during _Lation of the
Q-Y curve. The order of voltage control areas aid in
indicating the order of exhaustion as voltage collapse
is approached for any contingency for that reactive
- reserve basin. The order of the Cr~ntin~JPnriPC presentQd
15 in the output report for a reactive reserve basin is
ba~ed on the p~ agQ of ~lL ~ ingency reactive
reserve~ exhausted witn the contingency causling the
largQst peL.e..~ye reduction reported first. The order
of the reactive reserve basins presented in the output
20 report is sorted so that the reactive reserve basins
that experience the largest percentage exhaustion of
reactive supply on generators and switchable shunt
capacitors for that reactive reserve basin's worst
conti -, ~ are reported f irst .
The contin~onry selection routine assists the
user in ~PtPrm~"~"7 the reactive reserve basins that
experience voltage instability because they would be the
f irst to be reported . If no reactive reserve basin
~erience voltage instability, the reporting of the
reactive reserve basins in the order of the largest
PeL~ aY-; reduction in total reserves gives only a
partial indic~tion of the reactive reserve basin with
the most severe contin~Pnripc. FtL~ ayt: reduction in
WO 95/30266 2 1 ~ 8 ~ 7 ~ P~./. 5'~ '7~S '
--25--
total reactive L~5~v~5 of a reactive reserve basin is
~n e~YI-Ql 1 qn~ indicator of the worst contingency in a
reactive reserve basin and the most vulnerable reactive
reserve basin when the system is experiencing or is
5 nearly experiencing voltage instability. The number of
voltage control areas in a reactive reserve basin that
exhausts reserves and the status of whether or not
r~active r~6_L~,_s are exhausted on voltage control areas
listed at the end of the list given for that reactive
10 reserve basin are effective indicators in judging
proYimity to voltage instability when the contingency
does not bring a reactive reserve basin close to voltage
instability. The reason for utilizing both indicators
~or voltage collapse proximity rather than peL~ .,Lage
15 reactive reserve re~ tinn is tha~ the system experien~l-
es a quantum step toward voltage instability after each
~;llrcP-five voltage control area experiences reserve
exhaustion, and experience indicates voltage control
areas that exhaust res L v~s near the Q-V curve minimum
20 for the llL~ ;n~nry case are near the Q-V curve
minimum for most contingencies.
An alternative ~"~ho~ 1 L of the contingency
r-~rtion routine would further include modifying the
~et of reactive reserve basin voltage control areas
25 reserve level for con~in~Pnrif~C that lie in the path
between a reactive reserve basin voltage control area
and the test voltage control area. Such contingencies
can have a reactive reserve basin that does not contain
the ~6 c~ Lingency reserve basin voltage control area
30 that is totally or partially rl~ ccnnn~cted from the test
voltage control area by the line outage cnnt; n7~ncy .
cont ~ n~Dn~ C that have a modif ied reactive reserve
basin and the voltage control area that should be
WO9~/30266 2188678 r~ 0~725 ~
--26--
deleted from the pre-contingency reactive reserve basin
both can be detected by looking f or cont i "g~nries where
a reactive reserve basin voltage control area experienc-
es little reduction in reserve co~mpared to other severe
5 cont~n~P~ C. The deletion ~of these voltage control
areas from reactive reserve bàsins for those contingen-
cies will make the contingency ranking based on reactive
re~erve basin reactive reserves more accurate without
reguLring the user to make judgments.
In Figure 8, perf orming a reactive reserve
basin security :.cc~- L is illustrated by a flow
chart. An initialization step is performed in block 230
wherein sPl ected data is retrieved . This data i n~ C
base case 6imulation data, values of alpha, values of a
15 lower voltage limit where attempts to compute a Q-V
curve minimum are aborted, and the criterion used for
selecting the reactive reserve basin voltage control
areas .
In block 232, each critical voltage control
20 area iB specified along with its test bus. The lists of
~ingle line outage, double line outage, single loss of
generation, double loss of generation, and combination
con~in~pnripc are read in block 234.
In block 2 3 6, the Q-V curves are computed f or
25 each r-~ntin~Pnry specified for the base case for each
voltage control area. In conditional block 238, a check
for a positive Q-V curve minimum is performed. If a Q-V
curve has a positive minimum, then PY~rllt j nn of the
routine is ~topped. If there are no positive Q-V curve
3 o minima, then execution of the routine proceeds to block
240 .
Wo95/3~266 T~~ 725
~8867~
--27--
In block 240, a transfer pattern and level are
read and a Q-V curve is computed for each contingency
and voltage control area. Conditional block 242 checks
whether or not there is a Q-V curve with a positive
minimum. If a Q-V curve with a positive minimum exists,
then eYecution o~ the routine is stopped. Otherwise,
the tr~ns~er level is increased until a positive Q-V
curve minimum is obtained in block 244. If, at block
246, there are additional transfer patterns which need
evaluation, then flow of the routine is directed back up
to block 240. If no additional transfer patterns need
evaluation, then a load pattern and level is read in
block 248, and a Q-V curve is computed for each contin-
gency and voltage control area. I~ there is a Q-V curve
with a positive minimum as detected by conditional block
250, then execution of the routine is stopped. Other-
wise, the load level is increased until a positive Q-V
curve minimum is obtained in block 252. If, at block
254, additional transfer patterns need evaluation, then
flow o~ the routine is directed back up to block 248.
Ir no additional transfer patterns need evaluation, then
--CUti r n of the routine is completed.
Ideally, the computed reactive reserve basins
are robust. Rubu:,L~ess implies that the voltage control
areas that experience near exhaustion of reserves for
all reactive supply and voltage control devices at the
Q-V curve collapse point in the ~ u..Lingency case can
experience exhaustion of reserves at the Q-V curve
ro~ rse point after: any single contingency, transfer,
30 or loading pattern change; or after any combination line
outage and loss o~ reactive esuuru~ r~nt;ng nry; or
after any combination line outage/ loss o~ reactive
lerJuL-,e contingency and any trans~er or loading change
W095/30266 21886~8 ~ F,725 ~
--28--
in any pattern. Demonstrating that the reactive reserve
basins are robust based on the above def inition is
illustrated by the f low chart in Figure 9 .
In block 260, a~`set of line outage contin-
5 gencies, loss of L~SOllL-_ contingencies, transfers, real
power loading pattern changes, operating changes, and
combination line outage/loss of resource cont ;nqPnrip~
that are known to exhau5t reactive reserves in one or
more specified reactive reserve basins as well as test
o buses in critical voltage control areas for computing
the Q-V curves that produce each of these reactive
reserve basins are provided as input to the routine.
These inputs can be provided from the output of the
contingency selection routine.
In block 262, the voltage control areas
n~;ng to a specified reactive reserve basin are
' ; n~-d by computing the Q-V curve and its minimum
ror each single or double contingency or operating
change specified. The reactive reserve basins of the Q-
20 V curve computed at a test bus in a critical voltage
control area for each single or double contingency or
operating change are outputted into a table for that
critical voltage control area by block 264. This table
i8 u~ed to confirm that con~;nqPn~iPR or operating
25 chAnges do not exhaust reseLvt:s on volt~ge control areas
where all rêactive supply and voltage control reseL vt:S
are not nearly or completely exhausted when a Q-V curve
is computed for the p ~æ ~ ;n~Pnry case at a test bus
in a critical voltage control area.
Performing an intelligent voltage stability
8ecurity: RRP- t is illustrated by the flow chart in
Wo 9~/30266 ~ 1 ~ 8 ~ 7 ~ P~ o l725
--29--
Flgure 10. The ~LOCeduL-3 involves det~rmin;n~, at block
270, the voltage control areas, i . e . the bus clusters
where the Q-V curves computed at any bus have the same
shape and the same curve minimum, and the same reactive
5 reserve basin. These bus clusters are found based on
.O~_L~I~UY~ in other words, the same voltage and angle
changes are exhibited at all buses in the voltage
control area due to any distl~rh~n-~. Alternatively, the
bus clusters are found based on controllability, observ-
10 ability, or modal properties.
Next, the subset of all of the reactive supplyL~ ~8 within voltage control areas that exhaust all
o~ their re~ctive supply at the minimum Or the Q-V curve
at any bus in the test voltag~ control area is
15 d~t~ n~d at block 272. The minimum of the Q-V curve
can generally be obtained using a normal Newt~l. Raphr~"~
algorithm using a standard ~LùcelluLe: that will obtain
the minimum when the direct application of the Newton-
Raphson alqorithm would stop obtaining solutions short
20 of the minimum.
A ~econd condition f or buses to belong to a
voltage control area is that the Q-V curve computed at
ach bus in a test voltage control area exhausts the
same reactive supply ~ _80uL ues in the same set of
25 voltage control areas at the Q-V curve mini - The
subset of reactive supply resuuL~ eS in a system ex-
hausted at the Q-V curve minimum is called the reactive
reserve basin for that voltage control area. T h e
l~lope of the Q-V curve deuL se ~ discont i n~ Ucly each
30 time all of the reactive supply res~Lv~s in one of the
voltage control areas in the reactive reserve basin is
exhausted. The reactive supply from a reactive reserve
Wo 95130266 2 ~ 8 8 ~ ~ 8 ~ 72s
~ I .
--30--
basin voltage control area to the test voltage control
area is r-; n1-~ i nP~ as long as one of the voltage con-
trols associated with reac~t~ ive supply devices in a
voltage control area is ac~e and holds the voltage in
5 th~t voltage control ar~ba.
The discontinuity in the slope of the Q-V
curve occurs not only due to 10s8 0~ reactive supply
rrom the reactive reserve basin voltage control area,
but occurs due to the increased rate of increase in
10 reactive losses with voltage decline that ~- ,-nieS
loss of all voltage control in a voltage control area.
The reactive reserve basins are computed for only
6^1 ected 6ubsets of voltage control areas that are
predicted to be vulnerable to voltage instability. The
15 voltage control areas that can experience voltage
coll~rse are predicted by detorm;n;n~ those that have
large shunt capacitive supply or experience large
reactive network loss change ~or Q-V curves computed to
dat a~m~ nP the reactive reserve }~asin for a ~ ~oighhr~ring
20 voltage control area.
A further step entails detorr;n;n~, at block
274, those reactive reserve basins and their associated
test voltage control areas that are most vulnerable to
~lngle or multiple con~;n7onoiPc, The ~ive worst
25 cont;n~onrio^~ which either cause voltage collapse by
exhausting all reactive L~se.ves in the reactive reserve
basin or bring the reactive reserve basin closest to
voltage instability by exhausting the largest pe~ ,g-
es of the reactive reserves in that reactive reserve
30 basin, are also found at block 276.
W095l30266 ~ l g 8 ~ 7 ~ ,. s~: l7~s
--3 1--
A file of single worst line outage contin-
gencies that exhaust P% or more of the reactive reserves
in any reactive reserve basin is produced at block 280.
Further, a list of worst generator outage contingencies
5 which is also ~Lv-luced, at block 280, by identifying the
two largest capacity generators from each reactive
reserve basin where one or more line outage contingen-
cies exhaust P% or more of the reactive reserve basin
Lt:-~L V~8. These two contingency lists are used to
10 produce, at block 282, a list of all single line outag-
es, all single generator outages, all double line
outages, all double generator outages, and combination
line and generator outages. Also, a list of test
voltage control areas where P% or more of the reactive
15 .. SeL ~_3 were exhausted by single line outages is
~L v~uc~d .
These files are used to compute Q-V curve
minima and reactive res~rve basin voltage control are~-s
with reactive ~ S_L V~:S f or every contingency in the
20 li~its for each reactive reserve basin test voltage
control area specif ied . Although the number of con-
t; n7r-lr~ ~c in the list6 is pref erably limited to the
projected ten worst c~ntin~enri~S~ a user may be allowed
to run all of the other contin7en~ C.
In block 284, a security ~-9~C t for single
and multiple contingencies with different transfer and
loading patterns is performed. Transfer limits are
deto-min~d for each anticipated transfer pattern (speci-
fied by a group of generators with increasing generation
in some percent~ge of the total transfer level and a
group Or generators with decreasing generation in some
~c~.,L~.ge of the total transfer level). The transfer
Wo 95/30266 2 ~ 8 8 6 7 8 . ~11. l72s
--32--
level is increased in incL~ ~s and Q-V curves are
computed for all reactive reserve basin critical voltage
control areas and all single and multiple conti"~en~iec.
If all Q-V curves for all single and multiple contin-
5 gencies in every critical voltage control area havenegative Q-V reactive minlma ~implyin~ voltage stabil-
ity~ the total transfer level is ir-,L~ ' e~'i again and
nll Q-V curves are ~ Led. This process is repeated
until one Q-V curve has Q-V curve positive minima
10 (implying voltage instability). The total transfer
level limit for the transfer pattern is thus determined.
A transfer pattern level limit is computed for each
l~n~;~;r~ted transfer pattern and the reactive reserve
basin where the Q-V curve is positive for one or more
15 single or multiple contl"qD"riP is noted.
The fiame process is repeated f or loading
patterns to find those reactive reserve basins that have
po~itive Q-V curve minima for one or more con~ Pn--iec.
The reactive reserve basins that constrain each transfer
20 (or loading pattern) and the contingpn~ipc that cause
the voltage instability for that transfer (or loading
pattern) are used as the basis of dpcignin~ Pnh~n~ Ls
that prevent voltage instability in that reactive
ruserve basin ~or those cont; nqPn~ c and a desired
25 level of transfer ~possibly larger than the current
transfer limit). It should be noted that the general
pll~nn;n~ design criterion for voltage instability only
rQquires that a power system survive a worst combination
~tu~ and line outage and does not require that a
30 system survive a double line outage contingency.
If the load flow wilL not solve for some
contingency, transfer pattern and level, or loading
~ Wo 95130266 ~! 1 8 8 6 7 ~ P~l/u_ "25
pattern and level, reactive reserves are increased in
all generators in each global reactive reserve basin,
one at a time. If the addition of reactive reserves in
~ome global reactive reserve basin allows a Q-V curve
5 load flow solution to be computed, then the contingency,
transfer pattern and level, and loading pattern and
level would cause a voltage instability in that global
reactive reserve ba~in. This feature allows on to
~t~Prm;nP whether a contingency, or tran6fer or loading
10 pattern causes a voltage instability in some other
global reactive reserve basin than the one being stud-
ied .
If one has performed the above ACSP ~ of
transfer limits for each anticipated transfer pattern
15 and loading limits for each anticipated loading pattern,
one can ~1P1 PrminP the transfer pattern limits that need
to be increased and the desired level, as well as the
loaaing pattern limits that need to be increased and
their desired levels. For each transfer tor loading)
20 pattern where the design criterion is not satisfied out
to the de5ired limit, one knows the local reactive
reserve basin or basins and the contin~enripc that cause
voltage instability in that reactive reserve basin or
basins .
The previously described . ' ';- - of the
present invention have many advantages. By d~tPrm; n; ng
single con~;n~rnriPC which exhaust more that ~)L~ _,eci-
fied p~L~ L~ge of reactive reserves, a ~ tionally
efficient method of performing multiple contingency
analysis results. The resulting method is capable of
~-ler~t;n~ multiple loss of reactive ~3~uL.es, line
outages, and combinations thereof, for performing an
WO 95130266 ~ ~ 8 8 6 ~ 8 P~/u~. .72~ ~
--34--
analysis Or the effect of multiple contingencies on each
reactive reserve basin. Furthermore, P--ho~i- Ls of the
present invention are capable of l~dentifying the specif-
ic crltical voltage control area and reactive reserve
5 basin that is brought to voltage instability after some
cnnt;nq~nry by a particular transfer or loading pattern
change th~t can cause voltage instability in a voltage
control area.
Another advantage is that the present inven-
lO tion identif ies a global stability problem and eachlocal voltage stability problem. The loss of stability
for each such problem is caused by a lack of sufficient
reactive supply to its critical voltage control area.
The reactiYe reserve basin in the critical voltage
15 control areas that maintain voltage and thereby prevent
the reactive losses that consume and choke of f reactive
supply ~rom outslde, as well as inside, the respective
reactive reserve basin from reaching the critical
voltage control area. A global voltage stability
20 problem generally has many individual local voltage
stability problems and each can occur due to different
continq~nri~ or in some cases due to the same severe
continq~nriP~ that cause loss of local voltage stability
for several critical voltage control areas by exhausting
25 their reactive reserve basin reserves. The advantages
still further include detectinq each critical voltage
control area, its reactive reserve basin, the severe
~ingle and multiple continq~nri~ that cause voltage
instability in several local reactive reserve basins and
30 may even cause a global voltage instability.
wo 95~30266 ' ~ ~ 8 8 6 7 8 P~l/ J~472~
--35--
While the best modes for carrying out the
invention have been described in detail, those familiar
with the art to which this invention relates will
reCo~ni7e various alternative designs and ~mhoAir--lts
5 for pr~c~ icing the invention as defined by the following
c~ai~e~