Note: Descriptions are shown in the official language in which they were submitted.
V1'0 95135514 , r PCTIUS95/08563
~ .'= Zi93pb6
NOCLEAR MAGNETIC RESONANCE DETERMINATION OF
PETROPHYSICAL PROPERTIES OF GEOLOGIC STRUCTLJREB
Field of Invention
The present invention relates to systems for
obtaining quantitative and qualitative measurements of
geologic structures. More specifically, the present
invention provides an efficient and effective method
for using information obtained via nuclear magnetic
resonance (NMR) techniques to determine petrophysical
properties of geologic structures.
Bac ground
A key petrophysical property in determining
whether a formation will produce viable amounts of
hydrocarbons is the water saturation, Sw, of the
formation. Sw is defined as the percentage pore space
of the formation that is filled with formation water
and is related to other parameters of interest, such
as the bulk-volume water (BVW), the bulk-volume
hydrocarbon (BVH) and the porosity (PHI) of the
formation as follows:
BvW = PHI * Swi
BVH = PHI * (1-Sw)~
Obviously, if the formation's pore space is completely
filled with water, that is if Sw = 100 %, such a
formation is of no interest for the purposes of an oil
search. On the other hand, if the formation is at the
minimum possible water saturation it will produce all
hydrocarbons and no water. The minimum possible water
saturation of a formation is known as irreducible
water saturation, Sw~.
The irreducible water saturation SwmR is related
to the average grain size of a formation. For example,
shales and clays, due to their platy structure and
W095135514 , ~ PCTIUS95108563
~: ,' ~: - 2 - 2 i 93066
.:,
small grain size have immense surface areas compared
to the same volume of sand grains. The effect of this
is to bind large quantities of water to their
structure. Additionally, due to their fine grain size
and the strong forces that hold the water in place,
shales have essentially zero permeability and high
porosity. Thus, shales decrease the porosity of the
formation that is available to hold producible (free)
fluids and increase the amount of water that is bound
to the formation. Using the relationship above, the
irreducible water saturation 5,~,,RR allows one to compute
the water bound to the formation, known as the bulk-
volume irreducible water (BVI) of the formation, i-e.,
the percentage of the unit volume of the formation
that is irreducible formation water, as follows:
BVI = PHI * Sue.
Given the critical importance of the water
saturation as discussed above, many techniques have
2o been proposed for determining its value for a given
formation. The standard approach to obtaining a value
for SW is through the Archie formation factor process.
The formation factor F is defined as:
F = Ro/Rev ~ Cev/Coi
where Ro is the resistivity of a reservoir rock when
fully saturated with aqueous electrolyte of
resistivity Rw" and Co and C", are corresponding
conductivities. Further, given knowledge of porosity
(PHI), which is the fraction of the total volume of a
sample that is occupied by pores and voids; and
resistivity (R~), ,i.e., the resistance of reservoir
rock that is partially saturated to degree Sw with
electrolyte of resistance Ro, via conventional logging
techniques, Archie formation factor analysis provides
the following empirical relationships which relate the
W~ 95135514 ~ , PCTIUS95/08563
,.:;~~~:w~~,., - 3 - 2~9306b
porosity (PHI) to formation factor (F), and
resistivity to saturation. The relationships are:
F = a
PHIm
and
~_ FRS.
W~ R (1)
r
In practice, the values of "a" (formation-factor
1o
coefficient), "m°' (cementation exponent), and "n"
(saturation exponent) vary with the type of formation
and the nature of the hydrocarbon. However, in most
cases an analyst will use the same relationship over
large intervals, intervals that may include a variety
of lithologies, pore types, and grain sizes. In such
circumstances, it is often difficult to select the
correct values of "a", "m", and "n". A selection of
the correct values is of a significant concern since
these parameters are used to relate porosity to
2 0~
formation factor F, and, in conjunction with
resistivity, to saturation.
In an attempt to reduce the complexity of the
above-mentioned relationships, it is has been observed
that if "a" is a constant, it should equal to 1, since
F must be equal to 1.o in 1oo% porosity. Thus, the
relationship between formation factor F and porosity
reduces to:
F - 1
3d PHIm
Further simplification of Eq. (1) is possible if
the porosity PHI and the saturation SW are not treated
as independent variables. While the assumption that
porosity and saturation are independent has been
useful for performing laboratory studies of geologic
structures, as known to log analysts, this complexity
W095135514 . ~ PCTlUS95108563
- 4 - 2193066
. i..J c. ... ~ ~
of the model is not necessary for interpreting an
actual resistivity log.
Considering the above, it has been proposed to
eliminate porosity and saturation as independent
variables and use only the bulk-volume water term (the
product of porosity and saturation) to model the
relationship between the conductivity of the fluids
involved and the measured conductivity of the
formation. This approach has the additional benefit
of avoiding the need to independently estimate the
numerical values for the exponents "m" and "n.'°
In an article by George R. Coates and
J.L. Dumanoir, entitled "A New Approach to Improved
Log-Derived Permeability," SPWLA, Fourteenth Annual
Logging Symposium, p.l, 1973, it was found that a
common value, "w", could be adopted for both the
saturation exponent, "n", and cementation exponent,
"m". The proposed single exponent expression used to
relate BVW, i.e., PHI*Sw, to resistivity is:
(PHI*Sw)'" = Rw/R~
where:
w is the single exponent used to relate the
BVW to Rw/R,;
PHI is the total porosity of the rock;
R~, is the resistivity of the formation water;
and
R, is the true resistivity of the rock.
The proposed single exponent expression has not
been widely used in the logging industry until
recently because a log analyst could only assume a
rock to be completely water filled in order to examine
an apparent value for w. In other words, the single
exponent equation could only be solved for w by
W0 95135514 . PCT/US95/08563
r ~y:u~ ~.;':1.: - 5 - 2i~306~6
assuming that PHI*Sw = PHI. The porosity term was
determinable via conventional logging instruments.
The results obtained by assuming a water filled
g condition were only valid in the water zones and
resulted in an overestimation of w in the hydrocarbon
zones of interest. It has long been desired to solve
w for a hydrocarbon filled condition, i.e., PHI*Sw =
BVI, such that a valid result for w could be obtained
ip, for hydrocarbon zones of interest.
Additional complications in using Eq. (1j to
obtain accurate values for the desired parameters
arise from the fact that the resistivity measurements
are affected by the presence of clay minerals in the
15 formation. In order to compensate for these effects
which may significantly reduce the accuracy of the
measurements it is required to obtain an estimate of
the clay minerals content of the formation. Such
estimates are traditionally obtained using subjective,
20 frequently complicated and inaccurate clay indicator
methods.
With the advent of NMR logging, new options for
determining w as well as other fluid flow properties
of porous media have arisen. In an article by A.
25 Timur, entitled "Pulsed Nuclear Magnetic Resonance
Studies of Porosity, Movable Fluid, and Permeability
of Sandstones," in the Journal of Petroleum
Technology, June 1969, page 775, it was shown
experimentally that NMR methods provide a rapid non-
30 destructive determination of porosity, movable fluid,
and permeability of rock formation.
It is known that when an assembly of magnetic
moments, such as those of hydrogen nuclei, are exposed
to a static magnetic field they tend to align along '
35 the direction of the magnetic field, resulting in bulk
magnetization. The rate at which equilibrium is
VVO 95135514 , PGTIUS95/08563
wtf'~i~ >~ ~..
- 6 - 219306
.. -. ~
established in such bulk magnetization upon provision
of a static magnetic field is characterized by the
parameter T1, known as the spin-lattice relaxation
time.
It has been observed that the mechanism which
determines the value of T1 depends on molecular
dynamics. In liquids, molecular dynamics are a
function of-molecular size and inter-molecular
interactions. Therefore, water and different types of
oil have different T1 values.
In the heterogeneous media, such as a porous
solid which contains liquid in its pores, the dynamics
of the molecules close to the solid surface are also
significant and differ from the dynamics of the bulk
liquid. It may thus be appreciated that the T1
parameter provides valuable information relating to
well logging parameters.
There exist a number of techniques for disturbing
~e equilibrium of an assembly of magnetic moments,
such as those of hydrogen nuclei, for T1 parameter
measurements. Each of these techniques provides means
for measuring T1 of a rock formation within a certain
volume (called the °'sensitive volume") which is
determined mainly by the shape of the magnetic field
surrounding the magnetic structure. The signal-to-
noise ratio of the measurement is limited by the ratio
of the sensitive volume to the uniformity of the
magnetic field within said volume (maximum flux
density minus minimum flux density), and increases in
proportion to this ratio.
In any given NMR instrument configuration, the
apparatus will respond only to nuclei -residing within
the sensitive volume. In the present invention and
Prior art instruments described herein, the boundaries
of the sensitive volume are determined by radiation
WO 95135514 ~ , PCT/US95/08563
.. ,. ~ ~;, _ , _
'jv~~Y' 2193066
patterns of transmitting and receiving antennae as
well as a combination of the detailed structure of the
magnetic field with the receiver's frequency passband.
The radio frequency that a given nucleus will respond
to or emit when excited is proportional to the flux
density of the magnetic field in which it is immersed.
The proportionality factor depends upon the nuclear
species. For hydrogen nuclei, that factor is 42.5759
lp MHz/Tesla. If the NMR receiver's passband extends
from 1.30 MHz to 1.31 MHz, the instrument will be
sensitive to hydrogen nuclei in regions of the
magnetic field that have flux densities between 30.5
mT and 30.8 mT, providing the antenna radiation
15 pattern allows receiving sufficient signal from that
locations.
If it is desired to study nuclei located within a
particular region, the magnetic field structure,
antenna radiation pattern and receiver passband must
gQ all be adjusted to be sensitive to that and only that
region. Since the signal-to-noise ratio of the
resulting signal is proportional to (among other
factors) the square root of the receiver passband
width, it is important to minimize the variation of
the magnetic field within the desired sensitive
volume; smaller variations (better field uniformity)
mean a better signal-to-noise ratio. Since the
signal-to-noise ratio also increases with increasing
frequency, the nominal magnetic field intensity within
g~, the volume is also very important. It is immaterial
whether this nominal intensity is defined as the
central value, average value or some other value
within the range of values encompassed by the
sensitive volume because only large differences in
35 signal-to-noise ratio are significant.
W095135514 ~ ~ PCT/US95108563
~.~1~..~'.~ - g - 2193066 i
One technique for measuring T1 of a rock
formation is exemplified by what is known as the
"Schlumberger Nuclear Magnetic Logging Tool." That
tool is described by R.C. Herrick, S.H. Couturie, and
D.L. Best in "An Improved Nuclear Magnetic Logging
System and Its Application to Formation Evaluation,°'
SPE8361 presented at the 54th Annual Fall Technical
Conference and Exhibition of the Society of Petroleum
Engineers of AIME, held in Las Vegas, Nev., Sept. 23-
26, 1979, and also by R.J.S. Brown et al. in U.S. Pat.
No. 3,213,357 entitled "Earth Formation and Fluid
Material Investigation by Nuclear Magnetic Relaxation
Rate Determination."
The Schlumberger Nuclear Magnetic Logging Tool
measures the free precession of proton nuclear
magnetic moments in the earth's magnetic field by
applying a relatively strong DC polarizing field to
the surrounding rock formation in order to align
2o Proton spins approximately perpendicularly to the
earth's magnetic field. The polarizing field must be
applied for a period roughly five times T1 (the spin-
lattice relaxation time) for sufficient polarization
(approximately two seconds). At the end of
Polarization, the field is turned off rapidly. Since
the protons spins are unable to follow this sudden
change, they are left aligned perpendicularly to the
earth's magnetic field and precess about this field at
the "Larmor Frequency" corresponding to the local
earth's magnetic field (roughly from 1300 to 2600 Hz,
depending on location).
The spin precession induces in a pick-up coil a
sinusoidal signal whose amplitude is proportional to
the density of protons present in the formation. The
signal decays with a time contrast "T2" (transverse
R'O 95135514 . PCTIUS95108563
i :~~~:.;~;';y - 9 - 2193x66
relaxation time) due to non-homogeneities in the local
magnetic field over the sensing volume.
Improved NMR logging tools and methods for using
these tools are described generally in U.S. Patent
Nos. 4,710,713; 4,717,876; 4,717,877; 4,717,878;
5,212,447 and 5,280,243 all of which are commonly
owned by the assignee of the present invention.
The method of the present invention, described in
greater detail below, uses the logging tools and
techniques described in the above referenced patents
to obtain previously unavailable data relating to the
composition of a geologic structure. The measurements
from the above described tools are used in combination
with new and existing theoretical developments to
obtain enhanced information regarding the
petrophysical properties of geologic structures. In
particular, a novel interpretation of standard and NMR
measurements is used to obtain characteristics of the
20, formation including its clay mineral content which may
then be used to determine key petrophysical parameters
such as the water saturation.
30
R'O 95135514 , PCT/US95108563
-1° - 2~~~0~~
Summary of the Invention .,.,.,., .,.
The method of the present invention provides an
improved system for using NMR techniques for obtaining
information relating to geologic structures. In the
system of the present invention, a NMR logging tool is
used to impart magnetic polarization fields on a
portion of a geologic formation. Nuclear magnetic
resonance signals from the excited nuclei in the
formation are then detected to obtain data for
calculating a number of important petrophysical
parameters including the porosity, the clay mineral
content and the bulk volume irreducible water of the
formation.
The system and method of the present invention
provide the capability of directly measuring the
volume of irreducible water (BVI) which measurement is
used to improve the reliability of log derived water
saturations, especially in complex lithologies. In
addition, observations of the porosity response of the
magnetic resonance log (MRL) in comparison with other
porosity measurements provide a more direct method for
determining the clay mineral bound water content than
is generally available from conventional log data.
Specifically, due to the fact that the NNtR tool
is blind to relaxation times shorter than about 1.5 ms
which are indicative of clay mineral bound water and
other pore systems with short relaxation properties,
in accordance with the present invention the MRL,
operated at about 2ms pulse rate, measures porosity
that can be used as an estimate of the effective pore
space of the formation, excluding the effects of the
clay porosity. Thus, the effective porosity (PHIL) is
related to the total porosity (PHIT) and the clay bound
water porosity (PHI~1) as follows:
PHIL ° PHIL = PHIT - PHIoy,
W~ 95135514 ~ . PCT/US95I08563
t a 6
i i i ~.
r ~ ~ - ~~ - ~ I 9306b
J ~-' ~ . f
where PHIMeL is the MRL measured porosity.
In accordance with a preferred embodiment of the
present invention, this relationship provides the
g capability to determine the clay mineral bound water
fraction (Swb) directly when the MRL porosity
measurement is combined with an estimate of the total
porosity obtained from conventional sources. This
feature in turn allows the user to make corrections in
the resistivity log measurements and thus obtain
accurate water saturation estimates.
In a different embodiment, the porosity and the
bound volume irreducible water are further used to
determine additional petrophysical properties of the
lg formation. In particular, the bulk volume water is
calculated using the expression:
(PHI*Sw)"' = Rw~R~
for a first apparent w by assuming a water filled
formation (PHI*S~"=PHI) and for a second apparent w by
g0. assuming an oil filed formation (PHI*S,y=BVI).
Additional petrophysical parameters such as the
irreducible saturation profile of the formation are
derived from a new model relating the w parameter to
the two apparent values of w.
30
W095135514 , ~ PCTIdTS95108563
- 12 - Z t 93~ 66 r
~~~ ~; ~. ~,' j t
Brief Description of the Drawincrs
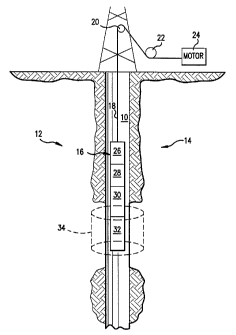
FIG. 1- is a partially pictorial, partially block
diagram illustration of a well logging apparatus for
obtaining nuclear magnetic resonance measurements of a
geologic structure;
FIG. 2 is a graphical illustration of a chain of
spin-echo relaxation signals as a function of
amplitude versus time for a geologic structure
1o investigated using a nuclear magnetic resonance system
such as that shown in FIG. 1;
FIG. 3 is a log of typical high porosity sands of
the Gulf Coast of the United States and includes the
formation's apparent values for w (track 3) and NMR
Porosity and bulk volume irreducible water (track 4);
FIG. 4 is a comparison of ww and R,o/Rt for the
formation of FIG. 3;
FIG. 5 ~.s a comparison of wi and R~/R, for the
formation of FIG. 3;
FIG. 6 is a comparison of ww and wi for the
formation of FIG. 3;
FIG. 7 is a comparison of ww and S~ (determined
from NMR measurements of bulk-volume irreducible water
and porosity) for the formation of FIG. 3;
FIG. 8 is a comparison of conventional results
(track 4) to those obtained by the method of the
present invention (track 3) in determining bulk volume
water for the formation of FIG. 3;
FIG. 9 is a log of a carbonate Edward's
formation;
FIG. 10 is a comparison of the values of ww and
wi for the formation of FIG. 9;
FIG. 11 is a comparison of ww and R,~/R, for the
formation of FIG. 9;
FIG. 12 is a comparison of wi and R,~/Rt for the
formation of FIG. 9;
WO 95135514 . PCT/US95/08563
- 13 _
y
J
FIG. 13 is a comparison of wi and ww for the
formation of FIG. 9;
FIG. 14 is a comparison of ww and S~ (determined
a from the MR measurements of bulk-volume irreducible
N
water and porosity) for the formation of FIG. 9;
FIG. 15 is a comparison of core determined S~
and w for core samples taken from a well near the
formation of FIG. 9; and
FIG. 16 is a comparison of convention results
(track 4) to those obtained by the method of the
present tion (track 3) in determining bulk-volume
inven
water for theformation of FIG. 9.
FIG. 17 is a comparison of the density-neutron
la M~ Porosity measurements in a shaly sand.
FIG. 18 is an illustration of clay bound water
indicators rrelation.
co
FIG. 19 is a block diagram of the MRL analysis
method in accordance with the present invention.
2n FIG. 20 is an illustration of a comparison of S"b
obtained Cd, and the MRL method of the present
from
invention.
FIG. 21 illustrates the results obtained from the
method of the present invention in the computation of
25 Swb in a Frio Shaly sand example.
FIG. 22 illustrates the results obtained from the
method of the present invention to the computation of
Swb in a Gulf of Mexico Eugene Island example.
FIG. 23 illustrates a water bearing Frio shaly
3Q sand interval from the Texas Gulf Cost.
FIG. 24 A is a Pickett plot illustrating Rw using
Density-Neutron Crossplot porosity.
FIG. 24 B is a Pickett plot of clay rich shales
using Density-Neutron crossplot porosity.
3& FIG. 24 C is a picket plot of clay rich shales
using density porosity (Sandstone Matrix).
WO 95135514 . PCTIUS95108563
- 14 - 219306b
FIG. 25 A is a Density-Neutron Plot with
cleanest, wettest sand.
FIG. 25 B is a Density-Neutron plot with clay
rich shale highlighted.
FIG. 26A is a Density-Neutron plot with total
porosity balanced to Ccw.
FIG. 26 B is a Density-Neutron plot with total
porosity scaling.
FIG. 27 is a Pickett plot of water example using
new total porosity.
20
30
CA 02193066 2001-08-03
WO 95/35514 PCT/US95/08563
- 15 -
Detailed Description of the Preferred Embodiment
Referring to FIG. 1, a borehole 10 is shown in
formation 12 having structures to be examined using
the method and apparatus of the present invention.
Within the borehole, there is a logging tool 16 which
is suspended by a cable 18 routed over pulleys 20 and
22, with the position of the cable 18 being determined
by a motor 24.
The upper portion of the logging tool 16
comprises telemetry electronics 26, gamma ray sensing
electronics 28 and magnetic resonance imaging (MRI)
electronics 30. A MRI probe 32 is suspended at the
bottom of the probe to provide excitation to the
surrounding geologic formation. The excitation field
has a generally cylindrical shape as represented by
reference numeral 34. Improved devices which can be
used for the probe 32 are described generally in U.S.
Patent Nos. 4,710,713; 4,717,876; 4,717,877; and
4.717,878.
The spin-spin pulse-echo measurement of the spin-
echo relaxation of the sample, in a homogenous
isotropic media, reflects the surface-to-volume
characteristics of the pores. In typical rocks
encountered in the well-logging environment, the rocks
are complex mixtures of minerals which often include a
variety of pore sizes. Consequently, the measured
spin-echo relaxation in such an environment is a
complex phenomenon, a reflection of the variations
which exist in terms of pore surface-to-volume ratios
and surface-to-fluid interactions.
FIG. 2 is a graphical illustration of a chain of
spin-echo relaxation signals as a function of
amplitude versus time for a geologic structure
investigated using a nuclear magnetic resonance system
CA 02193066 2001-08-03
WO 95/35514 PCT/US95I08563
- 16 -
such as that shown in FIG. 1. The spacing of the time
intervals between the pulses in this application is
typically between 1.5 and 3 milliseconds. The time
intervals labelled "A-H" correspond to the signal
intervals for various particle sizes, with interval
"A" corresponding to the interval for particles larger
than 500~cm and interval "H" corresponding to the
interval for particles of larger than 8~tm, etc.
Using the echoes in each time window to regress
to time zero establishes an apparent porosity
amplitude. Such regression techniques are known to
those skilled in the art and are described in the
following references: K. Fukunaga, Introduction to
Statistical Pattern Recognition, Academic Press, 1972;
Bhattacharyya & Johnson, Statistical Concepts and
Methods, Wiley & Sons, 1977; and Devijver & Kittler,
Pattern Recognition -- A Statistical Approach,
Prentice Hall, 1982.
2o As a consequence of the actual tool operation,
the measurement of spin-echo information is delayed
for a few milli-seconds (typically < 5m secs for
the tools described in the above referenced
patents) . During this period of time (tdel) no
formation information is uniquely measured. This
tdel time period includes the surface-to-volume
response associated with a select pore-size
group that is directly linked with the pore-sizes
related to clay size grains. Thus, by proper
selection of the echo windows through use of the t~,
parameter, a spin-echo measurement can be provided
which measures the total pore-space minus those
associated with the particular pore surface-to-volume
ratios related to the noted particle sizes.
The pore surface-to-volume responses that are
missed during this td~, period include~the clay mineral
CA 02193066 2001-08-03
WO 95135514 PCT/US95/08563
- 17 -
fraction of the rock-space, thus providing a direct
link between such a NMR measured porosity and the
total porosity of the rock. In other words, in a clay
mineral free environment, with pores >2um,
extrapolation of the NMR echo signals to time zero
provides a measure of the total porosity PHI, but, in a
shaly-sand that contains clay minerals and thus clay
size pores, the NMR porosity measurement does not take
1o into account the influence of the non-reservoir
quality micro-pores. As described in more detail
below, this feature makes the NMR porosity measurement
particularly useful in assessing the reservoir's
capacity to support production.
15 Prior art references discussed above (see, for
example, A. Timur, Journal of Petroleum Technology
article) show that NMR may be used for the
determination of a rock parameter called the free-
fluid index (FFI). The FFI method relies on use of
20 relaxations which occur during a late measurement time
following a select td~,. This time period being
referred to as the long component of the relaxation
phenomenon (typically t~,'s > 22 m secs). The
difference between the pore space described as the
25 long component relaxation and that provided by the
full NMR spectrum provides a direct measure of the
pore bulk-volume that is held in place by existing
surface tension and other capillary forces. This
parameter, the bulk-volume of irreducible water, is
30 directly related to pore surface-to-volume of the non-
clay size rock.
The NMR measurement of porosity and bulk-volume
irreducible are in turn used to find the intrinsic
W095I35514 . ~ PCTIUS95/08563
2193066
rt 1
.,~j ";.
\ v ~~ y.
permeability of the rock, since these measured
parameters (porosity and bulk-volume irreducible)
reflect the principle component of the rock°s
producibility, through a model such as that of the
Coates' free-fluid perm model.
The method and apparatus of the present invention
is based on the discovery that NMR values of porosity
and bulk-volume irreducible water can be further used
1o to determine the exponential relationship '°w" between
the bulk-volume water (BVW=PHI*S",) of the formation
and the resistivity ratio Rw,/R, through the equation:
(PHI*S")°' = Ft",/R, (Z)
where:
w is the single exponent used to relate
the BVW to R,~,/Ft~
PHI is the rock's total porosity;
R~, is the resistivity of the formation
water; and
R, is the rock°s true resistivity.
As discussed above, prior art methods could only
solve for an apparent w by assuming a water filled
condition (PHI*Sw PHI), since prior art devices could
measure porosity but not bulk volume irreducible.
This resulted in an overestimation of w in hydrocarbon
zones. Advantageously, by knowing NMR bulk volume
irreducible water (BVI), a second apparent w can be
solved for by assuming a hydrocarbon filled formation
(PHI*Sw=BVI). Thus, the present invention provides
accurate values for w for water filled formation as
well as for hydrocarbon filled formations.
The apparent values of w are solved for by making
two assumptions: First, the zones of the formation
are at irreducible water saturation (S~, = SW,~,
BVW=BVI, w = wi), and second, that the zones are water
R'O 95/35514 ~ . PCT/US95/08563
._ . ( ~ _ 19 _
~,~,'J;.'~. . 2193066
filled (Sw 1.0, BVW=PHI, w = ww). Solving Equation
(2) for the apparent w's at these two endpoints
yields:
wi = log (R~,/R,) /log(BVI) (3)
ww = log (R~,/R,) /log (PHI) (4)
Therefore, since R, is determinable via a
conventional resistivity log as is known in the art,
and since BVI and PHI for a given formation are
l0
determinable via the NMR devices as described above,
once F~" is known, w can be solved for at its two end
points, wi and ww.
For typical high porosity shaly sands of the Gulf -
Coast of the United States, a Pickett Plot has been
found useful by those skilled in the art for
determining Ra,. Once R", is determined via the Pickett
Plot, it should be corrected for the effects of clay.
Clay correction is also known by those skilled in the
2o art and can be accomplished by using a multiple clay
indicator sorting to determine the appropriate clay
bound water fraction.
Having determined a clay corrected value for Ra"
the apparent values for w can be ascertained by
substituting the NMI2 measured values for BVI and PHI
into Equations (3) and (4), respectively. A log of ww
and wi for the above-described Gulf Coast formation
can be observed in track 3 of FIG. 3. As expected,
when PHI approaches BVI, the two estimates of w tend
to approach similar values.
Having determined the apparent values of w,
confirmation as to whether these values yield accurate
results for the assumed conditions can be ascertained
using conventional log interpretation means. Such
means will assist in determining whether a particular
WO 95135514 . ~ PCTIUS95J08563
~c~~-~ i': - 2~ - 2193066 t1
zone of investigation is likely to be water filled or
at irreducible water.
One means for accomplishing this is by plotting
ww and wi each separately against a variable strongly
linked to saturation, but one that is largely free of
formation factor influence, such as the ratio R~/R,
(where R,~ is the flushed zone resistivity). Examples
of such plots for ww and wi derived from the above-
mentioned high porosity shaly sands of the Gulf Coast
of the United States are shown in FIGS. 4 and 5,
respectively.
With respect to FIG. 4, several textural
conditions should be identifiable to a skilled log
analyst and include: sands at irreducible, sands
approaching Sw = 1, shaly sections, a mineral change
and trends reflecting the effects of clay minerals and
hydrocarbon content. Of particular importance, in
water sands, at or near the assumed condition, i~ e.,
Sw=1. T~TH' approaches a value of 1.8. This value
corresponds well to values often observed in lab
studies of similar rocks. Thus, ww provides an
accurate determination of w as we approach the assumed
condition of PHI*Sw PHI.
With respect to FIG. 5, the wi plot illustrates
the changes in data patterns associated with the
change in assumption. Now the sands that are high in
hydrocarbon content give values more in line with
values observed in laboratory studies for similar
rock, while the non-irreducible areas give values much
lower. Thus, wi provides an accurate determination of
w as we approach the assumed condition of PHI*S~,=BVI.
Furthermore, of particular importance is the
observation from FIGS. 4 and 5 that w apparently
varies with irreducible water saturation. As shown in
FIG. 5, as wi decreases, Sw increases. This means the
WC 95/35514 ' ~ PCT/US95/08563
- 21 -
',i~,.,.~, .
2193066
prior art use of constant values for "m" and "n" in
both water and hydrocarbon zones may lead to error,
since it results in over estimating hydrocarbon
content in some formations while underestimating them
in others.
This trend is further explored in FIG. 6, a plot
of wi against ww. Examining FIG. 6, it can be
observed by one skilled in that art that water bearing
sands are a vertical trend at a value near 1.8, while
the sands at S,nRR trend to the right and above this
same value.
Further confirmation of w's variation with
irreducible water saturation is ascertained from FIG.
i5 ~. a plot of ww against the apparent S,y,~, where the
apparent SWmR is equivalent to the NMI2 measured bulk
volume irreducible water BVI divided by the NMR
measured porosity PHI. FIG. 7 makes it possible to
discern trends associated with the effects of
increasing Sw as well as trends of increasing Sue.
Importantly, a trend between S",,RR and w is also shown,
providing a pattern to develop a relationship for
predicting the value of w to use in a shaly sand
formation like these. Determining the best-fit first
order equation from the trend depicted in FIG. 7
results in the following equation:
w = .4* SCR + 1.65 (5)
Track 2 of FIG. 8 shows a log of w (calculated
using equation (4)), wi and ww for the above-described
formation. The resulting bulk-volume water calculated
using w, where the w to be used is constrained to be
greater than or equal to wi and less than or equal to
ww since ww and wi represent the endpoints of w, is
shown in track 3 of FIG. 8. As can be observed,
W095I35514 . ~ PCT/US95108563
22
compared to the conventional "m" and "n" analysis
depicted in track 4, the results have increased the
water in some of the original "shows" while reducing
it in others.
FIG. 8 also illustrates the capability of the w
information to predict S~,.I,~ qualities by comparing the
predicted w to ww and wi. As can be observed, when ww
> w hydrocarbons are present, and when w is greater
than wi, a non-5,~.,~ zone is indicated. Only when w =
wi, can the zone be considered at S~",RR
For the above-described formation, the show at
the top of the upper sand of FIG. 8 was production
tested, making 600 mcfpd of gas for 30 days then
producing about 20 BWPD and 50 BOPD, finally leveling
off at 100 BWPD and 40 BOPD.
Example
A carbonate formation more complex than the
above-described shaly sand formation was investigated
to verify the above-described results. FIG. 9
illustrates the log data for this formation. The
interval shown is an Edward's formation from central
Texas. As shown by the conventional porosity logs,
(track 3 of FIG. 9) displayed in apparent limestone
porosity units, the lithology is complex, and
establishing the correct values for '°a", "m", and "n"
is difficult. However, the NMR derived porosity
closely tracks the core derived porosity (track 4 of
FIG. 9), demonstrating the NMR log's capability to
determine porosity without concern for matrix
lithology. Thus, the problem of determining porosity
for a complex-lithology is minimized, leaving the
issue of relating porosity to formation factor.
The first pass analog results of wi and ww are
shown in track 3 of FIG. 10. The ww versus Rxo/RL plot
W095135514 ~ . PCT/US95/08563
r ') - 23 =
of this interval is shown in FIG. 11. The high R~/R,
maximum gives good confirmation that a major portion
of this interval has a high water content. Looking
next at the BVI based wi versus R,~/RL plot, FIG. 12,
confirms the high water content and evidences that
there are hydrocarbons present. This is indicated by
the contrast in ww and wi in FIGS. 11 and 12. These
conclusions are also supported by the trends
l0 observable in FIG. 13, a plot of wi against ww.
A comparison of ww to S~RR is shown in FIG. 14,
where S~ is derived from the.NMR values of porosity
and bulk volume irreducible as described above. The
trend observed in the above-discussed Gulf-Coast shaly
15 sand example in shown as a solid line (equivalent to
Equation (4)). As can be observed, the solid line
closely agrees with the lower edge of the data
confirming the viability of Equation (4) to this type
of formation. The data that falls above this line
20 infers non-reservoir rock (shales) at SCR or
hydrocarbon effects.
Table 1 shows the results of full core analysis
on similar rocks from a nearby well in this field.
The results of transforming the conventional a, m, and
25 n values into w are also listed.
35
R'O 95135514 . ~ PCT11J595/08563
24
f~ ~~ .~ ' 4
Depth m n w PHI PERM SAT
10380.80 1.888 1.230 1.802 12.800 1.200 73.500
10382.60 2.063 1.020 1.738 6.300 .510 28.600
10383.60 2.021 1.020 1.823 6.700 .130 51.300
10451.40 2.119 1.120 1.796 9.200 .910 32.00
10452.80 2.111 1.230 1.758 9.700 2.500 21.00
10453.40 2.055 1.160 1.688 11.200 5.500 21.900
FIG. 15_shows a plot of the derived w from Table
1 against core SCR. Additionally, FIG. 15 also
contains a solid line representing the trends observed
on both the shaly sand and the log derived values
shown in FIG. 14 (i-e., Equation 4). Though the data
set is limited, it gives a fairly reasonable agreement
to the observed trend.
The actual w (as well as the apparent w's)
calculated via equation (4) is shown in track 2 of
FIG. 16. To -determine the BVW term, the w to be used
is first calculated via equation (4) and then
constrained to be greater than or equal to wi and less
than or equal to ww as discussed above. The results
(track 3) show that most of the good permeability
section is in a non-SW~RR state. The production tests
on this well confirmed this by initially producing a
1.1 MMCF gas with low water flow from all major
porosities in this interval. However, that quickly
changed to non-commercial high water cut production in
less than 60 days.
CA 02193066 2001-08-03
WO 95/35514 PCT1US95/08563
- 25 -
Usina MRL Porosity Information
As briefly discussed above, observations of the
porosity response of the magnetic resonance log (MRL)
in comparison to other porosity measurements suggest a
more direct method of determining the clay mineral
water content of the formation than is generally
available in conventional log data. In a paper by
Coates et al., "The MRIL in Conoco 33-1: An
to investigation of a new magnetic imaging log," DD
paper, 32-nd Annual Logging Symposium of the Society
of Professional Well Log Analysts, Midland, TX, 1991,
it was observed that the MRL determined porosity
is similar to the effective porosity used in
conventional log interpretations because it does
not take into account the contributions of pores
of size less than about 2~tm. The reason is that
such small pore sizes have very fast relaxation
times which cannot be registered by the NMR tool.
2p It is accordingly possible to model the MRL
porosity measurement PHIM as being equal to the
effective porosity, PHIEF using the following
relationship:
PHIM = PHIEF = PHIT - PHIAL, (6)
where PHIT is the total porosity of the formation as
measured by other independent methods, and PHIL is the
clay porosity of the formation. Dividing both sides
of Eq. (6) by the total porosity PHIT and rearranging
terms provides an expression for the free water
saturation SW~ and the bound water saturation S~b:
SWf + Swb = 1. (7)
As well known in the art, total porosity PHIT
estimates may be obtained from sonic logs, density
logs or neutron logs, provided that the lithology of
the formation is known. If the lithology is not
WO 95135514 . PCTlU595108563
~c't~~ ~;' ~ ~ - 26 - 2~ ~3~bb
known, or if mixtures of known minerals exist, a
combination of two or more porosity and lithology
sensitive logs can be used to define the lithology and
provide an accurate value of the total porosity.
Confirming the observation that the PRIM porosity
measurement can be used to approximate the effective
porosity PHIL of the formation is the fact that in
clastic, shaly sand conditions the NtRL derived
porosity PHIM is less than the total porosity PHIT
measured by an independent method. On the other hand,
in cleaner sands, such as those between 5212 ft and
5221 in FIG. 17 (track 4) the MRL porosity readings
are close to the total porosity determined from a
conventional density log.
Track 3 in Fig. 18 illustrates the correlation
between several clay bound water indicators including
a gamma ray, a spontaneous potential and the MRL clay
bound indicator in accordance with the present
g0 invention. It should be noticed that while the
outputs of the indicators do not completely overlap,
the output of the MRL indicator is clearly consistent
with the other, more traditional indicators.
The comparison between MRL and density (or total)
porosity measurements has been found sensitive to the
inter-echo spacing (TE) used in the particular NMR
experiment. Table 2 below indicates that the MRL
porosity decreases as the spacing TE increases.
35
R'O 95135514 ~ . PGT/US95/08563
s~ ~:N t~,, ~ .~ - 27 -
2~930bb
TABLE 2: MRL Core Analyzer Illustration of Porosity
Sensitivity to Interecho Spacing.
NMR CORE ANALYZER
POROSITY
i
i
I
Sample Core TE=.5 ms TE=1 ms TE=2 ms
Porosity
J7-A15-18 14.69 14.21 13.62
J7-B 16.33 15.62 15.52 15.20
J7-C 14.17 14.04 13.56 13.18
J7-D 16.64 15.43 15.36 15.26
J10-1 23.04 21.49 19.82 17.68
J12-14 9.42 9.63 -- 8.67
J14-1 14.67 14.46 14.46 13.72
x LaDOratory Nmx measurements perrormea at static
magnetic field gradient G=6.74 gauss/cm
ao
The tendency of the PHIM measurement to decrease
with an increase of the TE spacing, as illustrated in
Table 2, indicates the existence of a relationship
between the echo spacing of the NMR measurements and
the porosity loss which is due to the presence of
particular small pore-size components in the
formation. Since small pore-sizes are related to the
clay-mineral water content of the formation, in
accordance with the present invention it is possible
to directly estimate the clay porosity. Specifically,
in a preferred embodiment of the present invention the
value for the TE spacing is set equal to 2 msec, which
value was found to be optimal for the determination of
the clay porosity PHIL of the formation. Smaller
values for TE typically result in underestimating of
the clay porosity, while larger values tend to
W095I35514 ' PCTIUS95/08563
- 2$ - 2193p66
eliminate porosity components which are of non-clay
type, such as silt.
The derivation of the clay porosity PHh using
the MRL measurements in accordance with the present
invention in turn allows to determine the clay mineral
bound water saturation S"e that can be used directly in
the standard resistivity based models to obtain
accurate water saturation estimates, as well as other
parameters of interest, such as the effective bulk
volume water and the permeability of the formation.
Specifically, turning back to Eq. (1), the Archie
formation factor analysis formulas can be rewritten to
assume the form:
(PHI°' Sw°) C'k, = C~ (8)
where C' is a general conductivity term corresponding
to a clean formation. For shaly formations the C'
conductivity can be expressed as a function of the
free water conductivity CW, the water bound saturation
S",, and a clay water conductivity parameter C~,~, which
can be obtained using the Dual-Water CEC method, as
discussed for example in Clavier et al., "The
theoretical and experimental bases for the 'Dual
Water° model for the interpretation of shaly sands,"
SPE 6859, Annual Technical Conference and Exhibition
of the Society of Petroleum Engineers Journal, Denver,
CO, October, 1977. As discussed in this paper, the
clay water conductivity C~w is a function of the
formation temperature Tf and is given by the
expression:
C~" = 0.000216*(Tf + 504.4)*(Tf-16.7).
Assuming a single exponential w model, as
discussed above, and using the water conductivity
expression for shaly formations, Eq. (8) can be
rewritten as follows:
W0 95135514 . PCT/fJ595/08563
~~, :, '. ;. Y a - 2 9 -
219306b
BVW°' ( Cw(1 - Swb/Swt) + ~-'ww Swb/S.~~u = C1' (9)
where Sw, is the total water saturation. The
expression in Eq. (9) is equivalent to the one in
Eq.(2), so once again it is possible to determine
values for the apparent wi and ww exponential factors.
In Eq.-(9) however, all quantities can be determined
directly from the MRr, log measurements.
In particular, if the total water saturation is
assumed to be Sa" = 100$, the value of the full-water
ww exponential parameter can be obtained from Eq. (9)
by noticing that BVW = PHIT, and S~ = 1. All other
quantities are directly determinable from the MRL
measurement so that the ww parameter can be computed
as:
WW = 1Og10 (CT / (Cw + Swb* (Ccw%"w) ) /1og10(PHIT) i (10~
Conversely, if the total water saturation S"" is
assumed to be at irreducible level, BVW = BVIT, as
defined above. The total bulk volume irreducible
water BVIT can be expressed as follows:
BVIT = PHIT * (S;,n~ + S;,m)
where 5;"~, is the irreducible saturation component due
to clay minerals and S;""~, is an irreducible saturation
component due to non-clay factors. The S;"~, factor may
be computed directly from a measurement of the MRL
bound volume irreducible BVI,~ and is equal to:
S;""n = BVIM / PHIT.
Substituting and simplifying the expression gives
the following formula for the wi exponential
parameter:
ww = loglo (err / (~w + Swb~*(~~ ~w)J/1og10(PHIT)I (11)
where Swb, is the irreducible bound water saturation.
The effective exponential parameter w given in
Eq, (5) may now be directly computed from the MRL
WO 95135514 ~ ' PCTIUS95108563
~~E~~~ s'I~ - 30 - 2~93Q66
measurements in accordance with the present invention
and is given by the expression:
w = 0.4 * BVIM/PHIM + 1.65 (12;
g The solutions in Eq. (10), Eq. (11) and Eq. (12)
present a substantial advance over the prior art
because they allow the log analyst to avoid the use of
the current very subjective approaches to determining
the Swb parameter.
Corrections fvr Additional Factors
In the application of the method of the present
invention to MRL measurements, it is important to
recognize that other factors may influence the
accuracy of the proposed model. Two specific cases
are easy to recognize: the presence of gas in the
measurement pore space; and the presence of micropores
associated with ferromagnetic or paramagnetic
materials. For example, it has been observed that in
a gradient magnetic field of the type used in the
above described logging tools the porosity
measurements are sensitive to the diffusion
coefficient D. Accordingly, if some of the pore space
of the formation is gas filled, the tool will not
register it.
Both cases considered above may result in
situations where the MRL tool of the present invention
may underestimate the actual formation porosity and as
a result overestimate the clay bound water content.
3o Two possible approaches are possible in order to
correct this effects. The first approach is to
utilize several clay bound water indicators which are
less sensitive to the presence of gas or ferromagnetic
materials. The second approach utilizes an iterative
Process constraining the values of the computed clay
porosity parameter.
R'O 95/35514 ' ~ PCTIUS95/08563
. ~ ,., > , - 31 - X193066
In accordance with the present invention, when
using the second correction approach the criterion for
applying a correction is expressed as the following
condition:
BVWT(res) >= BVIT(M)
where BVWT(res) is the total bulk volume water as
determined from a resistivity measurement and BVIT(M)
is the total bulk volume irreducible water, as
determined by the MRL tool. This condition recognizes
the fact that the total water volume found in the
formation cannot be less than the total bound water
volume. If the condition is satisfied, the method of
the present invention makes no corrections to the
computed values.
If the condition is not satisfied, three possible
corrections may be considered, dependent on the values
of the apparent water conductivity CW,, and the clay
water conductivity Cue" as defined above.
If CW,, = C~,", in accordance with the method of the
present invention, an error flag is posted indicating
to the log analyst that an independent- external
correction must be made in the value of the RW
parameter in the Archie factor analysis.
If CW" > Cue" an error flag is posted indicating
that an independent correction must be made in the
value of the apparent water conductivity. Finally, if
CWA < C~w, it is assumed that the error is in the
computed value of the Swb parameter, in which case an
iterative correction to the computed value of the clay
bound water volume is initiated.
FIG. 19 illustrates in a block diagram form the
MRL analysis method in accordance with the present
invention which corresponds to the third correction,
as discussed above, and provides the capability to
WO 95/35514 ~ ' PCTIUS95108563
32
D66
compensate for additional factors which influence the
accuracy of the MRL measurements.
In step 100 the values of several internal
parameters are computed and stored in a computer
memory. These internal parameters include the total
porosity of the formation as determined by independent
measurements and the values for the MRL determined
free fluid index, the clay and the free water
1o conductivities, and the temperature T and conductivity
C~ of the formation.
In steps 110 the algorithm checks whether the
total porosity value is less than the porosity PHIM
determined from the MRL measurement, and if this
conditions met, in step 115 assigns the value of the
total porosity equal to the MRL measured porosity
value .
In step 120 are computed the bound water
saturation Swb, the apparent total bulk volume
irreducible water and the bound water saturation limit
in accordance with the present invention. In steps
130 and 135 the computed bound water saturation S",h
parameter value is checked versus its limit value
defined in step 120, and is set equal to Swb,~ if it is
greater. In the following step 140 the clay porosity
is computed from the values of the total porosity and
the bound water saturation.
In step 150, the values of several output
parameters are computed in accordance with the
expressions in Eqs. (SO-12). In steps 160 to 175 the
methods checks whether the variable w exponential
value falls within the range of values defined by the
boundary values wi and ww, and if outside this range
in either direction, assigns a value for w equal to
the corresponding boundary value.
VVO 95135514 ' ~ PCT/US95I08563
:,. ,.., -33-
~w:~:.:v ~, , 2193066
In step 180 are computed the values for the
apparent (BVW") and total (BVWT) conventional bulk
volume water parameters. Method steps 100 - 180
g comprise the MRL analysis where no corrections are
made. In step 190, if the computed clay porosity PHIL
value is smaller than certain threshold, set in a
specific embodiment of the present invention equal to
0.001, control is transferred to step 240, in which
the effective BVW~ is computed. In step 240 the
permeability PERM of the formation may also be
computed in accordance with the formula:
PERMM = 100*(PHIT)~2 * [(PHIT - BVIT)/BVIT]"2.
Method step 200 initiates the correction, as
described above by checking whether the bulk volume
water BVWT is greater than the bulk volume irreducible
water BVIT. If the condition is satisfied, the method
transfers control to step 240. If the condition is
not satisfied, in step 210 BVWT is set equal to the
BVIT parameter, and the clay porosity PHIL is set
equal to PHI~~ = BVIT - BVIM~
In steps 220 and 225 if the clay porosity PHh
computed in step 210 is negative, its value is set
equal to 0, and the BVIT parameter is set equal to the
MRL-computed BVIM value. Finally, in step 230 the
bound water saturation parameter Swb is set equal to
the corrected clay porosity PHIL divided by the total
porosity PHIT and the method returns back to step 150.
The iteration is continued until the condition in step
210 is satisfied. Fdllowing is a definition of all
parameters used in the analysis in FIG. 19 which in
some cases deviate from the notations used in the
' description above.
Parameters used in FIG. 19
INPUT CURVES
WO 95135514 ~ ' PCTIUS95108563
~J 4 is 1. ~f ~ ~ 3 4
219366
Phimd - MRL Porosity (Decimal)
Bvimd - MRL Bulk Volume Irreducible (Decimal)
Phiext - External Total Porosity (Decimal)
T - Formation Temperature (Deg.F)
Rt - True Formation Resistivity (Ohmm)
INPUT PARAMETERS
Ffimd - MRL Free Fluid Index
Ccw - Clay Water Conductivity
Cw - Free water Conductivity
Ct - --True Formation Conductivity
Swia - Apparent Irreducible Water Saturation
Tbvia - Apparent Total Bulk Volume Irreducible
Swblim - Bound Water Saturation Limit
Swbi - Irreducible Bound Water Saturation
Dcww - Dual Water - Water Conductivity Complex
at 100% water saturation Conditions
Dcwi - Dual Water- Water Conductivity Complex
at Irreducible Water Saturation conditions
Cbvwa - Conventional Bulk Volume Water Apparent
OUTPUT CURVES
Tpor - Total Porosity
Swb - Bound Water Saturation
Clpor - Clay Porosity
Bvit - Bulk Volume Irreducible Total
Ww - Variable W - 100% Water Saturation
Conditions
wi - Variable W - Irreducible Water
Saturation Conditions
Wq - Variable W
Cbvwt - Conventional Bulk Volume Water total
Cbvwe - Conventional Bulk Volume Water
Effective
Pmri - MRIAN Permeability
W095/35514 ' ~ PCT/US95108563
- 35 -
2i93D66
Figure 20 illustrates a comparison of the values
for the water bound saturation Swb computed using a
conventional resistivity log method and the hfRT~ method
in accordance with the present invention. The plot
clearly illustrates a good agreement of the computed
parameters in both cases.
Tracks 4 in FIGS 21 and 22 illustrate the
potential of the method of the present invention to
detect the presence of clay, and free fluid space
including hydrocarbons and producible water.
The following paragraphs provide additional
information as well as alternate description of the
present invention which may be useful in clarifying
certain aspects of the inventive concept.
Though the data displayed in track 3 of Figure 18
demonstrates a good correlation between this clay
indicator and conventional indicators, it does not
demonstrate an absolute tie to a quantitative value.
This in fact reflects the limitation of other
conventional approaches as well since they are subject
to an analyst's parameter selection.
INVESTIGATION
Thus, it is necessary to demonstrate that the
result from Equation 6 provides a quantified measure
of clay bound water. It is possible to do this
through use of a CEC model by using conventional
3p porosity and resistivity log data, i.e., when the
total water saturation Swt = 1, the true formation
conductivity Ct is given by
Ct=(Phitm)'(fwf+Swb'(Ccw-Cwf))
(13)
WO 95/35514 . ' PCTIUS9510S563
,.'' ~ i~ ~. ~7 ~ ~ - 3 6
219~d~~
where m is the cementation exponent, and Cwf and Ccw -
are the free and bound water conductivities,
respectively. The clay bound water saturation Swb is
related to CEC per unit pore volume (Qv) according to
Swb = aVQQ," where V is the volume of clay-bound water
per unit charge on the clay and a is a factor that
depends on salinity.
$Y definition, the CEC influence on a resistivity
log is determined by the change in apparent water
resistivity as seen in water bearing shaly sands.
This is demonstrated from solution of Eq. 13 using the
expressions for theoretical clay water conductivity,
the free water conductivity, and a measure of Rt. The
triple-combo log shown in Figure 23, across a Frio
sand from the Texas coastal area, illustrates a shaly
sand that is appropriate for this purpose.
yp The apparent porosity derived from neutron-
density crossplots is often used as a measure of total
porosity. This often gives reasonable results in the
reservoir sandstones but tends to over-call the
porosity as a function of clay content. This can
2g create a dilemma when efforts are made to use any
theoretical CEC model since it is necessary that the
measured resistivity balance with clay content ind the
formation water conductivities using the expression
for the formation factor F in Equation 1.
30 These issues are readily seen in the following
Equation 14 which shows the Archie relationship used
to transform resistivity into apparent water
resistivity, and in Equation 15 where the apparently
bound water fraction is related to the apparent water
35 conductivity and the end point values for all clay ,
bound water or all non-clay water, i.e.;
R'0 95135514 ~ - PCT/U595J08563
n n : ~ ~ i ~ ~~y".
- 37 - 2193066
u, ~, i,a i
Rwa = Rt/F; 14
Swb = (Cwa - Cwf) / (Ccw - Cwf) .
As Equation 14 shows, the resulting Rwa is
to dependent on the porosity (Phit) as well as the
exponent m. In many shaly sand studies it has been
shown that sandstones typically have m = 1.8 and
a = 1. In shales these parameters are not well known,
although some laboratory data suggests m increases
15 with clay content.
The Pickett plots shown in Figures 24A and 24B,
wheredeep resistivity and neutron-density crossplot
porosity are plotted on log-log scales, illustrates
the relationship between porosity and resistivity for
the cleanest sand and the most clay rich shales,
respectively. For reference, the plotted intervals
are also identified on Figures 25A-and 25B, which
illustrate the density-neutron crossplot.
Pickett plots can be used to determine Rw or,
given Rw, to define m assuming a = 1. Figure 14A, the
clean sands, is used to determine Rw = 0.035 ohmm
using the typical value a = 1. Figure 24B, the clay-
rich shales as defined by the density-neutron shaly
sand model, illustrates the apparent m slope needed to
fit the data cluster to the given clay water
conductivity. Since it is likely that the shale at -
this depth contains mostly clay bound water (see the
expression for Ccw above), a Swt = 1.0 line can be
drawn from the Ccw (17 mho/m) point through the upper
W095I35514 ~ ' PCTIUS95/08563
- 3$ - 2193066
-s ~; i, ,
,~ ~t ~ cs g, -~ y
edge of the data cluster. This positioning in the
cluster considers that the free formation water
conductivity is greater than is that associated with
the clay. The slope of this trend line reflects the m
exponent of the Archie porosity-formation factor
relationship; i.e.,
m = log (Rw/Rt) /log (Phi t) 16
to
The observed slope of 2.79 is much higher than
the 1.8 value which is needed in most sands and even
higher than the value of 2.00 often imposed in these
transforms. While m > 1.8 might be expected, m as
high as 2.79 is probably unlikely, especially after
considering that a porosity error is a much more
plausible cause in affecting this slope. This
contention seems even more reasonable when the
neutron-density crossplot porosity of 36 pu is
contrasted to the 23 pu needed for m = 2 to apply in
this clay rich shale group.
Using a total porosity based on the density log
using an assumed matrix density is another approach.
In shaly sands, like those of the Gulf Coast area, a
quartz graindensity of 2.65 g/cc applies well in
sands and shales since the clay mineral grain density
is close to 2.65 and the shales tend to be a binary
mix of these two minerals.
The density porosity method is also favored here
because it more closely accommodates the need to match
porosity to the Ccw. This is shown in Figure 24C, a
Pickett plot of the same clay rich shale group using
density porosity instead of neutron density. The
apparent m slope of 2.0 is consistent with other
W0 95135514 ~ PCT/US95108563
< ; i', - 39 -
~,~;:',: ... ,; ~.,_
~~g3p66
cementation exponent studies and its dependency on
clay content.
This process requires the use of a variable
exponent to accommodate the sands (m = 1.8) and clays
(m = 2) in the effort to utilize the theoretical clay
conductivity parameter Ccw provided by the Dual Water
CEC method where clay water conductivity is simply a
function of formation temperature when Rw is less than
0.16 ohmm, as shown in the definition of the Ccw
parameter above.
The variable w approach proposed in 1992 by
Coates and Howard, where m and the saturation exponent
n are replaced by a single exponent, is useful for
this purpose. By integrating the hypothesis that the
MRL misses clay porosity within the variable w
methodology, a variable exponent is available that
varies as a function of the apparent irreducible water
saturation of the clean matrix. The functional
relationship is shown as Equation 12 above. In this
equation, the final w is held within the boundaries of
the wi and ww values calculated from an estimate of
total bound water that represents irreducible and
water saturated conditions, respectively.
Further Considerations
In practice, it is important to recognize that
other factors can impact the application of this
approach. Two specific cases are easily recognized;
gas in the measurement pore space and micropores
associated with either ferromagnetic or paramagnetic
materials. Both of these represent situations where
the MRL can under-call porosity and result in all
over-call in the clay bound water content as defined
WU 95/35514 ~ ' PCT/US95108563
- 4° - Z 193Qb6
-~C
~~l~i~t; ~ .~
,_
above. Thus, it is necessary, if this MRL, method is
to be systematically applied, that a process be
developed that correctly accommodates these events.
Two approaches are possible: one that utilizes
multiple clay bound water indicators and another that
utilizes an iterative process to correctly constrain
the clay porosity parameter.
The multiple Swb solution uses the MRL bound
water saturation (MSWB) to calibrate the alternate
indicators, and, through use of a weighing process,
such as the Hodges-Lehmann method, a representative
Swb is selected.
The iterative approach, that has been
incorporated into a computer processed interpretation
package that is diagrammed in Figure 19 assumes that
the MSWB is correct and calculates a total bulk volume
ZO of.water through a quadratic solution of the Dual-
Water equation. Recognizing that the total water
volume found should not be less than the total bound
water volume, PhicltMRLBVI, defines a boundary
condition that, when Ccw>Cw, allows a progressive
reduction in clay bound water volume until the two
water volumes balance. When Ccw<Cw, a reduction in
clay bound water reduces the resistivity defined water
volume and the iteration is bypassed. Any reduction
in clay porosity during the iteration is added to the
original MRL porosity to allow presentation of a
gas/microporosity corrected value.
The block diagram in Figure 19 is adaptable to
using the multiple clay bound water method by assuming
that any overcall by MSWB is alleviated by the process
of weighted selection.
R'O 95135514 - PCT1US95/08563
. .. ~'_ ~ - 41 - 2193066
The execution of the MRIAN methodology provides
an apparent conductivity from Equations 1 and 14 based
on the variable w exponent. This is then used in
calculating an apparent Swb from Equation 15.
Comparison of this Swb with that from the original
hypothesis, as seen in Figure 20 where the two Swb
approaches tend to coincide in water bearing
intervals, offers empirical support that MRL porosity
from a 2 ms TE pulse-echo log substantially misses the
clay porosity in these shaly sand conditions.
The interpretation results from the Frio series
(Figure 21) as well as the Gulf of Mexico Eugene
Island area (Figure 22) illustrate the application of
the MRIAN iterative methodology. These represent but
two of the wells interpreted in this manner of the
more than 200 that have actually been done.
Generally, the m results have been good as judged by
production versus prediction. There are, however,
areas where the fluid properties have impacted the
model, especially in heavy oil (< 15 API) and when the
total porosity is affected by lithologic variables or
washed-out borehole. Consequently, additional
25. investigations are underway to better understand these
effects and to investigate in a laboratory the
apparent link between Qv and MRIL porosity.
FIGS. 26 A-B illustrate a Density-Neutron plot
g~ with total porosity balanced to Ccw and total porosity
scaling respectively. FIG. 27 is a Pickett plot of
water example using new total porosity in accordance
with the method of the present invention.
35 Although the present invention has been described
in connection with the preferred embodiment, it is not
R'O 95!35514 ~ PCTYUS95108563
- 2 i 93066
n c:»~' -,-
:~:, ., . , r .:
intended to be limited to the specific form set forth
herein, but is intended to cover such modifications,
alternatives, and equivalents as can be reasonably
included within the spirit and scope of the invention
as defined by the following claims.
15
ao
30