Note: Descriptions are shown in the official language in which they were submitted.
CA 02218281 1997-10-15
RTO 96132883 PCT/US96/04547
-1-
METHOD AND APPARATUS FOR NONINVASIVELY
DETFRn~NING HEMATOCRIT
' S BACKGROUND OF THE INVENTION
Field of the Invention: The present invention relates generally to
determination of the Packed Cell Volume or relative volume percent of
erythrocytes
(red blood corpuscles), also known as the hematocrit, of whole blood, and more
specifically to a method and apparatus for making such determination
noninvasively
through coherent techniques.
State of the Art: Hematocrit is traditionally obtained by acquiring a patient
blood sample from a vein via a syringe, or by use of a capillary tube from a
finger
stick, or puncture. The blood, contained in an elongated vessel, is then
centrifuged
and the height percentage of the column of blood in the vessel which is solid
represents the hematocrit.
More recently, hematocrit has been obtained by the use of elaborate and
expensive cell counting laboratory instruments which are also used to provide
differentiations of white blood cells, platelets, etc. However, as with the
centrifuge
method, the blood must be invasively removed from the patient for analysis.
In the course of routine medical procedures, such as the daily blood work
performed in hospitals, the necessity of obtaining blood samples from patients
and
then centrifuging or otherwise analyzing the drawn blood presents no great
inconvenience, as the volume of samples is large (warranting expensive
automated
equipment) and the time delay in obtaining results from a laboratory is
generally
acceptable. However, in catastrophic situations such as are encountered in the
emergency rooms and shock trauma units, as well as in the course of surgical
procedures wherein blood loss is probable, the hematocrit determination
apparatus
and methodology of the prior art are markedly deficient.
In the foregoing environments, there may be no time to draw blood, and in
fact it may be impossible to identify a vein from which to draw it. Drawing
blood
intermittently during surgical procedures is inconvenient if not impractical,
and
analyzing periodic samples is time and labor intensive. Moreover, hematocrit
may
vary and drop at such an accelerated rate from unobserved blood loss that by
the
CA 02218281 1997-10-15
WO 96!32883 PCT/US96/04547
-2-
time the emergency or surgical personnel are belatedly made aware of a problem
by
laboratory personnel, the patient may be in acute difficulty or even deceased.
It has been proposed to measure hematocrit noninvasively, as noted in
"Noninvasive Measurement of Hematocrit by Electrical Admittance
Plethysmography Technique," TEES Transactions of Biomedical Engineering, Vol.
BME-27, No. 3, March 1980 pp. 156-161. However, the methodology described in
the foregoing article involves submerging an extremity, such as a finger, in
an
electrolyte (NaCI solution) and varying the electrolyte concentration to
compensate
for pulsatile electrical admittance variations by matching the electrolyte
resistivity to
that of the blood in the extremity; the resistivity of the electrolyte is then
determined in a resistivity cell, and converted to a hematocrit value via a
nonlinear
least-squares regression calibration curve generated by matching centrifuged
hematocrit for various erythrocyte concentrations to resistivity data
previously taken
directly from blood resistivity measurements of the same specimens. Aside from
being unwieldy to employ in an emergency or operating room environment, to the
inventors' knowledge the technique as described in the referenced article has
never
been followed up or verified by further research, or employed in practice.
A measurement technique termed "impedance plethysmography," or using
impedance techniques to obtain a waveform, is conceptually rooted in
biomedical
antiquity. Medical literature abounds with vascular studies, respiration
studies and
attempts to determine cardiac output (the actual volume of blood flowing from
the
heart) by impedance techniques. None of these techniques has been proven to
work
particularly well, although there have been attempts at commercial instruments
based on the concept. A variant of impedance plethysmography, however,
electrically models intracellular as well as an extracellular tissue
components and
employs a comparison of measurements of tissue impedance responsive to applied
electrical currents at two frequencies to quantify the intracellular and
extracellular
tissue components. While not directly related to the problem solved by the
present
invention, the electrical tissue model is useful to an understanding thereof.
In recent years, a technique known as pulse oximetry has been employed to
measure blood oxygenation during induction of general anesthesia. While pulse
oximetry does not provide an hematocrit indication, one may consider it
helpful to
an understanding of the method and apparatus of the present invention. Pulse
i~
CA 02218281 1997-10-15
WO 96/32883 PCTIUS96/04547
-3-
oximetry relies upon the fact that the light absorbance of oxygenated
hemoglobin
and that of reduced hemoglobin differ at two wavelengths of light (generally
red and
near infrared) employed in an oximeter, and that the light absorbances at both
frequencies have a pulsatile component which is attributable to the
fluctuating
volume of arterial blood in the patient body portion disposed between the
light
source and the detector of the oximeter. The pulsatile or AC absorbance
response
component attributable to pulsating arterial blood is determined for each
wavelength, as is the baseline or DC component which represents the tissue bed
absorbances, including venous blood, capillary blood, and nonpulsatile
arterial
blood. The AC components are then divided by their respective DC components to
obtain an absorbance that is independent of the incident light intensity, and
the
results divided to produce a ratio which may be empirically related to Sa02,
or
oxygen saturation of the patient's blood. An excellent discussion of pulse
oximetry
may be found in "Pulse Oximetry," by K.K. Tremper et al., Anesthesioloev, Vol.
70, No. 1 (1989) pp. 98-108.
SUMMARY OF THE INVENTION
The present invention provides a method and apparatus for noninvasive
hematocrit determination. In practicing the present invention, impedance of
blood
is measured via application of stimulation and sensor electrodes to a portion
of the
body that contains a vascular compartment of arteries, capillaries, and veins.
For
the sake of convenience, the electrodes are usually applied to a forger. The
stimulation electrodes are driven with an alternating voltage over a range of
frequencies.
In a preferred embodiment of the invention, the sensed voltage signals are
amplified by a high input impedance voltage detector, converted to the digital
domain by an analog-to-digital converter, and then demodulated via mixers into
two
complex waveforms, one representative of the stimulation current and another
representative of the sense voltage at a selected frequency. The waveforms are
processed by a microcomputer to determine the tissue impedance scan indicia.
Then, the blood volume is altered and another tissue impedance scan is made.
In a
preferred embodiment, a pressure cuff is used to alter the blood volume. Two
tissue scans, one at one blood volume and one at another blood volume, are
used to
CA 02218281 1997-10-16
m ~.rttu,~ ~ a ~y~ ~r i~~o
determine a blood impedance scan. The impedance of the whole blood is
separated
from the total impedance through a parallel model. The whole blood impedance
indicia is correlated to hematocrit by recognizing patterns in the blood
impedance
scan. It is also possible and contemplated as part of the invention to
determine
hematocrit using the preferred embodiment of the invention by analysing the
phase
shift pattern with a neural network.
The invention for which protection is sought is defrned in the claims as filed
or later added or amended. If a limitation that is described or :.hown irt
the:
specification or drawings is not included zr1 a claixrt, the claim should not
be
interpreted to include the limitation.
l3ItIHF' bBSC'.RIPTION (JF Tf~i~ ~k..AWINC~S '
The present invention will be more fully understood by one of ordinary skill
in the art through a review of the following detailed description of the
preferred
embodiments in conjunction with the accornpanyiutg drawings, wherein
FIG. lA comprises a circuit schematic for a first-order electrical model of
whole blood in a large vessel;
FIG. LB comprises a schematic representation of fluid and membrane cells in
a Large vessel corresponding to the eh:ctrical model of kZG. lA;
~ FIG. 2A comprises a circuit schematic for a first-order electrical model of
whole blood in a small vessel;
FTG. 2B comprises a schematic representation csf fluid auui membrane culls in
a small vessel corresponding to the electrical model of FIG. 2A;
FTG. 3A shows a representation of the total impedance in a limb at a low
blood volume;
FIG. 3B shows a representation of the total impedance in a limb at high
blood volume;
F~TG. 4 corttpr-ises a block diagram schematic of a preferred embodiment of a
system of the present invention;
FIG. 5A comprises a bottom plan view of a limb to which electrodes a:e
applied;
FIG. 5B comprises a side view of the limb of FIG. 5A;
AMENDED St~EET
CA 02218281 1997-10-15
WO 96/32883 PCT/US96/04547
_5_
FIG. 6 comprises a more detailed block diagram schematic of the electrode
pod of the system of FIG. 4;
FIG. 7 comprises a schematic representation of a wireless version of the
signal generator and demodulator and electrode pod of FIG. 4;
FIG. 8 comprises a more detailed block diagram schematic of the signal
generator and demodulator of FIG. 4;
FIG. 9 comprises a more detailed block diagram schematic of the air pump,
solenoids, and pressure cuff of FIG. 4;
FIG. 10 comprises a more detailed schematic of the frequency generator of
FIG. 4;
FIG. 11 comprises a combined diagram and schematic of a two-frequency
embodiment of the present invention, with electrodes applied to a patient
extremity;
FIG. 12 comprises a schematic of an embodiment of a constant current
source as employed in the embodiment of FIG. 11;
FIG. 13 comprises a schematic of an embodiment of an AM detector as
employed in the embodiment of FIG. 11;
FIG. 14 comprises a schematic of an embodiment of an A/D converter as
employed in the embodiment of FIG. 11;
FIG. 15 comprises a graphic, not-to-scale depiction of an analog voltage
signal representative of those measured in practicing the present invention
showing
the relatively small pulsatile component of the signal above the signal
baseline; and
FIG. 16 comprises a circuit schematic for a first-order electrical
approximation of the impedance of a whole blood in a pulsatile vascular
compartment in combination with that of the surrounding tissue in which the
compartment is located.
DETAILED DESCRIPTION OF THE ILLUSTRATED EMBODIMENTS
A. Multi-Frequency Embodiments
1. Basic Electrical Models
FIG. 1A is an electrical circuit model that represents an approximation of the
behavior of whole blood in a large vessel when subjected to an alternating
electrical
current I. Resistor 10 in circuit path 12 represents the resistance R$E of the
extracellular or plasma component. A capacitor 16 and resistor 18 in a
parallel
CA 02218281 1997-10-15
R'O 96/32883 PC'T/US96/04547
-6-
circuit path 14 represent the capacitance CB~ of the cell membrance and the
resistance RBI of intercellular fluid of the erythrocyte or red blood
corpuscles. At
low frequencies (such as 50 kHz), the impedance of whole blood (fig= that of
both ,
paths 12 and 14) is attributable primarily to the extracellular blood
component
circuit path 12, while at higher frequencies (for example, 1 MHz), the
capacitive
nature of the cell membrane of the red blood corpuscles results in a more
significant
impedance contribution from circuit path 14, reducing the magnitude of the
whole
blood impedance.
FIG. 1B illustrates a large vessel 20 containing many red blood cells 22 in
plasma 24. As can be seen, there is a current path through plasma 24, even at
low
frequencies.
FIG. 2A is an electrical circuit model that represents an approximation of the
behavior of whole blood in a small vessel when subjected to an alternating
electrical
current I. FIG. 2B illustrates a small vessel 26 in which cells 22 are about
as wide
as vessel 26 preventing a plasma path between cells 22 and the wall of vessel
26.
In such a case, the path for current I is through a capacitance CB~, in series
with
resistances RBI and RBE. Accordingly, the impedance of and the amount of
current
flowing through vessel 26 changes as the frequency of current I increases.
While
the ratio of small vessels to large vessels is not known, it is believed that
the effect
of small vessels may be significant in the overall limb impedance. (There are
some
vessels that are slightly or somewhat larger than a small vessel and allow a
small
path around the cells.)
It is understood that in the circuits of FIGS. 1A and 2A, the maximum phase
shift in impedance occurs when the frequency of current I is f = 1/(R5 CB~
2~r),
where RS is RBI in the case of large vessels and RS is RBI + RBE in the case
of small
vessels. It has been found that the maximum phase shift of blood occurs at
about
1.6 MHz in large vessels. As described below, that maximum phase shift is used
in
determining the hematocrit. The large vessel model predominates in the blood
impedance measurements. However, it is believed that the contribution of small
vessels should not be ignored and that the maximum phase shift of the small
vessels
will occur at below 1.6 MHz. It is believed that the effect of the small
vessels is
reflected in the values throughout the spectrum.
CA 02218281 1997-10-15
WO 96/32883 PCTJUS96/04547
_'7_
However, when current is passed through a Limb, such as is described
below, the current passes not only through blood, but also through tissue,
bone, etc.
The impedance of the blood may be separated from the total limb impedance
through a procedure described below. In brief, in FIG. 3A, the impedance ZU
represents the total lamb impedance when blood flow through the limb is
unrestricted. In FIG. 3B, the blood flow through the limb is restricted and ZB
represents the impedance of the additional blood accumulated as a result of
the
restriction. The total limb impedance during the restricted state is ZR. The
total
impedance ZU and ZR may be calculated, and ZB = (ZU x Z~/(ZU - Z~.
Therefore, the contribution of portions of the limb other than the blood does
not
have to determined.
2. stem Overview
Referring to FIG. 4, a hematocrit measurement system 30 includes a signal
generator and demodulator (SGD) 34 that sends a signal to an electrode pod 36
through conductor 38 and receives measured signals from electrode pod 36
through
conductor 40. SGD 34 provides to a personal computer (PC) 42 through
conductors
32 and an RS-232 port, signals indicative of the current passing through the
limb of
a patient and the resulting voltage. The voltage and current may be measured
for
various frequencies over, for example, a range from 10 kHz to 10 MHz.
The impedance from the blood alone is isolated from the total limb
impedance from the blood, muscle, bone, etc. by measuring the limb impedance
of
different blood volumes. As described below, an air pump, solenoid(s), and
pressure cuff 28 may be used to cause a change in blood volume in the limb.
PC 42 determines the hematocrit. The hematocrit may be determined from
the signals from SGD 34 alone, or in combination with various other data
regarding
the particular patient such as age, sex, weight, temperature, illnesses, etc.
, or
regarding patients in general. In this regard, as described below, a neural
network
may be useful. A neural network may be executed in PC 42 or in a separate
computer 52, shown in dashed lines.
3. Electrode Pod and Electrodes
Referring to FIGS. 4 and SA and SB, electrode pod 36 provides an
alternating electrical current signal to a limb 44 (such as a forger having a
forger
nail 46) of a patient through electrodes 48A and 48B. (Fig. 5A shows the
underside
CA 02218281 1997-10-16
ta-~~~J ~. :: mu v I~~D
g_
of the two fingers next to the thumb of a left hand.) The resulting voltage
drop
across Iimb 44 is measured through electrodes SOA and 50B, The voltage between
electrodes 48A and 48B may be about three volts. Electrodes =l$A, 4f3B, 50A,
and
50B may be standard, commercially ;available electrodes.
Electrodes 4$A, 4$B, 50A, and 50B may be conveniently held in place
through a piece of tape 54 that covers both the electrodes and a portion of
limb 44.
however, tape 54 preferably does not restrict blood flow. Tape 54 may extend
II2
to 314 around the circumference of limb 44. In addition to holding the
electrodc:.s in
place, tape ~4 stiffens limb 44 which makes the measurement procedures more
IO controlled. A splint or nnylar may also be used.
Referring to FTG. 6, elecarode pod 36 includes a 50 ohrn termination buffer
60 that receives a sine signal having frequency c,r on conductor 38 from SGD
34. A
sense resistor 64 is connected in series between butter 60 and a conductor
66A, to
which electrode 48A is connected.
Electrodes 48A, 48B, SOA, and SOB are connected to electrode pod 36
through conductors 66A, 66B, 70A, and 70B, which are preferably as short as
possible. Alternatively, wireless eommurucation could be used as shown in FIG.
7,
which includes transmitters '16A, 768, and 76(_'., and receivers 7$A, 78B, and
7RC.
Wireless communication may be particularly useful in an operating room
environntem.
Referring again to FIG. 6, an instmmentatian amplifier fib provides to
conductor 72, a signal A, sin(;~t ~- B;} indicative of the voltage drop across
resistor 64, where "A," is the amplitude, and 81 is a phase difference with
respect to
an original signal sinmt, described below. Instrumentation amplifier 6S
provides a
high input impedance, and rejects the common mode voltage at conductor 66A
wlu'tle amplifying the voltage drop across resistor 64. Tnstn3mentation
<implitier 68
may comprise three operational amplifiers in a well known configuration.
An instrumentation arnplitier 74 provides to a conductor 78, a signal
Ai sin{cat + Qz) that is indicative of the voltage between electrodCS 50A and
SUB,
where "A~" is the amplitude, and 0= r; a phase with respect co the or-igonal
Signal,
sinc~t. ~I'tm difference in .phase between fl, and &2 is caused try ttie
elccirical
capacitance in limb 44 between electrodes 48A and SOB, and differences in the
speed and phase response of the instmmentation amplifiers ti8 anii ~~t.
A~~Er;~EL~ SHEET
CA 02218281 1997-10-16
fr-~r,,liJ~ ~. v I~U v 1J~0
_g_
Accordingly, instrumentation amplifrcrs 68 and 74 should be chosen and
constructed
to mirrimi.ze differences in their phase responses. The differencrs irr speed
and
phase response of amplifiers 68 and 74 is calibrated out of the equipment
using a
dummy load. Thereafter, PC 42 stores the calibration information and subtracts
out
any differences.
Instrumentation amplifier 74 rejects the common mode voltage between
conductors 66B and '70B and amplifies the differential voltage between
conductors
70A and 708. Instrumentation amplifier 'l4 may comprise three operational
amplifiers in a well known co~guration.
An IZF switch 80 passes either the signal on eonductar 72 ox the signal on
conductor 78 to conductor 40, under the control of a signal on c:onductar 84,
1.2F'
switch 80 may twitch at a rate of 110 ( =2 X 55} times per second.
4. Signal Generator and Demodulator SGD)
Referring to 1~IG. b, SCiD 34 produces the signal on conductor i8 and
demodulates and filters the aignals on conductor 40. SC7D 34 may include a
microprocessor 94 with an embedded EPRI'~M, suc#r as an H~6805.
Microprocessor 94 provides control signals to the various components of SGD 34
to
RF switch $0 through conductor 84, <rnd to solenoids of air pump, solenoids,
and
pressure Cuff 28, through corrducac>rs SSA, S8B, and 8$(~, as described in
connection with FxG. 9, below. Microprocessor 94 also communicates with PC 42
through conductors 32.
A frequency generator 100 produces a digital sine signal I~GS~,, shown in
equation (1} below, to conductors 96:
FGSQ., = sinwt ( I > >
where the amplitude is assumed to be unitary. From conductors 9fi, the signal
5inwt
is provided to mixer and filter 104, and to a DAC 110. The analog sine signal
from DAC 110 is provided through a buffer 112 to conductor 38. ~1'lre
frequency of
p'Gs~., is controlled by a frequc.ney contzol word provided by PCB' ~l2 tca
Frequency
generator 100.
F>~etluency generator 100 also laroduces ii digital cosine sitrot F~t::T~,_,,s
shown
in equation (2) below, to conductors 98:
FG~-os = C05c..~t (2),
. ., ~. . ~ ..
P, . ,. .. . .
CA 02218281 1997-10-15
WO 96/32883 PC'T/US96/04547
-10-
where the amplitude is assumed to be unitary. Of course, coswt is 90 degrees
out
of phase with sinwt. From conductors 98, the signal coswt is provided to mixer
and
filter 106.
The signals from electrode pod 36 on conductor 40 are received by a low
pass filter 116 through a buffer 118. Low pass filter 116 removes harmonic .
frequency components or abasing. The 22 MHz value was chosen to allow tissue
impedance measurements with a sinwt at as high as 20 MHz. However, the analog
electronics may have difficulties maintaining the required phase tolerance
above
about 10 MHz. With the 10 MHz upper limit, low pass filter 116 may have a
lower cut off frequency. The filtered signals from low pass filter 116 are
converted
to digital signals through ADC 120, from which they are passed to mixer and
filters
104 and 106.
DAC 110, ADC 120, and frequency generator 100 may be clocked at
60 MHz. However, if the maximum frequency of sinwt generated by frequency
generator 100 is 10 MHz, then DAC 110, ADC 120, and frequency generator 100
may be clocked at, for example, 30 MHz.
Measured current indicating signals M~ are provided by ADC 120 to
conductors 90. Signals M~ originate from conductor 72 in FIG. 6 and are
processed through 1tF switch 80, buffer 118, low pass filter 116, and ADC 120.
Signals M~ are shown in equation (3), below:
M~ = G A1 sin(wt + 61 + ~) (3)
where A1 and 91 are the amplitude and phase of the signal at conductor 72, and
G
and ~ are the gain and phase shift caused by buffer 118, low pass filter 116,
and
ADC 120.
Measured voltage indicating signals M~ are also provided by ADC 120 to
conductors 90. Signals M~ originate from conductor 78 in FIG. 6 and are
processed through 1RF switch 80, buffer 118, low pass filter 116, and ADC 120.
Signals M~ are shown in equation (4), below: '
M~ = G AZ sin(wt + 6z + ø) (4)
where AZ and 62 are the amplitude and phase of the signal at conductor 78, and
G
and ~ are the gain and phase shift caused by buffer 118, low pass filter 116,
and
ADC 120. Of course, signals M~ and M~ are merely examples of current
_
CA 02218281 1997-10-15
WO 96132883 PCT/US96/04547
-11-
indicating signals and voltage indicating signals, and other circuitry than is
illustrated may be used to produce suitable current and voltage indicating
signals.
In mixer and filter 104, a multiplier 124 multiplies sinwt on conductors 96
with the output of ADC 120. When RF switch 80 passes the signal on conductor
. 5 72, the output of multiplier 124 is the product P~ (current inphase),
shown in
equation (5), below:
P~ = G A1 sin(wt + 91 + ~) X sinwt
_ ((G Al/2) cos (81 + ~)) - ((G Al/2) sin(2wt + 91 + ~)) (5),
where G, Al, 81, and ~ are defined in connection with equation (3). Mixer and
filter 104 is illustrative of mixer and filter 106.
A 60 Hz digital lowpass filter 128 filters out the ((G A,/2) sin(2wt + 8, +
ø)) component as well as various noise, leaving only the DC component, ((G
Al/2)
cos (B1 + ~)). The signal ((G Ai/2) cos (91 + ~)) is applied to conductors 134
and
is referred to as CI, where "C" represents the current between electrodes 48A
and
48B, and "I" stands for "in phase." Digital lowpass filter 128 may be
constructed
of multipliers and adders performing convolution in a well known manner.
When RF switch 80 passes the signal on conductor 78, the output of
multiplier 124 is the product PEI (voltage inphase), shown in equation (6),
below:
PvI = G A2 sin(wt + 62 + ~) X sinwt
= ((G AZ/2) cos (82 + ~)) - ((G A2/2) sin(2wt + 92 + ~)) (6),
where G, A2, 82, and ~ are defined in connection with equation (4).
60 Hz digital lowpass filter 128 filters out the ((G A2/2) sin(2wt + 82 + ~))
component as well as various noise, leaving only the DC component, ((G A2/2)
cos
(62 + ~)). The signal ((G AZ/2) cos (62 + ~)) is applied to conductors 134 and
is
referred to as VI, where "V" represents the current between electrodes SOA and
SOB, and "I" stands for "in phase."
Mixing an original and modified signal to obtain amplitude and phase
information is a "coherent" technique.
In mixer and filter 106, a multiplier (not shown) multiplies coswt on
conductors 98 with the output of ADC 120. When RF switch 80 passes the signal
on conductor 72, the output of multiplier 124 is the product P~Q (current
quadrature), shown in equation (7), below:
CA 02218281 1997-10-15
WO 96/32883 PCT/US96/04547
-12-
PcQ = G A1 sin(wt + 61 + ~) X coswt
_ ((G Al/2) sin (91 + ~)) + ((G Al/2) sin(2wt + 91 + c~))
where G, Al, 61, and ~ are defined in connection with equation (3). Note that
the
term quadrature derives from the cosine signal being 90 degrees out of phase
with
the sine signal. .
A 60 Hz digital lowpass filter 128 filters out the ((G Al/2) sin(2wt + 61 +
~)) component as well as various noise, leaving only the DC component, ((G
Al/2)
sin (91 + ø)). The signal ((G A,/2) sin (6, + ~)) is applied to conductors 136
and
is referred to as CQ, where "C" represents the current between electrodes 48A
and
48B, and "Q" stands for "quadrature. "
When RF switch 80 passes the signal on conductor 78, the output of
multiplier 124 is the product P~Q (voltage quadrature), shown in equation (8),
below:
P~Q = G AZ sin(wt + BZ + ~) X sinwt
= ((G A2/2) cos (62 + ~)) - ((G A2/2) sin(2wt + 82 + ~)) (g),
where G, A2, 9z, and ~ are defined in connection with equation (4).
60 Hz digital lowpass filter 128 filters out the ((G AZ/2) sin(2wt + 82 + ~))
component as well as various noise, leaving only the DC component, ((G .A2/2)
sin
(92 + ~)). The signal ((G Az/2) sin (82 + ~)) is applied to conductors 136 and
is
referred to as VQ, where "V" represents the voltage between electrodes SOA and
SOB, and "Q" stands for "quadrature."
Signals CI and CQ provide information regarding the amplitude and phase of
the current between electrodes 48A and 48B. Signals VI and VQ provide
information regarding the amplitude and phase of the voltage electrodes SOA
and
SOB. Signals V and C are complex i.e., they have inphase components VI and CI
and quadrature components VQ and CQ).
The inphase and quadrature impedance waveforms VI, VQ, CI, and CQ are
sent to a computer, such as PC 42 where the complex impedance may be
calculated -
at a 55 sample/second rate.
5. Computations in the PC
The signals VI, VQ, CI, and CQ may be analyzed as follows.
The magnitude CM,,a of the current components is determined through
equation (9), below:
CA 02218281 1997-10-16
~:-~;-:tij1 G ,l E~~U Y I~~O
-13-
CM,,,c = (Ci2 + CQ')'" (g)~
where C, and CQ are the signals on conductors 134 :u~d 136 from mixer and
filters
104 and 106.
The phase C~ of the current components is determined through equation
(I0), below:
C~ = tan-1 (CQ/C~ (10).
T'he magnitude V"~,,,~ of the voltage components is determined through
equation (11), below:
VHrwo =~ (Vc'- -+- VQ2)''' (11}~
where V, and V~ are the signals on conductors 134 and 13fi from mixer and
filters
104 and 106.
The phase V,~ of the voltage components is determined through equation
(12), below:
V~ = t~-1 ('yQ/~t~ (12).
The impedance Z is the ratio of complex numbers V and C.
The magnitude Z,,.u,G component of the impedance is determined thraugh
equation (13), below:
LMno .~' VM,,~,lCrt~,a = GA,IGA~ = AZ/Al (13),
where Vi"~,~, and Coo are determined according to eqi~atians (11) and (9).
The phase component of the i~mpedaunce is determined though equation (14),
below:
Zo = V~ - Co = (0~ + ~) -- (8, + c~) =_ (B~ - B,) (14),
where V~ and C~ are determined according to equations (12) and (10).
The impedance from the blood atone is isolated from the total impedance
from the blood, tissue, bone, etc. This isolation may he performed as follows.
At
each frequency in a scan, the limb i.rrEpedance is determused by calculating
V" VQ,
C~, and C,~ when blood flow through Iimb 44 is unrestricted and, therefore,
the limb
has a normal or unrestricted blood volume. Then, another scan is performed
over
the sarr~e frequencies when blood flow through limb :14 is restricted and,
therefore,
the Limb has a restricted blood volume (which r»ay be higher ~~r lower than
the
unrestricted blood volume). :~Zethods of restriction are ~3iscussed below.
FIGS. 3A and 3$ illustrate the situation in which restriction causes an
increase in blood volume. The total limb impedance at lower blood volume when
CA 02218281 1997-10-16
J1-Cli/[,f~ G U IWU 11 1~~0
-14-
Lhe limb is unrestricted is ZU, illustrated in FIG. 3A. The total limb
impedance at
higher blood volume when the limb is restricted is ZR, illu~~mted in FIG. 3B.
Impedance Z~ is the equivalent to impedance Zv 1n parallel with the impedance
ZB,
where Z~ is the blood present at higher volume that is not present at tower
volume.
(This model assumes that the extra blood has the same hematocrit as all other
blood
passing through the limb.) Impedance Z~ is calculated through equation {15),
below
zR = (ZB x Z~)!(ZB + Zu) (I5}.
Both ZR and ZU can be measured and from them Z~ can. be computed. Solving for
impedance Zs in equation (15) yields equation (1b), below:
ZB = (ZU x Z~I(ZU - Z~ (16),
for the case irr which restriction causes an incri;~ase in blood volume.
In the case ire which restritction causes a decrease in blood volume, ZU is
equivalent to ZR in parallel with Z~, where Z~ is tire blood present at higher
volume
that is nvt present at lower volume. Then, impedance Zk is calculatul through
equation (17), below:
ZU - (Z$ x Z,~!(Z~ + Z~ (17).
Both ZR and Z" can be measured and from them Z,~ can be computed. Solving for
ixrrpedance ZB in equation (17) yields equation (18), below:
Za = (Lu x G~I(Zx ~ zu) {18)~
'r for the case in which restriction causes a decrease in blood volurne.
Although blood impedance ZH includes both a nragr>itude and phase, the
phase appears to be the stronger indicator of hematocrit.. However, both phase
and
magnitude of ZB may be used izt pattern analysis in a neural network.
'1<'tte processes of determining ZB are repeated for various frequencies over
a
range from about 10 kHz to about IU lull. 'Various steps may be used. In the
current embodiment, there may be from 3 steps per octave to 10 steps per
octave,
where octaves are 10 l~Hz, z0 kHz, :;4 kHz, 8a ldlz, 160 kliz, e.tc_
There are advantages and disadvantages in having a laxge versus a small
nr!tnber of steps. A large number of steps may be used to average crut
arterial
pulsation noise, but takes more time and, therefore, there is a greater risk
that the
blood volume will undesirably and unpredictably ctlange over tinge with a
longer
measurement.
CA 02218281 1997-10-15
R'O 96/32883 PCT/US96104547
-15-
It has been found by the inventors that the phase change increases (as a
negative number) from about 10 kHz to in the region of 1.6 MHz and then begins
to decrease (although there may be an inflection point at well below 1.6 MHz).
(de
Vries, P.M.J.M., et al., "Implications of the dielectrical behavior of human
blood
for continuous on-line measurement of hematocrit", Med. Biol. Fng. & Comput.
31, 445-448 (1993) notes a 1.6 MHz maximum phase.) However, it is expected
that the maximum phase change will vary depending on various factors.
Therefore,
a neural network approach is proposed.
6. Preferred Procedures
The following procedures may be used. A "scan" refers to the process of
applying signals of various frequencies in steps between a lower and upper
frequency limit to electrode 48A. As described above, this creates a current
between electrodes 48A and 48B, and a voltage between electrodes SOA and SOB.
It takes about one 55th of a second to gather VI, VQ, CI, and CQ signals at
each
frequency. Digital filter 128 requires about 9 milliseconds to achieve the
desired 60
Hz bandwidth. Accordingly, digital filter 128 processes P~ for 9 milliseconds
and
then processes P~I for 9 milliseconds at one frequency. The processes is then
repeated for 9 milliseconds for P~ and then 9 milliseconds for P~ at another
frequency. The corresponding digital filter in mixer and filter 106 similarly
processes P~Q and PVQ.
In a preferred embodiment, the software is written so that the lower and
upper frequency limits are 10 kHz and 10 MHz, and the number of steps between
the lower and upper limits are between 11 and 101 frequencies. If 101
frequencies
are chosen, it takes about 1.8 seconds (= 101/55) to complete a scan.
A "repetition" refers to the number of "scans" that are performed in quick
succession before changing the blood volume. In a preferred embodiment, the
software is written so there may be between 1 and 10 repetitions. The reason
to
perform multiple repetitions is as follows. Arterial pulsations cause a small
alternating fluctuation in blood volume. The pulsations can affect the phase.
If
multiple repetitions are made, the variations in phase caused by arterial
pulsations
can be averaged and the effect reduced.
A "measurement" refers to the completion of a specified number of scan
repetitions at a particular blood volume. In a preferred embodiment, the
software is
CA 02218281 1997-10-16
-~ ~. .~.~ ~ v m a v 15 ~ a
_1h_
written to make any number of measurements up to 25. For ex,nnple, a first
measurement is at unrestricted blood volume. A second measurement is at
restricted blood volume. A third measurement may be at the unrestricted blood
volume or some other blood volume, and so forth. Depending on the restrictive
pressure (such as from a cuff) and the vasculax circulation, it can take
between
about IO seconds to 45 seconds for blood volume of limb 44. to reach a new
equilibrium after the restrictive pressure is changed.
It is desnxable to not make more measurements than is necessary in order to
reduce the test tune. A greater number of scans per measurement ovens out
pulsatile variations. It has been found that nn.easurements yield different
results,
even taken at near the same time. Therefore, enough measurements should be
made
to ensure adequate results. Multiple cycles may be needed to produce
satisfactory
results. If the first few measurements give results with a smau standard
deviation,
it may not be necessary to Punish all the measurements.
'There are various tradeoffs in the choice of values. For example, a largC
change i~t blood volume is desiu-able to produce a High signal to noise ratio
with
respect to arterial pulsations. However, a large blood volmxte change takes a
longer
time azzd causes more capillary beds to open up to accommc~datu additional
blood
volume.
Of course, the various values and Limits for frequencies, steps, scans,
repetitions, and cycles can be changed through altering the software.
7. A Neural Netwgrk Aa rp oach
A neural network may analyze very complex noisy data and find patterns (or
combinations of data) that can be used to determine underlying parameters.
These
patterns are usually trot apparent to human observers. xn a statistical sense,
neural
networks are capable of performing noes-linear non-parametcic :egression.
Finding neural network solutions to complex data analysis problun~s may be
as much art as science. There are many different neural network paradigms, and
each of these paradigms use the specification of a number o#' critical
parameters.
These choices require a certain amount of experieni;e, trial-and-error, etc.
The
~t r, ~AOEO SHEEN
CA 02218281 1997-10-16
i 7 L. d''J if ~ " - ~ . .-. . ~ .r .. ..
-17-
search for a systematic neural network design approach is a very active area
of
research within the field of Artificial Intelligence.
'X'he particular paradigms of interest in the present invention are believed
to
be those that produce continuous-valued outputs and that undergo supervised
S training. 'I<'his is a technique of shaping the neural network in which the
network is
repeatedly exposed to both the data and the right answer. 'This allows the net
to
structure itself internally so that it extr~dcts the features in Lhe data that
we have
identi~f-ted as being important to the present invention.
Clinical ~.iata collectian could be gathered from severral runs on each
patient
or subject. The runs could be performed with certain varying c onditions (such
as
different height of the limb under test, applied heat to the limb, etc. j.
'Thereby,
several different environments could be produced with different patterns of
data for
the same hetnatocrit. In addition, blood could be drawn to accurately
determine the
actual hematocrit using the '"gold standard" technique of centriLiying
capillary tubes
containing the subject's whale blood.
By collecting this diverse data an each subject and having a sufficient
number of subjects, the neural nets will be trained to determine the
underlying
parameter of hematocrit.
Neural network S2 rnay be in PG 4:~ ou an adjacent 1;'C or other computer.
Accordingly, in FIG. 4, neural network 52 is shown In dashed lines.
The following parameters could be considered by the neural network. 'fVith
respect to the impedance waveforrns, the neural network could consider
parameters
including frequency, magnitude, phase, and derivations thereof. '4~ith respect
to the
patient or subject, the neural network could consider parameters includiry the
patient's age, weight, sex, temperature, illness, heat applied to the limb,
blood
pressure, and arm elevation and position. Of course, it is not necessary that
the
mural network consider each of these parameters.
Of course, the neural network would also consider the hematoc:rit
measurements from centrifuLing capillary tubes corresponding to the patient
from
which the other factor's °.Vere obtained.
The neural network is used irb two manners. pirst, it is ~~s~.~d to derive a
group of patterns and/or other data from a large amount of the
l3ar°~uneiers regarding
patients and waveforms. Second, once the patterns and/or other data are
derived,
;~r,.,', v~.~~~~ll ~t-~r~~
CA 02218281 1997-10-16
S ~; U ~s 0'~! ~ 996
_z8_
the neural network is used i.n determining the hematocrit of a particular
patient
(who, for example, may be on an operating table) by comparing patient artd
waveform data of the particular patient with the previously derived patterns
andlor
,. other data.
At present, it is believed that the neural network is able to process out the
small vessel effect and produce the hematocrit value due to blood contained in
large
vessels.
As used herein, the teem "patient" includes both those persons from whom
the data is originally obtain to create the group of patterns or data, and
those
l0 persons whose hematocrit is cater deterTUirred from tire group of patterns
or data.
Look up tables may be used, ~rlthough it is expected that many of the
patterns (such as equations) rnay be too complicated to make look-ug tables
practic~rl
for most purposes.
8. Air purxtp, solenoid(sl, and_pressure cuff 28
IS There are various methods of changing the blood volume. For example, if
limb 44 is a finger, blood volume may be changed through venous restriction
about
the upper arm of the patient, or arterial occlusion of the wrist of the
patient.
In the case of venous restriction, it is preferred that the cuff create less
than
diastolic pressure so that arteries carr pump blood in, Bert blood does not
flow out
_ 20 under the cuff until pressure in limb 44. eduals the cuff pressure. Under
arterial .
'~ occlusion, arterial blood is blocked from entering Limb 44 and hood drains
out of
limb 44 through the veins to create a lower blood volume. it has been found
that
the phase change detected dur7ng venous restricaion may be different from that
detected during arterial occlusion.
25 It is believed to be easier to implement venous restriction with a blood
pressure cuff than it is to perform arterial occlusion. To obtain restriction
through
occlusion, the ulna and radial arteries should be occluded, which rnay be
difficult
Also, about 10 ~ of the population has a medial ax'terial which shouIci also
be
occluded. However, it is believed that arterial occlusion drains the large
vessels
30 without effecting thr: capillaries to a great extent while venous rrstric-
tion has a
greater tendency to open up new capillary bends andlor modify tine ~eornetry
of the
vascular space.
CA 02218281 1997-10-16
i i f~,l"~/ V 1','~ Lr V ~'1 V Y W J v.I V
-19-
Referring to FIG. 9, air pump, solenoid(s), and pressure cuff 28 may work
as follows. An air pump 152 provides increased air pressure to a tube I54.
When
it is time for a pressure cuff 15b to increase irt pressure, microprocessor 94
activates a solenoid 160 which allows the increased pressure in tube 154 to
flow to
tuba 162. Microprocessor 94 is informed of the pressure in tube 162 through
pressure transducer 164. When it is time to decrease the pressure in cuff 156,
microprocessor 94 activates solenoid 168 through which tube 1 b2 is connected
to an
exhaust. Air pump 152 may be turned on under separate switch or under the
control of micro-processor 94.
The volume change should be maximized by adjusting the tilt and height of
the patient's arm.
It is believed that limb movement may signifzeantly change the impedance.
9. Additional Information
Frequency generator 1U0 may be constructed according tU a well known
practice shown in F1G. 10. Referring to 1~'YG. 10, a lfi-bit frequency word FW
is
received on conductor 11?. by an adder 180 that produces a phase word Pw in
response to the FW. The desired sinusoidal freduency = FW X clock frequencyl
2~s. Depending on the maximum desired sinusoidal frequency, the clock
frequency
may be, for example, 30 MHz or 60 MHz. The phase word PW is received by a
sinelcosine Look-up table PROM 182 that produces sine and cosine signals. The
sine signal may be 127.5 x sin (PW x 2u)12048 and the cosine signal may be
127.5
cos (PW x 2-112048. Qf course, the preceding is merely an example and various
other well known techniques could bi: used.
Preferably, current is injected into limb 44 brtwc°.~~n electrodes 4$A
and 4238,
and voltage is measured b~aw~n elecarodes SUA and SOI3. Alte~r~atively and
less
desirably, current could be injected between electrodes SOA and 50I3, and
voltage
trteasured between electrodes 48A and 48I3. In the case of the alternative
less
desirable arrangement, preferably, bath the current injected by electrode 50A
and
the current received by electrode SOB would be measurr:d to account for any
current
that may pass to another part of the body. Also, in the case of the
alternative less
desirable arrangement, it may also be desirable to bring electrodes SOB and
48B
closer to electrodes 48A and 50A, and to make the electrodes narrower.
Current could be created through magnetic fields rather than ek:etrodes.
At~i~ N9ED SHEEN
CA 02218281 1997-10-16
n°CH/U~ ~ ~ i~Ull I~~b
-20-
Preferably, the out-o~ phase signals on conductors 98 from signal generator
100 are cosine signals, which are 90 degrees (or 270 degrees) out of phase
with the
sine signal on conductors 96 (sometimes called a quadrature signal).
Alternatively,
the out-of-phase signals could have some other relationship than 90 degrees
out of
phase with respect to sine signals on conductors 96. In that case, it may be
necessary and/or desirable to have three or more signals rather than only two
signals.
In the illustrated embodiment of FIGS. 4 and 8, the functions of frequency
generator 1U0, Iow pass filters I16 and 128, and mixer aced filters 1U4 and
1U6 are
performed in hardware (including programmed dedicated hardware with, for
example, adders, multipliers, and gate arrays) as opposed to a microprocessor.
Alternatively, some or all of the functions may be performed in PC.' 42, in
another
microprocessor system, or otherwise in software.
Of course, PC 42 does not have to be a "personal computer" but may be az~y
of various other computers, such as a Macintosh, Sun Microsystems, etc.
Four mixers and filters may be used, rather than the two, elimlIlatmg the
need for RF switch $U.
As used herein, a "conductor'' may actual comprise multiple wires, such as
in the case of a parallel digital transmission. In another words, digital data
may be
transmitted in parallel or in series. There may also be a ground wire.
Conductors
3$ and 4U each may be a 50 ohm coaxial cable.
As used in the claims, the term "connect," "connectable," csr "connected to"
are not necessarily limited to a direct coruiection.
B. T~v o-Frecfu~ncX Embodimenss
Although the multi-frequency embodiment described above is generally
preferred, a description of the following two-frequency technique for
determining
the hematocrit is also presented.
1. Back round
Refernng again to FIG. 1, wluich depicts an approxirn~ltic~n of thte behavior
of whole blood when subjected to an alternating electrical current, resistance
I0 in
circuit path 12. repmsents the response of the extraceilular or plasma
component,
while the parallel circuit path 14> representative of the erythrocyte or red
blood
corpuscle component, includes both a capacitance I6 as well as a resistance
I$. At
~:r,~r;~~nr~ SHF~r
CA 02218281 1997-10-15
WO 96/32883 PCT/I1S96/04547
-21-
low frequencies (such as 50 kHz), whole blood impedance is attributable
primarily
to the extracellular blood component circuit path 12, while at higher
frequencies
(for example, 1 MHz) the capacitive nature of the cell membrane of the red
blood
corpuscles results in a more significant impedance contribution from circuit
path 14,
reducing the magnitude of the whole blood impedance. Thus, in simplified
terms,
the ratio of a low-frequency impedance to a high-frequency impedance is
representative of the relative volume percent of red blood corpuscles, or
hematocrit.
There is no precise frequency or narrow band at which the red cell capacitance
phenomenon becomes significant, but rather a transition zone of frequencies
over
which the capacitive component increases in a relatively rapid manner. As will
be
explained in more detail hereafter, the impedance magnitude differential due
to the
frequency response characteristics of blood below and above the aforementioned
transition zone enables the practitioner employing the present invention to
utilize
electrical stimulation of the patient to determine hematocrit in a noninvasive
manner. However, in order to make use of frequency-based impedance
differentials
in whole blood to determine hematocrit, it is necessary to remove the dominant
body tissue impedance component of the body portion through which impedance is
measured.
FIG. 15 of the drawings comprises a representative sector of a demodulated
voltage signal envelope over a period of time as measured by sensors attached
to an
electrically-stimulated extremity of a patient according to the present
invention, the
measured voltage being directly proportional to and therefore representative
of the
total impedance of the whole blood plus the surrounding tissue. As shown, the
signal envelope includes a dominant DC or baseline component and a small AC or
pulsatile component. The DC component is generated by the patient's tissue,
non-
pulsatile arterial blood, and venous and capillary blood of the stimulated
body
portion. The AC component is attributable only to the pulsatile blood, and is
therefore truly representative of whole blood impedance for a given frequency.
AC
components at different frequencies will have substantially identical voltage
envelope shapes, differing only in magnitude due to the aforementioned
frequency-
dependent nature of the whole blood impedance response. By isolating and
utilizing
only the AC, or pulsatile, component of the signal, the impedance effects of
the
patient's extravascular tissue are eliminated and a hematocrit determination
may be
CA 02218281 1997-10-15
WO 96/32883 PCT/US96/04547
-22-
made using the ratio of a low-frequency pulsatile impedance to a high-
frequency
pulsatile impedance.
2. Two-frequency system and method
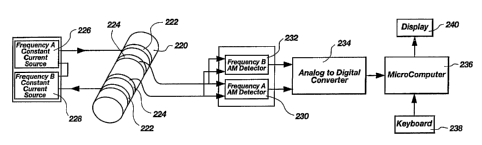
FIG. 11, which is illustrative of a two-frequency embodiment of the
invention, shows a patient body portion 220 containing an artery (which may
also
be referred to as a pulsatile vascular compartment) on the exterior of which
have
been placed outer stimulation electrodes 222 and inner sensor electrodes 224,
all of
which are preferably ring electrodes so as to envelop the body portion 220.
The
four-electrode method is a standard engineering technique which helps to
eliminate
errors attributable to contact resistance and, except insofar as it is
employed in the
present invention, does not constitute a part thereof.
Power or stimulation electrodes 222 are driven with a constant current
composite carrier waveform consisting of two frequencies A and B provided by
current sources 226 and 228. It is preferred that the applied constant current
be of
a peak-to-peak magnitude of 2 mA or less. Frequencies A and B should differ
sufficiently to provide a significantly different blood impedance response to
each
frequency due to the capacitive component of the patient's blood, and thus an
impedance differential useful in practicing the present invention. It has been
found
that a low frequency A of 50 kHz and a high frequency B of 1 MHz provide a
usable differential response, in that they are, respectively, sufficiently far
below and
above the frequency transition zone wherein the capacitive component of the
response becomes significant. It should be noted at this point that use of
frequencies much below 50 kHz is inadvisable for reasons of patient safety, in
that
lower frequencies may induce heart arrhythmia.
Each frequency excites the tissue of body portion 220 with a constant
current, and the resulting voltage signal at each frequency is measured from
inner
sensor electrodes 224. Since the current excitation is constant, the envelope
of the
measured voltage at each frequency is directly proportional to the tissue
impedance
at that frequency. AM Detectors 230 and 232, one each for frequency A and
frequency B, measure the envelope of the voltage signals, and transmit the
resulting
signals to A/D Converter 234, which converts the signals to the digital domain
for
isolation of the pulsatile component of the signal and further processing by a
programmed processing unit, preferably general purpose Microcomputer 236, in
.-
CA 02218281 1997-10-15
WO 96/32883 PCT/US96/04547
-23-
response to commands from Keyboard 238. Microcomputer 236 repeatedly extracts
time-matched converted pulsatile signal component segments at each frequency,
normalizes them against the voltage baseline of the respective carrier
waveforms
and then creates a series of segment ratios of the normalized pulsatile signal
components. These ratios are averaged, preferably using a weighted averaging
methodology which more heavily weights more significant ratios, being those
comprised of pulsatile component segments exhibiting the greatest change in
voltage
magnitude over time. The weighted average of the ratios is representative of
the
hematocrit, the latter being extracted from an internal look up table of
corresponding ratio and hematocrit values by Microcomputer 236, and displayed
to
the practitioner via Display 240, which may comprise a graphic screen display,
a
numerical display, or both. '
An embodiment of current sources 226 and 228 of FIG. 11, as depicted in
FIG. 12, uses transistor 300 as an approximation of a current source, which is
driven by oscillator 302 through automatic gain control (AGC) multiplier 322
at the
desired frequency, the resulting output signal driving power transformer 304
which
in turn outputs to patient stimulation electrodes 222. Isolation of each
current
source using transformer coupling via power transformer 304 and pickoff
transformer 306 is used for patient safety. It should be noted that, as is
well known
in the art, transformers 304 and 306 should be wound to maximize their
response at
the frequencies of interest and minimize sensitivity to artifact. A sensing or
regulator signal is picked off from the output coil of transformer 306 and
transmitted through buffer 308 to phase lock loop synchronous AM detector 317,
which includes detector multiplier 310, phase lock loop 312, quadrature
amplifier
314 and low pass filter 316. Phase lock loops are well known in the art, as
are AM
synchronous detectors incorporating same, and therefore their structure and
function
will not be further described herein. However, a brief but excellent
description of
phase lock loops, their operation, versatility and applications, specifically
in the
fabrication of an AM synchronous detector suitable for use with the present
invention, appears in the 1987 EXAR Databook, pp. 6-62 through 65 and 11-68
through 71, published by F.XAR Corporation, 2222 Qume Drive, San Jose,
California 95131. Detector 317 outputs the envelope of the sensed current
drive
signal to difference amplifier 318 for comparison to the input signal from
reference
CA 02218281 1997-10-16
irr~vu5 ~- ~ ~~~ v ~~~~
-24-
320, the output signal from; difference amplifier 318 controlling AGC
multiplier
322, the output of which is impressed with the desired frequency (A or B) by
oscillator 302. Thus a servo-control loop to maintain a substantially constant
output
from the current source is established. Current Sources 226 and 228 are
S substantially identical except for the frequencies dictated by oscillator
302.
The Al~ Detectors 230 and 232 used in the embodiment of FTG. 11 of tlue
present invention, as depicted in ~'IG. 13, are AM synchrony>us detec.tc~rs
built
around a phase lock loop. 1'he measured voltage signal from the sensor or
patient
measurement electrodes 224, which is quite minute, is ampLihed by
instrumentation
amplifier 400 and sent to detector multiplier 402 and phase Lock loop 404 of
each
AM Detector 230 arid 232, the output of the phase lock loops being filtered by
low
pass filters 408. The outputs of Detectors 230 and 232 are thus the envelopes
of
the measured voltage waveforms at low and high frequencies, respectively, and
inherently representlative of impedan<:e at those frequencies. As noted
previously,
phase loch loops and synchronous A1W detectors, their structure and function
are
well lmown in the art, and the reader is again referred to the above-
referenced
pages of the 19$7 F.XAIRDatabook for a more detailed description thereof.
The demodulated voltage sigrr~l envelopes from AM 1)et<:ctors 23() and 232
are received by AID ('onverter 234, depicted in its preferred embodiment in
FIG.
14, AID Converter 234 including a pair of level shifters 5()0, each driven by
level
set commands from lVicrocomputer 236 via digittal~to-analog (D/A) convertors
502
to extend the range of high resolution analog-to-digital (A!D) converter unit
504 to
accommodate the fact that the variable {pulsatile) component of the impedance
being
measured typically constitutes only about one percent (1 %) of the total
measured
impedance. Analog ntultiplexor 506 selects the appropuiate signals from either
,Al~T
Detector 230 or 232 responsive to channel select commands from lvlicrocomputer
236, and feeds the selected signal to analog-to-digital converter unit 504 for
conversion to the digital domain.
One preferred means of obtaining the pulsatile wave:orm component of
interest in the practice of the present invention i.s to utilize a hii;h
resolution AlD
converter unit :i04; that is to say one which has a ~()-f_ > bit resoiutic~n
capability.
and digitise the entire waveforYn, ineludic~g both tfae small Ai:: (puisatile)
and much
larger DC (baseline) components. 'this provides a sufticient'~r Large dynamic
range
CA 02218281 1997-10-16
-... ~ YV A v v Y v m v w
-25-
so that the pulsatile, or AC component, of the waveform at each frequency can
be
isolated to provide meaningful data. ~iowever, this approach requires a
relatively
expensive A,lD converter unit, and an alternative approach is to set a voltage
clamp
level at the magnitude of the DC component, subtract this from the waveform
and
magnify the remaining signal. The voltage clamp approach is less expensive as
it
requires fewer bits of resolution capability in the AID convener unit.
Segments of the converted anaog values from Detectors Z30 and 232 are
then repeatedly extracted over identical time periods by Microcomputer 236,
correlated to further reduce noise effects, and then narnnalized by dividing
by the
voltage baseline of their respective carrier waveforms before a series of
ratios of the
time-matched digitized pulsatile component signal segments at frequencies A
and B
are calculated. The ratios are averaged in a preferred embodiment using
weighted
averaging techniques well known in the art, relative weighting being based
upon the
change in voltage magnitude versus time for the time period over which the
digitizxd signals ane extracted. Stated another way, the greater thG ~V per nt
for a
pair of time-matched component segments, the more significant the resulting
ratio
and the more heavily the ratio is weighted in the averaging process. The
weighted
ratio average, which is representative of hematocrit, is correlated to a
hematocrit
value by Microcomputer 236 via a look-up table of corresponding ratio and
hematocr~it values constructed a priori from clirrical studies acrd depicted
numerically
andlor graphically to the practitioner on Display 240. Of course, the
foregoing
process from measurement of voltage across the patient body portion 220 to
ultimate
output of patient hematocrit on Display 240 is performed repeatedly and
substantially continuously, so that variations and trends in hematocrit will
be
immediately apparent. 'I'tre use of empirical data for the loon-up table is
due to the
fact that the electrical approximation employed for the wholr, blood tnc~del
is frrst-
order, acrd a rigorous derivation of the response of the model will be
inaccurate.
Moreover, any such derivations will yield calibration results which vary with
the
two frequencies chosen, as well as the gain factors of the vazious stages of
the
3Q apparatus.
As will be evident to the. skilled pzactitioner of the art, all components of
the
apparatus utilized to practice tire present invention should be selo<aed for
low noise
o;rtput, due to the extremely low signal rnagnituda of the signal of interest.
CA 02218281 1997-10-16
~ ~v'r l ivWJ
-2fi-
3. Arid ~,~~ (",.~m~,_",arid
a. ')=he Impedance of Blood
The model. for the first-order electrical representation of blood, as shown in
FIG. 1, has been established by empirical testing to be correct. It is
interesting to
note that confirmation of the model has appeared in the biomedical engineering
literature. de Vries, P.M.J.M., et al. "Implications of the dielectrical
behavior of
human blood for continuous on-line measurement of hematocrit", Med, Biol.En~.
& Comput. 31, 4~15~448 (1993).
However, the frequency range of greatest interest, previously believed to lie
between 50 kHz and x MHz, has been proven to be somewhat different and
expanded at the hzgh frequency end. In fact, the preferred frequency range has
subsequently been established to lie substantially between 100 kHz amd i0 MHz
to
MHz.
The electrical performance characteristics of blood according to the FIG. 1
15 model over this latter frequency ranl;e (100kHz an<i 10 MHz to 20 ?VIHz)
have been
confirmed by the inventor on numerous occasions with a specially prepared test
cell.
The test cell was fabricated by taking a cylindrical glass tube 1 cm in
diameter.
One end was sealed with an insulator containitr,g an embedded electmde. The
blood
sample was then introduced into the test cell, together with a very small
quantity of
20 heparin, to prevent the sample from coagulating in the test cell. ,A
removable
stopper of an insulating material was then imserted in the open end of the
test cell;
the stopper also had an embedded electrode that descended into the bioad, when
the
stopper was properly positioned. The impedance characteristic of the blood was
then measured in a straight-forward manner (in this configurati<~r~, the test
cell
operates as a two~terminal electrical device) by douy a frequency sweep over
the
range of interest and measuring the response.
Since stagnant blood has a sf:dirnentation eft~o~a, in which the suspended red
blood cells will slowly settle due to gravity, it may be important to stir the
contents
of the test cell if protractei-1 testing is done, to ensure reproducibility.
b. 'fhe Elecarieal Model for Noninvasive ~Iematac:rit
Detern~ination
By way of providing those of ordinary skill in the art with a more complete
and comprehensive understanding of the invention, it sbould be reaffirmed that
the
... __..,-.,~~ cmr~T
CA 02218281 1997-10-15
WO 96132883 PCT/US96/04547
-27-
underlying electrical model is a parallel one. In fact, although the analogy
employed in the BACKGROUND section of this application to pulse oximetry might
be appropriate for motivation with what is now termed the "small signal" or
plethysmographic approach, the analogy would be somewhat inappropriate if
carried
to an extreme. Specifically, a directly equivalent electrical derivation to
the optical
problem of pulse oximetry would result in a series electrical model. However.
the
appropriate electrical model for a body portion 220 under test, as shown in
FIG.
11, would be the first order approximation of FIG. 1 representative of the
blood in
the pulsatile vascular compartment, in parallel with a like circuit, the
values of
which would represent the infra- and extra-cellular spaces and cell membrane
capacitances of the bulk background tissue. This model is shown in FIG. 16,
where
the background tissue impedance, ZT, is bridged in a parallel fashion by the
impedance of an additional volume of blood, ZB. One naturally occurring way in
which an additional volume of blood is added to a limb segment is during the
cardiac cycle, where the pumping action of the heart causes incremental
volumes of
blood to be periodically added and removed. As shown in FIG. 16,
ZB = Blood Impedance
RBE = Extracellular Resistance of Blood
RBI = Intracellular Resistance of Blood
CBM = Cell Membrane Capacitance
ZT = Tissue Impedance
R~ = Factracellular Resistance of Tissue
Rz.I = Intracellular Resistance of Tissue
Cz.I,,i = Cell Membrane Capacitance of Tissue
The solution of this model is straightforward, and can be done by any
electrical engineer of ordinary skill in the art. Successful solution
techniques find
ZB by removing the effect of ZI. from the measured gross impedance, using
knowledge of the parallel nature of the model. Once ZB is determined,
hematocrit
is found to be some function of the ratio RBI/(RBI + RB~. The precise
characterization of this function cannot be known; however, it is empirically
determined during instrument design by making a large number of calibration-
type
measurements and embedding the results in a look-up table as previously
CA 02218281 1997-10-15
WO 96/32883 PCT/US96/04547
-28-
referenced. The look-up table is then employed in the apparatus of the
invention as
used with a patient in a real-life environment.
Using the underlying concept of measurement at sufficiently low frequencies
that
the capacitances are essentially apen circuits (less than 100 kHz ( < 100
kHz)), and at
sufficiently high frequencies that the capacitances are essentially short or
closed circuits
(greater than 20 MHz ( > 20 MHz)), results in simplified equations for
solution of the
problem.
c. The Two-Freduency Technickue
The original inventive concept, as set forth above, addresses the problem
(hematocrit determination) from the point of view of impedance magnitude.
Since the
equivalent electrical circuits used to model the pertinent physiology contain
reactive
components (capacitors), the impedance across the frequency spechum is
complex; i.e.,
magnitude and phase are both pertinent (or, equivalently, real and imaginary
pmts).
However, as noted immediately above, by using measurement frequencies that are
sufficiently low and sufficiently high, the capacitive components are either
respectively
open or closed. Thus, the phase at the measurement frequencies would be
expected to
be at or near zero.
Practically speaking, it is difficult to fabricate electrical devices that
perform well
at 20 MHz, in order to solve the noninvasive hematocrit determination problem.
It is
possible, however, to use a two frequency technique where the higher of the
two
frequencies is lower than 20 MHz if additional assumptions are made. For
example, the
reverse S-shaped curve plot of blood impedance, Z, which is level at 100 kHz
and then
slopes downwardly above 100 kHZ until it is again level at 20 MHz, begins to
level out
at about 10 MHz. Therefore, one may achieve reasonable accuracy by employing a
look-up table with high frequency empirical values corresponding to hematocrit
as
determined at 10 MHz rather than 20 MHz. Alternatively, it is possible to
solve the
equations represented by the circuits by using more than two frequencies, for
example,
three or more, if these are chosen so that the measured impedances at these
frequencies
are sufficiently different from one another. The use of at least one
additional frequency
would again permit the avoidance of using a 20 MHz high frequency. This
technique
would involve more mathematics with at least another additional unknown, but
potentially is a more refined methodology which might obtain a better
approximation of
hematocrit at certain levels via curve-fitting than the two-frequency
approach.
~-
CA 02218281 1997-10-15
WO 96!32883 PCT/US96/04547
-29-
The approach of the system and method of FIGS. 3-10, however, does not
ignore phase. It has been determined that phase angle (phase shift) of a
detected
waveform relative to the input signal is related to the amount of cell
membrane
present, and thus to hematocrit. Further, if blood is directly measured in a
test cell,
as previously described, but both magnitude and phase are recovered, the
inventor
has found that the phase reaches a maximum response in the vicinity of 1.6 MHz
(also confirmed by de Vries, et al, previously cited). This is the frequency
region
approximately corresponding to the point of inflection of the reverse S-shaped
impedance/frequency curve. Thus, if appropriate hardware is fabricated, the
noninvasive hematocrit determination problem can be solved with a two
frequency
measurement employing the phase of the detected signals in combination with
impedance magnitude, wherein the high frequency is significantly lower than 20
d. The Modified Small Si n~pproach
As discussed earlier with respect to the two-frequency embodiment of the
invention, when a limb containing a pulsatile vascular space is measured
electrically, the pulsatile component (!mown as the plethysmographic signal)
is a
very small percentage of the baseline DC signal. Typically, this
plethysmographic
signal is 0.05 % - 0.1 % of the magnitude of the baseline. This in itself
requires
very rigorously designed instrumentation, as heretofore noted, because of the
necessary dynamic range.
However, an additional problem has been discovered with the small signal
approach as described with respect to the two-frequency embodiment of the
invention. This problem is due to the nature of intracorporeal blood-flow,
which
the inventor has determined to be non-homogeneous. By this, it is meant that
the
gross components of blood, namely plasma and the suspended cellular particles,
do
not flow in lock-step with one another; rather, in response to irregular
paths,
turbulence, etc., the concentration of red cells in plasma may exhibit regions
of
higher concentration followed by regions of lower concentration. Thus, over
the
course of a cardiac cycle, there will be small changes in the "instantaneous
hematocrit" at any given point in a vascular space. Thus, if one could station
a
miniature "perfect observer" at a given point in an artery, this observer
might detect
CA 02218281 1997-10-15
WO 96/32883 PCT/US96/04547
-30-
instantaneous hematocrits varying from 39 to 41 in a person whose classically
measured hematocrit was 40.
While seemingly small in absolute terms, such variations in instantaneous
hematocrit tend to have a rather large effect on the derived hematocrit, when
the
noninvasive technique of the invention is used. This phenomenon results from
the
underlying assumption that the plethysmographic variations that are observed
are
due strictly to variations in the observed volume of whole blood, and are
representative of whole blood. In fact, the measured variations are a
combination
of true blood volume change as well as changes in the local density of red
cells in
plasma. It is conceivable that the relative percentage of the density
variation is
actually larger than the plethysmographic percentage of the baseline. This
situation
may lead to markedly incorrect results, even if an ideal apparatus were to be
built.
A solution to the aforementioned problem with using the small signal approach
created by variations in instantaneous hematocrit, is to restore correctness
to the
underlying assumption of homogeneity of blood flow. This modified small signal
approach is effected by applying a mechanical "assist" to the limb under
measurement. To understand the basis for this "assist," consider what happens
when a blood pressure cuff is applied to a limb and taken through an inflation-
deflation cycle. When the cuff is initially taken up to a pressure that
exceeds
systolic blood pressure by a fair amount, the pressure results in the complete
obliteration of the arterial space; consequently, no blood will flow past the
obstruction effected by the cuff at any point in the cardiac cycle and the
plethysmographic signal is completely suppressed. As the cuff bleed valve is
opened and the cuff is deflated slowly, the column of blood at the proximal
end of
the cuff is able to make brief incursions into the region of the limb under
the cuff
during the high pressure parts of the cardiac cycle. Just as the cuff deflates
to sys-
tolic pressure, a small quantity of blood is able to completely traverse the
occluded
zone for just a brief instant. As the cuff pressure continues to decrease, a
larger
fraction of blood is able to transit through the occlusion zone, although
there is still
complete occlusion of the artery for the portion of the cardiac cycle that has
a
pressure below the occluding cuff pressure. Finally, as the cuff deflates to
diastolic
blood pressure, the blood is able to travel past the occlusion zone for the
entire
cardiac cycle.
CA 02218281 1997-10-15
R'O 96/32883 PCT/US96/04547
-31-
Now, consider again the situation where the cuff pressure is just at the
systolic
value. The tiny fraction of blood that is able to completely traverse the
occlusion
zone is nearly pure plasma, because plasma is less viscous than whole blood
and the
resistance of the nearly totally occluded artery is very high. As the cuff
pressure
continues to decrease, the resistance presented to the blood also decreases,
and more
cellular components are able to flow. The desirable effect being sought is one
where the artery remains occluded for at least a small portion of the cardiac
cycle
and where the blood traversing the occlusion zone is representative of whole
blood,
at least over time.
Thus, by causing the artery to be occluded by a blood pressure cuff during a
portion of the cardiac cycle, it is guaranteed that the plethysmographic
signal is
representative of the total volume of blood in the artery, rather than the
small
portion of additional volume due to cardiac ejection. Additionally, if the
blood
traversing the occlusion zone is representative of whole blood over time, then
the
plethysmographic waveform can be integrated to solve the problem.
It has been found that the proper conditions to effect the foregoing desired
result occur when the cuff pressure is in the region of mean arterial
pressure. This
pressure zone is non-critical and corresponds to the pressure region where the
amplitude of the plethysmographic component of the signal becomes a maximum.
To practice the invention according to this methodology, the cuff is applied
to
the body portion (limb) in question proximate the stimulation and sensor
electrodes.
It is feasible to place the cuff either proximally, distally or over the
electrodes,
there at present being no identified preferred location for the cuff relative
to the
electrodes. Pressure in the cuff and inflation and deflation thereof may be
controlled via a pump, bleed valve and sensor (pressure transducer) as known
in the
art, which devices are preferably under control of the microcomputer of the
hematocrit determination apparatus.
It should also be observed that the modified small signal approach should be
employed with simultaneous stimulation of the body portion in question at the
two
selected frequencies, due to the importance of fairly precise synchronization
of
sampling with the timing of the cuff inflation/deflation cycle.
CA 02218281 1997-10-15
WO 96/32883 PCTIUS96/04547
-32-
e. The Large Signal Approach
The multi-frequency approach described in connection with FIGS. 3-10 is
referred to as a large signal approach. By contrast, the two-frequency
approach is .
referred to as a small signal approach. An underlying impedance effect has
been
discovered and verified that allows the determination of hematocrit using
electrical -
measurements. The concept is extended to the noninvasive realm by observing
blood plus background tissue and focusing in on the component that is due to
blood;
i.e., subtracting out the portion of the effect that is due to the background
tissue.
Naturally occurring variations in blood volume due to the actions inherent in
the
cardiac cycle are used by measuring the plethysmographic signals. In the
previously-discussed small signal approach, a blood pressure cuff is employed
to
avoid the deleterious effects of the non-homogeneous nature of blood flow.
A large shift in blood is effected by the system and method described in
connection with FIGS. 3-10. The nature of the method is such that blood flow
artifact is eliminated. The same concept of subtracting out the background
tissue
impedance is employed, using the equations that result from solving the
parallel
model.
The procedure requires that an initial measurement of the background be taken
with the limb under examination at rest, a blood pressure cuff having been
previously applied. The cuff is then inflated to a point that is just below
diastolic
blood pressure. This pressure level allows blood flow during the complete
cardiac
cycle through the arteries; however, the cuff pressure is sufficient to
provide venous
occlusion. For purposes of convenience, a vein may also be referred to as a
non-
pulsatile vascular compartment. Thus, a situation has been created where whole
blood is being added to the limb while outflow of blood is prevented. This
serves
to temporarily sequester an additional volume of whole blood in the vascular
space
of the limb. If, now, an additional measurement is taken, it becomes a simple
matter using the aforementioned background measurement in combination with the
additional measurement to apply the equations that solve the parallel model
(FIG.
16) to derive the hematocrit. It has been determined that the differential
signal
magnitude that results as a consequence of this maneuver is on the order of 2
% -5 % ,
which is a significant improvement over the magnitude of the plethysmographic
signal in comparison to the baseline. It should also be noted that the large
signal
o-
CA 02218281 1997-10-15
WO 96132883 PCT/L1S96104547
-33-
approach is a static technique in which the sequestered increment of blood is
not
flowing during the period of measurement. As a result, the artifact due to non-
homogeneous blood flow is eliminated. Further, because the large signal
approach
is a static technique, stimulation of the patient body portion at different
frequencies
may be effected sequentially rather than simultaneously, via sweeping or
rapidly
sampling at the desired frequencies.
The operation of the blood pressure cuff to effectuate the large signal
approach, is preferably controlled, as with the small signal approach, by the
microcomputer of the hematocrit determination apparatus.
C. Measurement of Blood Pressure
Since the measurement setup for both the modified small signal and the large
signal approach involves the application of a blood pressure cuff, as well as
the
electrodes necessary for impedance measurement, the apparatus may also be used
to
provide for the measurement of blood pressure using a different technique than
that
which is commonly employed in present day noninvasive automatic blood pressure
monitors.
Current technology for automatic blood pressure monitoring generally employs
the oscillometric approach. This involves analysis of the pressure variation
in the
blood pressure cuff itself that is due to pulsation in the arteries that
underlay the
cuff. Such an approach has been recognized to result in reasonably accurate
values
for systolic and mean blood pressures, but usually inaccurate values for
diastolic
blood pressure. However, the oscillometric technique has found widespread
acceptance due to the simplicity, from the user's point-of view, of employing
the
cuff as both the medium of pressure application as well as the sensing device.
This
results in a favorably perceived trade-off between inaccuracy of measurement
of
diastolic pressure versus ease-of use.
Although the blood pressure determination technique of the invention involves
the connection of additional interfaces to the patient, this is already being
done to
obtain the hematocrit noninvasively. Therefore, it is attractive to use the
apparatus
of the invention to also obtain a blood pressure reading that is, in fact,
more
accurate than that afforded by the oscillometric technique.
CA 02218281 1997-10-15
WU 96/32883 PCTlUS96/04547
-34-
The measurement points of interest using a blood pressure cuff and impedance
determination electrodes and circuitry are found as follows: the cuff is
inflated
initially to suppress the plethysmographic signal; as the cuff is deflated,
systolic ,
pressure is the point at which the plethysmographic waveform reappears; as
cuff
deflation continues, mean arterial pressure is the point of maximum intensity
of the
plethysmographic signal; as cuff deflation continues still further, diastolic
pressure
is that at which the morphology of the plethysmographic waveform ceases to
undergo further change with continued cuff deflation.
D. Conclusion
While the present invention has been described in terms of certain exemplary
preferred embodiments, it will be readily understood and appreciated by one of
ordinary skill in the art that it is not so limited, and that many additions,
deletions
and modifications to the preferred embodiments may be made within the scope of
the invention as hereinafter claimed.
~-