Note: Descriptions are shown in the official language in which they were submitted.
CA 02220821 1997-11-12
"PROCESS FOR PUMPING BITUMEN FROTH THROUG~ A PIPELINE"
A recent development in the recovery of upgraded oil products from
surface-minad oil sands located in the Fort McMurray region involves the
process of:
~ Iocating a mine remote form the upgrading refinery;
~ mixing the oil sand with water at the mine site to produce a
pumpable, dense, low temperature slurry;
~ pumping the slurry through a pipeline to an extraction site, the
pipeline being of sufficient length so that the slurry is conditioned for
flotation;
~ aerating the slurry and diluting it with water as it moves through the
pipeline;
~ delivering the aerated diluted slurry into a primary separation vessel
and producing bitumen froth;
deaerating the froth, for example by countercurrent flow with steam
in a tower having sheds or by mechanical shearing with an impellor;
and
pumping the deaerated froth through a pipeline to an upgrading
facility.
This process is described in greater detail in the attached Appendix A, forming
part of this provisional application and the invention described in it.
One aspect of this invention is concerned with the process for pumping
the deaerated froth, under conditions of core-annular flow, through a pipeline
for a considerable distance.
CA 02220821 1997-11-12
The conditions for establishing core-annular flow with deaerated
bitumen froth are described below, together with reporting on supporting
underlying experimental work.
When heavy viscous oil is transported through a pipeline, significant
energy savings can be achieved by lubricating the oil flow with water, as in
core-annular flow. The conventional method for establishing core-annular
flow is to inject water ànd oil simultaneously, with the water collecting in the
annulus and encapsulating the oil.
The design of injection nozles and control of the flow rates impacts on
the formation of a lubricated layer and on the time and downstream distance
necessary to establish lubricated flow. Establishing lubricated flow in
conventional applications is a manageable problem which can usually be
controlled by varying the rate of water and oil injection. In fact, different flow
types with different pressure gradients can be achieved by varying the
injection rates (see, for example, Joseph & Renardy, [1992]).
As previously stated, the invention involves pumping bitumen froth
through a pipeline, economically, over long distances (for example, 3~km).
The froth contains about 20% to 40% by volume of dispersed water in which
colloidal clay particles are well dispersed. Bitumen froth self-lubricates in a
sheet of produced water; water injection is not required. In the usual oil-water
mixture, dispersions of 20--40% water in oil are very stable and very viscous
with viscosities even higher than the oil alone. However, the froth is unstable
to faster shearing which causes produced water droplets to coalesce and form
a self-lubricating layer of free produced water.
CA 02220821 1997-11-12
Conventional methods for start-up of lubricated core flow are
impractical or impossible for the start-up of core flow of bitumen froth in real
pipelines. A process for restarting core flow with very viscous oils after a long
standstill period by controlled injection of water was described in a patent by
Zagustin, Guevara and Nunez [1988]. Their method was applied to restart an
experimental one inch pipeline filled with bitumen froth at the University of
Minnesota. The addition of water led to very erratic pressure readings and to
achieve the restart so much water was added that the froth core broke up.
The addition of water is in general not desirable; the froth contains 20 to 40%
water by volume in its natural state and more water makes the separation of
bitumen from water in subsequent processing more difficult.
A second method for starting self-lubricated flow of water in oil
emulsions (5 to ~0% water by weight) was described in a patent by V. Kruka
[1977]. This patent documents start-up of self-lubrication of emulsions of
water in Midway-Sunset crude oils by creating a certain shear rate for a
certain length of time in a pipe flow to break the emulsion and create a water
rich'zone near the pipe wall. Kruka's experiments were in a 1" diameter, 53.5"
long pipe. ~e achieved the shear rates required to break the emulsion by
slow increases in pressure.
In our experiments with Syncrude's bitumen froth at the University of
Minnesota, it was not possible to start self-lubricated core flow by slow
increase of pressure in a 1" by 236" long pipe. It is believed that the condition
for self-lubrication can be achieved by slow increase of pressure in short
pipes, but in long pipes the pressure drop required to produce the critical
CA 02220821 1997-11-12
shear rates are too large. The method of slow increase of pressure will not
work in long commercial lines.
The breaking of oil-in-water emulsions is similar to, but different than
the breaking of emulsions of dispersed water with colloidal clay particles in
Syncrude's bitumen froth, because the clay covering protects the bitumen
from coalescing, thus promoting the coalescence of clay water under shear.
The method of start-up by slow increase of pressure (Kruka 1977)
differs from the method of fast froth injection behind moving water or air in a
water wet pipe described below. The prior art runs through laminar flow
whereas in the present invention the water is always in turbulent flow. The
prior art specifies that the "..shear rate must not approach or exceed the value
beyond which emulsification of the viscous and less viscous liquid will occur.."
whereas no upper limit of shear rates has been found in the case of self-
lubrication of bitumen froth. The long-term durability against fouling was not
claimed by the prior art but is claimed for froths protected by colloidal
particles. The beneficial effects of protection of bitumen by coverings of
colloidal solids, inhibiting the fouling of pipe walls and preventing the bitumen
from sticking to itself does not apply to the prior art but is believed to be
essential for the present invention.
The present application describes a new procedure appropriate for
start-up of self-lubrication of Syncrude's bitumen froth, in which the froth is
injected behind water moving at a speed faster than that required to break the
emulsion (the order of 1 m/sec). This method of start-up will not work for
conventional heavy oils for which water addition, undesirable for froth, is
required.
CA 02220821 1997-11-12
The claims made for self-lubrication of Syncrude's bitumen froth are
believed to apply more generally to emulsions of mobile immiscible liquids in a
relatively immobile viscous phase at stable volume fractions (10% to 40%)
with the additional caveat that the viscous phase is stabilized against
coalescence by colloidal particles in the mobile liquid.
The results of the 1985-1986 experiments of Neiman at Syncrude, the
1996 experiments at the University of Minnesota, and the pilot tests in a 24-
inch (0.6m) diameter, 1 OOOm long pipeloop at Syncrude, indicate that a
lubricating layer of water will not form when pumping dearated froth unless the
flow speed is large enough. The Neiman experiments in 2" pipes do not
mention this point explicitly but data for self-lubrication is given only for flow
velocities greater than critical where the critical is of the order of 0.3 m/s. It is
believed that the critical velocity is a function of the temperature, lower for
high temperatures.
The University of Minnesota experiments using the 1" diameter
pipeloop addressed this point explicitly and they showed that self-lubrication
was lost when the flow velocity was reduced below 0.3--0.9 m/s, depending
on the froth temperature (figure 1). They also were unable to re-establish
self-lubrication by increasing the speed of the froth trough during non-
lubricated slug flow regimes. In these regimes, the froth is weak but the
pressure gradients are an order of magnitude greater than the value in self-
lubricated flows. It is believed that if the flow velocity could be increased
through the non-lubricated slugging regimes, a critical speed would be found.
This experiment could not be done because of the high pressures needed to
CA 02220821 1997-11-12
raise the flow speed are beyond capacity o~ the Moyno pump used in the 1 "
diameter pipeloop experiment.
Yelocity ~s temperature
0.8 -
- ~ 0 7 ~
~.0 . 6 -- o
c 0.5 -
~ 0 4 ~
~ 03 -
stratified flow o\
35 40 45 50 55 60
temperature (C)
Figure 1: (University of Minn~sot~ 1" pipeline, July 1997) Minimum ~/elocity for self-lubrication in a one-
inch pipe as a function of ~ ly~ ul ~.
CA 02220821 1997-11-12
In principle there are two critical velocities for self-lubrication; the
minimum velocity at which core flow can be started and the minimum at which
core flow can be maintained; the latter value is easily measured and is given
in figure 1. The two critical values may be the same or nearly the same.
Experiments have established that there is a critical speed for self-
lubrication; below this speed the pressure gradient required is very high and
depends on the froth rather than water viscosity. When the froth is injected
behind fast moving water or air in a water-wet pipe, it is sheared at the wall
where spherical drops of water stretch into elongated water fingers which
coalesce; the bitumen does not close off the water fingers because it is
protected from sticking to itself by a layer of absorbed clay. The fingers
coalesce into water sheets which lubricate the flow.
The critical criterion can be possibly expressed by a uitical shear
stress for water release which depends on the froth, on its composition and
temperature. Whenever and wherever this stress is exceeded, water will be
released, the maximum stress in the froth is where it is most sheared, at the
water-froth interface. The shear stress is continuous across the interface and
in the water it scales with the shear rate. Hence, the critical shear stress is
equivalent to a critical shear rate.
A critical speed for lubrication of Syncrude's froth has been established
in experiments in 1", 2" and 24" diameter pipes. The critical speed may be
related to a critical shear stress for water, but the relation has yet to be
established.
CA 02220821 1997-11-12
SUMMARY
The start-up procedure for establishing self-lubrication of bitumen froth
is to introduce the froth behind a water flow at speeds greater than critical.
Lubrication is established immediately by this method and the water is then
diverted from the pipeline to allow continuous self-lubricated froth flow. It is
important to introduce the froth at speeds high enough to promote
coalescence of the bitumen drops into a film of lubricating water. Speeds of
the order of 1 m/s have been repeatedly successful in 1", 2" and 24" pipes,
though somewhat lower speeds may also work. It is believed that the
success of this method of start-up is due to the fact that the walls of the pipe
are wet by running water prior to the introduction of the froth; the froth enters
the pipe as a plug flow at speeds large enough so that even the small annular
gaps of water are in turbulent flow. All these factors are favorable to the
generation of high shear rates promoting the coalescence of clay water drops
required for self-lubrication. Start-up procedures using fast froth injection
behind moving water or air in a water-wet pipe do not generate high pressure
surges or the high pressure required in start from rest procedures used in the
prior art (Kruka 1977). The method of fast froth injection behind moving water
also circumvents the need to add water during start up (see Zagustin et al.
1988) which has undesirable consequences for maintaining froth integrity and
dewatering after pipelining. Pure water or clay water can be used for the
water flow prior to froth injection.
The invention is supported by the following experimental work.
CA 02220821 1997-11-12
Control devices for injecfing froth benind moving water.
A view of the test facility used in the Minnesota tests is shown in figure
2. Two loops (main and secondary) are connected in this facility. Froth
circulates through the main loop; which principal components are a supply
tank, a three stage Moyno pump, and 1" (2~mm) diameter, 6m long pipeline.
The supply tank is made of cast steel with a conical bottom, which promotes
the flow of froth to the Moyno pump. This tank is provided with a two-marine-
blade mixer, used to homogenize the froth. The Moyno pump draws the froth
from the supply tank, passes it through the test pipeline, and either returns it
to the supply tank or to the pump inlet, by-passing the supply tank. The
Moyno pump is driven by a variable speed (O--1100 rpm) motor. Since the
Moyno pump is a positive displacement pump, the flow rate or the speed of
the froth in the pipeline is easily determined from the pump's rpm and the
pressure discharge in the pump. The test section is a 1" (25mm) diameter
carbon steel pipe set in a horizontal "U" configuration. Special attention has
to be paid to the sampling system shown in the detail of figure 2. It is
composed of a removable section and a bypass pipe. The removable section
is a glass pipe straightway connected to the main test pipeline by means of
two rubber unions tightly attached to the cast iron pipe. The principal parts of
the secondary loop are a small tank (provided with an electrical resistance), a
gear pump, a 1/4" diameter pipeline and a copper tube. This loop provides the
main loop with water for flushing, establishing a slug of fast moving water
behind which we can restart froth flow. It is also to control the temperature of
the flowing froth. Water can be heated by electrical resistance and kept at a
certain temperature in the small tank, before it is pumped through the copper
CA 02220821 1997-11-12
tubes rolled inside the supply tank, around the Moyno pump and around part
of the pipeline.
Tesf Procedures. Warm froth is loaded into the supply tank and the mixer is
turned on. Meanwhile, warm water is circulated in the main loop driven by the
Moyno pump. This flushing and warming ensures that the pipe is clean and
warm enough to receive the pre-heated and pre-homogenized froth. Once
the froth is homogeneous, it is injected through the Moyno pump to the main
loop. The injection points and froth preparation should be designed to prevent
preferential pumping of water. Simultaneously the water is diverted. When
the froth entirely replaces the water, it is circulated by the Moyno pump
without further water addition. The shut-down procedure is the reverse of the
start-up. The froth flow through the Moyno pump is stopped and water is
injected to the line, completely diverting the remaining froth to the head tank,
leaving only water circulating in the line.
Pilof Tesfs. The pilot scale tests were carried out in a closed loop at
Syncrude, Canada. A 24" (0.6m) diameter and 1000 m long pipeline was
used. The bitumen froth was re-circulated in the loop, driven by a centrifugal
pump. Flow rate and pressure drop were measured using an ultrasonic
flowmeter and pressure transducers. The data was automatically collected
and recorded. Before and after each test, the loop was flushed with tap
water. Pressure drop measurement as a function of flow rate were also
carried out on produced water.
CA 02220821 1997-11-12
. , . ,~ P~rt A
~2 ~1
SDIlrllyTank 2 ~A7 All Al()~
gr~rw~ m~ A6 '
~ Fr Nn Gear P~Jrrlp
18Ura~crTank ~ ~ l Yt~
nn~ coulllc~ ~
G~ 2(~ ~ \~ j P~rt A
' 3\~ 7~ '
clr~cal ~usis~cnce ~ ~ ~
c 23 ~ I~ ,e? 8
[~1 ~ ~, ~ [~ [ - I "4 -D pipeline
T 16 ~PM C~-ntrtlller ~ ,~
C~ppcr tube
7 ' ~/ lr J~ 6yOzz,~
. ~3 3~22
4 M~yn~l Pump O Pu I ~ 15 G~rPump
~ ~ 1/4 -D pipelin~
Figure 2. Test facility scht~ tic Two illL ~ d loops can be easily identified. First, a main loop,
which principal components are a supply tank, a three stage Moyno pump and a l"(~mm) diameter.- 6m
long pipeline. Also 2 secondary or water loop which principal components a water tan};, a 1/4"(6 20rnm)
pipeline, copper tube and a gear pump. Bitumen Froth circulates through the main loop. Pressure taps are
labeled as P", P" P2, P3, and P4. The distances between them are: 3 86m (PO-P,), 3.96m (P,-P2 and P3-P. ),
and 4.37m (P2-P3). The sampling system (Part A) is shown in detail.
.... . .
CA 02220821 1997-11-12
Example 1--Self~ bricated core flow pilot run
Self-lubricated core flow of Syncrude's bitumen froth was established in
the 1" pipeline experiments at the University of Minnesota and in the 24"
pipeline experiment at Syncrude's Fort McMurray pilot by the method of fast
froth injection behind moving water in each and every test and never by any
other method.
The pilot tests were in a 24" (0.6m) diameter, 1 OOOm long pipeloop. A
narrative of tests results will now be given. The pump drive speed was initially
set at 650 rpm to obtain a froth flow velocity of about 1.0 m/s. As the froth
displaced the water in the pipeline, the pump discharge pressure increased. It
took about 10 minutes to displace completely and to establish the core-
annular flow. To ensure stable flow, the pump drive speed was gradually
increased to 800 rpm. As the pump speed increased, the pump discharge
head was well below that required for pumping water at similar flow rates.
This operational setting was continued without change for 24 hours. During
this period, the pressure and flow readings were monitored. There was no
increase of the pressure drop and other bitumen fouling related problems.
However, both froth temperature (43~C vs. 47~C) and velocity (1.10-1.14
m/s vs. 0.90 m/s) decreased for a fixed pressure drop across the loop as the
night approached.
In the next test, core annular flow at a temperature of about 55~C was
readily and predictably established in 10 minutes. The initial pump drive
speed was set at 650 rpm and the froth flow velocity was maintained at about
0.9 m/s for 2 hours of steady operation. Then the pump drive speed was
raised and lowered gradually from 650 rpm to 1000 rpm and back in steps of
CA 02220821 1997-11-12
50 rpm. At each speed, pressure and fiow readings were monitored for about
10 minutes and the test ran for 2 hours. There was no hysteresis observed
either in the velocity or pressure. The average of the two sets of data at a
given speed was used for further analysis.
Example 2. The minimum speed for which core flow of bifumen can be
obtained.
The critical velocity required by the method of fast froth flow behind
moving water is difficult to measure precisely. It is easier to measure the
smallest velocity for which self-lubricated core flow can be maintained; this
value is obtained by monitoring the pressure drop as the flow is sequentially
decreased. It is believed that this value is the same as or close to the critical
value required to establish self-lubricated flow. Tests at the University of
Minnesota's 1" pipeline facility established that self-lubricated flow could be
maintained at velocities exceeding 0.3 to 0.9 m/sec, depending on the
temperature, with smaller critical values at large temperatures (see figure 2).
Tests at Syncrude's 24" pilot pipeline showed that self-lubricated flow could
be maintained at values as slow as 0.33 m/sec, but systematic data on the
minimum velocity was not taken. Neimans [198~] experiments in 2" pipes do
not mention critical values for self-lubrication explicitly, but data for self-
lubrication is given only for flow velocities greater than 0.3 m/s.
Features in the invention:
The following features can be used in the process for pumping heavy viscous
oil (such as deaerated bitumen froth) through a pipeline by establishing and
maintaining a self-lubricated core of the oil in a mobile annular layer of liquid
CA 02220821 1997-11-12
containing a dispersion of colloidal particles which stick to the surface of the
oil and prevent it from sticking to itself. The specific embodiment of this
process is the tested process for establishing self-lubricated core flow of
Syncrude's deaerated bitumen froth in the produced water which is saturated
with colloidal clay. The features comprise:
1. A process for starting a self-lubricated core flow of bitumen froth
by injecting froth behind water or behind air, in a water-wet pipe,
moving at a speed greater than the critical one required for self-
lubrication;
2. A critical velocity greater than 0.3 m/s is required to establish
self-lubrication;
3. The critical velocity decreases as the froth temperature
increases between 35~ to 51~C;
4. It is desirable to use a heated froth for start-up since the hotter
froth has a lower critical velocity; and
5. The process for establishing self-lubricated core flow of bitumen
froth will not work for other heavy oils or bitumen with no
dispersed water.
Advantages
The procedure for establishing self-lubricated flows of bitumen froth by
injecting the froth in a wet pipe at speeds in excess of those required for self-
lubrication is a practical alternative to other methods for establishing core
flow: (1 ) it is superior to the method of controlled injection of water which
dilutes and may decompose the froth. The addition of water also increases
CA 02220821 1997-11-12
the difficulty of final separation of water and oil. (2) It is superior to the
method of slow increase of the pressure, which requires impractical high
pressures to reach critical velocity in long pipelines. No other methods of
establishing self-lubricated flows are known.
References
~ Joseph, D. D. & Renardy, Y.Y., (1992), Fundamentals of Two-fluid
Dynamics, Part ll: Lubricated Transport, Drops and Miscible Liquids,
Springer, New York.
Zagustin, K., Guevara, E. ~ Nunez, G.A., (1988), Process for restarting
core flow with very viscous oils after a long standstill period. U.S. Patent
4,745,937.
~ Kruka, Vitold R., (1977), "Method for Establishing Core-Flow in Water-in-
Oil Emulsions or Dispersions", Canadian Patent Granted to Shell Canada
limited, No. 1,008,108.
In another aspect, the invention includes a novel procedure for starting up
a pipeline of considerable length, which is filled with deaerated froth after
pumping has been temporarily shut down. A very high pressure would be
needed to get the entire froth load moving and replace it with water. It is
therefore suggested that the length of pipeline be divided into a series of
sequential segments of equal length. Each segment would be connected with
a water source and a pump. The segment froth would be replaced with water
at above-critical velocity at relatively low pumping pressure. Once all of the
froth in the segments had been sequentially replaced with water, then
displacement of the water would be initiated at a pumping rate conducive to
causing core-annular flow.
CA 02220821 1997-11-12
Still another aspect of the invention will now be described.
When heavy viscous oil is transported through a pipeline, significant
energy savings can be achieved by lubricating the oil flow with water as in
core-annular flow. Even though the lubricated flow is hydrodynamically
stable, oil can foul the pipewall. Sometimes this fouling can build-up to cause
increasing flow resistance and ultimate blockage of flow. This issue is the
main impediment in commercializing lubricated flow technology.
The present invention specifies that one technique for avoiding fouling
is to add colloidal particles of the right type and concentration to the
lubricating water. The overall effect of the particles should be to prevent the
oil from sticking to itself by covering the oil with a protective coating of
particles.
The context for our invention is the need to pipeline bitumen froth
economically over long distances (3~km). Bitumen froth is produced from the
oil sands of Athabasca using the Clark's Hot Extraction process; the froth
contains from 20% to 40% by volume of dispersed water in which colloidal
clay particles are well dispersed.
The use of clay particles is an embodiment of our invention; it is
believed that the same principles apply whenever colloidal particles in water
are absorbed on the oil surfaces and act as a barrier preventing droplet
coalescence (Tadros and Vinent, 1983).
Significant information exists in the literature on bitumen transport in a
core flow mode in which water is added as a lubricant (see Joseph et al.
[1 997j]), but no literature exists on suppression of fouling with a protective
coating of colloidal particles or on self-lubrication of bitumen froth with
16
CA 02220821 1997-11-12
dispersed water containing colloidal clay particles. Self-lubricated flows are
lubricated by the coalescence of some of the dispersed water already in the
bitumen and it does not require external addition of water. The present
invention is an effective alternative to methods of pipelining viscous oil
requiring water addition, and it presents a new strategy for combating fouling.
13itumen froth is a very special kind of multi-phase material. It
combines properties of an oil continuous phase in which water is the
dispersed phase with properties of a water continuous phase, like oil-in-water
emulsions. In the usual oil-water mixture, dispersions of 20--40% water-in-oil
are very stable and very viscous with viscosities even higher than the oil
alone. However the froth is unstable to faster shearing which causes
produced water droplets to coalesce and form a free lubricating layer of free
produced water. In fact, tests indicate a tendency for droplets of produced
water to coalesce even under static conditions.
The unusual properties of bitumen froth with respect to the
coalescence of water droplets leading to self-lubrication has everything to do
with the fact that the produced water is a dispersion of small clay particles in
the water. The produced water is not clear, but has the gray color of clay, and
has a milky appearance. The milky appearance is persistent because the
small particles are colloidal size O(~u), held in suspension by Brownian
motions. The free milky water is roughly 20 - 30% by volume of the original
water dispersed throughout the sample; the volume fraction of the free water
relative to weight of the mixture defining the froth core is just a few percent.
CA 02220821 1997-11-12
The clay water inhibits the coalescence of bitumen froth and promotes
the coalescence of clay water drops through a mechanism which can be
calied "powdering the dough". Dough is sticky, but when you cover it with
flour powder, the dough loses its stickiness and is protected against sticking
by the layer of powder. The clay in the produced water is just like powder; it
sticks to and prevents the bitumen from coalescing. Zuata crude is much
more sticky than bitumen froth and it sticks strongly to glass and plastic
bottles filled with water, but not when combined with Syncrude's produced
water. Bottles filled with Zuata in the presence of clay water would readily
empty without stain when turned upside-down; this is very remarkable and
totally unexpected.
The action of the clay particles is very much like the action of
surfactants which are used to stabilize emulsions. Yan and Masliyan [1994]
have investigated the absorption and desorption of clay particles at the oil-
water interface. They note that it is generally accepted that hydrophilic
particles (clay) stabilize oil-in-water emulsions while hydrophobic solids
stabilize water-in-oil emulsions. The fine solids absorbed on the droplet tend
to act as a barrier, protecting the oil droplets from coalescing with one
another. They studied the effect of kaolinite clay particles on stabilization of
oil in water emulsions using a multilayer absorption model. As in the theory of
absorbed surfactants, absorption isotherms relating the bulk concentration to
the surface excess are important. They note that "..to obtain a stable solids-
stabilized oil in water emulsion, it is necessary for the droplets to be covered
by at least a complete monolayer of particles". This is like the CMC in which
the interface is fully saturated and cannot absorb more surfactant. Obviously,
18
CA 02220821 1997-11-12
enough clay must be in the water to fully cover the drop surface, to powder
the dough.
The water droplets are strongly stretched by shear forces at the
pipeline wall. The froth which is protected by absorbed clay particles is also
stretched, but it cannot coalesce or pinch off the droplets because of the
protective particle layer. This promotes the coalescence of the extending
droplets of produced water into sheets of lubricating water. The annulus of
produced lubricating water can work perfectly well between "powdered" froth
layers since these protected layers will not coalesce when touching. The
bitumen froth may therefore foul the pipe wall with a light layer of froth and still
not interfere with the smooth lubrication of the froth core because there is no
accumulation of fouling.
The idea suggested by self-lubrication of froth in clay water is that
fouling of pipe walls by heavy oils may be relieved by adding hydrophilic
solids of colloidal size to the water in a concentration above that necessary for
saturation of the oil water interface. The same type of colloidal particles which
stabilize oil in water emulsions (Tadros and Vincent [1983]) are believed to be
effective for reducing fouling. The particles must be hydrophilic, so that a
water layer will be retained between protected bitumen in touching contact, as
in particle stabilized oil-in-water emulsions. However, the particles cannot be
so oleophobic that they will not stick to the bitumen. Additives may be used to
create optimal conditions. For example, Yan and Masliyah [1996] have
shown a significant effect of the pH in water on the absorption of clay-on-oil in
oil-in-water emulsions.
1 9
CA 02220821 1997-11-12
Summary
The reduction of fouling of a pipewall by very viscous oil is promoted by
the protective coating of the oil by small particles. For example, one way of
preventing fouling is through the use of appropriate amounts of water
containing dispersed clay. ~itumen froth contains about 20 to 30% water in
which small clay particles are well dispersed. The froth is unstable to
shearing which leads to the coalescence of a portion of the water droplets to
form a lubricating layer of free water. The clay-containing water inhibits the
coalescence of bitumen froth, and promotes the coalescence of clay water
droplets through a mechanism called "Powdering the dough". The analogy is
that bread dough is sticky, but when flour is spread on it, the dough loses its
stickiness. The dough is protected from sticking by a layer of powder. The
clay in the produced water acts like flour, it sticks to and prevents the bitumen
in froth from coalescing. The role of the clay particles resembles the role of
surfactant in stabilizing emulsions. The fine solids surrounding an oil droplet
tend to act as a barrier protecting the droplets from coalescing with one
another. Thus the fouling of a pipewall by heavy viscous oil may be relieved
by the addition of hydrophilic solids of colloidal size to the water in a
concentration above that necessary for saturation of the oil water interface.
Moreover a pipe lightly fouled with protected oil would act to protect the fouled
wall from further fouling. This is a novel concept.
CA 02220821 1997-11-12
The specific embodiment of this invention was realized on successful
experiments on self-lubrication of bitumen froth run on a 1-inch diameter
pipeloop set up at the University of Minnesota, on a 2-inch diameter pipeloop
at Syncrude's hydraulic test facility and Syncrude's [1996] pilot study in a 24-
inch x 1 km pipeloop.
Example 3: An example of absence of pressure build-up in the 1-inch
diameter x 20 ft. Iong pipeline at the University of Minnesota is found in the
results of test 3. Test 3 was a 96-hour test of froth pumping in a continuous
operation. There was no build-up of fouling; the pressure gradients did not
increase. The test started in a pipeline fouled from previous tests; flushing the
pipeline with tap water did not remove the fouled oil on the wall. Figure 1
shows that the measured pressure at each tap is essentially the same for
interval (a) and (c). ~ is the volume fraction of the water.
The pressure gradients obtained during this test were nearly constant,
as illustrated in figure 2. The transients which are induced by taking samples
from the pipeline are short lived. These features show that the build-up of
pressure, which would occur if there was an accumulation of fouling, does not
occur.
CA 02220821 1997-11-12
s~npling poin~s ~4 hours ~n~ l rul~ fo~ 15m/s o~ck ~o Im/s fo~ 5 hours
50 -
~ 40 -
C_
" 30 ~'
~, P2
20 ~
C 5 10 ~ !5 20 25 30 35
t~m~ (ko~rl
- Figure 1. Co~ ~ison of the pressure history at each pressure tap for tests 3(a), 24 hours and 3(c), 5
hours. PO is the pressure at the pump outlet and Pl ,P2P3,P4 are located on the line. In this case,
~27%, U=l.O m/s and ~35'C. There is no evidence of increasing pressure gradients over time.
~p P4 Ll P3
pgL 4 ~_ L~ J
~ p I ~ p~.
3 -
2 ~ ,, , . . .
o , ....... .. ....
0 4 . 8 17 16 20 24
t~mc tholrr)
I:igure 2. D,".' .~ prcssure gradient ~P history between two .u.. c~ iv~ pressure taps in the
Lpg
forward ~ and return o legs of the pipeline for test 3 (b). Ll=L2=3.96 m. In this case, ~27%,
U=1.5 m/s and ~37'C.
CA 02220821 1997-11-12
At the end of interval (c) the velocity was dropped to 0.5 m/s, but the
pressure was so unstable, that after 20 minutes we raised it to 0.75 m/s;
pressure PO at the pump outlet jumped to 100 psi and the pipeline strongly
vibrated, driven by pressure oscillations. The speed was then immediately
raised to 1 m/s. The transient pressure PO at the outlet rose to 200 psi and the
pressures along the line were over 100 psi. This indicates some partial
blockage. After five minutes, the pressure reduced to normal values, 40--45
psi, at the pump outlet and the speed was raised to 1.25 m/s and kept for 19
hours. Then it was raised again to 1.75 m/s for other 19 hours.
Figure 3 shows the pressure distribution along the pipeline,
parameterized by the velocity U for test 3. Mean values of the pressure were
calculated for each tap at each velocity. The average temperatures of the
froth increased because of the frictional heating to around 42~C. It is possible
that some free water is re-absorbed into the froth at high temperatures as has
been suggested by Neiman [1986], who found that heating and water-dilution
affect the lubricating layer. Heated and unheated froth possessed a similar
headloss, which hardly changes, when the total separable water content in
the froth is increased above 35%.
23
CA 02220821 1997-11-12
60 \
'~ 50 - \
o ............. , ,,,,,, ,, , ,,,P~
o loo 200 300 400 500 600 700
Icn~h (i~:ch)
rigure 3. Pressure distr.bu;Lior, along ~e pip~!ine, p~ d by the v~locity U for test #3, 96
hours. PO is the pressure at the pump outlet and Pl .P2P3,P4 are loca~ed on the line, so Pl
corresponds to the tap closest to the pump and P4 to the farthest. In this case, ~21% and ~ varied
from 35 'C . for U=l.O m/s to 42 ~C, for U--1.75 m/s-
24
CA 02220821 1997-11-12
The water content of the froth used in test 4 is the highest (q~=40%) of all the
samples tested. The dimensionless pressure gradient record (included in an
internal report) for this watery sample shows more erratic behavior than less
watery samples. tlowever, the pressure levels are roughly those of other
samples with different water contents. Moreover, in this test and all the
others, there is again no evidence of a systematic increase of pressure which
could indicate accumulation of fouling.
Example 4: The concept of protection against pipe wall fouling was verified
in emptying tests from cylinders on a bench comparing clay water from
Syncrude's tailing pond and tap water with bitumen from two sources, namely,
Syncrude bitumen froth and Zuata bitumen from Venezuela. The bitumen
was loaded into the water cylinder and left to rest, then emptied. The walls of
the vessel never fouled when tailings water was used, but did foul when tap
water was used. A videotape of this experiment is available.
Example 5: In another experiment it was verihed that the clay water
promotes lubrication of froth from froth. Bitumen froth was sheared between
two 3-inch (75 mm) diameter glass parallel plates. One plate was rotating and
the other was stationary; water was released inside, fracturing the bitumen.
The internal sheet of water was sandwiched between two layers of bitumen,
which stuck strongly to the glass plates. The bitumen on the moving plate
rotated with the plate as a solid body. The froth fractured internally as a
cohesive fracture and not as an adhesive fracture at the glass plates. Some
of the water in the sandwich centrifuged to edges.
CA 02220821 1997-11-12
~xample 6: Data from all experiments using Syncrude's froth are
summarized in figures 4 and 5. The reduction of the pressure gradient that
can be maintained by the addition of colloidal clay to the water dispersed in
the bitumen froth is 10 to 20 times or less than that for water alone when the
froth temperature is between 49~ to 50~C and 10 to 40 times or less than
water alone when the temperature is between 35~to 47~C; the higher
temperature gives a larger reduction of pressure (figure 4). The reduction of
the pressure gradient appears to undergo a dramatic decrease at a critical
value of the velocity which is believed to be about 1.6 m/s. After this, the
mass flow of oil can be increased for only marginal changes of the pressure
gradient (figure 5).
26
CA 02220821 1997-11-12
.. 7.~ c , 4s_7 c ~ 5-t- s,~ C
.st ~5 C - 49-57 C . ~1-63 C o ~-.U C
100 ~ ' ' ' ' '
2~' ~c 2-
: ~ " 1 :
_
o
"~ o
'. O. I
0.01
0 100 . 1000 10'
U ~ . 7 5/Ro~ . 2 5
100 . . .... . . .... . . .... . .
. 24- ~c 2~
: ~ 35-47C
~ 10
c ~49-58 C
~/ /BI~slus
o
~ 0.1 ,~ /
0.01 ' ~ ' ~'' ' ' '
. 100 1 000 10'
(b) U'75JRol~5
Figure 4. Pressure gradient of bitumen froth 13 [Kpa/m] as a function of the ratio of the 7/4th power of the
velocity to the 4/5th power of the pipe radius, ~ ",. d by temperature. Left: 24' (0.om) diam~ter
pipeline; middle: 2"(50mm) diameter pipeline (Niemans' data); and right: 1"(25rnm) diarneter pipeline. (a)
All available data. (b) Fittings parallel to the Blasius correlation for turbulent pipeflow (bottom line), for
two temperature ranges: 33-47~C (top) and 49-5~~C (middle). Most of the 2"(50mm) diameter pipeline d r~
was ignored in th~se fits, due to its high scatter.
CA 02220821 1997-11-12
o u=O.~ ~lu'sx u=1.15 m~s c u=/./5 n~s
u=n 75 ~u= ~. ~S m/.~ . u= 7.0 ~1~r
=as ~R~S. ~=1.5 ~ .3 ~r~s
u=~.O n~sC u=1.6 ~ 6, u=J.0 "/~
100 , ... . .... . .... . .... . .
$ /~
/, ~/
/S~
- ~0.1 ~ ~
- O. I I 10 100 1000 IO'
t " ~ U l - 75/R-~I - 2 5
100 . ., ., .. , , . ,', .. . .... . .... .
~ I I
-
_ 10
, .
~0.1 ~
~ ~-u=1.6 ~! ~ U = 1.6~s(1J0.01 ....... .
. 0.1 1 10 100 1000 10
(b) U~ 75Mo~ 25
Figure 5 Pressure gradi~n~ of bitumen froth ~ [Kpalm] as a function of the ratio of the ;'/4th power of the
velocity to the 4/5th power of the pipe radius, p~, ~ I, > d by velocity. Left: 24"(0.6m) diameter pipeline;
middle: 2" diameter pipeline (Niemans' data); and right: 1" diameter pipeline. (a) All available data, enclosed
by the most p~cimictic (i) and least p~ccimictic (ii) predictions for 13 based on Blasius' formula, aTxl
ignoring the scatter in the 2"(5()mm) diameter pipeline data region . (b) r and ~ are predicted pressure
gradients ~, based on a velocity criterion, for the 24"(0.6m) diameter pipeline data and 1"(25mrn) diameter
pipeline data, respectively. Here the critical velocity is approximately Uc = 1 6 m/s
CA 02220821 1997-11-12
Successful protection of pipelines against fouling means that self-lubricated
flow can be maintained at reduced gradients over time without further addition
of water (figure 4). For successful protection of self-lubricated flow of water-
in-oil emulsions: -
1. Hydrophilic particles should be dispersed in the water;
2. The particles should readily stick to the oil;
3. The particles should be in a concentration in the water sufficientto cover the bitumen with at least a monolayer of particles (Yan
& Masliyah, 1994);
4. The reduction of the pressure gradient that can be maintained
by the addition of colloidal clay to the water dispersed in a
bitumen froth is 10 to 20 times or less than that for water alone .
when the froth temperature is between 49~ - 58~C, independent
of pipe diameters;
5. The reduction of the pressure gradient that can be maintained
by the addition of colloidal clay to the water dispersed in a
bitumen froth is 10 to 40 times or less than that for water alone
with the froth temperature is between 35~ to 47~C, independent
of pipe diameter (figure 4);
6. The pressure gradient associated with self-lubrication using
colloidal clay in the dispersed water scales with the ratio of the
7/4 power of the velocity of the 5/4 power of the pipe (figure 5);
and
29
CA 02220821 1997-11-12
7. At higher velocities greater than 1.6 m/sec, a further reduction in
the pressure gradient than that specified in point 6 can be
achieved.
Advantages
The advantage of promoting the lubrication of bitumen through the
addition of colloidal particles in the water is in the reduction of fouling leading
to reduction of pumping power necessary to overcome frictional losses. The
specific realization of these savings is for bitumen froth from the oil sands. In
this case, the clay water is produced naturally in the froth and costly additional
water injection is not required; the bitumen froth enters into self-lubricated
flow. The data for self-lubricated flow follows the Blasius law for turbulent flow
with the wall shear stress given by
K U7/4 _ ~ Ro ~ l )
where U is the froth velocity, Ro is the pipe radius, and ,~ is the pressure
gradient. ~igure 5.1 shows that the pressure gradient for bitumen froth is 10
to 20 times the pressure gradient for water alone when the froth temperature
lies between 49~ - 58~C and between 10 to 40 times the pressure gradient for
water alone when the temperature is between 35~ to 47~C. This is a pressure
gradient of the order of 1000 times smaller than the pressure gradient which
would be required if the flow was not lubricated and pipewall fouled with
bitumen.
CA 02220821 1997-11-12
Figure 5 gives the same data sorted by velocity and it shows that when
the velocity reached a critical velocity which is believed to be about 1.6 m/sec,
the pressure gradient grows much more slowly than is required by equation
(1)
References
~ Tadros, T. F., Vincent, B. in P. Becher, (Ed.), (1983) "Encyclopedia of
Emulsion Technology", Dekker, New York, 1:272.
~ Joseph D. D., Bai R, Renardy Y., (1997) Core-Annular Flows. Annual
Review of ~l~id Mechanics 13, 739.
~ Yan N., Masliyah J. H., (1994) Adsorption and desorption of clay particles
at the oil-water interface. J. Colloid Inte~ Sci. 168:386.
Yan N., Masliyah J. H., (1996) Effect of pH on the adsorption and
desorption of clay particles at oil-water interface. J. Colloidal Inteff. Sci.,
181:20.
CA 02220821 1997-11-12
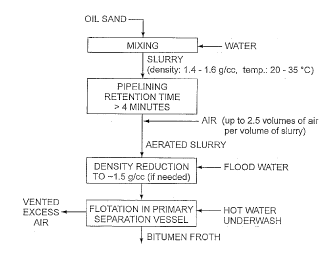
~I~LD OF TtlE INVENTION
2 This invention relates to a method for extracting bitumen from oil sand.3 More particularly it relates to mixing oil sand with water to produce a dense,
4 low temperature slurry, pipelining the slurry a sufficient distance to condition
the slurry, aerating the slurry and feeding the aerated slurry to a primary
6 separation vessel to cause fiotation of the bitumen and gravity separation of7 the solids, to thereby recover bitumen in froth form.
g BACKGROUND OF TtiE INVENTION
10= Oii sand, as known in the Fort McMurray region of Alberta, comprises
11 water-wetted sand grains having viscous bitumen flecks trapped between the
12 grains. It lends itself to separating or dispersing the bitumen from the sand
13 grains by slurrying the as-mined oil sand in water so that the bitumen flecks
14 move into the aqueous phase.
The bitumen in McMurray oil sand has been commercially recovered
16 for the past 25 years using the following general scheme (referred to as the17 "hot water process"):
18 ~ dry mining the oil sand at a mine site that can be kilometers from an19 extraction plant;
~ conveying the as-mined oil sand on conveyor belts to the extraction
21 plant;
CA 02220821 1997-11-12
feeding the oil sand into a rotating tumbler where it is mixed for a
2 prescribed retention time with hot water (80~C), steam, caustic and
3 naturally entrained air. The bitumen flecks are heated and become
4 less viscous. Chunks of oil sand are ablated or disintegrated. The
sand grains and bitumen flecks are dispersed or separate in the
6 water. To some extent bitumen flecks coalesce and grow in size.
7 They may contact air bubbles and coat them to become aerated
8 bitumen. The term used to describe this overall process in the
9 tumbler is "conditioning";
10= ~ the slurry produced is then diluted with additional hot water and
11 introduced into a large, open-topped, conical-bottomed, cylindrical
12 vessel (termed a primary separation vessel or "PSV"). The diluted
13 slurry is retained in the PSV under quiescent conditions for a
14 prescribed retention period. During this period, the aerated bitumen
rises and forms a froth layer which overflows the top lip of the
16 vessel and is conveyed away in a launder; and the sand grains sink
17 and are concentrated in the conical bottom - they leave the bottom
18 of the vessel as a wet tailings stream. Middlings, a watery mixture
19 containing solids and bitumen, extend between the froth and sand
layers. The tailings and middlings are withdrawn, combined and
21 sent to a secondary flotation process carried out in a deep cone
22 vessel wherein air is sparged into the vessel to assist with flotation.23 This vessel is referred to as the TOR vessel. It and the process
24 conducted in it are disclosed in U.S. Patent 4,545,892, incorporated
herein by reference. The bitumen recovered is recycled to the PSV.
33
CA 02220821 1997-11-12
The middlings from the deep cone vessel are further processed in
2 air flotation cells to recover contained bitumen.
3 It is important to note that the process temperature in the tumbler and
4 PSV is in the order of 80~C. This high temperature is used to reduce the
bitumen viscosity sufficiently so that it will readily separate from the sand and
6 coat the air bubbles in the aeration process. It also serves to enhance the
7 density difference between bitumen and water, which leads to more effective
8 flotation separation. The high temperature also promotes faster disintegration
9 of the oil sand lumps in the tumbler and faster coalescence of the bitumen
10= flecks in the PSV.
11 It is well understood in the industry that the quality of the oil sand has
12 very significant effects on the completeness of primary bitumen recovery in
13 the PSV and the quality of this froth (the froth from the PSV is termed
14 "primary" froth--that from the secondary circuit is termed "secondary" froth).
The quality of the useful oil sand produced from a mine will vary in grade.
16 The present invention is directed to establishing processes which are capable
17 of treating Ulow grade" and "average" oil sands to yield viable bitumen
18 recovery and froth quality at a lower energy input than the current commercial
19 processes. A "low grade" oil sand will contain between about 7 and 10 wt. %
bitumen. An average oil sand will contain at least 10 wt. % bitumen, typically
21 around 1 1 wt. %.
22 To be useful~ a new or modified process for extracting bitumen from
23 low grade and average oil sands should achieve a total recovery value falling
24 within the extraction recovery curve set forth in Figure 1.
34
CA 02220821 1997-11-12
A fairly recent and major innovation in the oil sand industry has
2 involved:
3 . supplying heated water at the mine site;
4 ~ mixing the dry as-mined oil sand with the heated water at the mine
site in predetermined proportions using a device known as a
6 "cyclofeeder", to form a slurry of controlled density having a
7 temperature in the order of 50~C;
8 . screening the slurry to remove oversize solids too large to be fed to
9 the pipeline;
~ pumping the screened slurry to the extraction plant through several
11 kilometers of pipeline; and
12 ~ feeding the slurry directly into the PSV.
13 This procedure relies on:
14 ~ the cyclofeeder successfully mixing the oil sand with the water in
pre-determined proportions at high rates while simultaneously
16 entraining some air within the slurry, thereby producing an aerated
17 slurry having a pre-determined density; and
18 ~ the pipeline providing ablation and retention time during which oil
19 sand lumps are disintegrated and bitumen flecks coalesce and coat
or attach to the air bubbles, so that the slurry is conditioned and
21 ready to go directly into the PSV and yield the required viable froth
22 yield and quality.
23 This innovation is disclosed in Canadian Patent No. 2,029,795 (Cymerman et
24 al) and United States Patent No. 5,039,227 (Leung et al), both assigned to the
25 present assignees and incorporated herein by reference.
CA 02220821 1997-11-12
The cyclofeeder operates on the principle of recycling part of the
2 produced slurry and introducing it tangentially into the vessel to produce a
3 vortex. The oil sand is delivered into the vortex. Water is added to the vortex,
4 to maintain the consistency of the slurry. An alternative to the cyclofeeder is
the trough system described in United States patent application No.
6 08/787,096, also incorporated herein by reference.
7 The innovation has enabled remote satellite mines to feed a central
8 extraction plant and has eliminated conveyors and tumblers from the process
9 equipment.
10= Another innovation was developed by the OSLO group of companies.
11 This process involves:
12 ~ mixing oil sand with unheated water at the mine site using a
13 dredging procedure to produce a low density, ambient temperature
14 slurry;
~ pumping this slurry through a pipeline to an extraction plant;
16 . adding air (1 to 1.5 volumes of air/volume of slurry) to the slurry in
17 the pipeline; and
18 ~ adding flotation aid chemicals (specifically a collector having the
19 characteristics of kerosene and a frother having the characteristics
of methyl-isobutyl-carbinol ("MIBC") ) to the slurry while in the
21 pipeline to assist in later flotation in a PSV.
22 This process is disclosed in a paper"Dredging and cold water extraction
23 process for oil sands" by W. Jazrawi, delivered at a seminar convened in
24 March,1990, by the Alberta Oil Sands and Technology Authority and United
States Patent No. 4,946,597 (K. N. Sury).
36
CA 02220821 1997-11-12
The OSLO process differs from the commercial hot water process and
2 the mixinglpipelining process in that it is carried out at ambient temperature.
3 Water at ambient temperature is used for slurry instead of expending energy
4 to heat water and then having to convey the hot water to the mine site in an
insulated pipeline
6 The Jazrawi paper describes testing slurries having densities of
7 25 wt. % and 50 wt. % by weight solids in a pipeline test facility. However, the
8 stated slurrying process, dredging, offers little control over slurry density and
9 no control over temperature. Dredged oil sand slurry typically has a density in
10= the order of 1.2 to 1.3 g/cc. At this order of density, the process may lose11 viability as a large volume of slurry has to be moved through the line and
12 processed to treat a specific quantity of oil sand. In addition the oil sand13 loading of the PSV surface area will necessarily be low, leading to the need14 for a very large PSV surface area:
The OSLO process also differs from the hot water process in that it is
16 thought that the bitumen flecks tend to attach to the air bubbles, rather than
17 coating them. The intimation is that, at low temperature, the bitumen is solid-
18 like rather than fluid in nature. The flotation aid chemicals are provided to
19 enhance the attachment mechanism. The Jazrawi paper indicates that the
dosage of flotation chemicals should increase as the grade of the oil sand
21 decreases.
22 With this background in mind, the present invention is now described.
CA 02220821 1997-11-12
SUMMARY 0~ THE IN\IENTION
2 In one broad aspect, the invention provides a process for extracting
3 bitumen from an average oil sand, comprising:
4 . drymining the oil sand;
~ mixing the as-mined oil sand with water in predetermined
6 proportions near the mine site to pFoduce a slurry having a
7 controlled density in the range 1.4 to 1.65 g/cc and a temperature in8 the range 20 - 35~C;
9 . pumping the slurry through a pipeline having a plurality of pumps
10= . spaced along its length, the pipeline being connected to feed a
11 primary separation vessel ("PSV");
12 ~ adding air to the slurry, preferably in the pipeline after the last
13 pump, in an amount up to 2.5 volumes of air per volume of slurry, to14 form an aerated slurry;
~ introducing the aerated slurry into the PSV, preferably so as to
16 provide an area loading greater than about 4.78 tonnes of oil
17 sand/hour/m2, and producing bitumen froth, tailings and middlings;
1 8 and
19 ~ separately removing the froth, tailings and middlings from the PSV.
Inherent in the process defined by this broad statement, the following
21 concepts are brought together:
22 ~ the oil sand is dry mined and mixed at the mine site with water
23 using means such as a cyclofeeder to produce a dense slurry
24 having a low temperature;
38
CA 02220821 1997-11-12
if the oil sand is of average or higher grade, we have discovered
2 that it can be processed in the form of a dense, low temperature
3 slurry, with aeration but ~,vithout addition of flotation aid chemicals,
4 to give viable primary bitumen recovery in the form of froth having
viable quality, and
6 ~ the dense, low temperature slurry can be fed at high loading into
7 the PSV and still produce the desired froth, thereby maintaining the
8 high density nature of the process.
9 Preferably, one or more of the following features are incorporated into10-- the basic process:
11 ~ operating the slurrying and pipelining steps at a density in the order
12 of about 1.6 g/cc and a temperature in the order of 2~~C;
13 ~ pumping the slurry through a pipeline having sufficient length so
14 that the retention time is at least 4 minutes, to achieve conditioning;
1~ ~ adjusting the density of the flotation step by adding flood water to
16 the slurry as it approaches the PSV to reduce its density to less
17 than 1.5 g/cc;
18 ~ venting excess air from the PSV through a vent stack extending into
19 the vessel contents; and
~ adding sufficient heated water as an underwash layer between the
21 froth and middlings in the PSV to ensure production of froth having
22 a temperature greater than about 35~C.
23 Inherent in the preferred process are the concepts of:
24 ~ operating the slurrying and pipelining steps at low temperature and
high density; and then
39
' CA 02220821 1997-11-12
:
~ moderating density at the PSV to promote effective flotation;
2 ~ using an underwash of hot water to heat the froth and enable it to
3 flow more easily; and
4 ~ modifying the PSV step to cope with the large air content in the
- slurry and minimize turbulence.
6 The best mode of the invention will be described below by way of
7 reporting on experimental tests.
8 The tests have demonstrated that:
9 . a well mixed, high density, low temperature slurry,
~ will condition adequately in a pipeline so as to yield viable primary
11 recovery of bitumen in the form of froth of viable quality without the
12 addition of flotation aid chemicals, and
13 ~ the froth can be heated to at least 35~C by use of a hot water
14 underwash in the PSV, thereby assisting in removing the froth from
the PSV and satisfying downstream froth temperature needs.
16 In another aspect of the invention, we have shown that the process as
17 previously described can successfully be applied to low grade oil sand,
18 provided that:
19 ~ flotation aid chemicals are added to the slurry in the pipeline; and
~ secondary recovery of bitumen by way of flotation with agitation and
21 submerged aeration is practiced.
~0
CA 02220821 1997-11-12
We have further found that use of the OSLO flotation aid mixture of a collector
2 (such as kerosene) and a frother (such as MIBC), works satisfactorily with the
3 low temperature, dense slurry and air addition to create a slurry which, when
4 sublected to pipeline conditioning, primary quiescent flotation and secondary
agitated and sub-aerated flotation, yields enough bitumen recovery to satisfy
6 the curve of Figure 1.
7 D~SCRIPTION O~ TtlE DRAWINGS
8 Figure 1 is a curve in the form of a band, showing viable bitumen
9 recoveries for various grades of oil sand;
10-- Figure 2 is a block diagram setting forth the process in accordance with
11 the invention, for use on average or higher grade oil sand feedstock;
12 Figure 3 is a schematic process flow diagram of a 100 tonne/hour-field
13 pilot circuit (hereinafter "100 tph circuit") used to demonstrate the average
14 grade version of the process;
Figure 4 is a side elevation of the cyclofeeder used in the 100 tph
1 6 circuit;
17 Figure 5 is a perspective view of the cyclofeeder of Figure 4;
18 Figure 6 is a top plan view of the cyclofeeder of Figure 4;
19 Figure 7 is a side elevation of the primary separator vessel ("PSV")
used in the 100 tph circuit;
21 Figure 8 is a top plan view of the primary separator of Figure 7;
22 Figure 9 is a side elevation of a second smaller separator ("SS~') used23 in the 100 tph circuit to test secondary recovery slurry loading;
24 Figure 9a is a top plan view of the SSV of Figure 9;
41
CA 02220821 1997-11-12
Figure 10 is a schematic process flow diagram showing the PSV and
2 SSV and the piping connected thereto;
3 Figure 11 is a schematic process flow diagram showing the pipeline
4 assembly used in the 100 tph circuit;
Figure 12 is a block diagram setting forth the process in accordance
6 with the invention, when practiced on low grade oil sand;
7 Figure 13 is a schematic process flow diagram of the 2 tonne/hour pilot8 circuit (hereinaffer "2 tph circuit") used to demonstrate the low grade version
9 of the process;
10- Figure 14a is a side elevation of the cyclofeeder used in the 2 tph
1 1 circuit;
12 Figure 14b is a top plan view of the cyclofeeder of Figure 14a;
13 Figure 14c is an end side view of the cyclofeeder of Figure 14a;
14 Figure 15 is a side elevation of the PSV used in the 2 tph circuit;
Figure 16 is a partial side elevation of the secondary recovery vessel,
16 referred to as the TOR ~tailings oil recovery), used in the 2 tph circuit.
17
18 D~SCRIPTION OF Tt~E PREF~RRED ~M~3ODIMENT
19 ~xample I--Pilot Demonstration
This example describes a run in a 100 tonne per hour of oil sand field
21 pilot circuit at optimum conditions, demonstrating the viability of the best mode
22 of the process when applied to average grade oil sand.
42
CA 02220821 1997-11-12
Summary
2 The feedstock was average grade oil sand containing 11.1 wt. %
3 bitumen and 6% fine solids < 44 ~L m. The process involved mixing of the oil4 sand and water in a cyclofeeder to produce a slurry having a density of about
1.55 g/cc. The temperature of the slurry was 26 - 27~C. The slurry was
6 conditioned by pumping it through a 102 mm diameter pipeline having a
7 length of 1.1 kilometers and retention time of about 4 minutes. Air was added
8 to the slurry in the pipeline just before the PSV to provide an air to slurry
9 volume ratio of about 1.5. The slurry was diluted with flood water prior to
10-- entering the PSV to modify the density to 1.4 g/cc. Hot water (80~C) was
11 injected as an underwash and raised the froth temperature to 33~C, adequate
12 for subsequent processing. The oil sand loading of the PSV was about 4.78
1 3 tonne/hr./m2.
1 4 Results
The average recovery achieved was about 98% bitumen on a reject
16 free basis, with a bitumen primary froth quality of about 59% bitumen, 21%
17 water and 20% solids based on weight.
18 Equipment and Conditions
19 The 100 tph circuit is shown in Figure 3. It comprised:
~ A pile 1 of as-mined oil sand,
21 ~ An oil sand feed system 2 comprising a front end loader 3, vibrating
22 grizly 4 for screening out or rejecting +12 inch lumps, a conveyor 5
23 for transporting the--12 inch oil sand, a second vibrating grizly 6
24 for receiving the--12 inch oil sand and rejecting the +4 inch material
~3
CA 02220821 1997-11-12
:
and a feed conveyor 7 for transporting the screened undersize to
2 the cyclofeeder;
3 ~ A cyclofeeder system 10 comprising a cyclofeeder 11, a source 12
4 of process water for supplying the cyclofeeder, a vibrating screen
13 for rejecting +1 inch oversize from the underflow from the
6 cyclofeeder and a pump box 14 for collecting the cyclofeeder
7 underflow. This cyclofeeder system 10 is described in United
8 States Patent No. 5,039,227. The cyclofeeder is shown in Figures
9 4, 5 and 6. The cyclofeeder system 10 is operative to mix oil sand
10-- and water, in pre-determined proportions, to create an oil sand
11 slurry having a controlled or pre-determined density. Some air is
12 entrained in the slurry during mixing. The cyclofeeder 11 was 1200
13 mm in diameter,1200 mm in height, and had a bottom cone
14 opening of 330 mm It discharged slurry onto a vibrating screen 13
having a single deck (0.9 m by 3.0 m) of woven wire mesh having
16 an opening size of 25 mm. Hot water at 80~C was sprayed onto the
17 screen to prevent blinding. Slurry was pumped and recycled from
18 the pump box 14 to the cyclofeeder 11 through line 15 to maintain a
19 steady vortex in the cyclofeeder. The weight ratio of recycle flow to
pipeline flow was approximately 3:1;
21 ~ Aslurrypipeline20, shown in Figures 3 and 11. Itwas designed to
22 operate at an oil sand feed rate from 75 to 100 Vh. It consisted of a
23 series of six sections, with a total length of up to 3 km. Two pumps
24 21 powered each section. The slurry velocity within the pipeline
was between 2.5 and 3.5 mls;
44
CA 02220821 1997~ 12
:
~ An air and dilution water addition system. Air from a compressor 31
2 was injected into the slurry about 360 meters before the end of the
3 pipeline through a 37 mm diameter nozzle having 5 mm diameter
4 orifices. The diameter of the pipeline at the air injection point was
increased to 150 mm to accommodate the increased stream
6 volume. Flood water was also added, if required, from a source 30
7 to the slurry just downstream of the air addition point, to modify the
8 . slurry density. The diluted and aerated slurry was retained in the
9 pipeline for about 2 minutes following addition;
~ A primary separation vessel 40 ("PSV"). This vessel is shown in
11 Figures 7 and 8. Associated with it were an underflow pump 41 and
12 a froth weighing system 42. The PSV had a diameter of 5.18 m in
13 the cylindrical section. The vessel was of the deep cone type
14 (angle of cone 60~). The vessel had a central feed slurry distributor
43. This was a 0.92 m diameter pipe having openings in its side
16 wall. A vent stack 44 extended up from the distributor, for venting
17 excess air from the entering slurry; to reduce turbulence. A froth
18 underwash pipe 45 extended down into the vessel chamber 46 and
19 extended horizontally around the vent stack just below the expected
level of the froth/middlings interface. The froth underwash ("UM/')
21 pipe had four outlets 47 for injecting heated underwash water into
22 the vessel chamber. The froth UJW pipe vertically entered the PSV
23 1295 mm from the vessel center. The feedwell radius was 460 mm
24 and the vessel radius was 2590 mm. The water exited the outlets
47 870 mm below the froth overflow lip elevation. The
~5
CA 02220821 1997-11-12
froth/middlings interface generally stayed 250 to 500 mm above the
2 UNV outlets 47. The tailings left the vessel through a bottom outlet
3 48. Middlings could be withdrawn through pipe 49 - however this
4 was not done during the tests described herein. The froth
overflowed into a launder 50 and was conveyed into the box of a
6 truck ~1 standing on a weigh scale for measuring froth production
7 rate;
8 ~ A secondary separation vessel 60 ("SSV"). This vessel is shown in
9 Figures 9 and 9a. The SSV has been shown because it was used
1 Q in a vessel loading experiment described hereunder. It was also
11 operated in these runs, but was found to be unnecessary because
12 its recovery was negligible. It was also a deep cone vessel having
13 similar internals to the PSV. It was smaller, being 3.66 m in
14 diameter and having a cone angle of 60~. It was equipped with a
tailings outlet 61, middlings remov~l pipe 62, launder 63, underflow
16 pump 64, froth weighing means 65, slurry distributor 66, vent stack
17 67, and underwash pipe 68, substantially in accordance with the
18 PSV. The underflow slurry from the PSV was mixed with air in line
19 69 using an in-line aeration nozle similar to that of the pipeline 20.
The PSV underflow slurry was conditioned through 180 meters of
21 150 mm diameter line 69 and then introduced into the SSV for
22 additional bitumen recovery. The underflow from the SSV was
23 discarded in a pit. The froth produced was deposited into the box of
24 a truck 70 standing on a weigh scale;
~6
CA 02220821 1997-11-12
~ The pilot plant was equipped with instrumentation to measure flow
2 rate, temperature and density of all process streams The signals
3 from the instruments were fed to an Allen Bradley 5/40 E
4 Programmable Logic Controller ("PLC"), which was used for all
process control functions except oil sand and chemical rate control.
6 A Man Machine Interface ("MMI"), comprising a PC based sys~em
7 using Intellution Fix DMACS, was provided for data logging and
8 trending. A Ramsey mechanical belt weigh scale was used to
9 measure oil sand feed rate to the cyclofeeder. Samples were taken
10= of the following streams for material balances: oil sand; cyclofeeder11 screen rejects; pipeline exit slurry; PSV froth; PSV underflow; SSV
12 froth; and SSV underflow. Samples were analyzed for density,
13 OWS, PSD, froth aeration and froth viscosity.
14 Conditions and Results
1~ The conditions and averaged results of a series of 6 runs are now set
16 forth in Tables I and ll, now set forth.
47
CA 02220821 1997-11-12
TABLE I
2 DEMONSTRATON RUN CONDITIONS--AVERAGE GF'ADE.OIL SAND
Oil Sand Feed Vh 101
Pipeline Length Km 1.1
Pipeline: No. of Pumps 6
4" Pipeline Inlet ~C 26
temperature
4" Pipeline Outlet ~C 27
temperature
4" Pipeline Veiocity m/s 3.0
4" Pipeline Feed Density kg/m3 1548
Pipeline Air to Siurry vol/vol 1.5
Ratio
MIBC ppm oil sand 0
i-iydrocarbon additive ppm oil sand 0
Vessel Selection PSV
(PSV,SSV)
Separation Circuit PSV only
PSV Feed Density, kg/m3 1402
excluding Air
PSV Slurry Feed ~C 24
Temperature
PSV Underwash/Oil % 8
Sand Ratio
PSV Underflow Density, kg/m3 1410
exc. Air
SSV Air to Slurry Ratio vol/vol
SSV Slurry Feed ~C 29
Temperature
SSV Underwash/Oil % 6
Sand
48
CA 02220821 1997-11-12
.
TABLE ll
2 Demonstration Results--Average Grade Oil Sand
Rejects (Based on Oil Sand Rate) % 2.5
Rejects ~3itumen Loss (Based on Oil Sand Feed) % 1.4
PSV Bitumen Recovery (Based on PSV Feed) % 98.1
PSV Froth ~itumen % 59.1
PSV Froth Soiids % 20.2
=
PSV Underflow ~3itumen Loss (Based on PSV Feed) % 1.9
PSV Underflow Bitumen - % 0.1
PSV Underflow Solids % 46.7
The foregoing data provide the conditions used and results obtained in
6 a group of runs which were averaged, the runs having been carried out on
7 average oil sand at selected conditions in the pilot plant. A number of other
8 runs were carried out with varied conditions and are supported by a
9 substantial body of experimentation at laboratory bench and 2 tonne/hour
pilot scales. From this overall program, we have established:
49
-
CA 02220821 1997-11-12
~ That the density of the mixed slurry introduced into the pipeline
2 should be in the range 1.4 to 1.65 g/cc. If the density is less than
3 about 1.4 g/cc, the system has reduced oil sand capacity. If the
4 density is greater than about 1.65 g/cc, the pipeline operation is
characterized by high head loss and a potential for sanding out and
6 plugging;
7 ~ That the temperature of the mixed slurry issuing from the pipeline
8 should be in the range 20 - 35~C. If the temperature is less than
9 about 20~, bitumen recovery will be lower. If the temperature is
greater than about 3~~C, the system is wasting energy;
11 ~ That the aeration ratio should be up to about 2.5, preferably 1 - 2.5,
12 volumes of air per volume of slurry. If the raUo is less thari 1,
13 bitumen recovery may be reduced. There is no improvement if the
14 ratio is increased above 2.5.
15 ~xample ll--~ffects of Chemical Addition
16 This example demonstrates that the process of the invention can be
17 practised on average oil sand without the use of flotation aids to yield viable
18 bitumen recovery as primary froth of viable quality.
19 The pilot circuit described in Example I was used.
Runs with and without flotation aid chemicals were carried out for
21 comparison. The relevant conditions and results are set forth in Table lll now
22 following:
SC~
CA 02220821 1997-11-12
TABLE lll
2 EFFECTS OF CHEMICAL ADDITION--AVERAGE GRADE OIL SAND
MIBC, ppm oil sand o 33
Hydrocarbon additive, ppm oil sand 0 27
4" Pipeline Inlet Temperature, ~C 26 25
4" Pipeline OutletTemperature, ~C 27 27
4" Pipeline Feed Density, kg/m3 1548 1526
Pipeline Air to Slurry Ratio, vol/vol 1.5 1.5
PSV Feed Density, excluding Air, kg/m3 1402 1402
Rejects (Based on Oil Sand Rate), % . 2.5 11.8
Rejects Bitumen Loss (~3ased on Oil Sand Feed), % 1.43 7.10
PSV Bitumen Recovery (Based on PSV Feed), % 98.1 97.8
PSV Froth Bitumen, % 59.1 62.0
PSV Froth Solids, % 20.2 . 18.9
PSV Underflow Bitumen Loss (Based on PSV Feed), % 1.9 2.2
PSV Underflow Bitumen, % 0.1 0.1
PSV Underflow Solids, % 46.7 45.5
4 Example lll - Loadinq
This example demonstrates that the process is amenable to high
6 loading of the PSV with slurry having high density. Two runs were carried out
7 in the pilot circuit of Example 1, using the large PSV 40 in one run and the
8 smaller SSV 60 in the other run as the primary separation vessel. As the
9 vessels had different surface areas, the runs involved "low" and "high" oil sand
1 0 loading.
51
CA 02220821 1997-11-12
The relevant conditions and results are set forth in Table IV and V now
2 following:
3 TABLE IV
4 PSV LOAD ING COMPARISON
Parameter Pilot Pilot
Vessel Vessel
40 as 60 as
PSV PSV
PSV DIAMETER M 5.18 3.66
Oil Sand Rate (After Rejects) Vh 97.6 97.6
Oil Sand Loading Vh/ft2 0.44 0.91
Uh/m2 4.78 9.91
Solids Loading . Vh/m2 4.06 8.42
Bitumen Loading Vh/m2 0.~3 1.09
~2 . .... .
CA 02220821 1997-11-12
TABLE V
2 LOADING STUDY RESULTS--AVERAGE GRADE OiL SAND
PSV Vessel 40 Vessel 60
Rejects (Based on Oil Sand Rate) %, 2.5 3.0
Rejects Bitumen Loss (Based on Oil Sand % 1.4 1.8
Feed)
PSV Bitumen Recovery (Based on PSV % 98.1 96.6
Feed)
PSV Froth Bitumen % 59.1 61.8
PSV Froth Solids % 20.2 19.9
~- PSV Froth Solids/Bitumen ratio % 0.34 0.32
PSV Underflow Bitumen Loss (Based on % 1.9 3.4
PSV Feed)
PSV Underflow Bitumen % 0.1 0.2
PSV UnderflowSolids % 46.7 45.3
CA 02220821 1997-11-12
~xample l~l--Low Grade Oil Sand
2 This example demonstrates that low grade oil sands can successfully
3 be processed using the mixing/pipelining/flotation procedure with low
4 temperature dense slurry, provided that:
. Flotation aid chemicals (hereinafter"flotation aids") are used; and
6 ~ The underflow tailings from the PSV are subjected to secondary
7 recovery using submerged aeration and agitation.
8 Feedstock
9 The low grade oil sand feedstock contained 8.2% bitumen and had an
10= average fines content of 33% (less than 44~Lm).
11 Circuit
12 The feedstock was processed in a 1 -2 tonnes/hour pilot circuit (see
13 Figure 13). This circuit comprised a vibrating grizzly (not shown) with 3" x 4"
14 openings, for removing oversize material from oil sand feed. The product wasdelivered into a cyclofeeder 101 by a conveyor 102. Water was introduced
16 from a source 103 into the cyclofeeder through line 104. The cyclofeeder
17 comprised a vessel 105 20 inches in diameter. The bottom cone 106 had an
18 angle of 30 degrees with the horizontal. The cyclofeeder discharged onto a
19 double deck vibrating screen 107. The top deck of the screen had 2 inch
square openings and the lower deck had 3/8 inch square openings. The
21 screened slurry dropped into a pump box 108. Part of the slurry in the pump
22 box was pumped and recycled via the line 109 back into the cyclofeeder, to
23 maintain the vortex therein. The remainder of the slurry in the pump boX was24 pumped through line 111 to a pipeline loop 112. Flotation aids could be
injected from sources 114, 114a into line 111. The pipeline loop was 2 inches
5~ -
CA 02220821 1997-11-12
in diameter and had a iength of 47 meters. It comprised a chiller 11~ for
2 cooling the slurry if required. The slurry delivered through line 111 was
3 pumped through the loop 112 by pump 200. The slurry leaving the loop was
4 transferred through line 115 to the PSV 117. Flood water could be injected
from a source 1 18 into line 1 15. Air at 7~ psi could also be injected as
6 bubbles into line 115 from a source 119. Aerated slurry residence time in the
7 line 11~ was about 20 seconds. The aerated slurry was introduced into the
8 PSV 117 using a feedwell equipped with a chimney. The PSV 117 is shown
9 in Figure 15 and comprised a deep cone vessel 121 having a cylindrical upper10= section and conical lower section. The vessel 121 diameter was 800 mm.
11 tlot water from a source 122 could be introduced through an underwash pipe
12 123 centrally located just beneath the expected froth/middlings interface. A13 central vent stack 124 was provided to allow excess air to escape and reduce14 turbulence in the vessel. Froth overflowed into a launder 12~. The froth
flowed down a trough 126 into primary froth weigh tanks (not shown). The
16 PSV was operated as a two phase separator, producing a froth and a tailings
17 underflow. The PSV underflow was fed through line 128 to a TOR vessel
18 129, for additional bitumen recovery. The TOR vessel is shown in Figure 16.
19 It was equipped with an agitator 130 supplied with air through a line 131, for
20 producing air bubbles. It was also operated as a two phase separator,
21 producing a froth and a tailings underflow. The TOR underflow was pumped
22 to a tailings weigh tank (not shown) as the hnal tailings stream.
~'
CA 02220821 1997-11-12
A series of runs were carried out wherein:
2 . MlBC/kerosene dosage;
3 ~ Air/slurry volume ratio; eznd
4 ~ Underwash water/oil sand feed ratio,
were varied, to determine their effect on bitumen recovery.
6 Conditions and Results
7 The low grade oil sand process target conditions were:
8 . Pipeline slurry density--1.60 g/cc
9 ~ Pipeline slurry temperature - 25~C
~ Pipeline residence time - 8 rrlinutes
11 . Pipeline slurry velocity--3/ms
12 . Oil sand target feed rate - 1.5 tph
13 . Froth underwash water target temperature - 70~C
14 ~ TOR air addition rate--120 SCFH at 48 psi.
15 The remaining experimental conditions are set forth in Table Vl, together with
16 the run results.
CA 02220821 1997-11-12
.
~~ N ~ 1-- ~ O tD C~ C~ ~n O Lr)
o~ 0 o 1~ a~ o 1~ ~~ a~
-
~ _ .
a~ ~ 0 ~ 1~ co ~ 1~ ~a) ~ ~N N
~ S co O 0:) ~ CD U~ ~) CJ)~ ~ N O 0~ 1--
5~ L U~ N N CO N o~tD C~)~5) (~ (D l I I tD
~ g ~ ~ ~ ~ '~ ~o ~o ~ ~ ~~ In ~ ~ ~~
U2~ o cl~ a> 0 o ~ ~)~D ~ ~N u~ ~S) Ll') t~)
o l ~o CJ~ ~0 ~D
os ~ ~ ~ ~ ~ ~ o ~ ~ ~ o~ ~
o ~~ o u~ ~ ~ ~ ~ ~ ~ u~to ~ a~ ~D
,, ~ 5 ~ ~ ~ ~ ~ ~ o ~ ~ ~ ~ ~ ~ ~ ~ ~
o~ ~ ~ O O ~ tD C~ 0 U~ O C~
L~ 0 a~ ~ ~ 0 ~ a~ ~no ~i ~ 0 c~
u~ o
c" S ~i C~ ~i ~ ~ ~C~ ~ ~~ ~ o o o
~ .
--~O~ ~ ~ CD O 0 0 ~ I O~ a~
~:5 0 c~i ~ ~ o ~i CD 0
O~ r- ~ co ~ o c~ u~ o~ ~ c~ o
0 ~ ~ r~ CD O ~~) ~ O ~
-
_
f~ 0 0 0 0 r~
--o o o o o o o o o o oo o oo o
_ o
o ~ ~ C~ ~ o o o o
o~Y ~ ~ ~ ~ ~ o o ~ ~ ~ C~
C~
.' c ~ F
) o Q ~_ I I Lr) U') C~ ~I ~1 0 0 t-- O O
Q U~ ) c~ o o ~ o o
o
C 2~
> LL a) ~ O O O C;~ C~ o Cl~ 0 0 cn 0 cn o o o
C
tn r-- 0 C~ ~ = ~ '~
~ .
CA 02220821 1997-11-12
The following observations can be made with respect to the
2 experimental results:
3 ~ The process was effective in achieving bitumen recovery as high as
4 90 76% (see run 2);
~ The use of chemical flotation aids (MIBC and kerosene) was found
6 to be necessary for the low grade oil sand (see runs 11 and 2);
7 . PSV, TOR and combined froth bitumen content were inversely
8 related to air/slurry volume ratio (see runs 6, 9 and 10),
9 ~ Increasing PSV froth underwash rate improved bitumerl recovery
10= (see runs 2 and 12).
11 Example V
12 This example demonstrates that use of mechanical agitation in the
13 secondary recovery TOR vessel gives better recovery than is experienced
14 without agitation.
1~ Table Vll compares the average bitumen recoveries obtained with the
16 100 tph circuit of Example I with the 2 tph circuit of ~xample l\/, using low
17 grade oil sand as the feed. For the 100 tph circuit, the secondary separation
18 vessel was a gravity settling vessel, whereas for the 2 tph circuit, the
19 secondary separation vessel was a TOR vessel with a mechanical agitator.
20 The results are set forth in Table Vll.
~ CA 02220821 1997-11-12
TA~3LE VlI
2 RECOVERY COMPARISON FOR 100 tph
3 . AND 2 tph CIRCUITS
Average Recovery, %
Circuit PSV SSV or TOR Combined
100 tph circuit 52.7 7.6 60.3
2 tph circuit 35.2 44.5 79.7
6 It will be noted that a significantly higher combined bitumen recovery was
7 obtained from the 2 tph circuit than from the 100 tph circuit, because a
8 significant amount of this recovery was achieved from the secondary recovery
9 in the 2 tph circuit. The average secondary and combined bitumen recoveries
were 8 - 12% and 60--68%, respectively, for the 100 tph circuit and 35--
11 45% and 75--80%, respectively, for the 2 tph circuit.
.. : ~