Note: Descriptions are shown in the official language in which they were submitted.
CA 02237277 1998-OS-08
1 ROOM TEMPERATURE CONTROL
APPARATUS HAVING FEEDFORWARD
3 AND FEEDBACK CONTROL AND METHOD
4
6
7
g FIELD OF THE INVENTION
9 The present invention generally relates to control systems, and more
particularly to control systems that are used in heating, ventilating and air
conditioning fluid
11 distribution systems.
12 BACKGROUND OF THE INVENTION
13 Fluid distribution systems associated with heating, ventilating and air-
14 conditioning (HVAC) distribution systems are well known in the art, and are
widely used in
i5 commercial applications, including apartment buildings and office
buildings, for example.
1
CA 02237277 1998-OS-08
1 Such systems also see widespread use in laboratory-type settings, and in
such an
2 implementation, the HVAC system must not only control the temperature of the
air in the
3 building, but must also exhaust potentially noxious fumes, particularly if
the building has a
4 number of laboratory fume hoods in which experimental work is being carried
out. Another
implementation that has additional important considerations in addition to
controlling the
6 temperature of the air in the building involves clean room environments
where
7 manufacturing of electronic integrated circuits and the like is carried out.
In both of these
8 latter implementations, the pressure of a room of interest may have to be
controlled to be
9 different from the space or rooms adjacent to the room of interest. In the
case of the clean
room environment, the room of interest must be maintained at a differential
pressure higher
11 than the surrounding space to insure that contaminates do not enter the
room. In the case of
12 the laboratory environment, the room of interest is kept at a differential
pressure less than the
13 surrounding area to contain any noxious fumes in the room.
14 It is also of primary importance to maintain the temperature within the
room
1 S of interest at the desired value, while maintaining the room of interest
at a desired differential
1G pressure relative to the surrounding area. The HVAC system must be capable
of controlling
17 the flow of air into the room, and the flow of air being exhausted from the
room, and must
18 take into consideration any other air flow into and out of the room. Given
the temperature
19 control requirements that must be maintained in the room, it becomes a
complicated control
problem that is not easily solved.
21 While variable air volume (VAV) control equipment has been used for
22 providing a control strategy for the implementations discussed above, and
such control
23 equipment has utilized a combination of feedforward and feedback control
methodology,
24 there continues to be a need for an effective control apparatus that
provides improved
performance, ease of implementation and cost effectiveness.
2
CA 02237277 1998-OS-08
1 SUMMARY OF THE INVENTION
2 It is therefore a primary object of the present invention to provide an
improved
3 room temperature control for heating and cooling apparatus having
feedforward and
4 feedback control strategies and a method of controlling such apparatus.
Another object is to provide such an improved controller which provides
6 superior performance, notable ease of implementation and significant cost
effectiveness.
7 A related object is to provide such an improved controller which includes a
8 feedforward control strategy that generates a control signal based on
control set points and
9 identified characteristics of the system, and which adaptively adjusts such
set points based
on changes that are measured with respect to the identified characteristics.
11 Still another object is to provide such an improved controller in which the
12 feedforward control strategy uniquely employs the physical laws of
conservation of energy
13 and mass to determine control set points that are employed in the
feedforward control
14 strategy.
Yet another object is to provide such an improved controller which utilizes a
16 general regression neural network (GRNN) to identify the characteristics of
the system,
17 which results in simple, robust and excellent capability in system
identification, with minimal
18 computational time.
19 Another object is to- provide an improved control system which includes
such
a feedforward process as well as a feedback process to generate a control
signal, with the
21 combination of such processes providing superior performance in many
respects.
22 These and other objects will become apparent upon reading the following
23 detailed description of the preferred embodiment of the present invention,
while referring to
24 the attached drawings.
3
CA 02237277 1998-OS-08
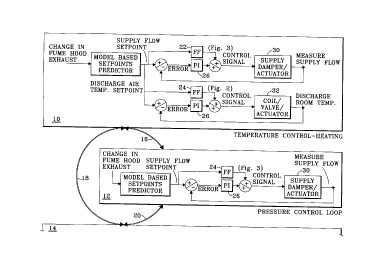
1 DESCRIPTION OF THE DRAWINGS
2 FIGURE. 1 generally depicts, in block diagram form, a controller embodying
3 the present invention and also related control functionality.
4 FIG. 2 generally depicts, in block diagram form, one embodiment of the
feedforward control strategy identified in FIG. 1 that is employed for
controlling a water
6 heating coil and water flow control valve.
7 FIG. 3 generally depicts, in block diagram form, another embodiment of the
8 feedforward control strategy identified in FIG. I that is employed for
controlling an air
9 damper/actuator.
FIG. 4 generally depicts, in block diagram form, one embodiment of the
11 feedback control strategy identified in FIG. 1.
12 FIG. 5 generally depicts, in block diagram form, another embodiment of the
13 feedback control strategy identified in FIG. 1.
14 FIG. 6 is a chart of normalized flow rates versus normalized control
signals for
a simulated valve having an authority a of 0.1 based on representative
smoothing factors a
16 for identification using the GRNN method.
17 FIG. 7 is a chart illustrating predicted heat load for a room using various
18 techniques.
19 FIG. 8 is a chart of normalized flow rates versus normalized control
signals for
a simulated valve based upon representative valve authorities between 1 and
0.01 for
21 identification using the GRNN method.
22 FIG. 9 is a chart comparing simulated and predicted control signals for a
valve
23 having an authority between 1 and 0.01 using the GRNN method.
24 FIG. 10 is a chart of normalized supply flow rates versus coil
effectiveness for
a simulated coil for identification using the GRNN method.
26 FIG. 11 is a chart of normalized flow rate versus normalized measured
control
4
CA 02237277 1998-OS-08
1 signal for a damper for identification using the GRNN method.
2 FIG. 12 is a chart illustrating the operation of the pressure control
sequence for
3 a fume hood exhaust application.
4 FIG. 13 is a chart illustrating the room differential pressure response
comparing
the performance of Models 1 and 2.
6 FIG. 14 is a chart illustrating the operation of the temperature control
cooling
7 sequence for a fume hood exhaust application, and particularly shows the
rate of heat
8 generation and flow rates versus time.
9 FIG. 15 is another chart illustrating the operation of the temperature
control
cooling sequence for a fume hood exhaust application, and particularly shows
the rate of rate
11 of heat generation and flow rates versus time.
12 FIG. 16 is a chart illustrating the operation of the temperature control
heating
13 sequence for a fume hood exhaust application, and particularly shows the
rate of heat
14 generation and flow rates versus time.
FIG. 17 is another chart illustrating the operation of the temperature control
1G heating sequence for a fume hood exhaust application, and particularly
shows the rate of rate
17 of heat generation and flow rates versus time.
18
19 DETAILED DESCRIPTION OF A PREFERRED EMBODIMENT
Broadly stated, the present invention is directed to a controller and method
of
21 determining a control signal that uses a combined feedforward and feedback
control method
22 for controlling the temperature during heating for HVAC systems generally,
and particularly
23 for laboratory rooms. Although a laboratory room implementation will be
specifically
24 described herein, the proposed control topology and results are valid for
cleanroom
applications where pressure is kept higher than the adjacent space to prevent
any
26 contaminants to flow into the room of interest from the outside.
5
CA 02237277 1998-OS-08
1 The controller utilizes a combination of feedforward and feedback control as
2 shown in the block diagram of FIG. 1, which includes three distinct control
loops, namely:
3 a temperature control loop for heating, identified generally at 10 and
embodying the present
4 invention; a pressure control loop, indicated generally at 12; and a
temperature control loop
S for cooling also embodying the present invention, indicated generally at 14.
The three loops
6 are functionally interconnected as shown by lines 16, 18 and 20, and all
loops are preferably
7 implemented in a processing means, not shown, such as a microprocessor or
the like.
8 With regard to the temperature control-heating loop 10 embodying the present
9 invention, its control sequence is shown in FIGS. 16 and 17. In most
variable air volume
(VAV) applications, the supply air that is .fed into a laboratory space has a
constant
11 temperature of about 55°F. Based on the normal design cooling load,
the supply volumetric
12 flow rate is selected to maintain the specified room temperature, usually a
value between
13 about 70 and 75°F. To maintain the differential pressure it is
necessary that the minimum
14 total laboratory exhaust exceed the supply flow rate due to the fume hood
sash opening, the
supply flow rate also increases accordingly. The new supply flow rate at a
constant 55
1G degree F may exceed the requirement of the cooling demand. The room
temperature may
17 therefore drop below the set point. This sequence requires the local reheat
valve to open and
18 increase the supply air temperature to keep the room temperature set point.
The coupling
19 between room pressure and thermal constraints is complex.
With regard to the pressure control loop 12, room pressure is typically
21 controlled in terms of a differential instead of an absolute value. The
differential is defined
22 as a difference between a reference space, i.e., an adjacent corridor and
the room itself. For
23 a laboratory room application, the goal is to keep the differential
pressure positive within a
24 range of about 0.005 to 0.05 w.c. This assures that the room pressure
remains lower than the
adjacent pressure under all operating conditions, and prevents air from
leaking into adjacent
26 spaces. For a clean room application, the pressure in the room is
maintained at a higher
6
CA 02237277 1998-OS-08
1 differential pressure than adjacent space to prevent leakage into the room.
2 There are three common methods of room pressure control in use today,
3 including direct pressure, flow tracking and cascaded control. Each of these
schemes
4 essentially modulates the supply flow in order to maintain the room
differential pressure.
Hence, a simple sequence is considered to assess the performance of different
control
6 methods for pressure control. For a laboratory control application having
fume hoods in the
7 room, a step change in the fume hood exhaust requires modulation of the
supply air flow to
8 maintain the differential pressure set point.
9 The pressure control sequence used in the present invention is shown in FIG.
12. As indicated in FIG.12, from a steady state condition, the fume hood
exhaust jumps to
11 a maximum value as the hood sash is opened. As a result, the laboratory
room pressure
12 decreases, which makes the differential pressure go higher. The control
loop 12 then senses
13 the deviation between the actual differential pressure and the set point
and opens the supply
14 flow to return the set point.
With regard to the temperature control-cooling loop 14, its control sequence
16 represents temperature control as a result of cooling needs. 'fhe rate of
internal heat
17 generation is the primary disturbing force that activates this sequence.
The internal rate of
18 heat generation can increase by many fold due to other activities in a
laboratory, such as
19 autoclaves, ovens and occupancy. When the internal generation suddenly
increases, the
ZO room temperature rises. The only cooling source available is the supply air
stream at 55 °F.
21 However, the supply flow cannot be increased unless the exhaust flow is
also increased in
22 order to maintain the differential pressure constraint. But the laboratory
exhaust flow cannot
23 be increased because that will upset the laboratory room pressure. To
circumvent this
24 problem, another source of the exhaust, i.e., the general exhaust, is
opened to allow an
increased supply flow. As is shown in FIGS. 14 and 15, by artificially
increasing the total
26 laboratory exhaust, both room temperature and the pressure set points are
maintained.
7
CA 02237277 1998-OS-08
1 Each of the control loops 10, 12 and 14 has feedforward blocks 22 and/or 24
2 which are shown in the block diagrams of FIGS 2 and 3, respectively. The
block diagram
3 of FIG. 2 is for the feedforward control of a heating coil, while the block
diagram of FIG. 3
4 is for the feedforward control of a damper which may be used in the
temperature control-
s heating loop, temperature control-cooling loop and for the pressure control
loop. Similarly,
6 feedback blocks 26 are identified in the control loops 10, 12 and 14 and the
block diagram
7 for each of these feedback blocks is shown in FIG. S or FIG. 4.
8 It should be understood that the block diagram of FIG. 2 includes a physical
9 system block 28 which is intended to diagrammatically show coil and valve
actuator 32, and
temperature sensors, that are used in the operation of the controller, and
which are described
11 hereinafter in detail. Also, the block diagram of FIG. 3 has a physical
system block 29
12 which is intended to diagrammatically show the pressure measuring means and
flow
13 measuring means that are used in the operation of the controller.
Similarly, control loops 10,
14 12 and 14 have a supply damper/actuator block 30 which is intended to
diagrammatically
illustrate the supply damper and actuator associated with the air supply duct
to the room that
16 is being controlled. Also, control loop 10 has a coil/valve actuator block
32 that is intended
17 to diagrammatically illustrate the circulating water heating coil and water
valve for
18 controlling the flow of water through the heating coil, it being understood
that the coil is
19 located in the air supply duct so that the coil is adapted to heat the air
passing through the
supply duct. Finally, control loop 14 has a general exhaust damper/actuator
block 34 that is
21 intended to diagrammatically illustrate the general exhaust damper and
actuator associated
22 with the air general exhaust duct of the room that is being controlled. It
should be
23 understood that the general exhaust duct is separate and distinct from the
exhaust duct or
24 ducts which are connected to laboratory fume hoods that are present in the
room, and which
exhaust air together with fumes and the like from the interior of the fume
hoods. Such fume
26 hood exhaust will necessarily remove air from the room, and the controller
will compensate
8
CA 02237277 1998-OS-08
1 for such exhausting as will be described.
2 With respect to the operation of the feedback control block 26, and
referring
3 to FIG. 5, it employs a Proportional-Integral-Derivative (PID) control
method, as is known
4 to those skilled in the art in the HVAC industry. The feedback controller
uses the error
between the set point and the measured variable as its input and the PID
control is used to
6 return the process variable to the set point. A simple digital version for
the control signal C~,m
7 from a PID can be developed starting with a discrete expression for PID at
m'" sample time
8 as follows:
_ m D
C =C+Pe +IS~e + g(e -a _) (5.1)
s,m g m g t t_~ i S m m 1
t
9 where S' = sample time; Pg, Ig and Dg are proportional, integral and
derivative gains. The
first term on the right hand side of the equation represents a constant
offset. The second term
11 is proportional action factor, the third term is an integral action factor
and the last term is a
12 derivative action factor.
13 A similar expression can be written for m-1'" sample as,
_ "'-~ D
C.r,m-i = C+Pgem-t+IgSt ~ ea + Sg (em-t -em-z) (5.2)
r
14 Now, by subtracting the latter equation from the former, the following
equation can be
obtained which is easy to implement in a digital controller.
D
CS,~ =Cs,m_1 +Pg(em -gm_~) +IgStem + Sg (em -2em-t +em_Z)
t
9
CA 02237277 1998-OS-08
1 With respect to the feedforward control, physical models are used to
determine the set points
2 for control variables; i.e., the supply air flow rate and supply air
temperature and the general
3 exhaust damper. The selection of a particular control variable is based on
the application.
4 An application is defined as a sequence of events initiated by a disturbance
in a process
variable; i.e., the laboratory room pressure and temperature which requires
the controller to
6 respond in order to change the state of a control variable. For example, if
the laboratory
7 room total exhaust suddenly increases due to the hood sash opening, the room
pressure will
8 decrease. Hence, the supply flow rate has to be increased in order to keep
the room pressure
9 at its set point. In this example either the total laboratory room exhaust
flow or differential
pressure across the laboratory room is a process variable, depending upon
which one is
11 measured, whereas the supply flow rate is the control variable.
12 The second step of a feedforward controller involves generating control
signals
13 based on the set point determined in the first step and the HVAC equipment
characteristics.
14 In a variable air volume (VAV) laboratory room HVAC system, two types of
control
equipment are commonly found. There would typically be a valve or a damper
which
16 restricts the flow of water or air followed by a water-to-air coil which
heats up the laboratory
17 room supply air. The characteristics for each component correlate input
variables to the
i 8 output as a control signal.
19 As shown in FIG. 2, the feedforward controller 22 has an on-line
identification
block 36 and a control block 38, and the controller 24 shown in FIG. 3
similarly has an on-
21 line identification block 40 and control block 42. The identification
blocks 36 and 40 capture
22 and update the process characteristics based on the process input control
signals and the
23 measured variables. The identification blocks 36 and 40 pass the updated
characteristics
24 periodically to their respective control blocks 38 and 42 for control
action.
In this context, it should be understood that in a sense, the feedforward
26 controller has a "feedback" mechanism to compensate as the system
characteristics change.
CA 02237277 1998-OS-08
1 However, this is different from a feedback control where the measured
process variable is
2 compared with its set point to generate the error signal and the output
signal is essentially a
3 function of this error signal. In the feedforward identification process,
the process variable
4 and even the system disturbance are measured if it is cost effective and
feasible. The
feedforward control blocks 38 and 42 act upon receiving a set point signal and
provide a
6 control signal based on the identified characteristics of the process. The
essence of a
7 feedforward control is to generate the control output in response to a
change in the set point
8 of a process or measured variable. Since the feedforward control does not
need an error to
9 generate the control signal, it responds faster than the feedback control. '
The identification process captures the system characteristics over the entire
11 operating range which makes the. controller robust. If the identification
scheme were able
12 to capture the system characteristics perfectly, there would be no need for
the feedback
13 controller. However, perfection cannot be achieved without incurring a
major cost due to
14 errors, noise, and accuracy in the data. Thus, the feedback control is
required to compensate
1 S for the steady state error or offset.
16 For each piece of control equipment in a VAV laboratory room HVAC system,
17 the feedforward controller is capable of generating a control signal in
response to a set point
18 change of a process variable. The physical process associated with each
component is
19 needed in order to understand how the control signal can be generated.
The physical process of heating a room involves two components: a
21 valve/actuator assembly and the heating coil. A VAV laboratory will
commonly have a
22 heating coil, a valve/actuator and damper actuators in order to satisfy
both pressure and
23 temperature requirements in the laboratory. The valve/actuator
characteristics are similar to
24 those of a damper/actuator used to modulate air flow rate in a HVAC air
distribution system.
Therefore, the process described here for the valve is equally applicable to
dampers and
26 actuators. By choosing an example of a heating process, the identification
of all HVAC
CA 02237277 1998-OS-08
1 components in a VAV laboratory can be illustrated.
2 The water flow rate through the valve will depend on the valve open area and
3 the authority, a. The authority is defined as the ratio of pressure drop
across the valve to the
4 overall circuit pressure drop when the valve is fully open, or for each
valve,
a = warve
Q p (5.4)
circuit ~Q~~e~JI4(lyopen
Expressing the valve characteristics in terms~of authority, percent valve open
and percent
6 maximum flow rate is typical in the art (ASHRAE 1992).
7 For a single circuit system, in practice, the circuit pressure drop will be
small
8 compared to the valve which will cause the authority, a, to be close to 1Ø
However, for a
9 system with multiple circuits, the pressure loss in the main segment becomes
significant
compared to the branch segment as the distance between the pump and the coil
increases.
11 As a result, the value of authority varies depending upon the ratio of
pressure losses as
12 indicated in the authority equation. The authority of any circuit is time
dependent because
13 the flow in each circuit varies with the time. The valve authority can be
calculated either
14 using the basic relations between design pressure drop and flow rate or by
measuring static
pressures at the pump outlet and valve inlet at the design flow conditions and
calculating
16 authority at any time.
17 As shown in FIG. 2, a control signal CS is generated based on the heating
18 demand and is sent to the valve/actuator 32 to open or close the valve. The
heating coil has
19 physical inputs of water and air flow rates and inlet air and water
temperatures. The coil
outputs are water temperature and air outlet temperature. Since the water
outlet temperature
21 is not directly linked to the control of supply air thermal energy, it is
not considered in the
12
CA 02237277 1998-OS-08
1 identification process. Instead, R is used as a non-dimensional variable
combining the water
2 inlet temperature, T f;, and air inlet and outlet temperatures, Ta,; and
Ta,o respectively. Both
3 Tf; and Ta,; are either known constants for a given system as user input
parameters or are
4 measured and input to the controller. The dimensionless variable R, which
can also be
viewed as coil effectiveness, is a measure of the heating supplied. R can be
expressed as
6 R = (Ta.o - Ta.a )~(Tf~ - Ta.i ) (S.S)
7 The physical process described above relates the system process variables as
a function of
8 the control input. The process needs to be inverted when used in a
feedforward controller to
9 produce the desired control signals that set the valve at the desired
position in response to the
water flow rate set point. .
11 This control scheme can be explained in connection with FIG. 2. The order
of
12 the physical heating process previpusly described is reversed in the
feedforward block shown
13 in FIG. 2. The feedforward block is activated upon receiving a signal of
coil outlet air
14 temperature set point, Ta,opP. The on-line identification normalizes and
inverts the
characteristics to produce the desired control signal. The coil characteristic
is utilized first
16 in the control process to yield the desired water flow rate, u,-, for the
desired coil outlet air
17 temperature set point, Ta,o~sp and for given supply air flow rate, us.
Knowing the water flow
18 requirement and the authority, a, the identified valve characteristic then
generates a control
19 signal, CS.
The observed variables from the system along with the control signal, CS, may
21 be periodically collected and used to update the coil and valve
characteristics by a separate
22 identification scheme that is indicated as an on-line adaptive
identification in FIG. 2. The
23 observed variables could include Ta.o, T~_;, of and us. However, instead of
an expensive means
24 of measuring water flow rate, the coil outlet water temperature, T f.o can
be measured and v f
can be calculated using the following energy balance.
26 ut = K us (T~.o - Ta.~ )~(Te.~ - Te,o ) (5.6)
13
CA 02237277 1998-OS-08
1 where K is a constant that is determined empirically and expressed as a
ratio of the products
2 of the mass-capacitance of air and water or,
C
K= P° ° (5.7)
3 where Pa = density of air; Pf= density of fluid; ca = capacitance of air;
and c f = capacitance
4 of fluid. The above water flow rate (u f) equation is preferred as a way to
calculate the water
flow rate through the local heating coil considering cost and practicality as
opposed to
6 measuring flow directly. The HVAC control system usually trends the air flow
rate through
7 the coil as well as the discharge air temperature for control purposes. The
values are updated
8 every second or more. Often the values for coil air and water inlet
temperatures are also
9 available from the central air handling unit and chiller plant. Thus, by
adding a water
temperature sensor, the coil water flow rate can be estimated using the water
flow rate (uf)
11 equation. This is a cost effective proposition since flow sensor costs more
than a temperature
12 sensor and such cost difference becomes significant considering the large
number of local
13 heating coils that may be present in a building. Also, in a retrofit
application, a strap-on
14 temperature sensor can be installed outside the pipe to avoid costly job
interruption. On the
other hand, most types of flow sensors need to be inserted inside the existing
pipe which
16 interrupts the system operation.
17 A few additional factors favor the use of temperature sensors. First, the
water
18 flow rate equation will only be used for identification purposes. Hence,
dynamic data are not
19 needed to solve for water flow rate equation. Instead, only periodic steady
state data are
needed, which should not be difficult to obtain given the preferred sample
rates of 1 or more
21 per second. Secondly, the governing relationships between the water flow
rate and air flow
22 rate and air and water side differential temperature across the coil are
important in estimating
23 the coil water flow rate. The absolute accuracy of each measurement is
therefore not critical.
14
CA 02237277 1998-OS-08
1 Finally, the purpose of the feedback controller in a combined feedforward
and feedback
2 approach is to compensate for inaccuracies with the identification process
which include
3 measurement error. Hence, accurate measurement for identification is not
required.
4 FIG. 2 clearly demonstrates the need for estimating the coil outlet
temperature
S set point Ta,opp before the feedforward block can produce any control signal
to the valve. In
6 fact, the inverse of heating coil characteristics will generate a set point
for water flow rate
7 through the valve. By knowing the valve authority and water flow rate set
point, the
8 controller will then be able to generate a control signal to the valve.
9 The process described for a valve is similar to that for a damper, the
latter of
which is shown in FIG. 3. In the case of a damper, the signal will be
generated in response
11 to the demand for air flow rate. The air flow rate set point is determined
first, which along
12 with the damper authority is used by the feedforward block to generate the
control signal.
13 In accordance with an important aspect of the present system, a method is
14 needed to determine the set points for the supply air flow rate and supply
air temperature and
general exhaust air flow rate. The supply air flow rate set point is coupled
to the pressure
1G loop for laboratory room safety. 'fhe supply air temperature set point is
determined when the
17 room temperature falls below the set point and heating is needed. The
general exhaust is
18 opened when the room becomes hot and the temperature exceeds the set point.
In all cases,
19 physical models are used to calculate the set points.
To determine the supply flow set point, the steady state mass balance and
21 infiltration equations can be used to solve for the supply flow set point.
The steady state
22 mass balance, when written in terms of set points, is (mass balance)
pslspy.rlsp + padlspuadlsp _ plspUelsp - 0 (S.8)
Tslsp Tadlsp Tlsp
CA 02237277 1998-OS-08
1 The infiltration relation, the amount of air entering the room from other
than the supply duct,
2 is
3 v ad~sp KODP~Sp)" 5.9
4 The laboratory room pressure differential, OP~Sp, is defined as a
differential as follows:
OP~Sp - Pref~sp - Plsp (5.10)
6 There are nine variables in the above mass balance equation comprising the
7 temperature, flow rate and pressure of three air streams: supply,
infiltration and laboratory
8 room exhaust. The room set points for temperature and pressure infiltration
are known. The
9 volumetric flow rate of infiltrating air at the set point, Uad asp, is also
known from the a ad~sp and
OP~Sp equations. Similarly, the supply air pressure, Ps~sp, room pressure,
P~Sp, and temperature,
11 T~sp, set points are given from design data. There are three unknowns:
laboratory room supply
12 air flow rate, v "~Sp; total laboratory room exhaust set point, U e~sp ;
and supply air discharge
13 temperature set point, Tsisp . The total laboratory room exhaust is a sum
of general exhaust
I4 and exhaust from fume hoods and given by:
Ue~sp = UO,~sp -I- Uex~sp 5.1 1
16 In a VAV laboratory room, the fume hood exhaust set point is a known
quantity for each
I 7 position of the fume hood sash. Hence, by determining the set point for
total laboratory room
18 exhaust, the general exhaust set point will be known.
I9 In order to solve for either supply air discharge temperature or general
exhaust
set point, the following steady state energy equation is used in addition to
the four
2I immediately preceding equations. The steady state energy equation is:
ps'.pusirp ~ + padl,Pv~~~,P~ _ p~spue~~o~ + ~ = 0 5.12
n R a R P I qload C )
22 where c f is a unit conversion factor.
23 It should be understood that when the supply air discharge temperature set
16
CA 02237277 1998-OS-08
1 point is to be determined, then the general exhaust is usually a known
quantity and vice
2 versa. The need for determining the desired supply air discharge temperature
arises when
3 the fume hood exhaust suddenly increases as the sashes are opened. The
increase in exhaust
4 means more supply air is required to maintain the room pressure
differential. However, the
room will be overcooled if the quantity of supply air, typically at
55°F, exceeds the amount
6 required to offset the cooling load in order to maintain room temperature at
70 ° F. To
7 prevent room overcooling, the supply air must be heated and the heating coil
valve controlled
8 in order to achieve a desired supply air temperature set point.
9 The general exhaust is needed when fume hoods are closed and the rate of
internal heat generation is increased due to process or equipment operation.
The room, under
11 such situations, needs more cooling. However, just additional cooling by
means of an
12 increase in volumetric flow rate of 55°F supply air will upset the
room pressure equilibrium.
13 As a result, the general exhaust damper is opened to allow more supply air
to provide added
14 cooling. The controller has to determine and control the general exhaust
flow rate and supply
air flow rate in order to maintain the room pressure and temperature set
points. In this case,
16 of course, the supply air temperature at 55°F is fixed. When heating
is required the general
17 exhaust damper is usually closed which means that tie~sP equals zero.
18 Hence, the use of the five preceding equations yield a set point solution
for a
19 combination of supply air flow rate and temperature or supply and general
exhaust flow rates
depending upon the control sequence. In the last equation, the steady state
energy equation,
21 the space thermal load, q,°ad, needs to be determined in order to
obtain the set points. The
22 transient room load is approximated as proportional to the first order
derivative of room
23 temperature with respect to time. This is the internal energy storage term
assuming the mass
24 of air in the laboratory room remains constant.
qi°aa qtr = Pc~ dT/dt (5.13)
26 The room temperature, T, can be measured directly by placing the
temperature sensor in the
17
CA 02237277 1998-OS-08
1 room exhaust duct instead of following the usual practice of mounting a wall
room
2 thermostat. In many laboratories, the exhaust from the fume hoods and the
laboratory room
3 are ducted together and the common intersection between the two exhaust
streams provides
4 a good location for a duct temperature sensor. Due to the high ventilation
requirement, the
air in a laboratory room is well mixed and therefore, exhaust air temperature
is a good
6 representation of the room temperature, T. In certain situations, however,
it is not feasible
7 to install a duct temperature sensor due to the fear that the electrical
voltage supplied to the
8 sensor may react with the volatile fumes. Under those situations, the room
wall thermostat
9 sensor can be still used and the room temperature can be estimated by
simplifying the
following equation and using a temporary room air temperature sensor as
explained below.
d~ ' =CIs~( PH, -T.ct) -Clst(Tar -~ (5.14)
11 This equation couples both the panel wall and the room air temperature to
the thermostat
12 temperature, TS~. The coupling between the panel wall and the thermostat
temperature is
13 necessary since the radiant wall heats and cools the panel wall on which
the thermostat is
14 mounted. In most laboratory rooms, the wall temperatures will be very close
to the space
temperature since both laboratory.room and the laboratory room adjacent spaces
are usually
16 interior zones and are maintained at the same temperature. As a result, the
above equation
17 can be simplified as
dTs~
dt C2S'(TS' ~ (5.15)
18
19 The only thermostat calibration constant, C25~, can be easily found during
18
CA 02237277 1998-OS-08
1 commissioning process by locating a temperature sensor in the exhaust duct
temporarily or
2 at a good location within the room, changing the room temperature set point,
trending both
3 thermostat temperature, TSt, and room air temperature, T, from a temporary
location and
4 fitting trended data to the above equation to determine C25~. Once the
thermostat constant
is calibrated, the temperature sensor can be removed from the temporary
location. As an
6 alternative, if feasible, the sensor to measure the room air temperature can
be located in the
7 general exhaust duct for the laboratory room air only. The sensor in the
general exhaust duct
8 cannot be used continuously in lieu of the thermostat since often the
general exhaust damper
9 may be closed completely and the sensor will not be exposed to the room air
flow. On the
other hand, by having a sensor in the general exhaust, the calibration process
can be
11 automated to update the value of the calibration constant, C2S,, routinely
by using the trended
12 sensor and the thermostat values in equation 5.15 when the general exhaust
flow is
13 significant.
14 When the room temperature is steady, the total cooling load can be
determined
by using the following energy equation, which relates the load to the total
laboratory room
16 exhaust flow rate, room temperature and the supply flow rate at the
preceding time step, t-1.
17 The air density is assumed to be constant and identical for supply, exhaust
and infiltration
18 air
qfoad~ss ue.(t-1)PCpT(t-l) us.~~-1)PCPTs uoa~sPPCPTaa (5.16)
19 The total laboratory room exhaust is expressed as a sum of general exhaust
and fume hood
exhaust flows,
ve = us,~~_,) + uQ~iJP (5.17)
19
CA 02237277 1998-OS-08
1 In both of the above equations, the infiltration flow rate set point,
Uad~sp, is used instead of
2 actual infiltration flow rate, to avoid an oscillation in the room load
prediction. The
3 transients in 0P will introduce oscillation in both infiltration flow rate,
uad, and room
4 temperature, T. As a result, the calculated room cooling load will
oscillate.
S In order to see the effects of transient 0P and vad on the calculated load,
a
6 simulation is performed by selecting a simple control strategy. The room
pressure and
7 temperature responses are obtained by increasing the room internal heat
generation rate from
8 a steady value of 82.50 Btu/min to 412.50 Btu/min. As the room temperature
increases due
9 to the higher rate of internal generation, the room calls for more cooling.
'
Additional cooling can be only provided by increasing the flow rate of supply
11 air at 55°F. However, before the supply air flow rate is increased,
the total laboratory room
12 exhaust has to be increased to maintain the room pressure differential,
which in turn requires
13 the general exhaust to be increased. The use of the infiltration flow rate
set point in
14 predicting the load is found to work since the objective here is to
determine the required
supply air flow rate, temperature or general exhaust flow rate in order to
achieve room
1G pressure differential and temperature set points. Essentially, the
controller drives the supply
17 and general exhaust dampers to maintain the room pressure differential of
.OS w.c. and room
18 temperature of 70°F. The controller first calculates the set points
for supply and general
19 exhaust flows at the steady state conditions before and after the increase
in the rate of internal
heat generation takes place.
21 Based on the flow set points, the controller determines the damper
positions
22 using the identified relationship between flow rate through the damper and
the damper
23 position. The purpose of using a simple simulation is to illustrate that
the pressure and
24 temperature transients cause, in turn, transient behavior in infiltration
flow rate. The
resultant effect is that the predicted load will follow the transient changes
in infiltration flow
26 rate and which are oscillatory. The instantaneous load under steady state
condition is
CA 02237277 1998-OS-08
1 determined applying the foregoing q,aad ASS equation which uses the actual
total laboratory
2 room exhaust, veX. In contrast, the predicted steady state load, q ,oaa
~S~sing the set point
3 follows the actual load very closely during the transient, and agrees with
the simulated load
4 which includes both steady state heat generation and the wall effect. The
q,oad ASS at steady
state uses q,oad p equation which calculates uex assuming a set point for 0P.
As a result, the
6 set point for qioaa ASS corresponding to a 0P set point of .OS " w.c. is
used in equation 5.16. For
7 the selected control sequence, the difference in actual alld as determined
by equation 5.16
8 is found to be about 41 cfm which translates into a difference of about 43
Btu/min between
9 the instantaneous load and q,oaa ASS under the steady state.
Based on the observations, the predicted steady state load is selected for use
11 in simulation instead of the instantaneous load. The controller also does
not need to follow
12 the actual instantaneous room load as that will cause the dampers to
oscillate. The use of the
13 predicted load based on set points will provide a stable control state.
14 When the room needs cooling, both the storage and steady state load terms
are
added to compute the load, q,oaa ASS, in order to determine the general
exhaust and supply flow
16 rate set points. In the case of heating only, however, the storage term is
neglected to compute
17 in calculating the supply air temperature set point.
18 The identification process produces component outputs based on input,
output
19 and information related to other variables using the identified component
characteristics.
There are two types of components which need to be identified: a heating coil
and a
21 valve/damper. However, since the physical characteristics will be inverted
in the control
22 process as previously explained, the identification process should capture
the relationship
23 between the inputs and outputs of the inverted physical processes. For
example, for a heating
24 coil, the inputs are a nondimensional variable, R and fixed variables Ta,;,
coil inlet air
temperature and fluid inlet temperature, Tf;. The coil output will be the
water flow rate
26 through the coil, u,-.
21
CA 02237277 1998-OS-08
1 Similarly, referring to FIG. 2, the identification of an inverted physical
process
2 for a damper or valve involves flow rate and authority as two inputs and
control signal as an
3 output. A damper or a valve is essentially a variable fluid resistance
device. Both exhibit
4 similar fluid characteristics and their performance is expressed in terms of
identical variables
and, hence, can be represented by the same models.
6 The General Regression Neural Network (GRNN) is chosen to identify the coil
7 and valve characteristics due to its simplicity, robustness and excellent
capability in system
8 identification. Unlike a conventional neural network, it requires minimal
computational time
9 to effectively capture the system characteristics. The following is only a
brief account of
GRNN to illustrate its implementation in identification of the components.
11 The input to a GRNN is a series of data that can be in multiple dimensions.
For
12 sample values of X; and Y; of input vector X and the scalar output Y, an
estimate for the
13 desired mean value of Y at any given value of X is found using all of the
sample values in
14 the following relations:
n 2
D;
Y~ exP( _-)
2cz (5.18)
n 2
exp(- D' )
2Qz
where the scalar function D?, representing the Euclidean distance from the
given value to the
16 known points, is given by
D z = (X - X;)T (X - X;) (5.19)
22
CA 02237277 1998-OS-08
1 and Q is the single smoothing parameter of the GRNN. 'The above equations
are the essence
2 of the GRNN method. For a small value of the smoothing parameter, v, the
estimated
3 density assumes non-Gaussian shapes but with the chance that the estimate
may vary widely
4 between the known irregular points. When Q is large, a very smooth
regression surface is
achieved. The Holdout method (Specht 1990) is used to calculate the value of
smoothing
6 parameter, Q.
7 The implementation of GRNN to the characteristics of a heating coil or
8 valve/damper also offers advantages over the conventional methods of
identification. In a
9 traditional regression method for identification, the operator has to input
a priori knowledge
of the equation type or has to search for the best fit equation exhaustively.
The code
11 requirement for a nonlinear regression is intensive and may be prohibitive
for effective on-
12 line use. In contrast, the GRNN does not require any user input for the
functional form of
13 the characteristics and uses a strikingly simple code. Moreover, the GRNN
algorithm can
14 be imbedded into a neural hardware processor, thereby eliminating software
development
process to a large extent since software coding during field installation is
not necessary.
16 For a heating coil, the input vector X contains dimensionless variable R
and
17 ua~sP while the output, Y, is water flow rate through the coil, v~sP. Using
valve authority, a
18 and u~sp as input, the valve GRNN then produces an output of required valve
control signal,
19 Cs. For a damper/actuator for flow control, the input and output variables
are the same as
that for a valve.
21 In accordance with another important aspect of the controller, coil and
valve
22 characteristics are generated using the models described above, and
subsequently used in the
23 GRNN to identify the characteristics. The physical variables are first
normalized. Besides
24 R (Equation S.5) and authority, a, whose range is from 0 to l, other
normalized variables
used are
23
CA 02237277 1998-OS-08
C f Us U
nCs = ; nuf = and nu f (5.20)
Camax UJmax r Ujmax
1 In this example, the values of CS maX, U f max and U s max are 1.0, 2500 cfm
( 1180 L/s) and 1.0
2 gpm (.0631 L/s), respectively. Using the value of R required to meet the
load and a given
3 value of nus , a value of nu f can be determined which can be subsequently
used in a valve
4 model along with the given authority to generate a control signal, ncs, as
indicated in FIG.
2. The coil and valve characteristics data in Table 1 are generated using
normalized variables
6 and the models described above.
7 The GRNN method can be best explained by using an example of regressing
8 valve data for a constant authority. For example, choosing authority a to be
0.1, a nonlinear
9 relation, shown in FIG. 6 is established between the normalized control
signal and
normalized flow. For a constant authority, there is only one input and the
vector X in the
11 above scalar function equation becomes a scalar series of normalized flow
rate, nuf. In the
12 scalar function equation, the function D 2 can be computed where X; is the
ith sample in the
13 series. The GRNN equation for Y(l~ can then be solved using D;2, and
corresponding Y; as
14 the ith sample of ncs in the identification data.
24
10/17/00 16:18 FAX 804 881 4081 OPEN. - WIGGS ET AL 1002
i Table 1
2 Valve Simulation Parameters
3 ~._ .00001; W~- 1; Ku,= .08641(64.89); K.~= .042 (31.54);
4 _.
Inches maximum U~
Authority of gpm (L/s)
LYzO
kpa
x~b
(gpm)2
(Lls)2
6 1.00 -.OSG(-64.58) 3.00 (0.1893)
7 .70 -.034(-25.53) 2.50 (0.1577)
8 .50 .037 (27.78) 2.12 (0.1337)
9 .20 .407 (305.63) 1.34 (0.0845)
.10 1.02 (765.97) 0.95 (0.0599)
11 .OS 2.25 (1689.64) 0.67 (.0423)
12 .OI 12.13(9109.02) 0.30 (.0189)
13 The simulation of coil and valve characteristics as well as GRNN is
performed
14 using the Engineering Equation Solver (Klein and Alvarado I997) .
~ The simulated data in FIG. 6 are shown by the solid lire
1G while the points are generated by using the GRNN equation for various
smoothing parameter
17 (a) values. Although smaller values of o seem to represent the data better,
overfitting by
18 choosing a very small Q should be avoided. The simulated data contain
fourteen samples
t 9 obtained by varying nCs from 0.0 to 1.0 in increments 0.1 and nCs of .05,
0. l 5, 0.25.
The F-Ioldout method, (Specht 1990) '
21 is used to calculate the optimum value for sigma, a, and it is found to be
.01.
22 The effect of choosing a higher Yalue of a is apparent in FIG. 6. With the
larger value of a
?5
CA 02237277 2000-10-17
CA 02237277 1998-OS-08
1 of 0.5, a smooth nearly linear trend is found that differs significantly
from the input while
2 with smaller values, the GRNN attempts to approximate all samples and is not
smooth
3 between points. For o = 0.01, the average error between the predicted and
simulated signals
4 is found to be 2.62% while the maximum error of 14% is observed for the
lowest value of
control signal that is not included in the identification data (nCs of .35). A
slight error is also
6 observed at the higher value of nuf, since the control signals becomes
highly sensitive to the
7 normalized flow rate.
8 However, the relative error at the higher end of the valve curve is much
smaller
9 compared to the lower end due to the higher absolute value of control signal
at this end. The
sample size and the choice of samples, therefore, are important variables
along with the
11 smoothing parameter, o. In fact, by including the sample of nCs 0.35 in the
identification
12 data, the error between the simulated and the predicted control signal for
that specific sample
13 can be decreased from 14% to less than 1 % while the average error can be
dropped from
14 2.62% to 1.31 %. In order to identify damper/valve characteristics, only
200 samples at most
1 S will be required to cover the entire range of operation. This is based on
the assumption that
16 the authorities can be varied between .001, .01, .OS and .1 to 1 in
increments of 0.10 while
17 the control signal can be varied between .05, .075, .01, .15, .20, .25,
.30, .35 and 0.40 to 1.0
18 in increments of 0.1. Any state-of the-art local controller will be able to
process the 200
19 sample values with ease and speed. In reality, however, the total number of
points to cover
the actual operating range will be much less, i.e., preferably less than 100.
21 A range of valve authorities between 0.5 and 0.1 was chosen to test the
GRNN
22 method. Again, the Holdout method is used to determine the optimum
smoothing parameter
23 Q which is now 0.0~, and which produces a sum of square error of 0.189 over
a identification
24 data size of 30 samples. The identification data set includes values of
authority of 0.10,0.30
and 0.50 and ncs between 0.10 to 1.0 equally spaced. The test data set varies
ncs from 0.05
26 to 0.95 in increments of 0.10 and also includes intermediate authorities of
0.20 and 0.40. The
26
CA 02237277 1998-OS-08
1 average error of about 3.0% is low compared to the range of the data set.
Some errors higher
2 than the average are found for higher values of control signal where the
curve becomes very
3 steep with the normalized flow rate, .
4 The operating range for the valve or damper is typical of these control
applications. Hence, the method of using GRNN to represent characteristics
using a small
6 data set has demonstrated promise and implementable in a real controller on
an on-line basis.
7 In a real application, operating characteristics over the entire operating
range can be
8 developed during commissioning by varying the damper open area. Once
captured, the
9 operating characteristic will be stored in the feedforward controller and
control signal will
be generated based the stored data using GRNN. The time and effort required to
tune the
11 feedback loop will decrease as the error signal for the feedback loop will
always have a low
12 value. Reduction of commissioning cost and time and enhancement of system
performance
13 are the rivo major factors in favoring combined feedforward and feedback
controller for a
14 building HVAC distribution system.
1 S The measured data obtained during the commissioning process will be used
16 only to initialize the identification process. As the system operates and
more operating data
17 are collected, the identification will be updated accordingly. The essence
of combined
18 feedforward and feedback is to generate a rough estimate of the control
signal with the
19 feedforward block while the refinement is made with the feedback. In fact,
the feedforward
block also has a feedback mechanism that updates the identification. However,
the
21 identification process is kept separate from the control process for ease
of implementation
22 and cost effectiveness.
23 Another method for implementing GRNN in a controller is to generate the
24 characteristics using the simulated data. The characteristics can be stored
and updated as the
real data become available and replaces the simulated data.
26 FIG. 8 shows both the identification and the test data covering the entire
27
CA 02237277 1998-OS-08
1 operating range of a valve. These were obtained by simulating control
signals that varied
2 between 0.1 to 1.0 for each authority in the identification set over which
the authorities vary
3 from .O1 to 1Ø Also, additional samples are duplicated from the test set
to the identification
4 set at low values of authority and control signal. In total, 160 samples are
used in the
identification set while 150 samples are included in the test set. The Holdout
method using
6 a smaller data set with authorities of .01, 0.10, 0.25, 0.50, and 1.0 is
used to optimize the
7 value of o. A smaller data set having sparse values still yields a good
choice of Q of 0.01 for
8 the data set shown in FIG. 8.
9 The plot comparing simulated and predicted control signals is shown in FIG.
9. Again, higher than average errors occurs for large control signals as well
as for low
11 authorities. The large error for a specific sample can be vastly decreased
by including that
12 sample in the identification set. This can be easily achieved in a real
controller by comparing
13 the control signal sent to the valve and the damper and the control signal
generated by the
14 feedforward control signal. If the difference between the feedforward and
the total control
signal increases more than a predetermined fixed threshold value, the control
signal and
16 corresponding normalized flow rate, and the authority can be put back into
the identification
17 set.
18 Finally, the GRNN is used to identify the characteristics of a heating
coil.
19 Referring to FIG. 2, the GRNN needs to predict the required water flow rate
through the coil
for given R and air flow rate. For randomly selected values of normalized
supply air flow
21 rate nus and R, the nol~nalized flow rates, nuf are calculated using energy
balance equation
22 for a f, the mass-capacitance equation for K, and the normalizing equations
for finding nCs,
23 nuS, and nut. A portion of the simulated data is used for identification
purpose while the rest
24 is set aside to test the GRl~tN algorithm. The test samples are purposely
chosen as to cover
the entire operating range. FIG. 9 shows both the identification and the test
data.
26 An average error of 2.6% between the predicted and simulated normalized
flow
28
CA 02237277 1998-OS-08
1 rates was found. Unlike the valve in which a definite pattern is evident,
the coil plot in FIG.
2 10 appears random. Even with such sparse and random distribution of input
data, the GRNN
3 is able to predict the coil flow rates with good accuracy.
4 In addition to the simulated data, measured damper characteristics are also
used
to test GRNN. Two sources were~used to obtain the measured values: 1) Test
data taken to
6 calibrate damper performance and 2) Active damper performance at a job site
using a
7 building automation system (BAS). In the first case, damper curves are
experimentally
8 generated for three damper authorities as shown in FIG. 11.
9 The test sensors used to obtain data are similar to those used in commercial
building control systems. For a given control signal, the flow rate through
the damper is
11 noted and normalized using the normalizing equation. The GRNN is identified
using the
12 measured values of the control signals, flow rate and authorities while
intermediate points
13 on the authority curves are used to test the GRNN as shown in FIG. 11.
14 Compared to the simulated data, the measured curves in FIG. 11 exhibit more
randomness as expected. At low flow rates, the three authority curves converge
into a single
16 one indicating the difficulty of measuring flow rate when the damper is
barely open. At high
17 flow rates and low values of authority, increasing the control signal will
not increase the
18 flow. The GRNN predicted the measured values with an average accuracy of
4.30% which
19 is good considering the error associated with the measurement and data
collection system.
The Holdout method is used to determine the optimum smoothing parameter, a of
0.066. The
21 error increases with the higher flow rate as the authority curves become
highly sensitive as
22 can be seen from FIG. 11. The range of the test data for GRNN chosen in the
normal
23 operating range of the damper between 10 % to 100% of flow rate.
24 For the damper at the job site, the authority remained unchanged at 7%
during
the data collection. For the same flow rate, the damper control signal varied
over a wide
26 range at both high and low flow rates. The GRNN output is tested for each
sample
29
CA 02237277 1998-OS-08
1 observation that has been used in the identification data. Pre-processing of
the raw measured
2 values is not used before the data are fed to the GRNN for identification. A
pre-processing
3 filter could be used on measured values to reduce the uncertainty with the
measured values.
4 The accuracy of GRNN in predicting control signals has been shown to be
within 6%. A linear regression of valve characteristics has also been shown to
yield an
6 average error of 7%. The essence of the GRNN method is the capability of
predicting both
7 nonlinear as well as linear characteristics without any user input for a
fixed smoothing
8 parameters. In the case of a regression tool, significant user input to
specify the form the
9 regression is required which often limits the actual on-line implementation
of regression
analysis for identification. Therefore, the results demonstrate that the
performance of GRNN
11 exceeds that of linear regression..
12 The feedforward-feedback combination topology enables the majority of the
13 control signal to be provided from the feedforward block such that the
feedback block only
14 deals with a small steady state error and thus requires little tuning.
Unlike the feedback loop,
the fccdforward loop acts only upon the set point value and does not require
the measured
16 values of the variables. As a result, the feedforward signal can enhance
control speed in
17 tracking the set point change. The most common method of employing feedback
is the
18 traditional approach of Proportional-Derivative-Integral (PID) algorithm,
and is appropriate
19 for the combined approach.
Local controllers can be used in the implementation of the apparatus of FIGS.
21 1 through 4, and they are found in large numbers in mid-size to large
buildings and have
22 sufficient memory and processing capability to remain cost effective. A
control scheme can
23 be provided that is simple, easy to implement, inexpensive, and that
provides substantial
24 enhancement in performance by coupling feedforward and feedback algorithms.
This
provides an improvement over the PID controller that react to a control
affected by the
26 dynamic response of the coil and valve signal. In the feedforward block
previously
CA 02237277 1998-OS-08
1 explained, static characteristics of these devices are stored and updated.
2 Combining feedforward and feedback blocks is preferably done in one of two
3 ways. As a first option, shown in FIG. 4, a simple switch 50 can be used to
set the control
4 signal from the PID algorithm to zero whenever a set point change is
noticed. This approach
S is identified as model 1. Only the feedforward block produces a control
signal when the set
6 point is changed. The PID output is only added when the set point does not
change, which
7 indicates that the system is under steady state. This combination approach
is based on the
8 fact that feedback is only responsible for the steady state error that will
not be detected by
9 the open feedforward block. It is reasonable to expect a relatively small
steady state error
due to the uncertainties introduced with the identification scheme,
measurement and
11 controller.
12 In the second approach, termed model 2 and shown in FIG. 5, the net
controller
13 output is the result of addition of the feedforward output, the integral
and derivative portions
14 of the PID output and the subtraction of the proportional part of the PID
output. The logic
employed here is that by subtracting the proportional output, the feedback
will remain
16 inactive to any change in the set point. The feedback will only provide the
integral and the
17 derivative actions allowing the controller to respond to the set point
change by means of
18 feedforward block.
19 Both combination models are simulated and compared to each other using a
simple sequence of pressure control to illustrate the responses. Both models
performed well
21 although model 1 performs slightly better compared to model 2 in terms of
both undershoot
22 and response time, as shown in FIG. 13. For decreasing flow, the trend is
exactly opposite
23 to that for increasing flow. The performance of the controller improves
significantly with
24 shorter sample times. The sample time is a function of controller
processing and
communication speed and is often dictated by the cost. It is preferred that
the controller have
26 a sample time of 1/10 sec. or 10 samples per second.
31
CA 02237277 1998-OS-08
1 The method of General Regression Neural Network (GRNN) effectively
2 identifies characteristics of HVAC components for subsequent use in
controls. The strength
3 of the GRNN is apparent as it has demonstrated its ability to adapt to both
linear and
4 nonlinear relations using both simulated and measured sample observations.
Unlike a
traditional regression equation, however, a priori knowledge of the
relationship in terms of
6 an equation is not necessary for implementing the GRNN. The nature of the
GRNN
7 algorithm allows the method to be imbedded in a neural network architecture
which makes
8 hardware implementation possible. The smoothing parameter is the only
variable that needs
9 to be selected and it can be determined using the Holdout or other methods.
'
. Since a small data set is needed for local HVAC control component, i.e.
valves,
11 dampers and heating coils characteristics, the GRNN provides a useful means
of
12 characterizing static performance of HVAC components for use in a
feedforward block
13 coupled with the feedback controller. Although the output Y is treated in
this paper as a
14 scalar, multiple outputs can be also handled by GRNN.
Based on the results using measured data, a conservative estimate of a 6%
error
16 in identifying coil and valve characteristics with the GRNN method is
reasonable. Hence, a
17 control signal can be generated with an average accuracy of 8.8%. The
feedback controller
18 will be adequate to generate a control signal in order to eliminate a
residual error of less than
19 10%. Additionally, the feedback controller will require minimum tuning
since the error
range is anticipated to be in a fixed low range.
21 The combined model 1 shown in FIG. 4 which uses the PID controller under
22 steady state only demonstrated better performance for simple room pressure
control
23 compared to Model 2 shown in FIG. 5. Model 1 showed improved performance in
terms of
24 response time, oscillation and stability when compared to the model 2.
From the foregoing, it should be appreciated that a superior controller has
been
26 shown and described which has robust control and is simple, easy to
implement, inexpensive
32
CA 02237277 1998-OS-08
and provides substantial enhancement in performance by coupling feedforward
and feedback
2 control algorithms.
3 While various embodiments of the present invention have been shown and
4 described, it should be understood that other modifications, substitutions
and alternatives are
apparent to one of ordinary skill in the art. Such modifications,
substitutions and alternatives
6 can be made without departing from the spirit and scope of the invention,
which should be
7 determined from the appended claims.
8 Various features of the invention are set forth in the appended claims.
33