Note: Descriptions are shown in the official language in which they were submitted.
CA 02238518 1998-05-26
WO 97/20495 PCT/US96/18532
GLUCOSE MONITORING APPARATUS AND METHOD
USING LASER-INDUCED EMISSION SPECTROSCOPY
BACKGROUND OF THE INVENTION
This invention relates to glucose. monitoring,
and more particularly, to glucose level monitoring using
laser-induced emission spectroscopy.
Millions of people, afflicted with diabetes,
must periodically monitor their blood glucose level
because their bodies are unable to maintain a constant
blood glucose level without diet adjustments and periodic
insulin injections. Most popular methods for monitoring
blood glucose levels require a small blood sample that is
periodically drawn from the body for analysis.
Recently, noninvasive optical techniques have
been developed to monitor the blood's glucose level using
infrared absorption through a portion of the body.
However, infrared absorption techniques are susceptible to
accuracy problems, in part because glucose has more than
infrared absorption peaks, many of which overlap with
20 the absorption peaks of other constituents in the body.
Fluorescence spectroscopy using ultraviolet (UV)
excitation light has been introduced for monitoring
glucose levels. This technique requires, among other
things, the monitoring of a spectral peak within the
induced fluorescence spectrum. Accurately locating the
peak may be difficult for a low-level fluorescence signal
in the presence of noise. Increasing the intensity of the
excitation light may not be a desirable option because of
concerns of W exposure to the body. Also, known
fluorescence spectroscopic techniques generally fail to
take full advantage of information contained in the
fluorescence spectrum at wavelengths other than the peak
wavelength and fail to account for certain nonlinear
CA 02238518 1998-05-26
WO 97/20495 PCT/US96l18532
-2-
relationships between the glucose level and the resulting
emission spectra.
From the discussion above, it should be apparent
that there is a need for an apparatus, and related method,
for monitoring glucose that is simple and rapid to use,
and that provides good accuracy in spite of nonlinearities
or low signal-to-noise levels. The present invention
fulfills these needs.
SUMMARY OF THE INVENTION
The present invention is embodied in an
apparatus, and related method, that determines the
concentration of glucose in a sample that includes water,
by directly monitoring induced glucose ultraviolet and
visible (W-visible) emission light from the sample. The
apparatus compensates for nonlinearities between these
parameters and the glucose.
The apparatus includes a light source, a sensor,
and a processor. The light source emits ultraviolet
excitation light of at least one predetermined energy
level. The excitation light is directed at a sample to
produce return light from the sample. The return light
includes induced emissions of light produced as a result
of interactions between the excitation light and any
glucose with water present in the sample. The sensor
monitors the return light and generates at least three
electrical signals indicative of the intensity of return
light associated with glucose concentration distinguishing
characteristics of the emission light. The processor
processes the electrical signals, using a predictive
model, to determine the concentration of glucose in the
sample. In one feature of the invention, the predictive
model is defined using six latent variables. The latent
variables are used to derive prediction coefficients that
are associated with the glucose concentration
distinguishing characteristics.
CA 02238518 1998-05-26
WO 97/20495 PCT/US96/18532
-3-
In a more detailed feature of the invention, the
intensity of the excitation light remains relatively
constant while the sensor generates the electrical
signals. Further, the at least three electrical signals
indicate the intensity of return light within a respective
number of predetermined wavelength bands within the
wavelength band of the emission light. In another
feature, the sensor may includes a first detector adapted
to detect the return light within a first wavelength band
and generate a first electrical signal, a second detector
adapted to detect the return light within a second
wavelength band and generate a second electrical signal,
and a third detector adapted to detect ~he return light
within a third wavelength band and generate a third
electrical signal.
In yet another more detailed feature of the
invention, the sensor monitors the intensity of return
light within eight different wavelength bands and
generates eight electrical signals, each indicative of the
intensity of return light within a respective wavelength
band. More particularly, using an excitation light having
a wavelength of about 308 nanometers, the eight wavelength
bands may be centered at about 342, 344, 347, 352, 360,
370, 385 and 400 nanometers, respectively. Alternatively,
the sensor may generate a plurality of electrical signals
that indicate the intensity of return light substantially
continuously across an extended wavelength spectrum
associated with the emission light.
In another more detailed feature of the
invention, the energy of the excitation light is varied
over several predetermined energy levels, and the sensor
generates, at each intensity level, a first electrical
signal based on the intensity of return light within a
wavelength of the emission light associated with raman
scattering, and a second electrical signal based on the
intensity of return light within a wavelength band of the
emission light associated with a peak of a broad glucose
CA 02238518 1998-05-26
WO 97/20495 PCT/US96/18532
-4-
emission band. Further, the apparatus may include one or
more waveguides for transmitting the excitation light from
the light source to the sample and for transmitting the
return light from the sample to the sensor.
In a related method of the invention, a
regression model is provided that accounts for a nonlinear
relationship between the concentration of glucose in a
sample and an electrical signal based on certain glucose
concentration distinguishing characteristics of a light
emission spectrum that includes W-visible emission light
produced by glucose related interactions with the
excitation light. Further, a sample is caused to produce
a light emission spectrum that includes emission light
produced by any glucose related interaction or direct
fluorescence, and a plurality of electrical signals are
generated that represent the glucose concentration
distinguishing characteristics. Finally, the plurality of
electrical signals are processed, using the regression
model, to determine the glucose concentration and an
electrical signal generated based on the glucose
concentration determined using the regression model.
Other features and advantages of the present
invention should become apparent from the following
description of the preferred embodiment, taken in
conjunction with the accompanying drawings, which
illustrate, by way of example, the principles of the
invention.
BRIEF DESCRIPTION OF THE DRAWINGS
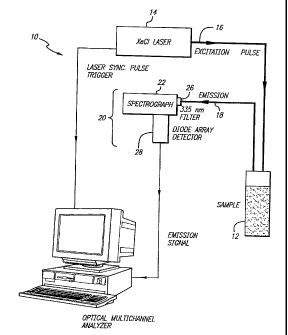
FIG. 1 is a block diagram of a glucose
monitoring system embodying the invention.
FIG. 2 is a graph of the intensity of glucose
emission versus wavelength for different concentrations of
glucose in water illuminated with laser excitation light
having a wavelength of 308 nanometers.
CA 02238518 1998-05-26
WO 97/20495 PCT/US96/18532
-5-
FIG. 3 is a graph of the intensity of glucose
emission at two wavelengths verses glucose concentration
in water, illuminated with laser excitation light having
a wavelength of 308 nanometers and an excitation energy of
1 millijoule per pulse.
FIG. 4 is a graph of the regression coefficient
verses the latent variable number, derived from a partial
least square (PLS) analysis using the intensities at eight
wavelength indicated in the graph of FIG.2.
FIG. 5 is a graph of the prediction residual sum
of squares (PRESS) versus number of latent variables,
using one spectra at a time to test the PLS model derived
from intensities at the eight wavelengths indicated in the
graph of FIG.2.
FIG. 6 is a graph of the PRESS versus number of
latent variables using two spectra at a time to test the
PLS model derived from intensities at the eight
wavelengths indicated in the graph of FIG.2.
FIG. 7 is a graph of the predicted concentration
verses the actual concentration of glucose for the PLS
model using six latent variables and for a multiple linear
regression (MLR) model derived from the graph of FIG. 2.
FIG. 8 is a graph of the predicted concentration
verses the actual concentration of glucose for the PLS
model using seven latent variables and for a multiple
linear regression (MLR) model derived from the graph of
FIG. 2.
FIG. 9 is a graph of the PRESS versus number of
latent variables using one spectra at a time to test a PLS
model derived from the whole spectra of the graph of
FIG.2.
CA 02238518 1998-05-26
WO 97/20495 PCT/US96/18532
-6-
FIG. 10 is a graph of the actual concentration
verses the predicted concentration for the PLS model using
six latent variables derived from the whole spectrum of
the graph of FIG. 2.
FIG. 11 is a graph of the intensity of glucose
emission verses wavelength, at different excitation energy
levels, for glucose in water at a concentration of 500
milligrams per deciliter.
FIG. 12 is a graph of emission intensity versus
wavelength for distilled water excited at an excitation
energy of 5 millijoules per pulse. I
FIG. 13 is a graph of the emission intensity
verses wavelength for ultra-anhydrous glucose excited at
an excitation energy of 5 millijoules per pulse.
FIG. 14 is a graph of the emission intensity
verses wavelength for anhydrous glucose excited at 5
millijoules per pulse.
FIG. 15 is a graph of the emission intensity
versus wavelength for anhydrous glucose excited with
excitation light having an energy at different levels
between 0.25 and 10 millijoules per pulse.
FIG. 16 is a graph of the intensity of glucose
emission verses wavelength for different concentrations of
glucose in water, illuminated with laser excitation light
having a wavelength of 308 nanometers and an excitation
energy of 7 millijoules per pulse.
CA 02238518 1998-05-26
WO 97/20495 PCT/US96/18532
-7-
DESCRIPTION OF THE PREFERRED EMBODIMENTS
.
As shown in the exemplary drawings, the present
invention is embodied in a glucose monitoring system 10,
and related method, for determining the concentration of
glucose in a sample 12 by monitoring the glucose
ultraviolet and visible (UV-visible) light emission
spectra at several wavelengths or excitation intensities
while compensating for the nonlinear relationship between
the glucose concentration of these parameters. The system
provides good accuracy in spite of the nonlinearities or
low signal-to-noise levels.
In the glucose monitoring system 10 shown in
FIG. 1, an excitation source 14 directs ultraviolet
excitation light to the sample 12 through an optical fiber
16, to induce any glucose within the sample to absorb and
reemit or to scatter the excitation light. An optical
fiber or fiber bundle 18 collects return light emitted by
the sample. The return light includes any glucose
emissions induced by the excitation light. A sensor 20
monitors the return light within different wavelength
bands of interest and generates a series of electrical
signals based on the intensity of return light received in
the wavelength band or bands of interest. In one
embodiment, the sensor includes a spectrograph 22 which
resolves the return light by separating the return light
by wavelength. An analyzer 24 or processor, having a
prediction model that associates the intensity of return
light of interest with the concentration of glucose in the
sample, processes the electrical signals generated by the
sensor, compares the results with the model, and generates
an electrical signal representing the concentration of
glucose in the sample.
A useful excitation source 14 is an excimer
laser producing light having a wavelength of about 308
nanometers, a full width half maximum (FWHM) pulse width
CA 02238518 1998-05-26
WO 97/20495 PCT/US96/18532
-8-
of about 120 nanometers, and a repetition rate of about 5
hertz. It is believed that glucose more efficiently
absorbs excitation light having a wavelength between 260
to 280 nanometers and it would be desirable to have an
excitation wavelength in that range. However, as
presently understood, excitation sources operating at these wavelengths
generally are of limited availability.
The excitation light can be provided by any type of
generally narrow-band ultraviolet light source and
generally can have a wavelength from about 250 to'350
nanometers.
The excitation light is guided to the sample 12
through a fused silica fiber 16 having a 600 micron core
diameter. The excitation light's energy, emitted from the
fiber, is set to predetermine levels from about 0.5 to 10
millijoules per pulse (0.54 to 36 millijoules per square
millimeter per pulse). The induced emissions from the
sample, or return light, preferably is collected using a
bundle of six fused silica fibers 18, each fiber having a
300 micron core. The collection fibers guide the return
light to the sensor 20.
The sensor 20 may include individual light-
sensitive diodes, with appropriate bandpass filters, or as
discussed above, may include a spectrograph 22 that
resolves a broad spectrum of the return light. A
spectrograph was used to collect the data discussed below.
A long pass filter 26 (Schott WG335) is placed within the
spectrograph to filter from the return light, any
excitation light that may have been collected by the
collection fibers 18. An ultraviolet enhanced grating
(150 grooves per millimeter), located after an entrance
slit of the spectrograph disperses the return light into
its constituent wavelengths. A silicon diode array
detector 28 having 1024 elements collects the dispersed
return light and generates an electrical signal that
serially represents the intensity of return light
collected in each element. An EG&G optical multichannel
CA 02238518 2004-07-09
-9-
analyzer (OMA III) receiving the electrical signal can
display a graph representing the intensity of return light
within the desired wavelength band or bands of interest.
Before the concentration of glucose can be
determined in a sample having an unknown glucose
concentration, a model must be prepared that accounts for
certain nonlinearities between the glucose concentration
and certain measured parameters. The process of deriving
the model is better understood with reference to FIG. 2.
The spectrum shown in FIG. 2 is the emission spectra of
different glucose concentrations after excitation with an
ultraviolet excimer laser light having a wavelength of 308
nanometers. Each spectrum is shown to have a double peak
shape. One spectral peak is associated with a narrow
wavelength band centered at about 346 nanometers,
apparently produced as a result of vibrational raman
scattering, and a broad emission band centered at
approximately 440 nanometers, believed to be produced
largely by direct glucose and water fluorescence.
The wavelength of the peak associated with the
narrow raman scattering band is approximately 30 to 50
nanometers longer than the wavelength of the excitation
light and shifts generally in proportion to shifts in the
wavelength of the excitation light.' The shape and
emission wavelengths of the broad glucose emission band
generally is not a direct function of the excitation
wavelength.
As shown in Table I below,, the emission
intensity associated with eight representative wavelengths
does not vary linearly with glucose concentration over the
clinically relevant range of 80 to 300 milligrams per
deciliter. The eight representative wavelength are
indicated by the vertical.lines in the graph of FIG. 2.
CA 02238518 1998-05-26
WO 97/20495 PCT/US96/18532
-10-
Table I
Wavelength (nanometers)
Concent 342 344 347 352 360 370 385 400
r(mg/dl)
80 56.3 116 87.4 86.9 95.4 106 80.8 54.6 =
100 72.5 145 105 103 120 123 98.9 60.3
120 67.8 126 91.9 78.2 92.9 103 74.6 45.9
140 62.1 121 93.9 80.0 95.8 102 76.2 47.6
160 57.9 120 81.4 73.4 87.8 104 75.3 46
200 51.1 102 77.3 80.1 88.3 101 71.3 46.3
220 48.6 104 74.4 74.2 83.8 96.6 71.1 42.4
240 58.6 102 84.6 78.5 84.5 95.9 73.4 46.6
300 55.4 107 71.9 67.9 77.9 86.9 65.1 4.19
Instead, as shown in FIG. 3,the relationship
between measured intensity and glucose concentration is
highly nonlinear and presents a different profile at
different wavelengths. More particularly, as the glucose
concentration in water increases, the intensity at a
wavelength of 370 nanometers generally increases as the
glucose concentration increases until the concentration
reaches about 500 milligrams per deciliter. At this
point, the intensity then begins to taper off or decrease
with increasing concentration. Similarly, the intensity
at at a wavelength of 347 nanometers, generally the
wavelength of the raman scattering peak generally
increases and then decreases with increasing glucose
concentration. Note however, that the rate of change for
the intensity versus glucose concentration is different
for each of the curves.
In designing a model to predict the glucose
concentration, several approaches are available to account =
for the nonlinear effects discussed above. One method is
to restrict the calibration curve to small segments which
CA 02238518 1998-05-26
WO 97/20495 PCT/US96/18532
-11-
are approximated by a simple linear model. Another method
is to perform a transformation on the nonlinear variable.
Finally, the calibration curve can be modeled using a
polynomial fit.
Polynomial curve fitting for providing a
predictive model is achieved using statistical techniques
based on a least squares regression method. A common
regression technique known as partial least squares (PLS)
regression has been found to provide a robust model in
that the model parameters do not change significantly when
new samples are taken. The algorithms and theoretical
basis for PLS predictive modeling can be found in
Brereton, R.G. Chemometrics: Applications of Mathematics
and Statistics to Laboratory Systems, New York: Ellis
Horwood, 1990. A basic overview of PLS regression can be
found in Gerald and Kowalski, "Partial Least-Squares
Regression: A Tutorial" Analytical Chimica Acta 185
(1986):1-17.
The PLS regression technique begins by
"autoscaling" each variable such that all the variables are
equally influential in the prediction. The PLS regression
technique uses principle component analysis, also known as
singular value decomposition or eigenvector analysis, to
represent the dependent and independent matrices. In
principle component analysis, a NIPALS algorithm is used
to define a data matrix of independent variables. PLS
regression techniques introduce a weighting factor into
the regression model. The PLS algorithm gives a sequence
of models, the best model being the one that minimizes the
cross-validation.
For example, from Table I, a data matrix of
independent variables (the glucose concentration is the
dependent variable), consisting of the emission intensity
at the different wavelengths, is provided to a data
processing routine that performs the PLS regression. In
this example, the data processing routine is included in
CA 02238518 1998-05-26
WO 97/20495 PCT/US96/18532
-12-
the "PLS_Toolbox Version 1.3" available from Barry M. Wise,
1415 Wright Avenue, Richland, WA 99352 (E-mail:
bm wise@pnl.gov). The routines in the "Toolbox" are
presently intended for use with the MATLABT"' software
package available from The Mathworks, Inc., 24 Prime Park
Way, Natick, MA 01760. In using the routine, the matrix associated with the
spectral intensities at each
wavelength and the matrix associated with the
concentration values have their means removed before
processing. The routine calculates a regression vector
shown in FIG. 4 and in Table II below. The scalar
components of the regression vector are the prediction
coefficients for each wavelength.
Table II
Number Wavelength Coefficient
1 342 0.8946
2 344 -1.0627
3 347 -1.2613
4 352 -0.2548
5 360 1.1316
6 370 -1.4846
7 385 2.0911
8 400 -0.9403
To make a prediction on a sample of unknown
concentration, the intensity at each of the eight
wavelengths is measured. These eight measured values are
scaled and multiplied by the regression vector, i.e., the
eight wavelength coefficients in Table II. The result is
a scaled concentration prediction. The scaled predicted
concentration must be rescaled to provide a concentration
value in the original units.
Because eight different wavelengths were used,
the model can yield up to eight latent variables. Table
III below shows the percent of variance that was accounted
for with the addition of each latent variable to the
model.
CA 02238518 1998-05-26
WO 97/20495 PCT/US96/18532
-13-
Table III
Percent Variance Captured by PLS Model
X-Block Y-Block
LV ~ This LV Total This LV Total
1 75.6695 75.6695 77.9674 77.9674
2 8.5652 84.2347 15.3105 93.2779
3 3.4081 87.6428 3.9910 97.7993
4 8.9551 96.5979 0.5305 97.7993
5 1.9529 98.5508 0.4636 98.2629
6 0.5536 99.1045 0.6821 98.9450
7 0.2573 99.3618 0.7112 99.6562
8 0.6382 100.00 0.0031 99.6593
In developing the predictive model, the cross-
validation calculation is used to determine the optimum
number of latent variables to use in the model. The
cross-validation is performed by using one spectra chosen
at random to test the model. The cross-validation is
repeated ten times, randomly choosing a different spectra
to test the model. The results of the cross-validation
are shown in the press plot of FIG. 5 as a plot of the
prediction residual sum of squares (PRESS) versus the
number of latent variables used in the model. The PLS
analysis yielded a model of six latent variables.
The cross-validation was repeated using blocks
of two spectra at a time to test the model. The press
plot associated with the two spectra cross-validation is
CA 02238518 1998-05-26
WO 97/20495 PCT/US96/18532
-14-
shown in FIG. 6. FIGS. 5 and 6 shows that the minimum
PRESS exists between five to seven latent variables.
The predictive model was tested using samples of
known glucose concentration. FIG. 7 shows the results of
a prediction test using samples of known glucose concentration in the PLS
prediction model using six latent
variables, derived from Table I, to define the model. As
seen from the graph, the PLS model provides a fairly
accurate prediction of the glucose concentration. By way
of comparison, the test was repeated for a multiple linear
regression (MLR) model based on the same input data. The
PLS model generally performs better than the MLR model at
lower concentration levels while the MLR model performs
better at at higher concentration levels.
FIG. 8 shows the results of another prediction
test again using samples of known glucose concentration in
testing PLS and MLR models. However, for this test, the
PLS model uses seven latent variables to define the model.
As can be seen by the graph, both models provide
substantially the same results. Thus, using additional
latent variables in the model does not necessarily improve
the model's prediction accuracy.
However, it can be shown by the following
example that the predictive model can be improved by using
a greater number of wavelengths for generating the model.
The emissions spectra from the 1,024 elements of the
detector array provides a like number of intensity values.
Approximately 200 of these points are in the wavelength
range of glucose UV-visible emission light (approximately
335 to 450 nanometers) and the data is truncated to this
range. To reduce the effects of noise, the spectra is
measured three to five times for each glucose
concentration. An average of each of these spectra is
used to generate the model. To further remove noise, a
smoothing function is performed on the spectra using a
three point moving average (X;(smoothed) =(Y-1 + iX +
CA 02238518 1998-05-26
WO 97/20495 PCT/US96/18532
-15-
Xi+l)/3 . The data for the truncated smoothed spectra was
converted into a smaller file by averaging three points at
a time to arrive at one point. For example, 180 points
become 60 points. Thus, 60 wavelengths for each
concentration level, preconditioned as discussed above,
are analyzed in this example to arrive at a predictive
model using the PLS regression technique, instead of the
eight different wavelengths from Table 1 used in the
previous example.
As shown in FIG. 9, the PRESS plot for the model
using the whole spectra indicates a minimum PRESS at six
latent variables. A test of the model ~sing samples of
known concentration is shown in FIG. 10. As can be seen
by the graph, the PLS predictive model, using the
preconditioned spectra, provides a very accurate
prediction of the glucose concentration. Given the
generally noisy nature of the spectral measurements, and
the non-linear relationship between the glucose
concentration and the emission intensity at any given
wavelength of interest, the results indicated in FIG. 10
are indeed surprising.
A second embodiment of the present invention
focuses on the nonlinear relationship between the glucose
concentration and the intensity of the excitation light.
FIG. 11 shows emission spectra, at a single glucose
concentration, resulting from excitation light delivered
at different intensity levels. As shown in Table IV
below, the emission intensity at a wavelength associated
with the raman peak, normalized with respect to the
broader florescence peak, is nonlinear with respect to the
excitation energy at given concentration level.
CA 02238518 1998-05-26
WO 97/20495 PCT/US96/18532
-16-
Table IV
Excitation Energy (mj/pulse)
Concentr (mg/dQ) .25 .5 1 3 5 7 10
0 1 .92 .95 1 1 1 1
1 .78 .71 .71 .76 .79 .86 .84 10 .8 .7 .73 .73 .8 .84 .82
50 .69 .64 .71 .7 .77 .73 .78
100 .74 .7 .75 .81 .95 .88 .87
500 .72 .73 .67 .8 .86 .72 .85
1000 .84 .83 .84 .84 .97 1 .93
The values in Table IV can be used to provide a
predictive model, using the PLS regression technique, as
discussed above, with respect to Table I. Thus by varying
the intensity or energy of the excitation light, the
glucose concentration of an unknown sample can be
determined using a predictive model provided by PLS
analysis.
The present invention takes into account the
nonlinear nature of the physical interaction between the
glucose molecules and the water molecules. FIG. 12 shows
the emission spectrum of distilled water illuminated by
excitation light having an energy of 5 millijoules per
pulse (18 millijoules per millimeter per square
millimeter). The graph shows that the florescence spectra
for distilled water exhibits a broad florescence band with
a peak at approximately 370 nanometers and a narrow raman
scattering band at approximately 346 nanometers. The
raman scattering band results from scattered incident
light having its wavelength shifted by the energy
(rotational and translational) of the water molecules.
The emission spectrum of ultra anhydrous glucose
is shown in FIG. 13. The resulting spectrum has a single
broad fluorescence band that peaks at approximately 450
CA 02238518 1998-05-26
WO 97/20495 PCTIUS96/18532
-17-
nanometers. As shown in FIG. 14, the emission spectrum of
anhydrous glucose, which has absorbed a small but
spectrally significant amounts of water, exhibits two
narrow raman scattering bands that peak at 341 nanometers
and 346 nanometers, respectively, and one broad emission
band that peaks at about 420 nanometers. The raman
scattering peak at 346 nanometers corresponds to the raman
peak of water shown in FIG. 12. The raman scattering peak
at 341 nanometers apparently results from interaction
between the water and glucose molecules. Further, the
spectrum of the anhydrous glucose is shifted to shorter
wavelengths when compared with the spectrum of the ultra
anhydrous glucose shown in FIG. 13. The emissions spectra
of anhydrous glucose, as the excitation energy is varied,
are shown in FIG. 15. The intensity of spectra generally
increase as the excitation energy increases. However, the
intensity ratio between the peaks of the raman bands and
the broad emission band does not remain constant as the
excitation energy increases.
Further, as shown in FIG. 16, the ratio between
the raman scattering band and the broad emission band
similarly does not remain constant as the concentration
increases. Accordingly, the interaction between the water
and glucose molecules, and the energy density of the
excitation light all appear to effect the resulting
emission spectra. Accordingly, simple linear models are
effective as an approximation only along very narrow,
discrete segments of possible glucose concentrations of
interest.
From the foregoing, it will be appreciated that
the glucose concentration can be accurately predicted in
spite of signal noise and nonlinear relationships between
the glucose concentration and certain spectroscopic
parameters of interest. The prediction is performed using
a model developed from a PLS regression analysis.
CA 02238518 1998-05-26
WO 97/20495 PCT/US96/18532
-18-
Although the foregoing discloses preferred
embodiments of the present invention, it is understood
that those skilled in the art may make various changes to
the preferred embodiments shown without departing from the
scope of the invention. The invention is defined only by
the following claims.
~