Note: Descriptions are shown in the official language in which they were submitted.
CA 02243~71 1998-07-20
BM 4312/OA/WO
English translation of international patent application
PCT/DE 97/00168 (WO 97/27469)
Applicant: Boehringer Mannheim GmbH, Mannheim, DE
Method and apparatus for determining an analyte in a
scattering matrix
The invention relates to a method and an apparatus for
analysing a scattering matrix with respect to an analyte
contained therein by means of light.
The most important application of the invention is the
analytical investigation of biological samples, in particular
of the tissue of a living organism. Biological samples are
mostly optically heterogeneous, i.e. they contain a large
number of scattering centres at which irradiated light is
scattered. This applies to human or animal tissue, in
particular skin tissue or subcutaneous fatty tissue, but also
to fluid biological samples, such as blood for example, in
which the blood corpuscles form scattering centres, or else to
milk, in which the scattering centres are formed by emulsified
fat droplets.
Furthermore the invention is directed towards
scattering matrices in general in which an analyte is to be
determined qualitatively or quantitatively. A scattering
matrix in this sense is a three-dimensional structure with
such a high density of optical scattering centres that
irradiated light is generally scattered many times before it
leaves the scattering matrix again. Non-biological scattering
CA 02243~71 1998-07-20
matrices which can be investigated on the basis of the present
invention are for example emulsions and dispersions such as
are required for various purposes, for example for paints and
varnishes.
Reference will be made below, without restriction of
the general concept, to the analysis of tissue as an example
of biological and other scattering matrices.
The object of the analytical methods towards which the
invention is directed is the determination of an analyte in
the sense that information on the presence of a particular
component contained in the tissue is obtained. The information
can relate to the concentration of the analyte (quantitative
analysis) or simply to the question whether the analyte is
contained (in a concentration above the detection limit of the
method) in the sample (qualitative analysis).
Analyses of tissues and other biological samples have
to date mainly been carried out invasively, i.e. a sample
(mostly a blood sample) is removed from the tissue, and the
analyte concentration therein is determined by means of
reagents.
There has been increasing discussion in recent times
of non-invasive methods of analysis, in which the analytical
result is determined painlessly and without reagents from the
tissue without sampling. Most of the methods discussed for
this purpose are based on the interaction of light with the
scattering matrix. In all of these methods, measurement steps
are carried out in which light is irradiated into the matrix
as primary light through an interface bordering the matrix and
CA 02243~71 1998-07-20
light leaving the matrix is detected as secondary light. The
purpose of this is to measure a measurable physical property
of the light which varies due to the interaction of the light
with the matrix and which correlates with the concentration of
the analyte in the matrix. Such a procedural step will be
described here as the "detection step" and the measurement as
the "detection measurement". A detection step may include one
or more detection measurements.
The wavelengths of light which are discussed for such
methods lie in general between about 300 nm and several
thousand nm, i.e. in the spectral range between near-UV and
infrared light. The physical property of light which can be
determined (detected) in the detection step, which can also be
described as the "quantifiable parameter", will be described
below as the "measurement quantity" for the sake of
simplicity.
An absolute measurement of the analyte concentration
is generally not possible with the methods discussed here.
Therefore a calibration is required (as with most of the
analytical methods based on chemical reactions). In at least
one calibration step, which is performed with the same
measuring techniques as a detection step, at least one
detection measurement is carried out on a scattering matrix
with a known analyte concentration. In the analysis of living
tissue, this takes place with advantage by means of a
comparison measurement using any known analytical method.
In an evaluation step of the analytical method the
analyte concentration is determined from the change in the
measurement quantity in at least one detection step in
CA 02243~71 1998-07-20
comparison with at least one calibration step. The evaluation
step incorporates an evaluation algorithm, in which the
analyte concentration is determined in a predetermined manner
from the results of at least one detection step and at least
one calibration step.
Most of the methods of this kind are based on the
principles of spectroscopy, i.e. on the investigation of the
spectral dependence of the optical absorption. To this end
detection measurements are carried out at at least two
different wavelengths of light. Whereas in a clear fluid this
is a well-established trouble-free method, the spectroscopic
analysis of tissue and other scattering matrices is very
difficult.
Firstly, the useful signal (the change in the
absorption spectrum as a function of a change in the analyte
concentration) is very small for most analytes, and the said
small useful signal is accompanied by a considerable noise
background resulting in particular from the optical absorption
of water and other strongly absorbing components (inter alia
the red blood pigment haemoglobin).
Secondly, there exists in a scattering matrix, by
virtue of the multiple scattering of the light, the problem
that the optical path length travelled by the light in the
sample is unknown. A knowledge of this path length is however
a prerequisite for being able to determine the concentration
of an analyte according to Lambert-Beer's law during a
spectroscopic analysis.
CA 02243~71 1998-07-20
Many attempts of various kinds have been made to solve
these problems. In particular, comparison techniques are
applied, in which an attempt is made to eliminate the
influence of strongly absorbing interfering substances and
also the influence of the multiple scattering and resulting
absence of knowledge of the optical path length, by a
plurality of detection measurements and the calculation of
ratios or differences. The problem of the unknown optical path
length is specifically addressed by time-resolved
spectroscopy.
Despite these efforts, the spectroscopic analysis of
tissue has acquired practical importance for only one analyte,
namely the red blood pigment haemoglobin (Hb or its oxidized
form HbO2). These substances are so strongly absorbent and are
present in such high concentrations that a spectroscopic
determination with the known methods is possible. It is
precisely this strong optical absorption, however, that is a
fundamental reason why the spectroscopic analysis of other
analytes has been unsuccessful to date.
Glucose is a particularly important analyte, because
if diabetics are to be treated successfully over a long
period, the glucose levels in the body have to be monitored
continuously as far as possible. In order to prevent serious
late traumas such as blindness or amputation of limbs, for
example, the glucose concentration has to be determined at
least five times a day. This is scarcely possible with
invasive methods.
The optical absorption of the tissue depends to only a
very small extent, however, on the glucose concentration.
CA 02243~71 1998-07-20
Spectroscopic principles have therefore not been successful.
Various alternative methods for the non-invasive determination
of the glucose concentration are being discussed.
For example, in European patent specification
0 074 428 it is assumed that the glucose molecules scatter a
beam of light transmitted through a glucose solution in a
characteristic manner and that the glucose concentration can
be determined from the solid angle distribution of the
transmitted light intensity leaving a test cuvette or a body
part under investigation. In WO 94/10901 the spatial
distribution of the secondary light intensity at the interface
is determined as a measure of the glucose concentration, and
it is explained that the said spatial distribution depends in
a characteristic manner on the glucose concentration in a
tissue sample. The reason for this is that because of the
multiple scattering in the tissue the glucose concentration
influences to a surprisingly high degree the spatial
distribution of the secondary light leaving the interface.
DE 4 243 142 A1 describes a method for determining the glucose
concentration in the anterior chamber of the eye, in which the
optical absorption and the rotation of polarized irradiated
light are described as measurement quantities. In WO 95/30368
various possibilities are described for determining the
glucose concentration on the basis of LCI (Low Coherence
Interferometry) measurements, in which inter alia the
scattering coefficient and the index of refraction, both of
which depend on the glucose concentration, are discussed as
measurement quantities.
The methods described in these publications are
important starting points for solving the problems associated
CA 02243~71 1998-07-20
with non-invasive analysis in tissue samples. They are
limited, however, to a particular analyte, namely glucose.
Also for principle reasons the selectivity is relatively
small.
The invention is directed to the object of providing a
method and an apparatus for analysing tissue or other
optically strongly scattering matrices. Said method should
make it possible to analyse selectively an analyte contained
therein even if the total optical absorption of the scattering
matrix is influenced to only a very small extent by the
concentration of the analyte.
The object is achieved, with a method incorporating at
least one detection step and at least one evaluation step in
the sense explained above, by the fact that two selection
methods are used in combination with one another for the
selective detection of secondary light coming from a defined
measuring depth of the sample:
- Firstly, the primary light is focussed by means of
an optically focussing element onto a region of focus, and the
region of focus is imaged by means of an optically focussing
element onto a light entry aperture disposed in the light path
of the secondary light to the detector, so that the detection
of the secondary light is concentrated on the region of focus.
- Secondly, an additional depth selection means is
used to detect selectively, as secondary light, light
reflected from a defined measuring depth which coincides with
the depth of focus. In particular a low coherence
CA 02243~71 1998-07-20
reflectometric measuring method or a "time-gating" method is
used as an additional depth selection means.
The invention also provides an apparatus for carrying
out such a method with a measuring head with a sample contact
surface for placing against an interface of the scattering
matrix, light irradiation means with a light transmitter for
irradiating primary light into the scattering matrix through
the sample contact surface and the interface, detection means
with a detector for detecting secondary light leaving the
scattering matrix through the interface and the sample contact
surface, and evaluation means for deriving information on the
presence of the analyte in the matrix from the measuring
signal of the detector, in which the irradiation means and the
detection means each comprise an optically focussing element,
the optically focussing element of the irradiation means
focusses the primary light onto a region of focus in the
matrix at a depth of focus below the interface and the
optically focussing element of the detection means images the
region of focus onto a light entry aperture disposed in the
light path of the secondary light to the detector, whereby the
detection of the secondary light is concentrated on the region
of focus. An additional depth selection means is provided for
detecting, as secondary light, light reflected selectively
from a defined measuring depth, wherein the measuring depth
coincides with the depth of focus.
An arrangement in which an object is illuminated with
light focussed onto a focal point (focus) and the observation
is concentrated on the same focus is designated as a "confocal
arrangement". Such a confocal arrangement is known for various
purposes, for example from the following references:
CA 02243~71 1998-07-20
1) C.J.R. Sheppard et al.: "Imaging performance of
confocal fluorescence microscopes with finite-sized source",
Journal of Modern Optics, 41 (1994), pp. 1521 - 1530.
2) US patent 5,192,980
3) US patent 5,345,306
4) EP 0689045
Since in the confocal arrangement the light is
concentrated on the region of focus at a particular depth of
focus and the detection is also concentrated on the same
region of focus, the confocal arrangement results in a certain
depth selection. The detector detects selectively photons
which are reflected at a distance from the interface which
corresponds to the depth of focus of the confocal arrangement.
In order to obtain the advantageous results of the present
invention, it is necessary however to employ an additional
depth selection means by means of which light reflected from a
defined measuring depth coinciding with the depth of focus is
detected selectively as secondary light. As mentioned, a time-
gating method is suitable. Particularly preferred, however, is
an additional depth selection using a low coherence
reflectometric measuring method.
As a result of the confocal arrangement, photons which
are scattered in the matrix on the path from the focus to the
interface and are thus deflected do not reach the detector
through the light entry aperture disposed in front of the
detector in the light path. The signal of the detector is
therefore predominantly indicative of photons which are
reflected from a structure in the region of the focus in the
scattering matrix and which leave the matrix unscattered.
CA 02243~71 1998-07-20
In practice it is not possible to focus the primary
light onto a geometric point in the matrix and to concentrate
the imaging on the same geometric point. Rather is it
inevitable, given optical imaging errors and the finite size
both of the light source and the detector-side light entry
aperture, that the confocal arrangement will cover a partial
volume of the matrix with a finite size. This partial volume
is named here the "region of focus".
When the method according to the invention and the
corresponding apparatus are used, changes in the concentration
of an analyte which causes only a very small share of the
total optical absorption lead to a relatively strong change in
the measuring signal. Therefore even with such difficult
analytes a selective analysis is possible. This is true in
particular in a wavelength range in which the analyte has an
absorption band.
The invention will be described in greater detail
below by means of embodiments shown in the figures.
Fig.l shows a block diagram of an analysis apparatus
according to the invention,
Figs 2a and 2b show graphs of the dependence of the
phase refractive index on the light wavelength for two
different concentrations of a glucose solution in water,
Fig.3 shows a bar chart of the group refractive index
of glucose and of two interfering substances, each dissolved
in water, for four different wavelengths of light,
CA 02243~71 l99X-07-20
Fig.4 shows the differential group refractive index
for the substances of Fig. 3 and two wavelength pairs in each
case,
Fig.5 shows part of an alternative embodiment of an
analysis apparatus in a schematic cross-sectional diagram,
Fig.6 shows a schematic cross-sectional diagram of a
further embodiment,
Fig.7 shows a schematic cross-sectional diagram of a
further embodiment,
Figs.8 and 9 show two schematic cross-sectional
diagrams of different embodiments allowing a spectrally
resolved measurement at several light wavelengths and
Fig.10 shows a schematic cross-sectional diagram of
an embodiment further modified on the basis of Fig. 7.
The analysis apparatus 1 shown highly schematised in
Fig. 1, partly in section and partly as a block diagram,
consists essentially of a measuring head 2 and an electronic
unit 3. The measuring head 2 lies with a sample contact
surface 4 against the interface S of a scattering matrix 6
(e.g. against the surface of human skin). In the measuring
head 2 are located light irradiation means 8 for irradiating
primary light 14 into the matrix 6 and detection means 9 for
detecting secondary light 19 leaving the matrix 6.
The light irradiation means 8 incorporate several
light trans-mitters 10, to each of which is assigned an
optical system 8a (formed in the case shown by the lenses 13
and 16) by means of which the primary light 14 is focussed
onto a region of focus 17 lying in the tissue at a
predetermined depth d of the matrix. In the embodiment shown,
a plurality of semiconductor light transmitters (light-
CA 02243~71 1998-07-20
emitting diodes) are integrated monolithically in a
semiconductor substrate (chip) 11. In order to allow good
focussing, the light transmitters 10 should be as small as
possible. Pinhole diaphragms 12a are located in front of the
light transmitters 10 in order to restrict the light exit
apertures 12.
The divergent light leaving the light exit apertures
12 is collimated by an arrangement of collimation lenses 13
and enters a beam splitter cube (BSC) 15 as a parallel beam of
light. The light leaving the opposite surface of the BSC 15 is
focussed onto the region of focus 17 by a focussing lens 16.
The light irradiation means, consisting of the light
transmitters 10 and the components 12, 13 and 16, are present
in multiple form (n-fold) and are disposed as a (preferably
regular) array 18 parallel to the interface 5 of the matrix 6
in such a way that primary light beams 14 are focussed onto a
plurality of regions of focus 17 which preferably lie at the
same measuring depth d in the tissue 6. In Figure 1 for the
sake of clarity the light path is shown for only one of the
regions of focus 17.
The secondary light leaving each of the regions of
focus 17 is collimated by the lenses 16 and falls back
coaxially into the primary beam. In the BSC 15 the beam is
divided such that the secondary light is reflected in the
direction of a detector 20 perpendicularly to the direction of
the primary light beam 14. A further lens 21 and a pinhole
diaphragm 22, which form the detector-side light entry
aperture 24, are located in front of the detector 20. The
lenses 16 and 21 together form an optical imaging system 9a by
CA 02243~71 1998-07-20
means of which the region of focus 17 is imaged onto the light
entry aperture 24 (strictly speaking onto the plane of the
detector-side light entry aperture 24).
The detectors 20 are present n-fold in the same number
as the light transmitters 10 and are disposed as an array
matching the light transmitters, with an optical system 16, 21
being assigned to each detector 20. Preferably semiconductor
detectors (for example avalanche photodiodes) are used, which
are integrated monolithically on a common semiconductor
substrate 23. The collimator lenses 13, the focussing lenses
16 and the imaging lenses 21 disposed in front of the
detectors 20 are preferably embodied as a "microlens array"
(16a, 21a). Microlens arrays of this kind are commercially
available.
The optical systems 8a and 9a, which form part of the
light irradiation means 8 and of the detection means 9, can be
embodied in a different manner in such a way that the
irradiation and imaging conditions explained are attained. In
particular, instead of the single lenses shown, multi-lens
systems (objectives), and in principle also mirrors can be
used.
The light irradiation means 8 allow to generate in the
scattering matrix, with the use of an optically focussing
element (here the focussing lens 16), an optical focus in the
region of focus 17. A result of the confocal arrangement of
the detection means 9 is (as explained above) that mainly
photons reflected in the region of focus 17 are detected by
the detectors 20 and only a small proportion of diffusely
scattered light reaches the detector 20.
CA 02243~7l l998-07-20
14
The electronic unit 3 contains a power supply circuit
25 for the light transmitters 10, an amplifier circuit 26 for
amplifying the output signal of the detectors 20 and an
evaluation unit 27 realised conventionally by means of a
microprocessor, which provides the desired analytical
information from the measuring signals of the detectors 20.
In order to provide by means of a "time-gating" method
an additional means of depth selection (i.e. for the selective
detection of photons which have been reflected at a measuring
depth coinciding with the depth of focus d), the power supply
circuit 25 generates extremely short signal pulses, which are
converted into very short light pulses by the light
transmitters 10. The amplifier circuit 26 and the evaluation
unit 27 are adapted to selectively detect within a defined
time window, which corresponds to the desired measuring depth
d, the secondary light received by the detectors 20.
Considering the extremely short light travel times and the
required precision, the means required for this are complex,
but are at any rate available. A required control line for
transmitting a trigger signal is labelled 25a in Figure 1.
More detailed information on various technologies suitable for
such measurements can be obtained from the relevant
literature. In particular the following publications may be
mentioned the contents of which are incorporated into the
present application text by reference:
5) "Femtosecond optical ranging in biological
systems", by J.G. Fujimoto et al., OPTICS LETTERS, 1986, 150 -
152.
CA 02243~71 1998-07-20
6) "Time-resolved Fourier spectrum and imaging in
highly scattering media", by L. Wang et al., APPLIED OPTICS,
1993, 5043 ff.
7) "A continuously variable frequency cross-
correlation phase fluorometer with picosecond resolution", by
E. Gratton et al., BIOPHYSICAL JOURNAL, 1983, 315 - 324.
Preferably in the invention a plurality of
measurements are made with different depths of focus d. To
this end the measuring head 2 is movable in a direction
perpendicular to the interface 5. Advantageously this vertical
positioning can be produced by means of a frame-type holding
member 28 supported on the interface 5 of the scattering
matrix 6 and by means of a positioning drive which is shown
symbolically as a double arrow 28a in Figure 1.
Due to the combination of measurement techniques
according to the invention the measuring signal of the
detectors 20 relates essentially only to photons which have
been reflected at a defined measuring depth d and pass
essentially unscattered from there to the respective detector
20. Unscattered photons are also named "ballistic" photons.
The arrangement according to the invention also, however,
detects photons which are scattered through a small mean
scattering angle. The path (propagation path) of such photons
runs in the vicinity of the geometric light path, and
therefore deviates only minimally from the shortest
(ballistic) path. Photons of this kind are named "quasi-
ballistic". The arrangement according to the invention can
thus be designated as a "depth-selective quasi-ballistic
measuring regime".
CA 02243~7l l998-07-20
16
According to the present knowledge of the inventors,
the following grounds can be given for the advantages of this
depth-selective quasi-ballistic measuring regime in the
determination of an analyte in a scattering, in particular
biological, matrix.
The ballistic or quasi-ballistic photons travel the
shortest possible path length in the sample and are therefore
absorbed to a relatively small extent. Interfering substances
having a strong light absorption which are contained in the
sample (in the case of tissue samples mainly haemoglobin and
water) therefore cause relatively small interference with the
measurement. The same effect is also the basis why the
measuring light, despite the strong absorption of these inter-
fering substances, can penetrate relatively deep into the
sample. Hence, for example in the skin, layers are reached in
which the concentration of the glucose varies in a significant
manner. Furthermore, due to the straight-line path of the
photons detected with the method according to the invention,
the length of the optical light path in the sample is defined.
It corresponds to twice the measuring depth d.
Of particular importance for the advantages achieved
with the invention is an effect which will now be explained
with reference to Figures 2 to 4. Under the measuring condi-
tions applying to the invention the attenuation of the
irradiated light intensity is determined mainly by the
scattering coefficient ~s and to only a lesser extent by the
absorption coefficient ~a~ Furthermore it must be borne in
mind, that in the case of the depth-selective quasi-ballistic
measuring regime of the invention, in contrast to a diffuse
CA 02243~71 1998-07-20
measuring regime, the light transmission is not described by
the corrected scattering coefficient ~s'~ but by the
uncorrected scattering coefficient ~s~ which is always greater
than ~s It was found in the context of the invention that the
uncorrected scattering coefficient and hence the measuring
signal depends under the measuring conditions according to the
invention to a relatively high extent on the concentration of
the analyte. Therefore with the invention the analyte-specific
signal variation is relatively large.
Figures 2a and 2b show the graph of the phase
refractive index np of a glucose solution in water for a
glucose concentration of 6.25 mmol (millimol per litre) and
100 mmol as a function of the wavelength L in ~m. These
measurement results were obtained with an interferometer, with
which the dependence of the phase on the doppler frequency
resulting from the movement of the interferometer mirror can
be determined. The dependence of the phase refractive index on
the wavelength shown in Figures 2a and 2b can be calculated
directly therefrom. Of particular interest is the slope of the
graph in the region of the absorption maximum at 2.lS ~m
(shown in dashes in Fig. 2b). This slope corresponds to the
group refractive index nG, which determines the scattering
behaviour in the scattering matrix.
Figure 3 shows in the form of bar charts for three
different substances, namely the analyte glucose (GLUC) and
the two important interfering substances NaCl and lactate
(LAC), the group refractive index nG for each of four
different light wavelengths. Figure 4 shows the differential
refractive index, referred to the wavelength. The group
refractive index differences dnG are plotted for the three
CA 02243~7l l998-07-20
18
substances and for the wavelength pairs 1.6 ~m minus 1.3 ~m
and 2.135 ~m minus 1.75 ~m.
The absolute values of the group refractive index nG
shown in Figure 3 are highest for glucose, but are also
considerable for the interfering substances NaCl and lactate.
The differential refractive index represented in Figure 4
shows a far clearer differentiation. In particular, a value
for dnG of 5xlO~6/mmol, for example, is obtained for the shown
wavelength pair 2.135 ~m minus 1.75 ~m. In this region a
solution of glucose in water has an absorption maximum. From
published literature data it can be derived that the
differential absorption coefficient (i.e. the change in the
absorption as a function of a change in the glucose
concentration) is about d~a = 2xlO~4/mmol (for a wavelength
L = 2.15 nm).
In a scattering matrix the light scattering, i.e. the
scattering coefficient ~s~ depends on the refractive index,
the size and concentration of the scattering particles, and on
the refractive index of the medium in which the scattering
particles are distributed. If these quantities are known, ~s
can be determined by means of the Mie theory, for which type
of calculations computer programs are available. In the case
of skin tissue as scattering matrix, the following approximate
values can be assumed:
- refractive index of the scattering particles
(cells): 1.41
- particle size: 10 ~m
- concentration: 5%
- refractive index of the interstitial fluid: 1.38.
CA 02243~71 1998-07-20
19
According to the Mie calculation these numerical
values lead to a scattering coefficient of 6.8 mm~1, i.e. a
value that is in agreement with measurement results for the
(uncorrected) scattering coefficient ~s in tissue. This
confirms that the numerical values assumed make sense. From
the above-mentioned value of the refractive index difference
(differential refractive index) dnG = 5xlO~6/mmol one may
obtain according to the Mie calculation a corresponding
differential scattering coefficient d~5 = 2.015xlO~3/mmol.
This value is 10 times as high as the above-mentioned
differential change in the absorption coefficient
(d~a = 2xlO~4/mmol).
It has thus been shown that the measuring arrangement
according to the invention detects a measurement quantity
which depends more sensitively on changes in the analyte
concentration than the optical absorption conventionally
measured in a diffuse measuring regime according to the prior
art.
The measuring conditions and the method of evaluation
can be optimized in view of the knowledge derived from the
invention, taking into account the following considerations.
Preferably at least two detection measurements with
different light wavelengths are performed. It is further
preferred to calculate in the evaluation step a quotient of
the measured values at the two different wavelengths and to
derive the information on the presence of the analyte on the
basis of the quotient. Thereby an interfering background
absorption can be largely eliminated if the total optical
absorption of the sample changes to a far lesser extent than
CA 02243~71 1998-07-20
the scattering coefficient. This can be explained by the fact
that the overall attenuation of the light intensity as a
function of the measuring depth d is in the case of ballistic
photons proportional to e~(~s+~a)d. Therefore ~a can be
eliminated if a quotient is formed from the measured intensity
values from two measurements with constant ~a values.
The measuring depth d is in the case of skin tissue
choosen based on medical considerations. In order to detect a
tissue layer whose glucose concentration can provide valuable
information in medical terms, the measuring depth should be at
least about 0.3 mm. Greater measuring depths lead, as
described, to an exponential decrease in the intensity of the
measuring signal. At the present time a measuring depth of
around 1.5 mm is regarded as the maximum upper limit in skin
tissue.
Preferably at least two measurements are made, in
which the measuring depth coinciding with the depth of focus d
is different. It is particularly preferable to perform
measurements with the same light wavelengths L1 and L2 at each
of the different measuring depths d1 and d2. It is thus
possible in an advantageous manner to prevent measuring errors
which are attributable to fluctuations in the intensity of the
irradiated primary light Io~ Fluctuations of this kind may be
caused not only by fluctuations in the intensity of the light
transmitters 10. In the case of measurements on the skin, a
fundamental problem is caused, in fact, by the passage of the
light out of the measuring head 2 through the interface 5 into
the sample 6 ("coupling"). Even small changes in the position
of the measuring head can cause changes of the intensity of
the primary light irradiated into the sample 6 which are
CA 02243~71 1998-07-20
greater than the measuring signal. These measuring errors can
be eliminated with the measuring arrangement according to the
invention if measurements are made at two different measuring
depths and a quotient is derived from the measured intensity
signals (at the same wavelength in each case).
It is also particularly advantageous if one of the two
measurements is made with a measuring depth as small as
possible and the second measurement with a measuring depth as
large as possible. The small measuring depth should lie below
the epidermis layer. A range between 0.3 mm and 0.5 mm can be
given as a guide value. The maximum size of the second
(greater) measuring depth is determined mainly by the
intensity of the measuring signal. The difference between the
two measuring depths should be at least 0.3 mm.
The size of the light entry aperture in front of the
detector is also of importance. In the literature the term
"true confocal imaging" has been coined to describe ideal
conditions for a confocal imaging arrangement. Further details
can be found in the article by Sheppard et al. cited further
above. Within the scope of the invention preferably a
substantially larger light entry aperture is used. It should
preferably be at most five times as large as that required for
a true confocal imaging (in accordance with the formulae given
in the article by Sheppard et al.). In general the diameter of
the light entry aperture in front of the detector should be
below 0.1 mm, preferably below 0.05 mm.
In practice it is most advantageous not only to work
with a single confocal arrangement and a single range of
focus, but to use a large number of confocal arrangements in
CA 02243~71 1998-07-20
the form of an "array", by means of which the primary light is
focussed onto a large number of ranges of focus in the
scattering matrix and these ranges of focus are each imaged
onto a detector through a particular aperture diaphragm. In
this way the total light intensity is increased with a maximum
power density given for medical reasons. In addition,
measuring errors due to microheterogeneities in the skin are
largely eliminated by averaging.
The desired analytical information is, as mentioned,
determined by means of an evaluation algorithm, which links on
the basis of a calibration the measured values of the measured
measurement quantity with concentration values. In the present
case this linking can be a simple one-dimensional evaluation
curve which assigns a concentration value to each of the
quotients from the measured intensity values of two
wavelengths or two measuring depths.
In recent times increasing use has been made of more
complex mathematical techniques to improve the correlation in
analytical procedures between the measurement quantities
(input variables) and the concentration sought (output
variable) and thereby to achieve a better analytical accuracy.
These techniques include in particular multilinear and non-
linear algorithms, which link several factors which are
required for the evaluation of the analytical measurement. In
the present case it may be advantageous, for example, to carry
out in each measuring step a large number of measurements at
different light wavelengths and to correlate these measured
values as a whole with the respective concentration value by
means of a suitable numerical algorithm. Suitable algorithms
are known and in some cases available commercially as computer
CA 02243~71 1998-07-20
programs. If such a technique is used, it may be advantageous
to use the measuring signals for at least two different
wavelengths and at least two different measuring depths
directly as input variables (i.e. without prior quotient
formation).
Although the above explanations relate mainly to
glucose as an analyte, the invention is also applicable to
other analytes, in particular if the following preconditions
apply: small specific optical absorption of the analyte
against a large absorption background; overall absorption of
the sample in the investigated wavelength range largely
constant; strong wavelength-dependent variation of the optical
absorption (and hence also of the refractive index of the
interstitial fluid) in the investigated wavelength range.
Alcohol may be mentioned as a possible analyte with such
properties. The suitability of the invention for a particular
analysis can be tested on an individual basis by an
experimental testing of the arrangement according to the
invention over a greater light wavelength range, and an
optimum wavelength range established.
Figure 5 shows an embodiment in which a low coherence
reflecto-metric measurement is carried out as an additional
depth selection means in the measuring step. Such a technique
is also referred to in English as "LCI (low coherence
interferometry) reflectometric measurement" or else as
"optical coherence domain reflectometry (OCDR)".
Interferometric measuring techniques of this kind are known
for various purposes. Reference may be made for example to the
publications:
CA 02243~7l l998-07-20
24
"Measurement of optical properties of biological
tissues by low-coherence reflectometry", by Schmitt et al.,
Applied optics, 32 tl993), 6032 - 6042, as well as WO 92/19930
and the already mentioned WO 95/30368.
It is essential for an LCI measurement that a part of
the light emitted by a light transmitter emitting over a broad
spectral band is separated by a beam splitter, is fed on a
reference light path to an optically reflecting element, is
reflected from the latter and is combined in front of the
detector with the measuring light path in such a way that the
secondary light and the reference light interfere with each
another. The light receiver measures an interference signal if
the optical light path length in the reference arm (from the
beam splitter up to the reflecting element) differs from the
optical path length of the measuring light path from the beam
splitter up to the reflection point in the sample by not more
than the coherence length of the light source. An interference
signal is only measured if this condition is fulfilled. This
can be used to limit the investigation of a sample to a
particular measuring depth d.
In the embodiment according to Figure 5 an additional
light path is provided which is formed by light reflected to
the left in the BSC 15 and forms the reference arm 30 of an
interferometer arrangement. The reference light is reflected
by a movable mirror 31 and falls back in the opposite
direction into the BSC 15, reaching the detector-side light
entry aperture (diaphragm pinhole 22) via the secondary light
path 19. The interference condition is fulfilled if the
optical light paths in the reference arm 30 (Up to the surface
of the mirror 31) and in the sample arm 32 (Up to the
CA 02243~7l l998-07-20
measuring depth d) are the same. The selective detection of
the light reflected from the measuring depth d can therefore
be improved by the adjustment of the mirror 31. Further
details on the use of the techniques for performing the LCI
method can be found in the literature references cited above.
A further special feature of the embodiment shown in
Figure 5 iS that both the light irradiation means 8 and the
detection means 9 comprise optical fibres 33 and 34
respectively, through which the light is passed from light
transmitters (not shown) to the BSC and from there to
detectors (likewise not shown). It is not of fundamental
importance for the invention whether the primary light (as in
Figure 1) is irradiated into the measuring arrangement
directly from the light transmitters 10 and is detected
directly by detectors 20 or whether light guides (as in Figure
5) are used. It is critical only that the effective light exit
aperture 12, from which the primary light enters the optical
system, and the effective light entry aperture 24 in the
secondary light path 19 have sufficiently small dimensions to
permit a sufficiently sharp focussing both in the primary
light path and in the secondary light path. The limitation of
the primary-side light exit aperture and the secondary-side
light entry aperture can be realised in different ways, for
example by diaphragm pinholes as shown or else by the
correspondingly dimensioned exit end of a light-conducting
fibre or by the size of the light-sensitive surface of a
detector.
In the arrangement with a BSC shown in Figures 1 and
4, there is a problem with Fresnel reflections caused by the
sudden change of the refractive index at the boundaries of the
CA 02243~71 1998-07-20
26
BSC. Light is thereby for example reflected from the boundary
surface 29 of the BSC through which the measuring light exits
into the sample (Figure 5). This strong reflection signal can
cause overload of the detector. To prevent this, the
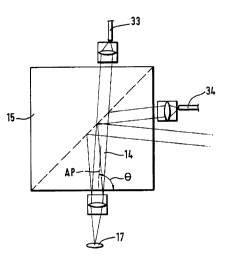
embodiment of Figure 6 shows an arrangement in which the axis
AP of the primary light beam 14 is inclined relative to the
corresponding limiting surface 29 at an angle Q which is less
than 90~. The light beam 35 reflected specularly as a result
of Fresnel reflection consequently does not impinge on the
detector 20.
In Figure 6 the deviation of the angle Q is shown
highly exaggerated. In practice a very small deviation of less
than 1 suffices to ensure that specularly reflected light no
longer impinges on the light-detector-side light entry
aperture 24.
With the embodiments of Figures 1, 5 and 6 the
secondary light reflected back coaxially out of the region of
focus is detected (i.e. the axis AP of the primary light and
the optical axis AS of the secondary light coincide between
the optically focussing element and the focal point). By
contrast, Figure 7 shows an embodiment in which the optically
focussing elements of the irradiation means 8 and of the
detection means 9 are separate, whereby the optical axis on
which the light is irradiated into the sample and the optical
axis on which the light is detected differ. In the embodiment
shown the primary light irradiated by a light-conducting fibre
32 for each region of focus 17 of an array passes through a
first lens 40 and a second lens 41, which has twice as large a
diameter as the first lens. The focussed light penetrates the
matrix 6 asymmetrically. After backscatter the secondary light
CA 02243~71 1998-07-20
passes through the second lens 41 and a third lens 42 in
reverse sequence. In this embodiment the system of lenses 40,
41, 42 again makes sure that the primary light 14 is focussed
onto the region of focus 17 and this region of focus 17 is
imaged onto the detector-side light entry aperture 24. The use
of a total of three lenses with the arrangement shown has the
advantage that commercially available microlens arrays can be
used. Conversely, if the lenses are arranged obliquely (i.e.
not parallel with the surface 5 of the matrix 6, which is also
possible in principle), customized manufacture of the
microlens arrangement is required.
With the embodiment according to Figure 7 no
interference problems involving Fresnel back reflection can
occur, since no light reflected specularly from a straight
face reaches the detector. Optical errors in the lenses (in
particular aberration errors) lead to distortions and hence to
a less sharp definition of the region of focus 17. This,
however, is not normally a problem. Known optical correction
measures can be applied if necessary.
Figures 8 and 9 show two possible ways to allow
measurement with a plurality of light wavelengths with the
general layout of Figure 7.
In Figure 8 three laser diodes are used as primary
light transmitters lOa, 10b, lOc, which emit light at
different wavelengths and are preferably integrated on a
common substrate as an integrated optical system. These three
light transmitters radiate through different angles of
incidence onto a half-lens 45a, which collimates the light at
different angles. An optical grating 46 is arranged below the
CA 02243~71 1998-07-20
28
half-lens 45a, whose grating constant is so choosen, that the
collimated rays of different light wavelength impinging at
different angles are transformed into a common (collimated)
ray along the optical axis. This ray is focussed onto a light
exit aperture 12 through a second half-lens 45b.
On the detector side there is a corresponding
arrangement consisting of two half-lenses 47a and 47b, the
grating 46 and detectors 20a, 20b, 20c for the various light
wavelengths. The two half-lenses 45a, 45b, 47a, 47b form with
the grating a sandwich which can be made in a simple manner by
the use of microlens structures.
In the embodiment according to Figure 9 the three
laser diodes are replaced by a single laser diode 10 emitting
broad band light radiation. Here the wavelength selectivity is
effected by the grating and the three detectors 20a, 20b, 20c
arranged at different angles behind the grating. This
arrangement is simpler than that of Figure 8 but the
wavelength selectivity is reduced.
Figure 10 shows the manner in which a low coherence
reflecto-metric measurement is possible as an additional depth
selection means with an embodiment according to Figures 7 to
9. Only the central rays of the light beams are shown. A
horizontally positioned semireflective mirror 48 serves here
as a beam splitter for generating a reference beam. The
reflected light beam 50a impinges onto a reference reflector
51, whose distance from the semireflective mirror 48
corresponds to the distance of the region of focus 17 from the
semireflective mirror 48. On grounds of symmetry the light
impinging onto the reference mirror 51 is focussed in the same
CA 02243~71 1998-07-20
29
manner as the light irradiated into the sample 6. The light
reflected from the reference reflector 51 falls back as a
light beam 50b onto the semireflective mirror 48 and is
reflected from there in the direction of the reflector. In
this arrangement the beams 50a and 50b form the reference arm
50 of the interferometer arrangement. The reference light can
be modulated by a vibrating reference reflector 51.
Alternatively an LCD element can be arranged in the light beam
and controlled with a suitable modulation frequency in such a
way that the reference light is modulated.