Note: Descriptions are shown in the official language in which they were submitted.
CA 02248923 1998-09-14
WO97/34130 PCT~S97/03477
--1--
RATE MONITOR FOR A DI~PL~C~N~T 8YSTEM UTILIZING THE
POWER DEMAND OF THE PRIME MOVER OF THE ~Y~ M TO PROVIDE
THE F~OW RATE DATA OF THE NAT~T~T~ BEING DI8PLACED
RELATED APPLICATION8
This is a regular application of provisional
applications serial nos. 60/013,175 and 60/016,612, filed
on March 12, 1996 and May 1, 1996, respectively, which are
herein incorporated by reference.
FIELD OF THE INVENTION
The present invention generally relates to an
apparatus and a method of generating flow rates for
displaceable materials in a displacement system using
conveyor belt, augers, bucket elevators, horizontal screws
~ dedicated pneumatic conveyors, and the like, by utilizing
the power demand of the prime mover of the system to
provide the flow rate data of the material being displaced.
BACRGROUND OF THE lNV~ lON
Prior art methods of measuring displaceable
material, such conveyed crushed rock, coal, feed, etc,
augered material such as powder, seeds, cement, etc, and
liquid material such as water, oil, etc, are limited to
conveyor belt and gravimetric scales which are calibrated
to read in unit weight per unit time, or liquid flow rate
meters reading in units of li~uid measure per unit time,
etc. The prior art methods strive for accuracy through
CA 02248923 1998-09-14
WO97134130 PCT~S97/034M
--2--
sophisticated electronic components in precision electro-
mechanical interaction, such as conveyor scales with
electronic load cells, sensing physical movement in
relation to the amount of material on the conveyor scale,
or rotary impellers coupled to a sensor for liquids, or
electronic physical displacement sensors mechanically
coupled to an impacting surface measuring the rate of
material flowing through a pipe, etc, resulting in the
desired unit of measurement.
Prior art conveyor belt scales typically consists
of a scale carriage with load cells and/or linear
~ differential transformers and associated electronic
circuits, a conveyor motion or speed sensor, and several
idlers before and after the scale carriage. Installation
of a conveyor belt scale generally requires mechanics and
welders to mount the scale to the conveyor frame,
~ electrician to run conduit and wires from the main panel in
the control room to the scale, and trained factory
technicians to inspect and configure the scale to the
specific application. Thus, the installation process can
be quite involved, including significant installation work,
lengthy field wire runs conveyor, frame modification, weigh
bridge installation, mechanical line-up for accuracy,
additional sensor mounting and associated wires for
conveyor speed, etc.
Conventional belt scales require almost constant
calibration and trimming to account for variations in
material density, conveyor belt carriage alignment,
conveyor belt centering, wedged rocks in-between the scale
CA 02248923 1998-09-14
WO97/34130 PCT~S97/03477
--3--
measuring beams, etc., to obtain material flow rate data
within the error tolerance of the scales. Maintenance
personnel would need basic understanding of the conveyor
belt system, scale carriage, load cell, speed sensor,
electronics associated, etc., in addition to being familiar
with voluminous user manuals. Thus, prior art systems are
sophisticated electro-mechanical systems requiring highly
trained personnel for installation and maintenance.
There is therefore a need for flow rate monitor
that replaces complicated belt scales and requires no
expertise on conveyor scales and their associated load
~ cells, linear voltage differential transformers, scale
beams, etc. and minimizes a large portion of the
installation headaches that generally accompany the
industrial belt scales.
OBJECT8 AND SUMMARY OF THE l~.v~ ON
It is an object of the present invention to
provide a rate monitor for displaceable materials that
involves no electronic load cells, linear voltage
differential transformers (LDT), etc, mechanical impellers,
switches, nor any kind of electro-mechanical interaction.
It is still another object of the present
invention to provide a rate monitor for conveyed materials
..
that eliminates the use of scale carriages fitted into the
conveying system.
It is still another object of the present
invention to provide a rate monitor for conveyed materials
that eliminates the need for conveyor frame modification or
CA 02248923 1998-09-14
W O 97/34130 PCTnUS97tO3477
--4--
the need to cut into a pressurized pipe to bolt a flow
sensor or gravimetric scale.
It is yet another object of the present invention
to provide a rate monitor for conveyed materials that
eliminates running lengthy field wiring for system power or
for signal cables back to the main control room.
It is another object of the present invention to
provide a rate monitor that minimizes the concern with a
conveyor angle of inclination which would interfere with
scale accuracy or the minimum number of idlers before and
after the typical conveyor scale installation.
It is still another object of the present
invention to provide a rate monitor for conveyed materials
that eliminates mechanical motion sensors.
It is yet another object of the present invention
to provide a rate monitor for conveyed materials that
provides system overburden/overload alarm.
It is another object of the present invention to
provide a rate monitor that is relatively easy to install,
thereby minimizing the installation-intensive problems
associated with prior art belt scales.
In summary, the present invention provides a flow
rate monitor for indicating the amount of material being
conveyed in a conveying system having a prime mover,
comprising power demand monitor for being operably
connected to the prime mover; a programmable controller
operably connected to the power demand monitor, the
controller being adapted to convert the data from the power
demand monitor and convert it to flow rate data using a
CA 02248923 1998-09-14
WO97t34130 PCT~S97/03477
--5--
linear relationship between the power demand of the prime
mover and the flow rate of the material; and an indicator
for indicating the flow rate of the material.
The present invention also provides a method for
measuring the amount of material being displaced in any
displacement system with an electric motor as a prime
mover, in a substantially linear region of operation where
the power demand of the prime mover is linearly related to
the flow rate of the material, comprising the steps of
calibrating the system to establish the linear relationship
of the power demand to the flow rate; measuring the power
demand of the prime mover; and calculating and displaying
the flow rate of the material being conveyed from the
linear relationship. In a system where the power demand is
not linearly related to the flow rate of the material, the
power demand is approximated by a series of linear zones
~ whereby the power demand is linearly related to the flow
rate in each zone.
These and other objects of the present invention
will become apparent from the following detailed
description.
BRIEF DESCRIPTIONS OF THE DRAWINGS
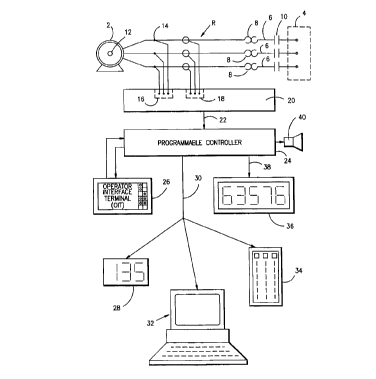
Figure l is a block diagram of a flow rate
monitor made in accordance with the present invention.
Figure 2 is a graph of the rate flow against the
power demand of the prime mover for a linear system.
Figure 3 is a graph of the rate flow against the
power demand of the prime mover for a semi-linear system.
CA 02248923 1998-09-14
WO97/34130 PCT~S97/03477
--6--
Figure 4 is a graph of the rate flow against the
power demand of- the prime mover for a non-linear system.
Figures 5A-5N is a flow-chart of a process in
accordance with the present invention for determining the
flow rate in terms of the power demand of the prime mover.
Figures 6A-6C are graphs of the flow rate against
the power demand of the prime mover when shifted by an
AUTO-TARE routine in accordance with the present invention.
Figure 7 is a flow-chart of a process in
accordance with the present invention for automatically
recalibrating the pulse output of the rate monitor to
~ correspond to the rate output.
DETAILED DESCRIPTION OF THE INVENTION
It is common knowledge that power used by an
electric motor to perform work is a product of the voltage,
current, cosine of the phase angle between the voltage and
current, known as power factor, and efficiency of the
motor. Efficiency is defined as the output power divided
by the input power. Where the line voltage of the system
is relative constant and the current varying linearly in
relation to the load impressed on the motor, power will be
fairly linear and will used in the present invention as an
indicator of the physical load on the system. The
efficiency of the electric motor is fairly constant at 15%
of full load or greater. Thus, monitoring output or input
horsepower is immaterial when the motor is loaded to
greater than 15% of full load.
CA 02248923 1998-09-14
WO97/34130 PCT~S97/03477
--7--
Power consumed by an electric motor that is operably
connected to a mechanical system displacing the material is
then directly proportional to the load on the motor and is
a reliable indicator of how much material the conveying
system is transporting at any given time.
The present invention will employ this
relationship between power consumed by an electric motor
and the amount of material being displaced. The load on an
electrical motor relates to the amount of work that it has
to perform or deliver, varying from a minimum no-load
condition to a maximum full-load condition. The power of
~ the electric motor is translated into output horsepower by
the following formula,
H~rseP~Weroutput = WattS~otor input * EffiCienCy/746.
Therefore, the more horsepower required to
transport material, the more power is required from the
~ electrical system; or the more material being transported,
the more power required to do the work. Hence, when
operably connected to a mechanical system, power consumed
and the resulting horsepower delivered by an electric motor
will be directly related to the amount of material in the
system from no-load to full-load, which can be represented
in accordance with the present invention, by a straight
line graph.
The present invention will now be described using
the example of a conveyor belt system. However, it should
be understood that the present invention would be equally
applicable to bucket elevators, horizontal screws, single
system/dedicated pneumatic conveyors, very short length
CA 02248923 1998-09-14
WO97/34130 PCT~S97/03477
--8--
conveyors, or any system utilizing an electric motor or
prime mover whose power output parameters can be monitored
to provide a measure of the amount of materials being
conveyed per unit of time.
A rate monitor R made in accordance with the
present invention is disclosed in Figure l. An electric
motor 2 is operably connected to a conveyor belt (not
shown) that is used to convey displaceable materials, such
crushed rock, coal, feed, etc. An electric panel 4
provides a three-phase power to the motor 2 through wires 6
with overload elements 8. A motor starter lO is provided
~ for starting or stopping the motor 2. The motor 2 has an
output shaft 12 that is mechanically coupled to the
conveyor belt.
The wires 6 are tapped at 14 and fed a voltage
sensor 16. Current sensors 18 are provided to measure the
~ current flowing through the lines 6. The voltage and
current data from the sensors 16 and 18 are combined in a
standard power measuring device 20 whose output signal 22
corresponds to the power demand of motor 2.
The output 22 is fed to a programmable device 24
that converts the power data from the device 20 into a flow
rate date for the materials being conveyed. An example of
~he power sensing unit is available from Load Controls,
Inc., lO Picker Road, Sturbridge, Massachusetts 01566,
Model PH-3A Powercell.
The programmable device 24 can be an electronic
circuit, programmable logic controller, embedded memory
card or any electronic device that is programmed in
CA 02248923 1998-09-14
WO97/34130 PCT~S97/03477
_g_
accordance with the present invention to process the power
data into flow rate data. An example of the programmable
device 24 is a programmable logic controller available from
PLC Direct, Model D2-04B, 305 Hutchinson Road, Cumming,
Georgia 30130.
An operator interface terminal (OIT) 26 is
operably connected to the device 24 and provides a means
for the user to input the necessary parameters to the
device 24 and to display data and messages during operation
of the monitor R. The operator interface terminal 26 is a
standard device, such as Model PV1000, available from PLC
~ Direct.
At least one output device is connected to the
programmable device 24 to obtain a readout of the material
flow rate. A flow rate display 28 converts the flow rate
output signal 30 to weight per unit time, such as ton/hour,
~ pounds/minute, etc. A process control computer system 32
can also be connected to the device 24 to monitor and store
the flow rate output 30. A process loop controller 34 can
also be connected to the device 24 so that depending on the
value of the flow rate output signal 30, certain valves,
pumps, etc, can be operated or otherwise controlled by the
controller 34.
A totalizer accumulator counter 36 can also be
..
connected to the device 24 through an integrator output
signal 36 which can be in the form of a pulse train,
wherein each pulse corresponds to a unit weight or fraction
thereof. An alarm 40 is connected to the device 24 to
indicate when a high or low power demand limit has been
CA 02248923 1998-09-14
WO97134130 PCT~S97/03477
--10--
reached. A high setting alarm would indicate system
overload while-a low setting alarm would indicate some
mechanical problems, such as mechanical disengagement of
the motor with the conveyor belt.
The programmable device 24 will now be described
in detail.
The monitor R approximates the relationship of
the electrical motor power output or power demand of the
motor 2 to the flow rate of material being displaced by the
conveyor with a series of connected straight line segments,
dividing the power curve into multiple zones, each zone
~ being represented by a linear equation. The present
invention will be described using up to three zones but it
should be understood that a greater number of zones can
also be used.
Referring to Figure 2, a single zone model is
disclosed, using the single straight line equation,
Y = MX + B,
where B is the Y intersect at Xl = 0,
M is the rate of change or slope of the line, or
M=(Y2-Y,)/(X2-xl)-
In Cartesian coordinates, the Y axis represents
the horsepower output or power demand of the electric motor
2 and the X axis represents the flow rate of the material
being conveyed or displaced by the conveyor belt.
The value of the slope M is derived from the
proportional relationship between an actual measured change
of displaceable material in the system and the respective
change in power output by the electric motor 2 to move,
CA 02248923 1998-09-14
W O 97/34130 PCTrUS97/03477
convey, transport, displace, or process the increase or
decrease in the displaceable material. The value of X
represents the material flow rate in units of weight or
volume per unit time, such as tons/hour, gallons/hour,
pounds/minute. etc.
The Y intersect or B is the minimum no-load power
output of the motor or prime mover operating or moving the
mechanical displacement or conveying system without any
material actually going through it. The Y intersect also
sets the area beyond which the motor efficiency remains
fairly constant. The value of B is generally greater than
~ 15% of the motor full load capacity. The efficiency curve
of the motor is substantially linear beyond the 15% point.
Accordingly, the horsepower output of the
electric motor and the flow rate of the material being
conveyed in a single zone system may be represented by the
~ following equation,
Y = M*X + B, or
X = (Y-B)/M.
Referring to Figure 3, a two-zone model is
disclosed, approximated by two straight line segments
represented compositely by the equations,
Y = MaX + B, or
X = (Y-B) /Mal
where Ma=(Y2-Y1)/(X2-x1)/ Y1<Y~Y2, Y1 B~ and
Y = Mb(X-X2)+y2, or
X = (Y-Y2~ /Mb + X2~
where Mb=(Y3--Y2)/(X3 X2) and Y2<Y<YMAX.
CA 02248923 1998-09-14
W O 97/34130 rcTnusg7/o3477
' -12-
Referring to Figure 4, the relationship between
horsepower output of the electric motor 2 and the flow rate
of the material being displaced, in a system that is not
substantially linear, is represented by a three-zone system
approximated by three straight line segments represented by
the following equations,
Y = MaX + B, or
X = (Y~B)/Ma,
where Ma=(Y2-Y,)/(X2-x1)~ Y1<Y~Y2, Y1 B,
y = Mb(X X2)+Y2, or
x = (Y--Y2)/Mb + X2~
- where Mb=(Y3-Yz)/(X3~x2)~ Y2<Y<Y3, and
Y = (X-x3)/Mc + Y3, or
X = (Y-Y3)/Mc + X3~
where MC=(Y4-Y3)/(X4-X3)~ Y3~Y<YMAX-
The three-zone system can be extended to a n-zone
system, where n is any integer, to approximate non-linear
displacement systems to n linear zones. The larger n is,
the better will be the approximation. Each zone is
calibrated as described for the single-, two-, and three-
zone systems above. In general, the flow rate as related
to the power demand is given as follows,
X=(HP-Yn)/Mn, where n is the number of zones,
M=(Yn+1-Yn)/(Xn~1-Xn) is the slope of the n-th line
segment,
HP is the horsepower demand of the electric
motor,
X is the flow rate,
Yn is the horsepower at the Xn belt cut, and
CA 02248923 1998-09-14
W O 97134130 PCTrUS97/03477
-13-
Yn+1 is the horsepower at the Xn~1 belt cut.
As a result of the mechanical system
transporting, processing or otherwise conveying the
material in which the electrical motor is the prime mover,
the power output of the prime mover may be related to the
quantity or amount of load or material being conveyed by
the above equations. The present invention translates the
electrical load on the motor to the amount of material, in
weight units per time, that the system is conveying or
transporting.
The device 24 includes a main system program
~ (MSP) that utilizes the linear equations disclosed in
Figures 2, 3 or 4 to provide flow rate data from the
monitored power output of the electric motor 2.
For a linear system, the equation disclosed in
Figure 2 is used. The slope M of the equation is
~ determined from the value of Y1 or B, which is the system-
no-load power demand, and the actual power output of the
electric motor under load and actual measurements of the
material being displaced by the conveying system. Once the
slope is determined, the material flow rate in weight/time
or volume/time is determined by the equation from the known
power output of the motor.
For a non-linear system, the equations disclosed
in Figure 3 or 4 are utilized, as appropriate, to
approximate the non-linearity of the system.
The system-no-load power demand B advantageously
offsets any changes in the power requirement of the system
caused by normal or accelerated wear and tear on the
CA 02248923 1998-09-14
W O97/34130 PCTAUS97/03477
-14-
mechanical parts of the displacement system, or the wetting
and drying of conveyors operating in wet weather
conditions, or when the mechanical components that have
aged through the years are replaced with new parts that
cause a decrease or lighter load to be impressed on the
electric motor of the system. The MSP also advantageously
uses the system-no-load data to detect abnormal mechanical
system conditions, indicating conveying system failure,
such as mechanical system failure with the conveyor belts,
gear box failure, etc, thereby advantageously replacing the
need for conventional mechanical or electro-~ech~nical
conveyor motion sensors (sometimes called zero speed
switches, rotary sensors, belt sensors, etc) that are
typically used in the prior art systems.
The MSP advantageously utilizes the full-load
data in the single-, two-, and three-zone system of the
~ power output of the electric motor to detect abnormal
conditions indicating mechanical system failure, jam, or an
electrical overburden that is not within the operating
range of the electrical system.
The MSP will now be described in detail in
reference to Figures 5A-5N.
The following parameters are entered into the MSP
via the terminal 26 for each specific application:
1. Maximum horsepower of the electric motor
used.
2. Time in seconds for the system to stabilize
under no load to provide the system-no-load power demand
(approximately 1-2 belt revolutions for belt conveyors and
CA 02248923 1998-09-14
WO97/34130 PCT~S97/03477
-15-
bucket elevators, or the time it takes for the material to
move from input to output for a horizontal screw).
3. Measured flow rate.
4. High horsepower alarm.
5. High horsepower alarm delay.
6. No-load-horsepower.
7. Number of zones.
Maximum system horsepower should be within the
maximum horsepower rating of the electric motor. Maximum
system horsepower is the absolute system full load
condition, or maximum work that the combined electrical and
~ mechanical system can safely provide momentarily without
going into electrical or mechanical overload. It is a
result of the combined effect of the electrical
requirements, the mechanical system together with the
maximum amount of material that the mechanical system can
~ transport, convey, displace, etc, without overloading the
motor.
The following description for the MSP will, for
the sake of simplicity, take into consideration a fairly
linear belt-conveying system requiring measurement in
tons/hour. The power demand of the electric motor will be
in horsepower. The conveyor belt speed is assumed to be
fairly constant regardless of the amount of material being
conveyed.
The displacing, processing, transporting,
conveying system, etc, is initially allowed to run empty
for a period of time until the power demand has stabilized.
CA 02248923 1998-09-14
WO97/34130 PCT~S97103477
-16-
Referring to Figure 5A, data from the power
demand monitor 20 is fed to the MSP, which continually
samples the instantaneous horsepower demand on the electric
motor at step 42, taking lO samples and averaging the
readings at steps 43 and 44. Ten samples are typically
taken every 5 sec. All references to horsepower that
follow mean average horsepower. A high horsepower value is
entered into the MSP at 45. The averaged horsepower
reading is continually compared to the high horsepower
alarm setting at step 46. An alarm is triggered at 48 if
the horsepower reading exceeds the high horsepower alarm
~ setting after a period of time determined by the high
horsepower alarm delay at step 50. The alarm delay
advantageously eliminates any false alarm caused by an
isolated high horsepower value.
The monitored horsepower is verified by the
system-no-load horsepower at step 52. The system-no-load
horsepower is determined by the AUTO-CALIBRATE or AUTO-TARE
routines, which will be described below. If the monitored
horsepower is below the system-no-load horsepower, an error
message is sent to the terminal 26 at step 54 and an alarm
is energized at 48. An alarm advantageously indicates that
a fault has occurred in the conveying system. Because
system-no-load horsepower is the minimum value needed to
energize the system unloaded, horsepower values below that
setting may indicate possible gear box malfunction;
slippage or disengagement of the motor form the conveyor; a
disconnect switch left open by maintenance personnel; or
CA 02248923 1998-09-14
WO97/34130 PCT~S97/03477
-17-
some possible problem involving the motor and its
associated control system and power supply
The AUT0-CALIBRATE routine is activated every
time there is a new system installation or whenever the
equation relating the horsepower to the flow rate has
changed, such as would occur when changing the electric
motor or any mechanical components of the displacement
system, shrinking or stretching of the conveyor line, or
- adding or modifying a system hardware.
Before calibrating the system through the AUTO-
CALIBRATE routine, it is important that the mechanical
integrity of the each component in the displacement system
is in good operational condition. For example, lubricants
are according to the gearbox or roller, etc. manufacturer's
recommendations, and bearings and alignment are properly
maintained to avoid excess friction, and general good
~ housekeeping is kept up to date. Any mechanical condition
that would cause unusual or abnormal drag on the
performance of the electric motor should be corrected
before the calibration of the system.
The AUT0-CALIBRATE routine is activated through a
push button 56 to signal to the MSP to proceed to monitor
the horsepower for a preselected time while the
displacement system runs empty of the displaceable
material. For a belt conveyor system, it is preferable to
run the system empty for l to 2 complete revolutions of the
belt. For other systems not employing conveyors, the
system should be run empty until it has stabilized
(stabilization time). The AUTO-CALIBRATE routine will
CA 02248923 1998-09-14
.
WO97/34130 PCT~S97/03477
-18-
identify the system-no-load horsepower after the elapsed
pre-determined-time.
When the AUT0-CALIBRATE routine is enabled, a
message is displayed at terminal 26 at step 58 to run the
system empty. The system is then run for a pre-determined
time at step 60. A timer is activated at step 62 for the
predetermined period. The horsepower values are then
sampled and summed at step 64 and averaged at step 66,
which becomes the system-no-load value Y1 or B, as best
shown in Figure 5B. Ten samples are typically taken for
each 5 sec., and averaged. The average values are then
further averaged at step 66. For a new system, the value
determined at step 66 is also the no-load horsepower
setting below which the MSP will cause an alarm output at
48.
The number of zones of the system is entered into
the system at step 67. The MSP will then scan the number-
of-zone parameter at step 68.
The next steps in the AUT0-CALIBRATE routine are
to run the conveying system above system-no-load point,
obtain a sample of the material being conveyed and weigh
it, and calculate the flow rate from the size of the sample
and the speed of the conveyor belt.
Referring to Figure 5C, for a single zone system,
as disclosed in Figure 2, the conveying system is allowed
to convey a sizable load beyond 50% of the difference
between the maximum horsepower rating of the motor and the
system-no-load horsepower, and then allowed to stabilize.
The 50% point between the system-no-load and the m~; mum
CA 02248923 1998-09-14
WO97/34130 PCT~S97103477
--19-- .
horsepower is determined at steps 70 and 72. The maximum
horsepower is entered at step 73 and this value is used to
obtain the calibration point, which is a loading point at
which a belt cut will be taken. A 50% region is defined in
which the conveying system must be loaded preparatory to
taking samples or belt cuts of the material being conveyed.
The larger the load on the system beyond the 50% point and
the closer it is to the maximum load, the better the
results would be in establishing the linear relationship of
the horsepower to the flow rate.
The conveyor system is loaded at step 74 and the
~ horsepower output is monitored at step 76 to insure that
the loading on the system is within the 50% region. The
slope of the straight line will be determined by the MSP
only if the conveying system is loaded within the 50%
region. The 50~ region is the minimum horsepower necessary
to establish the linearity of the graph for a single zone
system.
The MSP will continue to monitor the horsepower
while waiting to assume the proper loading constraints set
by the number of zones in the system selected. When the
horsepower loading on the system reaches the 50~ point or
greater within the region, a message is displayed to the
user at step 78 to stop the conveyor and take a belt cut,
~.
as best shown in Figure 5C.
A belt cut means stopping the conveying system
and taking enough of a sample from the material on the belt
to accurately determine the flow rate at that point in
time. The sample must reasonable and representative of the
CA 02248923 1998-09-14
WO97/34130 PCT~S97/0~77
-20-
entire belt. The longer the belt cut, the more accurate
the computed material flow rate will be. An ideal sample
would be to dump the entire contents of the conveyor into a
container, weigh the material and divide the weight by the
amount of time it took to dump the materials. The result
will be an actual flow rate, such as tons/hour, of the
conveyor system at a specific power demand of the electric
motor, at a constant conveyor speed.
The horsepower at this point when the belt cut is
taken is stored in the MSP at step 80 and the measured
sample is entered at step 82 through the terminal 26. This
~ is called the measured flow rate.
Referring to Figure 5D, the MSP then calculates
the slope of the line from the equation,
M=(yz-yl)/(xz-x1)~
where Y2 = horsepower at the time the belt cut or
sample was taken,
Y1 = system-no-load horsepower,
X2 = measured flow rate at Y2, and
X1 = ~ by definition since system-no-load is
defined as horsepower demand without processing material
through it.
From the equation of the line,
Y=M*X+B,
the flow rate data X is calculated from the
equation,
X=(y-B)/M, where M=(y2-y1)/(x2-x1)~ Y1=B-
The derivation of the mathematical model for the
single zone system is shown at steps 83, 84, and 86.
CA 02248923 1998-09-14
WO97/34130 PCT~S97/03477
-21-
Switch 87 is pressed to confirm to the system that the
measured flow rate X2 has been entered.
In a single zone system, the slope M is
applicable for the entire range of the e~uation from
system-no-load to maximum horsepower, where the system is
fully loaded.
The AUTO-CALIBRATE routine is disabled at step 88
and the check on the horsepower relative to the system-no-
load is enabled at step 90.
The MSP again enters the monitoring mode upon
receiving the measured flow rate. For the single zone
system, the monitoring mode is entered at step 92. The MSP
processes the horsepower information by the mathematical
model established for the zone at step 94 and translates
the horsepower information into flow rate data for the
material over the entire horsepower range of the electrical
motor. The MSP converts the flow rate data to a standard
industrial analog output signal, such as 4-20 ma, 0-lO V,
etc., to drive the various devices 28, 32 or 34 that
provides material flow rate in units of weight per unit
time.
The output is also converted to a pulse train and
fed to the totalizer 36. The MSP integrates the material
flow rate and converts it into pulses with a proportional
time base, to drive totalizer, accumulators, counters, etc.
For example, l pulse/3,600 sec. may equal l ton/hour such
that l,oO0 pulses/3,600 sec equals lO00 tons/hour.
CA 02248923 1998-09-14
WO97/34130 PCT~S97/03477
-22-
Referring to Figure 5B, the AUT0-CALIBRATE
routine will now be described with respect to a double-zone
system.
A double-zone system is used to represent a semi-
linear system, or a system that has a non-linear zone that
can be approximated with reasonable accuracy by utilizing a
straight line. The MSP calculates the points Y2 and Y3 to
which the conveying system must be loaded preparatory to
taking measured samples or belt cuts. These points are
used to establish the slopes of the straight lines in zone
A and zone B, as best shown in Figure 3. The first point
~ for taking the first belt cut is at,
Y2 = B+0.25 (maximum horsepower - B).
The second point is,
Y3 = B+ 0.75 (maximum horsepower - B).
The MSP calculates these two points at step 98.
~ A message to load the system greater than or equal to Y2 is
sent to the terminal 26 at step 100. It is preferable that
the loading occurs at slightly greater than Y2. Referring
to Figure 5E, the horsepower is monitored at step 102 until
the horsepower equals or exceeds Y2, at which point a
message is sent to the terminal 26 at step 104 to stop the
system and take a belt cut. This sample will represent X2
in the straight line graph in zone A, as best shown in
Figure 3. The horsepower at Y2 is recorded at step 106.
The measured sample for X2 is entered into the MSP at 108
and the conveying system is restarted at step 110.
The system is then loaded until the horsepower
reaches or exceeds Y3 at steps 112, 114 and 116, at which
CA 02248923 1998-09-14
W O 97/34130 PCTrUS97/03477
-23-
point the conveying system is stopped and a belt cut is
taken at step 118. Referring to Figure 5F, the horsepower
at Y3 is recorded at step 120 and the measured flow rate at
X3 is entered into the system at step 122. The mathematical
model for the double-zone system is then calculated at
steps 124 and 126.
For zone A, the slope Ma is calculated as follows,
Ma = ( Y2 - Y1 ) /X2 '
where Y1 is the system-no-load horsepower,
lo Y2 is the recorded horsepower at the time the belt
cut for X2 is taken, and
X2 is the actual measured flow rate from the belt
cut.
The slope Mb for zone B is calculated as follows,
Mb = (Y3 - Y2)/(X3 - X2)/
where, Y3 = the monitored horsepower for belt cut
X3,
Y2 = the monitored horsepower at belt cut X2,
X3 = the measured flow rate from the belt cut at
step 118, and
X2 = the measured belt cut at step 104.
The mathematical model for the flow rate data in
zone A is established at step 128 to be,
X = (HP - B) /Ma/ for Yl<HP<Y2~ Y1=B-
The mathematical model for zone B is established
at step 130 to be,
(HP Y2)/Mb + X2, for Y2<HP<HPMAX
Referring to Figure 5G, the AUTO-CALIBRATE
routine is disabled at step 132 and the check on the
CA 02248923 1998-09-14
WO97134130 PCT~S97/03477
-24-
system-no-load horsepower is enabled at step 134. The MSP
now processes horsepower information by the mathematical
models established for zones A and B and translates the
horsepower information into flow rate data for the material
being conveyed over the entire horsepower range of the
electric motor, generally indicated at steps 136, 138, 140
and 142. The flow rate data is converted to an analog
signal at step 144 or a pulse train at step 146, as
desired.
The AUTO-CALIBRATE routine will now be described
with reference to the three-zone system. Referring to
~ Figure 5H, the MSP calculates at step 146 three points, Y2,
Y3 and Y4, at which to take actual samples from the material
being conveyed, which will correspond to measured flow
rates X2, X3, and X4. The three horsepower points are
calculated as follows,
Y2 = B+0.25(max HP-B),
Y3 = B+0.50(max HP-B), and
Y4 = B+0.75(max HP-B).
The conveying system is loaded to convey a
sizable load until the first point, Y2 is reached, generally
indicated at steps 148, 150 and 152. The conveying system
is then stopped and a sample or belt cut is taken, which
will correspond to the flow rate X2, generally indicated at
step 154. The horsepower is recorded at step 156 and the
measured flow rate is entered at 158.
Referring to Figure 5I, the displacement system
is again loaded until the monitored horsepower reaches or
exceeds Y3, generally indicated at steps 160, 162 and 164.
CA 02248923 l998-09-l4
W O 97/34130 PCTrUS97/03477
-25-
A second sample or belt cut is taken at step 166, which
will correspond to flow rate X3. The monitored horsepower
is recorded at step 168. The measured flow rate X3 is
entered into the MSP at step 170.
Referring to Figure 5J, the conveying system is
again loaded until the monitored horsepower reaches or
exceeds Y4, as generally shown at steps 172, 174 and 176.
Actual measurement from the conveyor belt is then taken,
which will correspond to flow rate X4, at step 178. The
monitored horsepower is recorded at step 180 and the
measured flow rate X4 is entered at 182.
The mathematical model for the three-zone system
is then established by calculating the individual slope;
namely, Ma, Mb and Mc, generally indicated at steps 186, 188
and 190. The slopes are calculated from the following
formulas,
Ma = (Y2 - Y1)/X21
b ( 3 Y2)/(X3 - X2), and
Mc (Y4 ~ Y3)/(X4 - X3)-
The flow rate X is established at steps 192, 194
and 196 to be,
X = (HP-B) /Mal for B<HP<Y2,
X (HP Y2)/Mb + X2, for Y2<HP<Y3, and
X = (HP-Y3)/MC + X3, for Y3<Hp<HpMAx.
Referring to Figure 5L, the MSP now processes
horsepower information via the mathematical models
established for each zone and translates the horsepower
information into flow rate data for the material over the
entire horsepower range of the electrical system.
CA 02248923 1998-09-14
W O 97/34130 PCTrUS97/03477
-26- .
The AUTO-CALIBRATE routine is disabled at step
197 and the horsepower check against the system-no-load
settlng is enabled at step 199.
Depending on the value of the monitored
horsepower, the appropriate model is used, generally
indicated at steps 198, 201, 202 and 204. The output of
the MSP is then converted to an analog signal at step 144
to provide flow rate data in units of weight per unit time.
A pulse train signal may also be provided at 146 to provide
a totalizing output.
The MSP will constantly calculate and display the
- flow rate through the above equations as it monitors the
horsepower from the electric motor of the conveying system.
The AUTO-TARE routine will now be described with
reference to Figures 5M, 5N, and 6A-6B. The AUTO-TARE
routine is used to recalibrate the system-no-load power
- demand to take into account any increases or decreases in
the mechanical drag of the conveying system, such as when
the belt is wet or dry. For example, the AUTO-TARE routine
should be performed after the conveyor belt has carried
muddy or wet material for one belt revolution, after
periodic grease and lubrication maintenance, after
installing a new conveyor belt, etc. The AUTO-TARE routine
,hould also be performed at the start of each shift.
A switch 206 is energized and the AUTO-
CALIBRATION routine is disabled in order to enable the
AUTO-TARE routine at step 208. The conveying system is
then run empty for a predetermined time at step 210. The
motor horsepower is read periodically during this period
CA 02248923 1998-09-14
W O97/34130 PCTrUS97/03477
-27- -
and averaged at steps 220 and 224. The average value is
then compared to the high horsepower alarm setting at step
226. If the value is below the high horsepower setting, it
is then accepted as the new no-load or system-no-load
horsepower at step 228. The new value is then used for the
single, two and three zone models, at step 230.
~eferring to Figures 5N and 6A, for a single zone
system, the new flow rate equation is calculated using the
new system-no-load value BB at step 231.
For a two-zone system, the new flow rate equation
is calculated at step 233. Referring to Figure 6B, the
second zone equation is different depending on whether the
new system-no-load horsepower is greater or lower than the
original value.
Referring to Figures 5N and 6C, for a three-zone
system, the new flow rate equation is calculated at step
235. The second and third zone equations are different
depending on whether the new system-no-load horsepower is
greater or lower than the original value.
For an n zone system, the equation for the n-th
line segment is,
Yn Mn(X Xn)+Yn+(YB Y1), where YB>Y1 (upshift), or
Yn Mn(X Xn)+Yn~(Yl~YE~)I where YB<Y1 (dOWnShift)~
where Mn=(Yn+l~Yn)/(Xnl1 Xn)~ X1 0
The AUT0-TARE routine is available anytime the
system is not performing an AUT0-CALIBRATE routine. The
AUTo-TARE routine will raise, or lower the entire graph to
a new location on the Y axis, as best shown in Figure 20.
The shift may have been caused by increase or decrease in
CA 02248923 1998-09-14
W O 97/34130 PCTrUS97/03477
-28-
the mechanical deadload that did not affect the slope of
the line equation. The AUTO-TARE routine is advantageously
useful in calibrating the electrical system to any increase
or decrease in mechanical drag prior to introducing
material into the displacement system, offsetting or moving
the entire equation to the proper system-no-load horsepower
value prior to starting a production run.
Referring to Figure 7, a flow-chart is disclosed
for a self-compensating integrator routine that
automatically compensates or corrects the pulse output of
the integrator at step 146 for the entire operating
- spectrum of the flow rate monitor. Once the flow rate
monitor has been calibrated, the self-compensating
integrator routine continuously monitors the analog rate
output and ensures that the number of pulses generated at
step 146 is equal to output rate. For example, for a flow
~ rate of 100 tons/hr, the pulse output should be 100
pulses/hr, or 50 pulses/1800 sec, or 25 pulses/900 sec.
The analog output at step 146 is converted to a
number of pulses equal to the flow rate X, divided by 60
min., generally indicated at step 232. The result of the
division will produce a whole number, called the number of
pulses #P, and a remainder .XX, whether .00 or some other
number less than 1.00. The whole number #P is used as the
target of comparison against the actual pulses AP from the
output of the integrator at step 146 within a l min.
period. A one-minute timer is started at step 234 and the
number of pulses generated at step 146 is accumulated for
one minute at step 236. The timer is stopped at step 238
CA 02248923 1998-09-14
W O 97/34130 PCTrUS97/03477
-29-
and the number of pulses #P generated at step 232 is
compared to the number AP accumulated at step 236,
generally indicated at steps 240 and 242. In the meantime,
the remainder .XX is accumulated at step 244 until the sum
equal 1.00 or greatêr, generally indicated at step 246, at
which tlme one pulse is directly added to the output pulses
at step 248, to be placed between pulse time or during the
period when no pulses are being generated (rest time). If
the accumulated pulses AP are greater than the number of
lo pulses #P generated at step 232, the rate of pulses at step
146 is slowed down. If the accumulated pulses AP are less
- than the number of pulses #P generated at step 232, then
the rate of pulses generated at step 146 is sped up. When
the accumulated pulses equal the number of pulses generated
from the analog signal, no correction is made.
The self-compensating integrator routine
~ advantageously eliminates the common practice of
recalibrating the pulse output of the integrator circuitry
when operating or shifting into a different range. Thus,
regardless of the range, for example, from 0.09 tons/hr (3
lbs/min) to 980 tons/hr, the pulse output will accurately
include the correct number of pulses per unit time based on
the analog output.
Although the present invention is described with
maximum three zones, a person of ordinary skill in the art
will understand that any number of zones can be utilized,
limited only by practicality and manpower constraints. A
three-zone model has been described above only for the sake
of simplicity and to minimize the number of actual
CA 02248923 1998-09-14
WO97/34130 - PCT~S97/03477
-30-
measurements that have to be taken to establish the slope
of each line segment. A person of ordinary skill in the
art will understand that greater accuracy will ~e attained
with as more linear zones are utilized. Programming an n
zone system would follow similar steps as disclosed with
the three-zone system.
While this invention has been described as having
preferred design, it is understood that it is capable of
further modification, uses and/or adaptations of the
invention following in general the principle of the
invention and including such departures from the present
- disclosure as come within known or customary practice in
the art to which the invention pertains, and as may be
applied to the essential features set forth, and fall
within the scope of the invention or the limits of the
appended claims.