Note: Descriptions are shown in the official language in which they were submitted.
CA 022~4777 1998-ll-12
W O 97/43871 PCT/AU97/00295
CALCULATING ELECTKODErrREQUENCY ALLOCAllON nN A COCHLEAR nMPLANT
Technical Field
This invention relates to cochlear implants, and in particular to frequency
5 allocation for particular electrodes in a multichannel cochlear implant.
Background Art
Cochlear impiants are used to provide a sensation of hearing to hearing
impaired persons. Typically, the implant provides stimuli via a set of electrodes
formed into an array which is inserted into the scala tympani of the patient. The
10 cochlear implant system presents electrical stimulation directly to the auditory
nerve fibres of the basilar membrane. The electrodes are driven via an
implanted receiver stimulator unit. The implanted receiver stimulator unit
produces stimulations in accordance with commands originating from an
external speech processor. A preferably transcutaneous link transfers power
15 and commands from the speech processor unit to the receiver stimulator.
The inner ear of a normally hearing person includes hair cells which
convert the displacement of the basilar membrane in response to sound into
nervous impulses. Different parts of the basilar membrane of the normal
cochlea are displaced maximally by different frequencies of sound so that low
20 frequency sounds maximally displace apical portions whereas higher frequency
sounds cause displacement of more basal portions of the membrane. The
nervous system is arranged so that a nervous impulse originating from a hair
cell located adjacent an apical area of the membrane is perceived as a low
frequency sound whereas a nervous impulse originating from a hair cell located
25 adjacent a more basal position of the membrane is perceived as a higher
frequency sound. The frequency which causes maximal displacement of the
basilar membrane at a given position will hereinafter be referred to as the
"characteristic frequency" at that position.
In a dysfunctional ear the hair cells may be damaged or absent so that no
30 nervous impulses are generated. In such a case electrical stimulation impulses
must be provided artificially to simulate the nervous activity of the hair cells in
CA 022~4777 1998-11-12
WO 97/43871 PCT/AU97/00295
order to create a perception of sound. Such stimulation impulses are provided
via the electrodes of a multi-channel cochlear electrode array. The array is
arranged to follow at least part of the length of the basilar membrane and its
electrodes are selectively driven to deliver electrical stimulations. In order to
5 simulate a given sound it is necessary to firstly analyse that sound and break it
down into essential features. This analysis can be in accordance with many
different schemes and is performed by the speech processor. The speech
processor then determines which electrodes of the array should be stimulated in
order to best simulate the sound. For example, if the sound contains mainly
10 high frequency components then it is best simulated by stimulation via basally
located electrodes.
In order to determine the electrode to be stimulated for a given sound the
speech processor makes use of a frequency range to electrode map, usually
stored in an EPROM, which matches bands of sound frequencies to one or more
15 electrodes of the electrode array. The frequency range mapped to each
electrode is adjustable by the speech processor so that a characteristic
frequency is allocated for each stimulating electrode. Existing methods for
allocating frequency ranges to the electrodes are to use an educated guess or a
longhand calculation to determine the characteristic frequency for each
20 electrode and to choose frequency ranges consistent with the characteristic
frequencies calculated for the electrodes.
It is accordingly desirable to be able to predict with some accuracy the
characteristic frequency for each electrode of an implanted electrode array, so
as to provide a reliable basis on which the allocation of frequency range to
25 electrode mapping is made.
An article entitled "A cochlear frequency-position function for several
species-29 years later" J. Acoust. Soc. Am. 87, 2592-2605, by Greenwood, D.D.
(1990) describes the relationship between frequency and the site of maximal
displacement of the basilar membrane expressed as a percentage of the total
30 length of the organ of Corti, measured from the apex. The technique in this
paper is not applicable to cochlear implants.
CA 022~4777 1998-11-12
W O 97/43871 PCT/AU97/00295
An article "Cellular pattern and nerve supply of the human organ of Corti"
Bredberg, G. (1968).Acta Otolaryngol. (Stockh.) Suppl. 236, 1-138 describes
temporal bone studies that establish a relationship between the percentage
length along the organ of Corti and the angle in degrees about the modiolus
5 relative to the basal end of the organ of Corti. This paper is not applicable to
cochlear implants.
An article by Marsh, M.A., Xu, J., Blamey, P.J., Whitford, L.A., Xu, S.A.,
Silverman, J.M, and Clark, G.M. (1993). "Radiological evaluation of multiple-
channel intracochlear implant insertion depth" Am. J. Otol. 14, 386-391
10 describes a method to document insertion depths of the electrode array from an
X-ray. The paper identifies a difficulty in relating the angles that might be
derived from the authors' method to the angles measured by Bredberg.
The above papers do not provide a clinically applicable method of
accurately deriving the appropriate frequency ranges to be allocated to the
15 electrode bands of a cochlear implant. Prior methods were based on the
surgeon's reports, which the Marsh et a/. paper states are inaccurate.
Inaccurate prediction of the electrode/frequency correspondence leads to input
frequencies mapped to the wrong sites in the cochlea. Such mis-mapping of
electrodes may well result in a reduction in the comprehensibility and
20 naturalness of sounds perceived by the implanted subject relative to that which
would otherwise have been possible.
Summary of Inven~ion
According to a first aspect of the present invention there is provided an
apparatus for configuring the frequency range to electrode map of a cochlear
25 implant prosthesis, the frequency range to electrode map containing frequency range to electrode mapping data, comprising :-
a) processing means for processing electrode location data, the electrodeIocation data describing the location of at least two electrodes relative to a
cochlea, the electrodes being components of an electrode array, the processing
30 means generating characteristic frequency data for use in determining a
frequency range to electrode mapping;
CA 022~4777 1998-11-12
WO 97/43871 PCT/AU97/00295
b) input means for conveying the electrode location data to the processing
means;
c) interface means for transferring the frequency range to electrode
mapping to the frequency range to electrode map;
5 characterised in that,
the processing means generates the characteristic frequency data
according to a characteristic frequency model, wherein the characteristic
frequency data includes characteristic frequencies of electrodes of the electrode
array, the characteristic frequency of an electrode corresponding to the
10 estimated frequency of maximal displacement of the basilar membrane of the
cochlea, according to the characteristic frequency model, at the location of said
electrode of the electrode array.
According to a further aspect of the present invention there is provided a
method for setting the frequency range to electrode map of a cochlear implant
15 prosthesis including the steps of :-
a) determining two fitting values by reference to an implanted electrode
array the electrode array being implanted within a cochlea;
b) matching a template cochlear spiral to said electrode array according to
the fitting values;
20 c) determining the position of each electrode of said electrode array spiral
relative to the cochlea from the template cochlear spiral and known dimensions
of the type of implanted array;
d) calculating a characteristic frequency for each electrode from the position
of each electrode relative to the cochlea according to a mathematical model of
25 the characteristic frequency characteristics of a cochlea for each of the
electrodes;
e) setting the frequency range to electrode map of the cochlear implant
prosthesis on the basis of the characteristic frequencies calculated in the
previous step.
According to a final aspect of the present invention there is provided a
software product for determining characteristic frequencies for electrodes in animplanted intracochlear electrode array based on an diagnostic medical image,
CA 022~4777 1998-11-12
W O 97/43871 PCT/AU97/00295
said product being provided with inputs including for a given implanted array a
first value being the number of electrodes extending outside the round window,
and a second value being the number of electrodes extending from the round
window to the most apical of a set of geometrically defined points on the
5 diagnostic medical image to which the image of the array extends and
identifying the most apical of said points, said product including means for
determining the position of the implanted electrodes by reference to a
predefined reference shape and predefined dimensions of the electrode array,
means for mapping said electrode positions to corresponding characteristic
10 frequencies, and means for outputting a set comprising characteristic
frequencies for each electrode.
The present invention allows for an automated mapping calculation
which requires only the counting of numbers of electrodes between certain
clearly visualisable points on a diagnostic medical image of a cochlear. From
15 this electrode count the characteristic frequencies for all electrodes are
computed automatically. The output of this calculation can be used by the
speech processor with or without a clinician's intervention to allocate a
frequency range to each electrode.
According to one embodiment the present invention facilitates a
20 clinician's obtaining of the electrode characteristic frequency information for a
given patient by entering data readily derived from a diagnostic image, such as
an X-ray, of the implanted cochlea. The present invention permits the position of
each electrode of the cochlear electrode array to be determined automatically,
with greater accuracy than is possible with prior art techniques.
According to a further embodiment of the present invention it is envisaged
that the data contained in the diagnostic medical image would be extracted by
means of an optical scanner and appropriate image signal processing.
Finally, it is also envisaged that the data output of the medical diagnostic
image forming device be analysed by a computer running image signal
30 processing software to extract the required electrode location data and that the
electrode location data be interfaced directly to the apparatus of the inventionautomatically and without manual intervention.
CA 022~4777 1998-11-12
W O 97/43871 PCT/AU97/00295
Brief Description of the Drawings
A preferred implementation of the present invention will now be described with
reference to the accompanying drawings, in which:
Figure 1 is a schematic diagram of a cochlear implant prosthesis
5 interfaced with a microprocessor for configuring the frequency band to electrode
map of the cochlear prosthesis according to the present invention;
Figure 2 is a schematic diagram of a cochlear X-ray, showing an
implanted electrode array and relevant anatomical features;
Figure 3 is a schematic diagram of a cochlear X-ray, showing the
10 positions of points on the electrode spiral used in the band counting procedure;
Figure 4 is a graph showing the relationship between percentage length
along the organ of Corti and the cochlear angle relative to the basal end of
organ of Corti;
Figure 5 is a diagram showing the relationship between angle as
15 measured in the present method and in the method of Bredberg;
Figure 6 is a graph plotting frequency against insertion angle;
Figure 7a is a first section of a flowchart illustrating one software
implementation of the present invention;
Figure 7b is a second section of a flowchart illustrating one software
20 implementation of the present invention; and
Figure 7c is a third section of a flowchart illustrating one software
implementation of the present invention.
Description
The present invention is described in the context of the cochlear implant
25 devices available commercially from Cochlear ~imited of 14 Mars Road, Lane
Cove 2066 Australia. However, it will be appreciated that the present invention
may equally be implemented with alternative electrode arrays. The apparatus,
method, and software product herein described may be readily implemented in
a variety of ways. Alternative calculation techniques may be used to those
30 illustrated, particularly based upon the general principle that the location of the
electrodes and hence the characteristic frequency may be determined from the
CA 022~4777 1998-11-12
W O 97/43871 PCT/AUg7/00295
geometry of the cochlea and the dimensions of the electrode array, once some
characteristics of the extent of insertion are known.
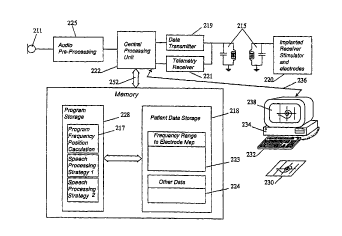
Referring to Figure 1 there is depicted a schematic diagram of a cochlear
implant prosthesis interfaced to a processing means in the form of
5 microcomputer 250.
During standard operation the cochlear implant prosthesis functions as
follows. A microphone 211 monitors ambient sounds, for example speech, and
converts those sounds to electrical impulses. The audio pre-processing module
225 then performs various operations such as bandpass filtering, application of
10 AGC and analogue to digital conversion. The digital signal is then analysed by
the central processing unit 222 according to a speech processing strategy
stored in program storage memory 228. The speech processing strategy
determines by which electrodes the stimulations are to be delivered in order to
best simulate the ambient sound by interrogating the frequency range to
15 electrode allocation map 223 by means of bidirectional bus 252. The central
processing unit 222 generates commands for the receiver stimulator 220
specifying the electrodes by which the stimulation is to be delivered and the
amplitude and duration of the stimulation. The commands are encoded by the
data transmitter 219 and sent via transcutaneous link 215 to the implanted
20 receiver stimulator. The receiver stimulator decodes the commands and the
applies stimulation via the specified electrodes thereby eliciting sound
perceptions in the implanted subject.
By one embodiment of the invention an X-ray 230 of the cochlea with
implanted electrode array is produced and referred to by an operator (not
25 shown). Although an X-ray is used in the presently described embodiment othersuitable medical imaging techniques could also be used to produce the
necessary images. The operator visualises reference lines on the X-ray relative
to certain anatomical landmarks therein depicted. Data concerning the position
of the electrode array relative to the basilar membrane is then entered into a
- 30 processing means 234. The microcomputer runs a program which contains a
model of the cochlea suitable for generating the characteristic frequency of each
electrode. On the basis of the calculated characteristic frequencies a frequency
CA 022~4777 1998-11-12
W O 97/43871 PCT/AU97/00295
range to eiectrode map is generated either automaticaliy according to preset
instructions or with additional input from a clinician. The frequency range to
electrode map is then downloaded from the microcomputer 250 to the speech
processor by an interface means 236. This means could be a serial data
5 connection, for example an RS232 or IIC interface as is well known in the art.The data is then transferred to patient data storage 218 where it becomes the
frequency range to electrode allocation map of the speech processor.
In Figure 1 the processing means which calculates the characteristic
frequencies is a microcomputer and is distinct from the central processing unit
1 0 222 of the cochlear implant prosthesis. By a further embodiment however the
calculations performed by microcomputer 250 are undertaken by the processing
means of the cochlear implant speech processor 222 and the software required
to calculate the characteristic frequencies stored within the cochlear implant
prosthesis program storage memory 228 as characteristic frequency calculation
15 program 217. According to this further embodiment of the invention it is simply
necessary to transmit positional data concerning the location of the electrode
array to the central processing unit 222 where the characteristic frequencies are
calculated and the frequency range to electrode map updated.
Whilst the embodiment depicted in Figure 1 relies on a human operator to
20 visually locate various landmarks on the X-ray, or other diagnostic image, and
enter them into the processing means by some means such as the keyboard
232 it would also be possible to use more highly automated methods. For
example the X-ray could be inserted into a scanner and pattern recognition
methods used to locate the landmarks whose position would then be transferred
2~ to the processing means. Alternatively an X-ray machine or other medical
imaging equipment could be either directly, or via electronic data storage
means, coupled to an image processing means interfaced to processor 234 so
that no hardcopy of the X-ray or manual data entry would be required.
The method by which the data necessary to calculate the characteristic
30 frequencies of the electrodes is extracted from the X-ray will now be explained.
The present invention is designed to be implemented after surgical
implantation has been performed. It will be appreciated that variations in
CA 022~4777 1998-ll-12
W O 97/43871 PCT/AU97/00295
anatomy and in the extent of insertion of the array mean that the positioning ofthe electrode array will differ for each patient, and the present invention is
intended to provide an accurate method of determining characteristic frequency
for each implanted array.
After the electrode array is implanted, an X-ray (or other suitable medical
image) of the cochlea is produced, preferably using the "Cochlear View"
orientation of the patient's head as described by Marsh et al. (1993) and Xu, J.,
Xu, S.A., Clark, G.M., and Marsh, M.A. (1994), "'Cochlear View' and its
application in cochlear implant patients," International Cochlear Implant,
10 Speech and Hearing Symposium 1994, Melbourne Australia.
Such an X-ray image is illustrated schematically in Figure 2. Various
anatomical features can be seen, including the vestibule 2, and the tip of the
superior semicircular canal 1. From this X-ray the position of the round window 5
is estimated by drawing a primary reference line 6 from the tip of the superior
15 semicircular canal 1 through the centre of the vestibule 2. If the array was
originally located by insertion through the round window 5 then the round
window will lie at the intersection of line 6 and the electrode array 10. A further
reference line 8 is drawn from the centre of the template spiral 7 perpendicularto the primary reference line 6, relative to which angle n 9 is measured, which
20 will be described in more detail below. From the figure can also be seen
individual electrodes 3, and interelectrode spacing 4 which will be assumed to
be regular.
The method used by the processor to obtain the characteristic frequency
for each electrode band of the cochlear implant in the present embodiment is as
25 follows:
1. Calculate the size of a template cochlear spiral. The size of the
template spiral is matched to that of the electrode spiral seen on the X-
ray, using the counted number of electrode bands between key points on
X-ray.
30 2. Calculate the angle n for each electrode. The angle at the point
where the array crosses the primary reference line 6 is given a mean
value derived from study of X-rays of patients and implanted temporal
CA 022~4777 1998-11-12
W O 97/43871 PCT/AU97/00295
bones, and the length around the array from the crossing point to any
electrode is known. Given the size of the template spiral, the angle for
any electrode can be calculated from the mathematical shape of the
template spiral. The mean angle for crossing of the primary reference
line by the electrode array depends on the site of insertion of the
electrode array. For round window insertion, it has been found to be
13.47~. For cochleostomy insertion (through the outer wall of scala
tympani) the corresponding value was 23~ for insertions done in the
Cochlear Implant Clinic at The University of Melbourne. It should be
realised, however, that this value will vary somewhat with surgical
technique.
3. Calculate, for each electrode, the percentage length along the
organ of Corti corresponding to the calculated angle. This calculation
uses the data of Bredberg (previously referenced).
15 4. Calculate the characteristic frequency for each electrode, using the
percentage length along the organ of Corti and the expression of
Greenwood (previously referenced).
The methods and equations used to perform the calculations are as
follows. The counting of electrodes commences from the physical start of the
20 electrode array, outside the cochlea. If the array is fully inserted, then analternative calculation using two tangent lines, to be described below, may be
used. The electrodes are counted and the number reached as the electrodes
cross the primary reference line is entered (point P0 in Figure 3, count of 5.5).
The counting is continued until the electrodes have passed a number of other
25 points on the X-ray. The subsequent points at which the electrodes are counted
are tangents to the array, such that they are either parallel to or at right angles to
the primary reference line. They are marked as P1-P6 on Figure 3. The process
of visualising these points is facilitated by the use of a sheet of transparent
plastic on which a bold line and a grid are printed. In use the operator
30 superimposes the plastic sheet on the X-ray and aligns the bold line with the tip
of the semicircular canal and the centre of the vestibule. The bold line would
CA 022~4777 1998-11-12
WO 97/43871 PCT/AU97/00295
then be aligned with the notional primary reference line, and the tangent pointscould be visualised using the grid. The counting continues from point P0 to
point P1 (count of 12.0 in Figure 3), to point P2 (count of 19.5), to point P3 (count
of 25.5), to point P4 (count of 30.6), etc. In Figure 3, point P4 is the most apical
5 point reached, and the value entered for P5 would be a default value (say, zero)
to signify that the array did not reach that point. Similarly, in the general case,
the value entered for the first point the array does not reach would be zero. From
Figure 3, values are
P1 First tangent point (electrode count 12.0 in this example)
P2 Second tangent point (electrode count 19.5 in this example)
P3 Third tangent point (electrode count 25.5 in this example)
P4 Fourth tangent point (electrode count 30.6 in this example)
P5 Fifth tangent point (electrode count 0 in this example, indicating
that this is the fl~ point the array does not reach)
P6 Sixth tangent point (no electrode count in this example).
It will be appreciated that according to the present invention in this
example only the P0 and P4 values are required. Entering further data is not
essential but may provide a more accurate calculation and consistency check.
The length around the template spiral between the points where the
20 electrode array crosses the primary reference line (P0 on Fig. 3) and the
innermost tangent point (P4 in the example of Fig. 3) is calculated using a
scaling factor of 1.0 in Eqns. 1 and 2 (defined below). The template spiral is
given by Eqns 1 and 2, and the length around the spiral is calculated
numerically using those equations and Eqn. 3 (defined below), which relates
25 length along a curve to its polar coordinates (radius and angle). Note that the
angles at the entry point and at all the tangent points are known from the shapeof the template spiral. The length around the template spiral is compared with
the actual length between the points 5 (PO) and P4 (in this example), as
measured between electrode counts at those points. It should be noted that the
~ 30 distance between the centres of the electrode bands is accurately controlled
during manufacture of the Cochlear Limited devices (0.75 mm), and therefore
the number of bands between two points gives an accurate measure of
.
CA 022~4777 1998-ll-12
W O 97/43871 PCT/AU97/00295
distance. The scaling factor is then adjusted so that the theoretical length
equals the measured length thus fitting the template spiral to the electrode spiral
seen on the X-ray.
The angle of each electrode can then be calculated from the template
5 spiral, as the angle at point PO (5) is known and the length around the spiralfrom that point to the electrode is also known. This calculation is performed
numerically using Eqns 1, 2 and 3.
On completion of the data entry, a reproduction of the electrode spiral
may be displayed on monitor 238 based on the angle calculations performed by
10 the program. The graphical representation of the electrode spiral is to allow the
user to verify that the information entered is correct. The displayed spiral is
similar to that of Figure 3. On Fig. 3 is marked the line 8, drawn from the centre
of the template spiral perpendicular to the primary reference line, relative to
which angle n (item 9) is measured.
Figure 4 illustrates percentage length along the organ of Corti plotted
against angle (measured relative to Bredberg's zero). Filled circles indicate
Bredberg's data and the solid curve was fitted to those data. Dashed curves are
experimental variations in Bredberg's data. Once all the electrode angles have
been determined, the data of Fig. 4 is used to convert each angle into a
20 percentage of the length of the organ of Corti. This is done using Eqns. 4 and 5
(defined below), which closely approximate the results shown graphically by
Bredberg and Eqn. 6 which relates the angles measured according to the
present invention and the angles used by Bredberg (see below). The
percentage of the length of the organ of Corti now enables the frequency
25 associated with that angle (and electrode) to be calculated, using the
Greenwood formula (Eqn. 7). The Greenwood formula describes the
relationship between frequency and the site of maximal displacement of the
basilar membrane, expressed as a percentage of the total length of the organ of
Corti, measured from the apex.
Once the data entered has been accepted, further calculations are
performed. The frequencies obtained for the electrodes are then plotted on a
frequency versus electrode graph. The frequency allocation of the speech
CA 022~4777 1998-11-12
W O 97/43871 PCT/AU97/00295
processor can then be adjusted to allow for the closest frequency band
allocation to the calculated electrode frequency set.
The following equations, Eqn (1) and Eqn (2) describe the radial distance
from the centre (approximately the modiolus) of the template spiral as a function
5 of angle about the centre, relative to a line drawn from the centre
perpendicularly to the reference line. The perpendicular line is shown as 8 on
Figure 3, and the angle n (in degree) is shown as item 9. For the angle less
than 100~ the spiral radius in millimetres is given by:
Radius = Scaling ~actor ~ [7.9664 - 1.0252 In (n
10 5)] (1 )
For the angle in excess of 100~ the radius is given by:
Radius = Scaling Factor ~ 3.762 exp (- 0.001317 n ) (2)
For a scaling factor of 1.0, the spiral of Eqn. 2 corresponds to the mean of
30 X-ray spirals of which 28 were for cochleostomy insertions (through the outer15 wall of scala tympani). The parameters of Eqn. 2 were established by fitting the
mathematical spiral to the X-ray spirals for angle greater than 100~. Note,
however, that Eqn. 1 is applicable to a round window insertion. For a
cochleostomy insertion slightly different parameters would apply. As the mean
values would depend slightly on surgical techniques used, it is not appropriate
20 to specify values here. However, with respect to the present invention Eqn. 1(as given above) is a good approximation for all cases, provided a small
correction is made to the band count at the primary reference line 6, illustratively
half a band.
The length along the spiral of a point on it is calculated using the
25 expression:
d(length)/d(angle)= sqrt {(radius)2 + [d(radius)/d(angle)]2 } (3)
This general expression relates length along the spiral of the point to its
polar coordinates, radius and angle (in radians).
Using Eqns. 1-3, angles were calculated for the reference points for the
30 band counting procedure. The results are:
1) P0 Round window entry 13.47~
2) P1 Basal turn bottom tangent 77.19~
CA 022~4777 1998-11-12
WO 97/43871 PCT/AU97/00295
14
3) P2 Basal turn right tangent 175.68~
4) P3 Basal turn top tangent 265.68~
5) P4 Middle turn bottom tangent 355.68~
6) P5 Middle turn right tangent 445.68~
7) P6 Middle turn top tangent 535.68~
8) P7 Middle turn left tangent 625.68~
9) P8 Apical turn bottom tangent 715.68~
10) P9 Apical turn right tangent 805.68~
11) P10 Apical turn top tangent 895.68~
The Bredberg data, relating the percentage length along the organ of
Corti to the angle in degrees about the modiolus can be closely approximated
by the following expression.
For n B from 0 to 360 degrees:
Percentage of Total Length = 1.4971 ~ n g~ 6292 (4)
15 For n B above 360 degrees:
Percentage of Total Length = 2.4778 ~ n g~ 5436 (5)
Both the percentage of total length and the angle (n B) are measured
relative to the basal end of the organ of Corti. Therefore, n B iS not identical to
n of Eqns 1, 2 and 3. n arises from the geometrical construction of the
20 reference line, and is measured relative to a line at right angles to the reference
line, while n B iS measured relative to the position of the basal end of the organ
of Corti. It is necessary to establish an approximate relationship between thesetwo angles. It is shown below that angles measured in the two ways are related
approximately as follows:
25 n B = n - 10 (6)
The Greenwood equation can be rewritten so that length along the organ
of Corti is measured from the basal end, thus:
Frequency = 165 ~ {10[~~21~ ~ (100 -percentage)] - 0 8788~ (7)
The relationship between frequency of maximum displacement and angle
30 is plotted in Figure 6.
In order to make use of the Bredberg data relating percentage length
along the organ of Corti to angle, it is necessary to relate approximately the
CA 022~4777 1998-11-12
WO 97/43871 PCT/AU97/00295
angular measurements of Bredberg's method and the angles used in the
present method. For this purpose, two sets of data were compared graphically
as shown in Figure 5. One set of data was derived from 11 Silastic(~) moulds of
scala tympani and comprised mean outer and inner walls of the scala and the
5 mean round window position. These data were presented in the angular
framework of the present method. The second set of data was taken from a 3D
reconstruction of a cochlea (from Kawano, A., Seldon H.L., and Clark, G.M.
"Computer-aided three-dimensional reconstruction in human cochlear maps:
measurement of the lengths of organ of Corti, outer wall, inner wall, and
10 Rosenthal's canal," Ann. Otol. Rhinol. Laryngol. (in press)). The 3D data
comprised outer and inner walls of scala tympani and the organ of Corti,
including the position of the basal end. The position of the round window could
be inferred in the 3D data. The size, position and rotation of the 3D data were
adjusted to be consistent with the data from the Silastic(i~) moulds. As the
15 position of the basal end of the organ of Corti corresponds to zero degrees in
Bredberg's method, this figure provides an estimate of the relationship between
the angular zeros in the measurement schemes. The approximate relationship
is given in Eqn. 6.
In order to be able to calculate angles for the electrode bands, it is
20 necessary to determine a centre point about which to measure the angles. In
the development of the inventive method, the positions of electrode bands on
the X-rays were originally digitised, and various spiral shapes were fitted to the
electrode positions, thus yielding estimates for the spiral centre. The shape ofEqns. 1 and 2 was found to provide a good tit to the electrode positions.
Therefore, given that template shape, the centre may be estimated for a
particular electrode X-ray by doing a least squares fit of the template to the
digitised positions of the bands. The variables in this fitting process are (i) the
size of the template and (ii) the x and y positions of the template. Doing this fit
gave a good estimate of the centre and allowed automatic calculation of
30 individual angles of electrodes. The final method as described above has the
considerable advantage of requiring much less data input, in principle only two
numbers, namely the electrode band counts at the principal reference line and
CA 022~4777 1998-11-12
WO 97/43871 PCTIAU97/00295
at the most apical tangent point. Because the angle at the principal reference
line crossing is known, and the angles at the tangent points are known, these
two band counts fully determine the fitting of the template to the data. The data
determine the size of the template spiral, while the position of the spiral centre
5 does not need to appear explicitly in the calculations.
The method may be applied to other electrode arrays, for example an
array that might follow the inner wall of the scala tympani, rather than the outer
wall as in this case. For the method to be used with a different electrode array,
ideally one would deduce a template spiral that reliably represented the spiral
10 presented on the X-ray by the image of the electrode array. The template could
be a numerical relationship between radius and angle, that is, there is no need
to provide an analytical expression for the relationship. However, the
exponential spiral shape used here (Eqn. 2) is very suitable for the descriptionof the shape of the inner wall of the scala tympani, for all but the most basal
15 region of the cochlea, and would therefore be suitable for an array that followed
the inner wall. Eqn. 1 could probably be used for the basal region. However,
appropriate parameters of both Eqn. 1 and Eqn. 2 would need to be established.
The parameters may be readily determined using the techniques described
above.
The inventive technique requires a knowledge of the separations
between the electrodes along the array. For the Cochlear Limited array, the
electrode separation is accurately maintained at 0.75 mm.
Figured 7a, 7b, 7c illustrate one software implementation of the method
described above. Such a program would be run by the processing means 234
25 of Figure 1. Input data are PO and Pl, determined from the X-ray as shown in
Figure 2, and other information which characterises the array. The last step of
the process is shown in the box 362, marked END, and is to set the frequency
range to electrode map 238 on the basis of the calculated characteristic
frequency values in the array Freq[]. The flowchart depicted in Figures 7a-7c is30 to be read on the understanding that the commands flow from figure to figure at
the points marked with identical capital letters.
CA 022~4777 1998-11-12
W O 97/43871 PCT/AU97/00295
Referring to Fig 7a the flowchart begins with start box 300 by which the
first step is to locate the landmark points at which the electrode array crosses the
primary reference line PO (item 5 of Figure 3) and the final tangential point of the
array P~ (point P4 of Figure 3). Other data concerning the total number of
5 electrodes in the array and the spacing between them is also entered. The
scale factor variable Scale_fact is initialised to 1Ø In box 302 the angles n O
and n ~ which correspond to the angular positions of PO and Pf are determined
from a pre-calculated table of angles such as the one described earlier in
reference to equations 1 to 3. The remainder of the flowchart of Figure 7a is
10 concerned with finding the length around a template spiral between the angles n O and n I and comparing this length with the actual length around the
electrode array spiral between PO and Pf in order to determine a scaling factor.In box 304 the variable n iS initialised to n O and the variable L, representingthe length around the template spiral from n O to n ~, to zero. ~n represents a
15 small incremental change in n and is initialised to 0.1.
The polar coordinates (Rth,n ) along the template spiral are calculated
according to the equations in boxes 308 and 310 being previously described
equations (1) and (2). At box 312 the distance along the template spiral from
n O to ~n iS calculated by numerically solving the differential equation for the20 distance along a curve given in polar coordinates. Methods for solving such
equations are standard in the art of mathematical computing and will not be
discussed in detail here. The distance along the spiral template is accumulated
in the variable L and the variable n iS incremented (box 314) until it is slightly
greater than n ~ (box 316). The length of the template spiral is then stored in
25 variable Th_length (box 318). At box 320 the number of electrode bands from Pf
to PO is calculated and converted to a distance by multiplying it by the
InterElectrodeSpacing variable. The actual distance between the two landmark
points Pf and PO on the electrode array is stored in the variable Act_length. Atbox 322 the ratio of the actual length of the cochlear electrode array spiral,
30 between Pf and PO~ to the length previously calculated along the template spiral
by the angle subtended by Pf and PO is calculated and stored in variable
Scale_fact.
CA 022~4777 1998-11-12
WO 97/43871 PCT/AU97/00295
18
Referring now to Figure7b the section of the flowchart therein depicted
scales the template spiral to match the electrode array spiral and calculates the
angular position of an electrode on the template spiral according to its position
on the electrode array relative to PO.
At box 324 the ElectrodeCounter variable is initialised to 1 in order to
commence calculation of the angular position of the first electrode. At box 328
the bandnumber of the electrode is calculated from its electrode number. For
example it can be seen with reference to Figure 3 that electrode 1(item 13)
corresponds to band 11 as there are ten non-electrode stiffening bands located
10 basal to the first stimulating electrode. The length along the array of the first
spiral to the electrode with number ElectrodeCounter is determined in box 328
by finding the number of bands between the first landmark point Po and the
electrode under consideration. As an example, for the first electrode of Figure 3
the ElectrodeCounter variable is set to 1. The BandCount variable is set to 11
15 being the sum of the ElectrodeCounter value and the number of stiffening
bands. The length variable is the distance of the first electrode along the
cochlear electrode array and equals the product of the interelectrode spacing
with, the difference of the BandCount variable (11) and the band number at
which the electrode array crossed the primary reference line which was 5.5 for
20 the example depicted in Figure 3.
Given the distance of the electrode along the electrode spiral and the
equation of the scaled template spiral the corresponding angular position on thetemplate spiral can then be calculated for electrode number 1. This value is
calculated in similar fashion to that described with reference to the loop of
25 Figure 7a. The value for n which corresponds to the postion of the electrode
on the template spiral is stored in data array Ang[] at box 350. At box 352 the
angle n iS related to the Bredberg angle n B as previously described.
Referring now to Figure 7c, therein is depicted a section of the flowchart
in which the percentage length along the organ of Corti for each electrode is
30 calculated from its angle n in degrees about the modiolus of the electrode aspreviously determined (boxes 354, 356). The percentage length is then used to
calculate the theoretical characteristic frequency of the electrode at box 358 and
CA 022~4777 1998-11-12
W O 97/43871 PCT/AU97/00295
19
the result is stored in an indexed data array Freq[]. The program then
increments the ElectrodeCounter variable at box 360 and the electrode position
frequencies are calculated and stored for each electrode until the condition of
decision box 326 of Figure 7b is satisfied thereby signifying that the
5 characteristic frequencies of all the electrodes have been determined.
The final step of the procedure is depicted at box 362 by which the
electrode array characteristic frequencies stored in Freq[] are used to set the
Frequency Band to Electrode Map 223 of the cochlear prosthesis.
It will be appreciated that alternative means software implementations
t 0 could be used if desired. Variations and additions may be made to the methodand product disclosed within the general inventive concept.