Note: Descriptions are shown in the official language in which they were submitted.
CA 02260120 1999-01-05
W O 98/01069 PCT~US97/11787
ELECTROMAGNETIC IMAGING AND THERAPEUTIC (EMIT) SYSTEMS
Field of the Invention
The present invention relates to EMIT systems. Spe~ific~lly, the invention
ills to a~ alus and method in which multi-frequency microwave in combination
with y.e~lably low frequency is structured to generate a multi-source externally
focused microwave for tissue ablation. The invention includes several versions of
EMlT systems differentiated on the basis of frequency levels and complexity. Further,
the invention includes a co~ l implemented software specifi~Ally configured and
tailored to the EMIT system with a graphical and three-dimensional tomographic
im~ging interface.
Background of the Invention
Electromagnetic tomography is a relatively new technology with enormous
potential for use in medical and related industries. Spe~ific~lly, the technology is
becorning promi~ently mature and practicable for use in internal, non-invasive, real-
CA 02260120 1999-01-05
WO 98/01069 PCT/US97/11787
time imAging of the physiologic ~rO~I lies of tissues and organs, based on tissue
dielectric plopellies differentiation.
Known microwave tomographic im~ging utilizes microwave radiation to image
an object by detecting the effects the object had on the microwave beam after it has
e,lco~lnl~led the object. The changes effected in the reflected microwave, due to this
encounter, are dependent upon the dielectric ~ lillivil~y and conductivity ~lO~ lies
of the tissues of the object being imaged. Spe~ific~lly, for a given microwave
frequency, the observed changes in the reflected microwave echo signify a specific
signature of the imaged tissue.
Microwaves are ultra-high to super-high frequency radio waves with very short
wavelengths r~nging from a~l o~ .ately 130 ce,llil,leters down to fractions of a
millimeter. Frequencies range between 0.1 Giga Hertz (GHZ) to 3000 GHZ. The
rnicrowave range which is currently used for microwave imAging of biological tissues
is in the range of about 0.5 to about 3GHZ. However, other ranges of the microwave
spectrum may also be used as well. The delrllllillant in the selection of the range is that
the radiation be non-ionizing to prevent destruction of tissue members or cells.
Accol.lillgly, there are biophysical parameters which should be considered when
del~l"li.ling a compaffble frequency range.
The prior art utilizes two basic categories of microwave im~ging The first
cal~go~y is static im~ging based on forming images by d~ ini,lg the absolute
livily values of the microwave radiation after its interaction with the object. The
second category is dynamic imaging which is based on variations in ~ ilLivity within
the object occurring at the time of incidence of the microwave radiation. The latter
.
CA 02260l20 l999-Ol-0~
WO 98/01069 PCT/US97/11787
form of imAging is extremely useful in applications in im~ging biological tissues to
monitor ongoing physiological change. Both static and dynamic imAging te- hniques
r~uil~e an active imAging process wher~lJy a microwave scanner employs moving or
scalu~i,-g incident radiation and detects the changes in the microwave radiation based
on interaction with the object being imaged.
Using dynamic imAgin~, image r~collsLI uction is based on the dirr~,ence in
diffracted fields recorded from several data sets taken from a body with a chAnging
dielectric conll~sL However, internal imAging within larger bodies poses resolution
problems which limit the application and scope of dynamic imaging. The present
invention provides significant advances over the prior art by illtegl~ting biophysical,
co~ ulel software and microwave tomography technologies to provide a high
resolution image.
Summary of the Invention
The invention il,l~glales and implements biophysical, al~-~lillllllic/com~ul~
and microwave tomography devices and methods to provide a three-dimensional
tomographic system. Specifically, the invention includes a new method and system for
medical physiological tomography wherein a one frequency three dimensional
microwave tomographic system (3D MWT) is combined with a one frequency three
~lim~n~ional electrical impedance tomographic system (3D EIT) capable of imaging a
full scale biological object(s) such as a human torso.
Spe~ifir~lly, the present invention provides a non-invasive real time in~Aging of
the physiologic l,rop~l Lies and temporal changes of tissues and organs based on tissue
dielectric ~rop~. lies difr~lellliation. For example, using the invention it has been
CA 02260120 l999-01-0~
WO 98/01069 PCT/US97/11787
shown that the dielectric ~1 o~l lies of the myocardium are sensilive indicators of its
physiological condition, including local blood supply, ischemia and infarction. The
degree of change in the myocardial dielectric properties provides adequate data for
reconstruction using microwave tomography. More spelihrAlly, the invenffon includes
an EMIT system with a number of microwave frequencies (microwave spectroscopy)
and other frequencies lower than the particular cellular membrane relaxation
frequency. This frequency composition of the invention enables estimation of
biophysical l~a~ lerb of the tissue as cellular volume fraction, intracellular and
membrane resistivities, cell membrane capacitance, tissue free and bound water content
and tissue tem~elalure. It should be noted that such information is critical not only for
cardiology but also for other branches of medicine, inter alia, oncology, urology,
neurology and other studies.
Further, the present invention provides mathematical models and co~ ul~
implemented al~ ns for co~ cting h~lelo~le unavailable qual.lildlively
reconstructed clear structural images which depict exact distribution of dielectric
~rop~l lies within an object
Description of the Plè~lled Embodiment
The ~res~l~t invention provides a three dimensional microwave tomographic
system which is combined with a three dimensional electrical impedance tomographic
system. Specifically, the invention includes a one frequency three ~limPn~ional
microwave tomographic system combined with one frequency three dimensional
electrical impedance tomographic system capable of im~ging a full scale biological
objectts) such as, for example, portions of a human torso. The disclosures of the present
CA 02260120 l999-01-0~
WO 98/01069 PCT/US97/11787
invention provide both theoreffcal and experimental values which show some of the
advantages and advances of the invenffon relative to the physiological imAging prior
art currently available in m~lirAl diagnosis and therapy.
The present invention contemplates a staged approach in which a first
generation EMIT system is launched with possible upgrades to a second ge,leldlion
system. The first generation is disffnguished in that it has two ~y~ ls having the
following characteristics (a) Mulfffrequency microwave spectroscopic tomographic 0.2-
6 GHZ, and (b) single microwave frequency (about 0.8 to 1 GHZ) with a single low
frequency (about 20 Hz to 200 kHZ). The second generation Culllpl ises of three systems
with the following distinguishing characteristics: (a) Mulfffrequency microwave 0.2-6
GHZ, (b) One low frequency approximately 200 kHZ and c) multisource externally
focused microwave for tissue ablaffon (60~ C).
Further, the present invenffon provides unique algorithm and software to enable
the generaffon of very ac~:~rale images from the EMIT sysl~llls. Spe-~ific~lly, the
algorithms enable image reconstrucffon from microwave tomography. Since the linear
opffcs approximaffon used in X-ray tomographic image construction is not readily
adaptable to microwave tomography primarily because of electromagnetic wave
propagation through biological media involving diffracffon and inl~lrel~llce
phenomenon, there is a need to develop specific algo~illlllls to solve Maxwell equaffons
or their scalar approximation. The present invention provides alg~)lilLlllic models and
software programs to solve these equations and enable a reconstruction of images as
needed. Details of the types of models, assl~lnpl ions, limitations and related
math~mAti~l postulations are discussed below. Several structures, features and
-
CA 02260120 l999-01-0~
WO 98/01069 PCT/US97/11787
alternate embo~lim~nts are disclosed herein to provide the inventors the ~.~ol~lion they
are deemed entitled. The invention is multi-faceted and may include several
inventions and embodiments which applicants may pursue individually or combine as
apparent. Further, it should be noted that experimental results and conclusions as
provided herein are for example purposes only and should not be taken to unduly limit
the present application in any way.
Brief Description of the Drawings
Figure 1 is a schematic diag-ram of the tomographic sye~lloscopy system of the
invention.
Figure 2 is a schematic diagram of the tomographic spe~ oscoyy
system of the invention.
Figure 3 is a flow diagram of the algo~ m for the reverse problem solution.
Figure 4 is a flow diagram of an alternate reconstruction algu~ for the
reverse problem solution.
Figure 5 is a graph of canine cardiac tissue dielectric characteristics as a function
of heart cycle.
Figure 6 is a graph of canine cardiac tissue dielectric characteristics as a function
of heart cycle.
Figure 7 is a graph of canine cardiac tissue dielectric characterisffcs as a funcffon
of occlusion and re-y~lfu.ion.
Figure 8 is a graph of canine cardiac tissue dielectric characteristics as a function
of occlusion and re-y~lf~.ion.
CA 02260120 lg99-ol-OS
WO 98/01069 PCT/US97/11787
Figure 9 is a graph of canine cardiac tissue dielectric characteristics as a function
of occlusion and re-pelru~ion.
Figure 10 is a graph of canine cardiac ffssue dielectric characteristics as a
function of occlusion and r~perfusion.
Figure 11 is a graph of canine cardiac tissue first order and second order
dielectric characteristics as a function of time and frequency of microwave emission.
Figure 12 is a graph of canine cardiac ffssue first order and second order
dielectric characteristics as a function of time and frequency of microwave emission.
Figure 13 is a graph of first order canine cardiac tissue dielectric characteristics
correlated to frequency of microwave emission.
Figure 14 is a graph of blood oxygen content correlated to second order canine
cardiac tissue dielectric characteristics and frequency of microwave ernissions.
Figure 15 is a graph of blood oxygen contents correlated to first order dielectric
correlation coefflcients and frequency of microwave emissions.
Figure 16 is a graph of blood oxygen contents correlated to second order
dielectric correlation coefficients and frequency of microwave emissions.
Figure 17 is a graph of first order and second order dielectric coefficients
correlated to total hemoglobin correlation coefficients and frequency of microwave
emissions.
Figure 18 is a graph of second order dielectric characterisffcs for a human left
ventricular myocardiurn normal ffssue to diseased ffssue correlated by frequency of
microwave emissions.
CA 02260120 1999-01-0~
WO 98/01069 PCT/US97111787
Figure 19 is a graph of first order dielectric characteristics for a human left
ventricular myocardiulll normal tissue to diseased tissue correlated by frequency of
microwave emissions.
Figure 20 is an expanded scale graph of the second order dielectric
characteristics for a human left ventricular myocardium normal tissue to diseased
tissue correlated by frequency of microwave emissions shown in Figure 18.
Figure 21 is a flow diagram of an ablation choice algolilllln.
Figure 22 is a chart of dielectric properties at normal, acute and chronic
ischemias.
Figure 23 is a chart of dielectric yroy~l lies at normal, acute and chronic
isch~miA~,
Figure 24 is a chart of dielectric properties at normal, acute and chronic
ischemias.
Figure 25 is a comparison chart of dielectric ~iOp~l lies at normal, acute and
chronic ischemias.
Figure 26 is a chart of dielectric ~loy~l lies at periods of occlusion and
reperfusion.
Figure 27 is a chart of multiple frequency flow reduction of E".
Figure 28 is a chart of relative changes of E' during acute infarclion.
Figure 29 is a chart of relative changes of E" during acute infarction.
Figure 30 is a chart of E" at a low frequency after occlusion.
Figure 31 is a chart of E' at a low frequency after occlusion.
CA 02260120 1999-01-05
W O 98/01069 PCT~US97/11787
Figure 32 is a chart of E' at a high frequency after occlusion.
Figure 33 is a chart of E" at a high frequency after occlusion.
Figure 34 is a comparison chart of dielectric properties at dilfel~l.t frequencies.
Figure 35 is a co~l~a~;son chart of dielc.l~lc properties at dif~rellt frequencies.
Figure 36 is a co~ al,son chart of dielectric yl o~l lies at dif~renl frequencies.
Figure 37 is a comparison chart of dielectric ~ro~l lies over time at a low
frequency.
Figure 38 is a comparison chart of dielectric pro~,~l lies.
Figure 39 is a reconstrucffon of E' of a beating heart.
Figure 40 is a reconstruction of E" of a beating heart.
Figure 41 is a reconstruction of E' of a non-beating heart.
Figure 42 is a leconDI, .~ction of E' of a first iteration of a gel phantom.
Figure 43 is a reconstruction of E" of a first iteration of a gel phantom.
Figure 44 is a reco~ ction of E' of a tenth iteration of a gel phantom.
Figure 45 is a reconstruction of E" of a tenth iteration of a gel phantom.
Figure 46 is a reconstruction of E' of a 10% contrast mathemAtirAl model of a gel
phantom.
Figure 47 is a reconstruction of E' of a 10% conllasl mAtll~mA~irAl model of a ~eJ
phantom.
Detailed Description of the Invention
-
CA 02260l20 l999-0l-05
WO 98/01069 PCT/US97/11787
1. Background of Microwave Tomographic Spectroscopy
Microwave tomographic imaging uses microwave radiation to image an object
by detecting the effects the object had on the microwave beam after it has interacted
with the object With microwave radiation, it is the dielectric ~e~ illivily and
conductivity ~ro~. lies of the ffssues of the object being imaged that delell,ul,es the
nature of the interaction. The dielectric ~lllullivily and conductivity ~ro~llies of an
object are expressed together as a complex p~.ll,illivity.
Microwaves, as a component of the electromagnetic radiation ~pe~ 11l4 are in
the frequency range between approximately 0.1 Giga Hertz GHz to 300 GHz. This
co~ onds to the wavelength range between 300 mm and 1 mm. The microwave
range useful for microwave im~EinE of biological tissues is in the range from about 0.5
to about 3 GHz, but other ranges of the microwave specll ~1l can be used as well. The
quantum energy of the photons in this range of the electromagnehc spectrum comprises
.
non-lomzmg radlahon.
In general, microwave imaging differs from X-rays, posihron emission,
ultrasound, or nuclear magnetic resonance imaging because the microwave radiahon
interacts with the object to be imaged as a function of the complex permittivity of the
object. Complex ~ illivily is made up of the dielechic pe~ illivily and the dielectric
loss. The dielectric pellllillivily is the real part and is given by the equation:
Equahon 1 - E' = e/eO.
-
CA 02260120 l999-01-0~
W O 98/01069 PCTrUS97tll787
The relative dielectric loss is given by the im~gin~ry part as
Equation 2 - E" = c~/27~JEo
Where Eo is the dielectric p~l~nillivily of vacuum, ~s is the conducffvity of the material
and f is the working frequency. For example, water has a fairly broadband dielectric
illivity, being approximately 80 at about 1 GH~ and falling to about 4.5 at
frequencies higher than 100 GHz. Water dielectric loss increases from values at about 1
GHz to around 25 GHz. An additional factor affecting the permittivity of water is its
l~ml~. ature.
There are two basic categories of microwave imaging. The first category is
static imaging based on forming images by determining the absolute ~lmillivily
values of the microwave radiation after its interaction with the object. The second
cal~gol y is dynamic imaging which is based on variations in pelll iLlivily within the
object occurring at the time of incidence of the microwave radiation. This second form
of im~ging is ~ l.ely useful in applications for imaging biological tissues to monitor
ongoing physiologic change. It must be understood, however, that both static imaging
and dynamic imAging still require an active im~ging process whereby a microwave
scanner employs moving or scanning incident radiation and detects the changes in the
microwave radiation based on interaction with the object being imaged.
Most non-biological objects that are amenable to imaging by microwaves
are very simple structures in terms of dielectric and conductivity variability. On the
CA 02260120 l999-01-0~
WO 98/01069 PCT/US97/11787
other hand, biological tissues demol~l.dl~ a wide range of relative dielectric COn~
These ranges are thought to be due in large part to the interaction of the microwave
radiation with charges on the surface of cellular membranes, the actual structure of the
cellular membrane with its hydrophobic layer between the hydrophilic layers, and the
water and electrolyte colllrnt both within and without the cellular structures.
Consequently, biological tissue interaction is extremely complex and will even change
with time due to the subtle change in l~ al~e secondary to the absorption of the
microwave energy used to obtain the microwave image. This absorption is converted
to heat, especially by water. This is quite important because the average biological
tissue contains approximately 70% water.
Tomographic rnicrowave im~ging has used a series of microwave el~uur
and receivers arrayed spatially around an object to be imaged. In a 1990 publication in
EEE Transactions on Biomedical Engineering, vol. 37 no. 3; pp. 303-12, March, 1990,
titled "Medical Tn~ging with a Microwave Tomographic Scanner", Jofre et al., disclose
a cylindrical array of microwave ell~ ls and receivers. The array totaled 64
waveguide antennas in four groups of 16 antennas. Each waveguide antenna is capable
of function as an ~ illrl or receiver. The object to be imaged is placed within the array
circle and immersed in water to minimize attenuation of the microwave incident beam
as it interacts with the surface of the object. Each antenna within a group emits in
sequence and the 16 antennas in the group opposite the emitting group act as receivers.
This procedure is sequentially repeated for each antenna until one revolution is
colll~let~d. The output microwave signal was 2.45 GHz, providing a collimated field
12
CA 02260l20 l999-0l-05
WO 98/01069 PCT/US97/11787
aAvAuroxAlllately 2 cm in height and having a power density of less than 0.1 miLiwatt per
square centimeter at the object.
The Jofre et. aA stAructure uses a coherent phase quadldlule detector to
measure the magnitude and phase of the signal from the receiving antPnn~. The data
iS liigj1i7Pt1 and a COAAI~Ul~ 1AnS a recon;.ll .Iction of the image based on changes in
the microwave radiation. This reconstruction is carried out by an al~ illull formulated
to yield an a~A~AoxilAIation of the microwave diffraction in two ~limpneions. The
algorithm makes use of the Born aA~Auroxilllation which assumes that scall~lillg acts as a
small ~ alion on the illl~min~tion and therefore the field within the body is
approximated by the incident field. This approximation problem remains as a
substantial lilllAldlion to microwave tomoglayhy.
In a publication in Journal of Neuroscience Methods, 36; pp. 239-51, 1991,
entitled "Active Microwave ColAI~ led Brain Tomography: The Response to a
Challenge", Amirall et al., disclose an application of the cylindrical array in JofrE's
paper to im~ging the brain. The image was again reconstructed using a diffraction
al~,o~ Aull for cylindrical geometries using Fast Fourier Tralli,follll techniques and the
Born first order approxirnation. The data as reconsll .lcted through the algolilAull
generates a contrast in ~lllullivily values of a cut of the body as a function of the
spatial coor.lin~tPs of the portion of the imaged body creating that co~ ast in
pellllillivily. Resolving power theoretically is limited to diffraction values of one half
the wavelength of the rrlicrowave radiation. For a frequency of 2.45 GHz this would
mean a theoretical lluA~,llum resolution of about 6 cm in air and 7 rnm in water. As a
.. ... . ..
CA 02260120 l999-01-0~
WO 98/01069 PCT/US97/11787
consequence of the reco~ uction algolilhllls and limitations in the electronics used in
the devices, these theoretical values are not achieved.
The validity of the first order approximations and the algo~illulls used in
the above device limit im~ing to static images of small bodies such as limbs. In the
case of larger bodies, such as a human head, the recon~ cted image would only show
correctly the outer contour of the body but not the internal structure.
Using dynamic imaging, image recon~ll uction is based on the difference
in diffracted fields recorded from several data sets taken from a body with a changing
dielectric contrast. Amirall et al., were able to achieve internal imaging within the
larger bodies, however, resolution was a~loxill~ately only half the theoretical
predictions.
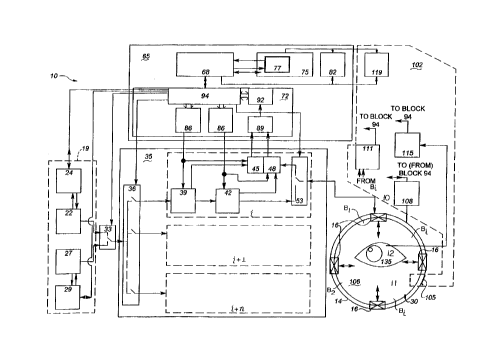
Figures 1 and 2 are each schematic diagrams of a tomographic
spectroscopy system 10 of this invention. Ufflity of this invention encompasses many
fields, however the ~ relled field described below is that of medical uses. More
particularly, the embodiments of the invention claimed below relate to non-invasive
diagnosis and therapy for heart arrhythmias. The system enables rapid and highly
accurate non-invasive detection and localization of cardiac a~.l.yllullogenic foci, as well
as non-invasive cardiac mapping capabilities. System 10 accomplishes these procedures
using a multiple frequency regimen, signal encoding techniques, improved
mathematical algolillulls, and previously unrecognized correlation functions. These
and other features of the invention will become apparent from the more detailed
description below.
CA 02260l20 l999-Ol-0~
WO 98/01069 PCT/US97/11787
Identification of the origin of cardiac arrhythmias has previously
depended on one of three principal te~hniques: call~l~l mapping, electrical excitation
mapping during cardiac surgery, or body surface mapping of electric potentials or
magnetic fields. Each of these te~hniques has substantial risks and li~ul~Lions. For
example, catheter mapping and excitation mapping during surg~l.y are inherently
invasive, access lilllil~d, and time sel~ilive. Body surface mapping can be IJelr~ll.,ed in
a non-invasive, low risk m~nn~r but with such poor definition that the data is generally
considered unsuitable for directing therapy. The mapping may be ~..ro~ ed using
either sequential temporal changes in the electrical potential distribution on the surface
of the body or sequential changes in m~gnetic fields on the body surface.
The invention does not l~Uil'e insertion of a catheter into a body, nor
does it require inserting probes into cardiac tissue. However, reliable and precise (<
about 5 mm) three dimen~ional reconstruction of the heart and its electrical excitation
sequence is now possible using this invention. Use of the ~echniques listed below for
ablation of allhylllmogenic sites is non-invasive and advantageously utilizes the
dirrel~nt frequencies and directions of energy available so that the ablation threshold
will occur only at the designated location. The invention does anticipate invasive
procedures, for example, ablation ~y~ s delivered by catheters or surgical procedures
to accomplish physician directed therapy.
As briefly mentioned above, the invention utilizes novel correlation
functions. These functions relate to tissue physical prolJel I ies and changes of those
~;o~. lies during cell excitation. In particular, the dielectrical behavior of biological
ffssue can be defined by two characterisffc parameters: dielectric permeability and
CA 02260120 l999-01-0~
WO 98101069 ~CT/US97/11787
conductivity. The ~ eter functions include frequency, l~ alule~ and tissue type.The tissue type parameter provides o~ol Lullilies for detection of anatomical structure
by measuring l,a.~lllill~d, i.e. reflected and scattered, electromagnetic energy through
tissue. For homogellous objects the dielectric characteristics can be readily detected by
me~nring amplitude and phase of lla~ d electromagnetic radiation. However,
the problem is more complicated when trying to measure the dielectric values of
radiation l~al~slllill~d through non-homogenous biological tissue simply by using
measured amplitude and phase of the transmitted wave. This problem is known as the
"inverse" or "l~v~.De" problem and has attracted some attention to its solution. This
invention inco.pol~L~s the strong dependence of tissue characteristics on tem~elalllr~,
and solves the "reverse" problem in novel ways by using multiple frequency and
multiple position emitter-receiver configurations.
Referring to Figures 1 and 2, system 10 comprises elllill~l-receiver sub-
assembly 14 suitable for mounting a plurality of microwave e~ -receivers 16. A
~rere.led configuration of e,~ -receivers is in a circular array. However, any other
3-Dimensional or 2-Dimensional array configurations, suitable for certain parts of the
body or for the whole body (for example, the "head," "heart," "arm," "leg," etc.), is
usable in this invention. Each ell~ill~l-receiver 16 may be enabled for radial movement
relative to the circular array.--Sub-assembly 14 may also coln~l.se a plurality of
vertically stacked ~llull~rs-receivers. A power source 19 provides narrow pulse-width
electromagnetic energy signals to each ell.ill~l of not more than about 10 mW/cm2
incident power density on an object. Preferably, the frequency band width of these
narrow pulse-width signals is ce.ll~led between about 0.1 GHz to about 6 GHz, and
16
.. . .. .. ..
CA 02260120 l999-01-0~
W O98/01069 PCTAUS97/11787
more ~re~lably within the frequency range of about 0.2 GHz to about 2.5 GHz. It is
recognized however, that this system may be combined with a low frequency source
(from about 20 Hz to about 2 MHz) to provide the electromagnetic impedance
tomographic sub~ysl~m of an improved im~ging device having a multi-source input
block, discussed further below. Power source 19 may comprise either a plurality of
power sources or a single power source, such as a generator. In the embodi~l~"l of
Figure 2, power source 19 comprises a sweeping diagnostic generator 22, a diagnostic
generator control block 24, an ablation generator 27, and an ablaffon generator control
block 29. Sweeping diagnostic generator 22 provides multiple frequency low power
energy for use in diagnostic applications, while ablation generator D provides high
power energy for microwave ablation of designated tissue regions. Selection of either
of the above generators is accomplished by switch 33 which connects gel,eral~l output
with the emillel~sl6.
A ~ h~nnPli~tion mPl h~ni~m 35is provided for activaffon and control of
channels i, i+1, i+n, for energy emission and recepffon. This subsystem comprises a
ch~nnPl number switch 36, an amplitude attenuator-detector manipulaffon (ADM) 39, a
phase rotator-detector 42, an amplitude detector 45, a phase detector 48, and an antenna
mode switch 53. In diagnosffc operaffon, ch~nnPl number switch 36 c~.ne~ L~ the output
of the diagnosffc generator 22 with the input of the e"ulLel (or a mulffple of e".ill~l~) at
any particular ffme. In the ablaffon or therapeuffc mode, the switch connects all
channels with the output of the ablation generator 27. Arnplitude attenuator-detector
39 and phase rol~lol detector 42 are in the ellulL~l path of all ~ h~nnPl~. Amplitude
attenuator-detector 39 attenuates the amplitude of emitted power, and with phase
CA 02260120 1999-01-05
WO 98/01069 PCT/US97/11787
rotator-detector 42 detects and encodes the output signal. Amplitude detector 45 and
phase detector 48 are in the received path of all ~hAnn~lc and, in the diagnostic mode,
detect and decode the amplitude and phase of the received signal. It is recognized that
other coding meAnc, such as polarity, may r~lire additional ~n~o~ling/de-coding
components. Antenna mode switch 53 functions in all ~hAnn~lR to connect the output of
the ellull~l path with the antenna or input path, at the receiver path, with the same
antenna.
Co~ uk~lion and control module means 65 includes a central procf~ccing
unit (CPU) 68, an interface subsystem 72, a display 75 and a display software 77, as
well as a memory 82. The interface sub~y~lell, 72 consists of a digital-to-analog
converter(s) (DAC) 86, a multiplexer 89, an analog-to-digital converter (ADC) 92, and a
control block 94 which creates time synchronization of controlled processes and
receives data to be analyzed.
An auxiliaries SUIJ~Y~I~11I 102 COlllyliS~S a thermostflti~ shield 105 for
controlling the temperature of an interface medium 106. A suitable interface medium,
for example, would be a fluid such as a solution of lil~iulll and l>al.~,. Other
suitable liquids (or substrates), such as specially homogenized fatty solutions, are
usable in this invention. These liquids would have a yreli...i.-~ry dielectrically
adjustable dielectric p~lll,illivily between about 50 and 90 at 2.45 GHz and a dielectric
loss between about 5 and 25, between the ~ll,ill~l~-receivers 16; the sul,~y~ ll 102 also
comprises a thermostatic control block 108 for controlling thermostatic shield 105, and a
basic ~h~nn~l control block 111 for control of the received signal from the Bi control
channels when the system 10 is in a calibration mode. Additional auxiliary components
l8
CA 02260120 l999-01-0~
WO 98/01069 PCT/US97/11787
may be added depending on desired performance fealules of the system, for example,
an electrocardiogram analyzer and/or a printer 119 may be useful to the system 10.
In a sequential multiple frequency tomographic spectroscopy system 10,
target ffssue 135 is irrA~ te~ in sequence with low energy microwave radiation from
the first to the nth emill~l (receiver) 16, while simultaneously taking measurement of
the received signals in (~U~~1) receiv~l~ 16 which in that particular step of the
sequence are not functioning as an ~ l. Several e..~ receivers 16 are used to
receive sign~l~ emitted by a single ~ r - receiver 16 in any given instance of time.
The system 10 rapidly changes channel number and antenna mode in sequence
according to the above configuration. After one cycle of n-channel emissions and
receptions, sweeping diagnostic generator 22 provides another cycle of n-channel
switched measurements. The total quanffty of cycle measurPm~n~: is normally not
more than N x M, where N is the quantity of antennas, and M is the quantity of used
~i~gnosffc frequencies. It is also lecog~ d that simultaneous measurements may be
obtained using a mulffple encoded frequency configuration. Following the
measur~ , system 10 solves the "reverse" problem according to the received
informaffon and the novel algorithms described more fully below in relation to Figures
3 and 4. When measuring physiologic changes it is important to understand the time it
takes for a physiologic event to occur, for example a myocardial contraction. These
ffme periods are defined as ffssue event ffme cycles.
Data acquisition in system 10 is ~lfo~ ed in ffme intervals which are a
fracffon of a ffssue event time cycle so that data acquisition may occur many times
during each tissue event and are stored in memory 82. Reco..sll .Iction time is fast
19
CA 02260l20 l999-Ol-0~
WO 98/01069 PCT/US97/11787
enough that body motion is not a problem. Anatomical object structure and
.al~re profiles are observable on display 75, may be manipulated using routines
of display software 77, and may be printed using p~ l 119. The al.l-yllul~ogenic
zones of the heart are defined as those regions with particular E' and e" values. Spatial
coordinates of these zones are defined with the help of the display software, the CPU,
and the memory.
During ll.easur~ ent cycles, system 10 periodically makes l~lllyerdlule
control corrections of the interface medium 106 with the aide of the thermostatic control
block 108. System 10 also syncllrol~es with the heart cycle in which the tissue is
resident using electrocardiogram analyzer 115.
A key feature of system 10 which facilitates the speed and accuracy of
calculation is the use of a coding device for encoding the microwave signals supplied to
the ~ . When the receivers receive the col . e~ollding signals after interaction with
the tissue, the Ri~lR are distinguishable by their originating ellull~r or ~ group.
P~e~ll~d encoding techniques are phase, amplitude, or polarity modulation; however
it is also within the scope of the invention to employ frequency modulation. Frequency
modulation may be useful in certain applications where simultaneous emissions from a
plurality of emitters are required.
System 10 is one embodiment for using the novel method steps of this
invention which permits non-invasive tomographic spectroscopy of tissue. The method
COlll~lISCS the steps of: providing a radiaffon power source; providing a plurality of
radiation el~ull~.-receivers; and controlling the plurality of radiation ~ r-receivers
so that a plurality of e~lull~l-receivers are able to emit multiple frequency radiation
CA 02260120 1999-01-0~
WO 98/01069 PCT/US97111787
from the power source to a plurality of e~ receivers that are receiving the
radiation. F~ Lller steps include: placing an interface medium between the ~llulLulg and
receiving emitter-r~ceiv~,~ for dielectric matching; placing tissue to be irra~liAte.l
within the interface medium; ~ ilLu~g the radiation from the e~ -receivers;
receivil g the radiation in the emitter-receivers after interacting with the tissue; and
me~ g a change in the radiation after interacting with the tissue.
As disclosed above, novel algolillulls are used to solve the "reverse"
problem calculations. In this invention, there are no approximations, such as the Born
approximation discussed above, used to define dielectric or conductivity parameters of
non-homogenous irradiated tissue objects. Rather, the llleasulillg step of the above
method incorporates both old and new concepts to refine and render useful the data
derived from this form of electromagnetic im~ging In pafficular, and as shown in the
flow diagram of Figure 3, the measuring steps comprise computations using an input
data formation component 220, a direct problem solution coln~ollellt ~7'~, a reverse
problem solution component 224, a multiple frequency correlation component 226, a
COUII~Ul~ vis~ tion control 236, and a tomographic s~e~ lloscopic image 238.
The direct problem solution is a known calculation which solves
microwave propagation from emill~l to receiver through a biological means. Solution
of the reverse problem allows precise computation and generation of a tomographic
spectroscopically useful image of the tissue based on the measured change of the
microwave radiation. The reverse problem solution steps comprise: del~llliination of a
functional formation colllpoll~nt 228 which sums the input from all emitters-receivers;
using a gradient formation component 230 as a derivative of the functional formation
,
CA 02260120 1999-01-0~
WO 98/01069 PCT/US97/11787
COlllpO~ t to simplify processing speed; calc~ ing a minimi7~bon parameter tau to
verify the accuracy of the gradient function and to reconstruct in the most accurate
m~nn~r; and ~lro.ll~illg an E* calculation 234. The E* calculation 234 uses the
following:
Equation 3 E* = E' + iE"
Where E' said E" are the values of dielectric p~ illivily and loss measured by the
invention and i represents the imaginary number. Using E* as a r~s~ live value of
E' and E"is a convenient mathematical tool. It should be understood that the invention
may also use either E' and/or E" as the measured dielectric parameter for generating an
image. The reason for using E* is that dielectric contrast between tissue and/or tissue
physiologic states may be found in either a dirrel~"ce or change in E' and/or E". If E'
and e" are calculated together as E* then any dielectric change in either E' or E" will be
detected in an E* calculation. As will be seen later, some physiological dielectric
changes are best evaluated by using only E' or E". It is iln~ol Lant to recognize that
wl~l~v~, E* is used, E' or E" can also be used in place of E*.
The flow chart depicted in Figure 4 represents an embodiment of the
~ esent invention which can be used in a catheter system as well. Data is fed into a
direct problem solution step 240 from a working arrays formation step 242 and an
antenna simulation step 244. The working arrays formation step 242 receives data from
a frequency and l~ lalule correlation step 248 which derived its initial values from a
zero approximation step 250. The antenna simulation step 244 provides values for
.
CA 02260120 1999-01-0~
WO 98/01069 PCT/US97111787
starting the calculation process acting as a base line from which to con~ll uct an image.
Direct problem solution step 240 then is able to solve an image problem based on
knowing what the amplitude and phase of the emitted microwave energy is and
making an assulll~Lion as to what the biological tissue dielectric effects will be and
calc~ ting an e~e l~d amplitude and phase value for the lld~ d microwave
energy. This solution from the direct problem soluffon step 240 is then passed to
reverse problem solution step 252 COll~ Sillg an equation system formation step 254, a
Jacobian formation step 256, and a matrix ill~velsillg step 258. The reverse problem
solution step 252 then calculates an image of the biological tissue based on known
emitted microwave and other amplitude and phase values and known received
amplitude and phase values from the e~.ill~l receiver arrays. In effect, the reverse
problem solution is generating the tomographic image by knowing the amplitude and
phase of the emitted energy and the amplitude and phase of the lldnsll itted or received
energy in order to calculate the dielectric characteristics of the biological tissue through
which the energy has passed. This image data from the matrix irreversing step 258 is
then passed through an error correcting iteration process involving an error estimation
step 260 and a first error cc,ll~lion step 262. For each value of amplitude and phase
emitted and received, where i is equal to 1-n, the matrix irreversing step 258 in
conjllllction with error estimaffon 260 and first error correction 262 forms an il~ldlive
loop that begins with in~ulling the first grid point E*~T into the error estimation step
260. For each value of i from 1-n, a E*j + 1, Tj + 1 is geneld~d in which j is the grid
number in the coordinate system for generating the two or three dimensional image
CA 02260120 1999-01-0~
WO 98/01069 PCT/US97/11787
Col sll .lCt and where j is equal to values from l-n. After each E~, T value has undergone
an error estimation and first error correction, the value is then passed to an anatomical
and T reconstruction and anatomy error ~stim~ffon step 264. At this point the value as
fed into error estimation step 264 is compared with the e" value and if the error
estimation has occulled the value is passed onto an anatomical structure and T
visualization step 266 which serves the purpose of generating the two r~im~nAional or
three ~ onal image of the biological tissue based on dielectric collLI&sL If,
however, the error estimation step results in a no r~s~onse, a data point is passed to
second error correction step 268 which then adjusts, in conj~ .;lion with the first
correction step 262, the values generated by frequency and lelnpelaLure correlation step
248.
Figure 5 is a graph demo~ aling the capability of system 10 to detect
cardiac excitaffon by changes in dielectric characterisffcs of cardiac tissue. In particular,
Figure 5 shows the change in E' values at the onset and throughout the period Tl of an
electrical excitation process and during the llal~ilion period T2 to recovery. Figure 6
discloses similar detecffon capabiliffes for system 10, but for values of the E" dielectric
parameter. In both Figures 5 and 6, each point represents a mean value for seven
measur~m.?ntc~
Figures 7-10 are graphs demonstrating the ~C~It chang of a selected
dielectric characterisffc, for multiple frequencies, during a series of coronary arterial
occlusions. Figures 7 and 8 disclose, over a long duration, a series of short occlusions
followed by a long occlusion. These figures demon ,L ale the correlaffon of dielectric
characterisffcs for E' and E" depending on the degree of cardiac ischemia. This pattern
24
CA 02260120 1999-01-0~
WO 98/01069 PCT/US97/11787
of dielectric changes CO~ S with the known tissue phenomenon of a ~.ol~live effect
from pre-conditioning prior to a total occlusion. Figures 9 and 10 disclose, over a short
duration, a series of short occlusions followed by a long occlusion. These figures
support the conclusions stated above in relation to Figures 7 and 8.
Figure 10 provides further example of the value of multiple frequency or
spectroscopic analysis of tissue. In this figure, the curve of the values of percent change
of E" at 4.1 GHz is relatively flat and less useful as compared to the colr~s~ollding
values at either 0.2 GHz or 1.17 GHz. This highlights the need for system 10 to detect
tissue excitation phenomena and other physiological events, e.g. i~rh~mi~, using
multiple frequency techni~lues which might otherwise remain undetected or not useful
in a single frequency analysis. This is further demonstrated in the E~(f) graphs of
Figures 11 and 12, in which curves 145, 147, 149, 151, 153, and 155 ~e~ sent time after
occlusion (i.e., acute iRrhemi~) of 0, 15, 30, 45, 120, and 125 minutes respectively for E'
(shown by ~ curves) and E" (shown by o curves). The value of is E~/E~ before.
Reperfusion occurs at time 125 minutes, and is represented by curves 155. These figures
demonstrate that if analysis is limited to a single frequency, then very little useful data
is derived during short tissue excitation periods. However, if multiple frequency
analysis is conducted essentially simultaneously then the tissue physiological
phenomena are clearly exhibited.
Figures 13 and 14 disclose the correlation of dielectric characteristics to
blood oxyhemoglobin content. In Figure 13, the dielectric characteristic is the percent of
(E'(HbO2)-E'(86.9))/E'(86.9), and in Figure 14 the dielectric characteristic is the percent
of (E"(HbO2)-E"(86.9))/E"(86.9). In each figure the fre~uency curves 161, 163, 165, 167,
CA 02260120 1999-01-05
WO 98/01069 PCT/US97/11787
169, 171, and 173 col.e~ond to 0.2 GHz, 1.14 GHz, 2.13 GHz, 3.12 GHz, 4.01 GHz, 5.0
GHz, and 6.0 GHz, respectively.
The dielectric p~ ullivily of oxyhemoglobin (HbO2), the partial ~.~ssu~e
of oxygen (PO2) and total hemoglobin (tHb) co~ .t are correlated to microwave
frequency range 0.2 - 6 MHz in Figure 15. The highest degree of correlation for
oxy-hemoglobin occurs between the frequency range 0.5 - 2.5 MHz. Through this range
the dielectric ~llllillivily value e
The correlation coefficient curve for E", dielectric loss, is disclosed in
Figure 16. The correlation coefficient for HbO2 is highest at approximAt~ly 2 GHz with
the correlation coefficient for PO2 approArhing unity between 2.5 and 4 GHz.
The correlation coefficient studies disclosed in Figures 15 and 16 are
representative of the invention's ability to distinguish between oxyhemoglobin (HbO2)
saturaffon perc~nldge and PO2. Both of these values are important pieces of
information useful to health care providers. Presently, there exists real time bed side
photometric means for del~ g oxyhemoglobin saturation ~el~celltage called an
oximeter. However, in order to obtain a PO2 value, arterial blood must be withdrawn
from a patient into spe~iAli7~ ylinges and put through a mArhine capable of dil~:lly
measuring the parffal pressure of gases in a liquid.
The E' and E" curves for total hemoglobin as a I ~Çelence correlation are
depicted in Figure 17. The E' curve as shown is a fairly flat correlaffon curve that is
fairly non-correlative, mainlaining values of correlaffon less than -0.995 throughout
most of the curve. The E" curve, however, shows an increase in correlaffon to total
hemoglobin for the microwave frequency range between 4 and 5 GHz. As noted above
26
.
CA 02260120 1999-01-0~
WO 98/01069 PCTIUS97/11787
in the discussions pel lainillg to Figures 3 and 4, correlation values for oxyhemoglobin
PO2 and totdl hemoglobin may accurately derive from these correlation curves during
a single frequency range scan from 0.2-6 GHz and calculating the dielectric pel.l,illiviLy
E' and dielectric loss E" values for blood. The concenL,dlion of oxyhemoglobin
saturation would then be best correlated with the E' value at, or about, 1.5 GHz, the
PO2 value would then be calculated from the correlation value of the dielectric loss, E",
calculated at, or about, 3.5 GHz, and tHb could be calculated from the correlaffon value
of the dielectric loss curve, E", calculated at, or about, 4.5 GHz. Each scan through the
frequency range from 0.2 - 6 GHz would require no more than several milli~econds of
microwave exposure and then com~uling the value calculations. Thus, the present
invention could feasibly be used at the bedside for virtual real time ACs~scn~ent of these
param~ D.
The ~resellt invention is able to provide a real time bedside monitoring of
HbO2 saturation ~ercenlage and PO2 values. The present inv~ on does so without
necessitating removal of blood from the patient and the delay and cost of sending the
blood to the labolal~l y for analysis.
This invention is not li~ d to HbO2 and PO2 values. Any blood and
tissue coln~,ol-e~ oss~i..g a dielectric conllasl characteristic is capable of direct
measu~ t and real time evaluation, non-invasively, using this invention. The
~resel.t invention also possesses an ability to detect dielectric characteristic changes that
occur in a tissue that is becoming ~iiceAce-~. By way of example, a weakened diseased
~ ury~lllal portion of a ten year old malE's left ventricle was repaired. During this
repair the diseased portion was resected from the heart such that the diseased portion
CA 02260l20 l999-Ol-0~
WO 98/01069 PCT/US97/11787
was removed entirely. This l'~llii'eS that the resection margins co~ in normal
myocardium. The invention was used to evaluate this piece of resected heart ffssue and
the test results are presented in Figures 18-20.
The E" dielectric loss characteristic of normal myocardium is shown in
Figure 18 as a curve 200 measured over a microwave frequency range between 0.2 and
6 GHz. Throughout the entire frequency range this normal ffssue is disffnguishable
from the abnormal tissue as shown by curve 202.
Figure 19 shows the E' dielectric ~ lillivily characteristic curves for this
same tissue sample. Normal tissue has a E' single curve represented by curve 204. The
abnormal tissue is shown in curve 206. The normal myocardial ffssue is disffnguishable
from abnormal myocardial tissue over the entire microwave frequency range used in
the present invention.
Figure 20 is an expanded scale graphic representation of the same E"
dielectric loss data of Figure 18. Curve 208 r~ s~nl~ the e" for normal myocardial
tissue with curve 210 representing the E" values for abnormal cardiac tissue.
The present invenffon is able to use this dielectric characteristic difference
to generate an image. For example, as system 10 of Figures 1~ scans a patient's chest,
an anatomical image of the organs is obtained based on the dielectric characteristic
differences between the various ffssues as demoll ,llal~d in Figures 5-12 and 18-20.
Additionally, the invenffon facilitate anatomical location of diseased abnormal ffssue
within normal ffssue. This anatomical informaffon is useful in many ways. An
example of one illl~Ol ~nt use would be to direct real time l~ y. Often abnormal
myocardial tissue causes deleterious l hy llull disl~ ces. Ul~ol l u~ately, this
28
-
CA 02260120 l999-01-0~
WO 98/01069 PCT/US97/11787
abnormal tissue may be visually indistinguishable from sullounding normal
myocardium. The present invention provides real time im~ging of the abnormal tissue
based on the dielectric characteristic differences such as those detected in Figures 18-20.
Using fast reco~ uction roulil,es and sc~nning through the r,~uel~y range in at time
rates that are fractions of the tissue event time cycle, a rlini~i~n creates a map of the
abnormal tissue. Depending upon which frequency and dielectric characteristic isevaluated, the investigator may reconstruct the dielectric ~JlU~l lies to generate a
functional excitation map through the abnormal tissue area or alternatively may
reconsLI uct a l~ ol~l change map and correlate those temporal changes to known
electrical markers for anomalies within the tissue. The clinician may then direct
ablation therapy to remove this abnormal rhythm focus and evaluate the adequacy of
the ffssue removal.
An embodiment of the present invention using laser or microwave
sources of ablaffon is disclosed in Figure 21. As disclosed, a method for ablaffon of a
lesion, for example, an arrhythmogenic focus within normal myocardial tissue, is
pe.rol~led begi~-~-i..g with il~ulling information into an input data formaffon step 300
from anatomical structure analysis derived from data generated by the invenffon
disclosed in Figure 2 and eA~l~d lempelal~ distribution values. The input data
forma~on step uses information from a rnicrowave power source as an a~l oximation
step 302 or a laser power source as an approximation step 304 to derive input to be fed
to a direct problem solution for microwave 306 or direct problem solution for laser
control 308. A d~ mil-ation step for de~....i..i..g the possible available microwave
and laser power sources is undertalc~n at step 310. The result of this del~..l.ination is
29
CA 02260120 1999-01-05
WO 98/01069 PCT/US97/11787
passed onto a sources and lesions correlation databank 312 to derive an approximation
step 314, also taking input from an antenna simulation step 316. The current expected
dlul~ is calculated at step 318 and co~.~led for a l~.lly~ldlule non~ eal;ly at
step 320. The results of the direct problem solutions for microwave or laser 306, 308 in
conjunction with the COl.~ led current temperature from 320 is incorl,oldled into a
biological heat equation solution 322 to derive an actual le~l~yelalule solution.
Te~ dture distribution from the bioequaffon step 322 is passed to a lesion
loc~ ion step 324 which provides data back to the source lesion correlation databank
312 for r..nning the next approximation through to the input data formation 300 for the
next delel,llillation of the bioheat equation solution step 322. Information from the
equation solution step 322 is also passed to a di~erent necessdl y lesion ~ Ull~llt lesion
formaffon step for comparing the c~ lt lesion size with the estimated necessary lesion
size to del~ le if oplil~ n therapy has been achieved or not If treatment has been
achieved, the decision then passes to opffmal region step 328. If the ~-ulent lesion is
dif~elent than the necess~ry lesion, the diL~Ielll informaffon is passed back to s*ep
sources lesion correlation databank 312 for a reapproximaffon at step 314 on through
input data formation 300 to undertake the next trealln~llt in order to more closely
approximate the n~c~ss~ry lesion through treatment. The number of steps through the
dlive process are mullilored by switch 330 with comparison of an ex~e~l~d locaffon
size of lesion step 332 at step 0, step 334. For steps greater than 0, switch 330 swi*hes
to step greater than zero step 336. The entire process is colllilluously re-evaluated for
completeness of ablation therapy and re-evaluating on a real ffme basis the lesion
, _ ~ .
CA 02260l20 l999-Ol-0~
WO 98/01069 PCT/US97/11787
generated by analysis of the anatomical structure derived from the microwave
tomographic imaging system.
The above described system provides for using microwave energy in a
novel approach providing rapid real time ~qsPcx~ t of biological function and
anatomical structure by reverse problem solution for the dielectric characteristics of
biological tissues. The invention achieves substantial increase in procescing speed as
well as substantial improvement in resolving power over any known prior art The
~resellt invention also provides for techniques in evaluating real time parameters for
del~ ling biological col-lponellt conce.lLIdlions or physiologic characteristics based
on the dielectric cOllllasl between dirrel~nt states of physiologic activity for the
biological compound or physiologic reaction. Additional approaches to achieving the
above advantageous results will be further described below, including modified
iteration algolilhll s, low frequency (ErI) and microwave frequency as the mulffple
frequency combination, as well as new bulk myocaldiu~ll dielectric analyses.
2. Review of Bulk Myocardium Dielectric Pl o~l lies
In the process of discovering the various benefits and features of these
invenffons, the inventors have achieved several breakthrough t~hni~lues and
accomplislul~nl~. In this regard, a ~ ~.led new model of bulk myocardium dielectric
~rop~:l kes is being utilized. This model assumes a composiffon of membrane covered
cells which are modeled as infinite cylinders. This model ufflizes the complex values of
dielectric properties of the intracellular, extracellular media and the cellular membrane.
The model is useful to analyze the myocardial resislivity above and below the cell
membrane relaxation spectrum in normal myocardium and in acute and chronic
CA 02260l20 l999-Ol-0~
WO 98/01069 PCT/US97/11787
infarction. This myocardium cell model gives reasonable qualitative explanation not
only for the spectrum of normal myocardial resistance but also for observed changes in
the spectrum of myocardial resistance in acute ischemia and chronic i~clion based on
a volume fracffon hypothesis.
The contributions of intracellular, extracellular and cell membrane r~sislal~ces to
bulk myocardial resistance are frequency dependent. At frequencies below 0.2 MHz the
intracellular contribution to bulk resistance is much smaller compared to the
extracellular resistance and does not exceed 10-15%. At frequencies higher than 0.5
MHz the measured bulk resistance reffects extracellular and intracellular resistances at
about the same order. The contribution of the cell membrane l~bi~l~ulce reflects
extracellular and intracellular resistances at about the same order. The contribution of
the cell membrane rebiblallce is much smaller compared to the intracellular and
extracellular resistances and does not exceed 0.1% at a frequency near 1 Hz for normal
myocardium.
A specific experiment with these assumptions will be described below, in
which signifirAnt changes in myocardial dielectric plO~I lies in acute and chronic
myocardial infarction were detected at a spectrum near the cell membrane relaxaffon
frequency. A theoretical explanation for the observed changes in buLk myocardial
resistance in acute and chronic infarction is proposed here. This explanation is based on
a new model of bulk myocardium dielectric properties as a coll~yobiUon of membrane
covered cells modeled as i~ cylinders. This model utilizes the complex values of
~liele~llic ~. Op~l lies of the intracellular, extracellular media and the cellular membrane.
The model was used to analyze the myocardial resistivity above and below the cell
CA 02260l20 l999-Ol-0~
WO 98/01069 PCT/US97/11787
membrane relaxation spectrum in normal myocardium and in acute and chronic
infdl~:lion. The reason for this is a principally diffel~ellt current flow pattern through
and/or around cells at frequencies lower and higher than relaxation rleqllency of the
cell membrane. The contributions of intracellular, extracellular and cell membrane
~csisl~ulces to meP~ ed bulk myocardial resistance were theoretically investigated also.
The term low frequency resistance or dielectric ~rolJ~I lies will, in this
cunte~ L, denote such l~lo~ lies at the frequency at or below 0.2MHz. It is readily
apparent that lower values may be chosen collsisl~nt with these concepts. The term
reconstructed or high frequency resistance denotes the inverse value of the ion
conductivity component del~l "~ined from microwave frequency dielectrical spectrum
data.
The ion conductivity part at high frequencies was reconstructed from
measured dielectric ~royel lies at the microwave spectrum. This reconstruction was
lulllled based on a multicomponent model, the myocardial dielectric ~IO~l lies in
the microwave spectrum were described in a complex form as free water, bound water,
and protein relaxations with colle~onding volume fractions and ion conductivity.
For this ~ ose, consider a homogeneous medium with complex
dielectric p~ illivity (E2) in which some part of the volume is occupied by cells (Vcell)
with certain geo~ cal shape (sphere or infinite cylinder with radius (rl)). Each cell
con~isl~ of two layers. Assume the outer layer is a homogeneous membrane with
complex dielectric pelllullivily (El) and thickness (h) and a homogeneous intracellular
CA 02260120 l999-01-OS
WO 98/01069 PCT/US97/11787
media (Eo). Let us assume *~e~ ~at the cell co~ ion iB SIllall enough to neglec~
their interactions.
Myocardial histology shows that ~e c~ r st:ructure is close ~ cylinders
connecbed with each o~er ra~er than spheres. Accordingly, this model u~lized the
cylin~ri~Al approach. This model also utilizes the complex values of diele~l.;c
y~ lies. The Laplace equatlon for this model was solved under ~e &~.~n~ion ~at
cells are not mteracting wi~ each other. E~Ç~ Live dielec~ic ~ro~ 3 of a ~ Eeff
were d~ ed as a co~fhri~nt between mean ~by volume) values D and E:
Equation(4) D~
In thi~ case of cylindrical or spherical cells, the equaffon for Eeff c~n be
rewritt~n as:
Equation (5~ '.o ~r ~ r~
r ~8~ e~
Now consider electrically non-interacting celIs and neglect the electrical
field altera~on in ~he extracellular space. Under ~ese ~s~mrffons and taking into
account ff~a~ ~he directions of all mean electrical fields are similar and coincide wi~ the
direc'don of an exlprn~l field (for example, x):
Equation(6)
34
CA 02260120 1999-01-05
WO 98/01069 PCT/US97/11787
then a follow on equation for Eeff can be rewrit'cen as:
~ ",,' ~c,-~yrJ ')~'
Equation(7) ~ y,_ , r~
~ v~ VJ~4
Finally, the equation is obtained for the mixture (or bulk ~ ial) co".~lex
diel~ c permilliviLy:
E~uation(8) ~,~3c2ll ~nvc~U~ll
Where: n-e for a sphere and 2 for an infinite cylinder, rO=rl-, and h is the internal cell
radius,
Equat~on (9) ~-l(c~ t~tn-~ 2~(
B=~eO~[n-l)cl)l(c~(n-l)c~ ~ rc~l(e~-e~)l
Equation (10) r'
o-e~)[(n~l)(t~ -vccJl((n-~ t~)l
The basis of the probe method described below (co-axial probe) is a
P~ ~ent of complex input impedarlce of the probe, located on the surface of a
semi-i~ media with dielec~ic constant E' and conductivit~ c~. An acffve and
reactive co~ on~.~t of input probe impedance at a certain frequency can be described
as:
CA 02260120 lsss-0l-05
WO 98/01069 PCT/US97/11787
R",, - ¦ a ~dv~ E ~I ~fdJ
Equaffon(11) v _ ~ _
.... _ l,,
Keeping in mind that the first term of the active part of the co~ x input impedance
~n~ an acffve loss in ~e tested medium, it is possible to ~!;..'~l~ ~e contribution of
intracellular, extracellular and membrane r~sisliviLies to ~e bullc resistance:
Equation (12) cc~ a, IEpdv ~-0,1,2
where: i=O for intracellular; i=1 for membrane; and i=2 for extracellular.
For ~he llleo.~tical calculabon of buL~c myocardial r~i;.l~lce at low and
high frequencies using this model ~e following pald~ t~ls were used: extracellular
?l~ e Re%t- 70 ohm*cm, intracellular re~ e Rint= 185 ohm~cm, membrane
rcsi~An~ e Rmern- lKohm~cm2, membrane capacitance Crnem= 1 ~1F/cm2, cell radius
RCell= 10 ~rn~ exL~acellular and intracellular dielectrical values Eint=EeXt=7~ The
c~llnl~r volume fraction VCell and frequency can be varied.
It is il~ly~rlal~t to understand the contribution of bo~ exlta~ellular and
intracellular r~is~ eR to 1~e measured buLk myocardial ~ is~nre. ~he values for the
contribution of e~ ellular and intracellular resist~n~ es at normal myocardium
cellular volume fraction (Vcell=0.75) are summari~ed in Table 1.
~g l . F~ dcDend~nce ~f r.l.f,r~ i ~d; ~ _ccllula~ inn~. ~~/~v tn bulk my~
Fl, ~ IHz lOkHz lOOkHz O.'MHz lMHz lGHz
~n 7.7 7.7 10.3 41.1 60.S 66.3
Ex~ccll 92.~ 89.6 St 9 39.S 33.7
36
CA 02260l20 l999-Ol-0~
WO 98/01069 PCT/US97/11787
As can be seen from Table 1, the contribution of intracellular l~si~l~..re is much smaller
when colJIl~aled with extracellular re~isldnce at low frequencies. It becomes negligibly
small at a low cellular volume fraction. At the same time at high frequencies the
contribuffons of intracellular and extracellular l~sisla~,ces are almost equal at a normal
cellular volume fracffon. Thel~rore the bulk resislallce of the normal myocardium
measured by the low frequency means of the invenffon reflects mostly extracellular
rP~ e (from DC up to 0.2MHz). For frequencies higher than 0.5MHz the measured
bulk resistance reflects extracellular and intracellular resistances at about the same
order.
The membrane resistance contribuffon to bulk myocardiurn resistance is
much smaller when compared with the extracellular and intracellular rPs;~ . For
example, at a normal cellular volume fraction (near 0.70-0.75) the membrane
contribuffon at the frequencies 1 Hz, lMHz and lGHz is 0.1%, 0.02% and about
1x10⁻⁶% respecffvely. It should be emphasized that the model does not take into
account an alteraffon of the electromagneffc field caused by cell to cell interacffon. The
gradient of the electromagnetic field across a membrane is quite large in lower
frequencies. It decreases with increasing frequency and becomes negligible after the
relaxaffon frequency region (1-IOMHz). It is consistent with a well known phenomenon
that the amplitude of a sffmulaffon CUIlellt iS proporffonal to frequency. It can be
predicted that sffmulaffon by externally applied currents (as conl~lnplated by
CA 02260120 lsss-0l-05
W O 98/01069 PCTAUS97tll787
en~hodimentF~ of this i-~v~lLion) is almost im~o3sible at fr~quencies hi~her than 10 MHz
and for a reasonable cur,~nt amplitude.
It should be l,oi~ted out that the ele l.v.~.agn~r field distribution in the
mYOCardlUm jB quite different using the contact probe in ~e initial phases of this
tl.od than in any form of inv~ive probes placed into the my~ardi~n. The mean
values of experim~nt~lly measured ~ ~nr~s are compared with the ll,eolcLcaIly
predicted myocardial reCic~nre6 for this model at body ~ ..dlule~ and are
s1lmm~rized in Table 2.
Ci! l~ v~ucsofc;~g ~V ~-vvc~ lr~ar~e ~n sl~u,
p~[ohnn~n~ p~obun~cn~
Exper~nent 133 ' 17 202 ' 13
lhoory(VceJ~c0.7) 130~ ~phe~x 132 ~nf.cyl~dbr.247-sph~re;2~6- 0f.cyl~ter
As can be seen from Table 2, exy~ ;.n~l~t~lly ~--e~ ~.ed and ll~e~lically pre ~ te~1
values of norrnal myocardial ~ Ance reasonably agree, particularly at microwave
~uell~.es ~- L~Ullg a cellular volume fraction of 0.7 for bo~ spherical and cylindrical
mo~l~lin~. An h~ of myocardial resistance after 2 hours LAD occlusion i8
s~lmm~rized in Table 3, comparing mea6ured values at high and low fI'eq~ 'i"'' wil~
those predicted by ~is model.
1 Ibc c~a~ F~jn~ Li~ resi~a~sçaflbr 2 ho ~ ~A D ~ y~.
~Ip 10~]~PL.~ ~]
Expenn~ent 12 * 9 42 ~ 21
Theory (~Yc~O.lS~K) 19- ~ht~; 18- inf.cylindcr 65~ sphert; 62- ~nf.cylinder
As can be seen from Table 3, ~is myocardial cell model gives a reasonable explanation
of observed changes in the s~e~L .Im of myocardial resi~tance in acute ischemia based
on the volume f.raction hypothesis. As fu1 ll..l di~tc~ se~3 below, -- ...~ were
CA 02260120 lg99-ol-OB
WO 98/01069 PCT/US97/11787
loli..ed for myocardial dielectric 1'-'~~ lies on four 3 week chronic myocardial
i"far~lion cases which resulted in an ob~ dec~ase In myocardial resisffvity of
about 30% and 10% for ficq~ % lower and higher than cell membrane relaxation
fi~ue~lcy ~e~Lv~ly RecG~,..;~;..I;, that the amount of myocybes in a chronic
aneu~ n is very small as cG.,~ared with collagen, and ~ minf~ ~at the myocardial
cPIl~ r volume fraction de~ eee down to 0.2 in an Ql~u~ l In this case ~he
ll~eo.eUcal c ~ ffon gives the following values of r~c;cl~ s
20~0~nt40U~--66% forsphereand 4DLr~~ 68~S forcylinder ~inally,
this myocar~ nl cell model gives reasonable qualitative explanation not only for the
~u" of nonnal myocardial I ~A.~re but also for observed ~ ;,es in ~he
~LI ~. of myocardial re~ist~nre in acute i~chem~a and chronic inf_rction ba6ed on the
volume frac'don Ly~olllesis.
Thi8 ~eory reasonably predic~ the normal myocardial bulk r~sislA,~ce.
E~.~l;...~..t~lly mPs~ ed values of bulk l~yocard:ial l~.slivily and E' in two ~lil~~l~nl
~,pe~ ranges can be ,n~.~ d by the model. It can be done in such a way that the
model ~ara~ (such as intracellular, extracellular and membrane resishnce,
cellular volu~l~e fraction and cellular capari~An~e) can be lLeo~Lcally recollstl ~Icted
from ex~l;.~ lly ~A ~ 2d buLk ~ ocdrdial resistivity and ~ c
3. Review of Caninee~
A study of c~nin~ was ~t lf~.l,.c.l using a coaxial probe m~tho~l of
m~ ~ng myocardial ro~ia~n~e based on the m~~ ~,.t of tissue dielectric
.o~. ~s, and ~onsll ~Iction from ~at data. The probe ufflized i8 located on ~e
39
CA 02260120 1999-01-05
WO 98/01069 PCT/US97/11787
surface of the epicardium and is used to measure the dielectric properties of the
myocardium. It is also illl~JUl l~u-t from the tomographic imAging perspective of this
invention that the dielectric properties measured by this method, and the l'ecOI~Sll ucted
myocardial r~ .r~, are ~ul~lllially the same as can be recol~LI ucted by tomography.
In both cases the basis for the del~.~lination of the dielectric ~ro~,e,lies is the
interaction of an extérnal electromagnetic field with tissue, and the mf~Acltrement of a
scattered (reflected) electromagnetic filed. Therefore, experimental data received by the
probe method can be directly utilized for inl~.~.eling tomographic data. The
application of experimf~ntAI data obtained by the methods of invasive probes delving
into the myocardium is not so readily useful.
This canine study focused on changes of the myocardial E' and resistance
at frequency spectra lower and higher than the cell membrane relaxation frequency.
The reason for this is a principally different cullent flow pattern through and/or
around cells at freqllenries lower and higher than the relaxation frequency of the cell
membrane. The real part E' of complex dielectric permittivity for high frequency is
dele~ ,ed as measured at a frequency of 0.2 GHz.
~ nimAl~ used in the study were part of an Institutional Animal Care and
Use Coll~uLl~e approved resea- l- protocol and cared for under NIH guidelines for
laboratory research. Four canines underwent total left anterior descending coronary
artery (LAD) occlusion for two hours. First, the whole studied s~e~ ll ~l of myocardial
dielectric properties (in this instance from 0.1 MHz up to 6.0 MHz) was measured.
After 15 lllillul~s of l,Acr~ e dielectric Illeasur~lllents (from 0.2 to 6.0 MHz), local
myocardial temye, dluç~ and dielectric t>ro~l lies were measured irnmediately after
CA 02260l20 l999-0l-05
WO 98/01069 PCT/US97/11787
occlusion, and following 2 hours of blood flow arrest. At the end of the 2 hour
occlusion whole s~e~ measurements were repeated.
The effect of chronic myocardial il~lLlion on the myocardial dielectric
~l'O~J~J lies was studied in four c~nines 3 weeks after myocardial i~ lion. The same
anestheffc and surgical protocol was followed as in the acute expe, ;~ L~.
At high frequencies (from 0.2 GHz to 6.0 GHz) dielectric properffes were
measured with the aid of a Hewlett-Packard network analyzer (HP model 8753C ). At
low frequencies (from 50kHz to 2 MHz) dielectric pl'U~ Lies were measured with the
help of a specially m~nllf~tured device for complex impedance measurements, which
is part of the above invention for electrical impedance tomography.
All values are ek~l~ssed as mean + one standard deviation. Data was
analyzed using Sldlglaphics version 4.0/T-test software.
The contributions of extracellular, intracellular and membrane resistances
to measured bulk myocardial l~i;,livily are quite dirl~ie"t at frequencies lower and
higher than a cell relaxation frequency. It was ~ecl~d that changes in myocardial
dielectric ~ro~, Lies in acute and chronic il~ lion would also be different. Changes of
myocardial resistivity in acute and chronic infarction are sllmm~rized for frequencies
lower (Fig. 22) and higher (Fig. 23) than a cell membrane relaxation frequency.
At high frequencies a cell membrane is essentially "invisible" and the
recol,DL. ~Icted ion conductivity will reflect both intracellular and extracellular
conductivities with a certain ratio influenced mostly by the cellular volume fraction. At
lower frequencies the measured resistance will mostly reflect ion conductivity
CA 02260120 l999-01-0~
WO 98/01069 PCT/US97/11787
properties of the extracellular space, ~ ally because of a relatively low membrane
conductivity. As expected, changes at low and high frequencies are in the same
direction but differ in magnitude. In acute ischemia, myocardial resi~livily signifir~ntly
(Sign. Lev. 0.02 and 0.01) increased in both frequencies up to about 4'~% and 14%
respectively for low and high frequencies. Three weeks chronic myocardial il~ lion
causes a decrease of bulk resistance to about 30% and 10% for low and high
frequencies.
Observed changes in myocardial resistivity can be explained on the basis
of a cellular volurne fraction hypothesis. It is well known that myocardial r~ict~n~ e
increases in acute ischemia. In these experiments, an almost insldl~ eous increase in
bulk myocardial resistance after a coronary flow arrest was observed. Prior researchers
showed that arrest of coronary flow resulted in an almost imme~ te increase in
extracellular resistance, but that it was due likely to a decrease in intravascular
volume. Based on that hypothesis the observed changes of myocardial resisldllce can be
understood. Indeed, in the case of low frequency measurements, by the probe method
used by the inventors, bulk myocardial resistance mostly reflects an extracellular
re~islivily, while much higher changes were observed when compared with the case of
high frequency, where measured bulk myocardial resistance reflects both extracellular
and intracellular r~ .livities in about the same order. Observed changes in myocardial
resistivity in 3 weeks chronic myocardial il~ lion can be explained as a decrease in
cellular volume fraction.
In both acute and chronic myocardial infa~:lion E' decreases in low
frequency (Fig. 24). The magrlitude of E' decrease was much higher in the chronic case-
CA 02260120 1999-01-05
W O 98/01069 PCTrUS97/11787
up to 52%. The changes of E' at high frequencies are presented in Fig. 25. In acute
i~ h~ high frequency E' decreases in dirr~rent magnitude and dynamic at ~lirre~ t
frequencies. In chronic i,~l~:lion high frequency E' increases.
The inventors hy~olhPs~ that ol~s~ d changes of E' at low frequency
reflect the myocardial cell membrane dilution. At high frequencies observed changes of
E' reflect complexity of events including cell membrane dilution, changes in tissue free
and bound water composition, and ~J. ols~ill restructuring. This e,c~e~ ental data
proves that acute and chronic myocardial infarcffon causes signif~ Ant changes of
myocardial dielectric ~ro~. lies at a cell membrane relaxation spectrum. The observed
changes in myocardial dielectric ~ro~ lies reflect a wide s~e~ ll ulll of biophysical
events. The need to assess these changes in a real time multiple frequency envirol~l,~nl
is critical to enable use of such valuable information.
Additional ex~eli~"ental evidence of these phenomena are shown in the
following Figures. Figure 26 shows the changes of myocardium dielectric ~loy~l lies
followed by the LAD occlusion-le~lrusion. In this figure, the tissue was assumed
normal at time 0, and then merely i~rhPmied rather than permanently damaged. Figure
27 illustrates, for 10 c~ninP~ experiencing decreased blood flow, the sensitivity of
dielectric properties to measulell~ent at dir~l~l~t frequencies. This also shows the low
frequency sensitivity of E". Figure 28 shows a pre-occlusion (control) and occlusion
relative changes of E' at time 0 across multiple frequencies. Fig. 29 is similar conditions
to that of Fig. 28 but for E".
In Fig. 30, the changes of myocar-liu~ll dielectric prO~I lies for E" are
shown following a 100% occlusion, detected by a 0.2 GHz frequency. This illuslrales the
CA 02260120 1999-01-05
WO 98/01069 PCT/US97/11787
dramatic and apparently irreversible changes occ~~ g at the cellular level. This type
of detection is not available in a real time basis by other techniques, such as by nuclear
magnetic resonance. Fig. 31 also shows the myocardium ~.O~I lies following a 100%
LAD occlusion, but for E' rather than E". As shown, the most dramatic changes are
within the 30~0 ~ s of the occlusion, which is also the ap~lvxilnate period during
which most changes develop from reversible to i~ ~ ~vel ;,ible. For example, in looking at
the same E' but with a frequency of 6.0 GHz as shown in Fig. 32, one can see the
changes as not relL~ lg to a baseline level, i.e. irreversible change having occurred in
the myocardium. Finally, in Fig. 33, the E" value at 6.0 GHz is observed as almost
relLIllullg to baseline over time. The ability to distinguish and predict the onset of
dirr~ ,t types of myocardial change through this and related modeling te~hni~lues is
one of the advantageous outcomes of this invention.
In building the models for acculale biophysical reco~ ction, it is
helpful to analyze the normalized differences between ischemied and normal
myocardium (Figs. 34-35), scar and normal myocardium (Fig. 36), and markers to
indicate whether fibrillation or ischemic injury is occurring (Fig. 37). In this manner the
inventors are making it possible to create certain detection algo.;lluns given certain
patterns or gradients which aid the physician in a choice of possible treatment paths.
The invention is also useful in localizing and displaying an illrdl~ led region which may
cause dangerous arrhythmia. Indeed, as shown in Fig. 38, the inventors' multiple
frequency tissue ~ ents of dielectric pl opel lies allow reco~lsll .lction for E' and E"
which erÇe~;lively models various cellular phenomena. This greatly facilitates the
del~.lnillation of time since a tissue event, and the possible susceptibility of that tissue
CA 02260120 1999-01-0~
WO 98/01069 PCT/US97/11787
to further danger. For example, this helps isolate the region of scar versus ischemic
tissue to enh~n~e predictability of tissue electrical viability.
4. Spatial Irnprov~menh and Reconstruction Algo~illu,ls
The system and its various capabilities described above has been useful in
imaging both phantom objects as well as actual tissue. Such tissue has included beating
and non-beating heart reconstructions as shown in Figs. 39~1. The spatial and contrast
resolution experienced with the present system is influenced by the number of
antennas, the mathematical reconstruction al~;olillu,ls, and 2-D diffraction model
utilization for 3-D scattering objects. Additional factors which influence the image
quality include accuracy of the scattered field measurements, dielectric contrast, and
various others. While various improvements can be noted, for example as shown in the
iterations of a gel phantom at Figs. 4'~7, the overall improvements of this system
involve a combination of multiple high and low frequencies, exceptional biophysical
modeling and reconstruction, and system processing gains.
What is claimed is: -
1. A method of detecting the onset of biological tissue disease comprising themethod of:
a) designating a target tissue area for electromagnetic irradiation;