Note: Descriptions are shown in the official language in which they were submitted.
CA 02263850 1999-02-19
WO 98/08066 PCT/US96/13530
- 1 -
ON-LINE QUANTITATIVE ANALYSIS OF CHEMICAL
COMPOSITIONS BY RAMAN SPECTROMETRY
FIELD OF THE INVENTION
This invention relates to Raman spectrometric
analysis, and more particularly a method for
quantitatively monitoring in situ by Raman spectrometry
constituents of a chemical composition.
BACKGROUND OF THE INVENTION
The use of spectrometry in analytical laboratories
for measuring physical and analytical properties of
materials is a well established art. Kaman spectrometry
is one such technique that can provide qualitative and
quantitative information about composition andior
molecular structure of chemical substances. When
incident radiation interacts with matter it may undergo
a process called scattering. Scattered radiation may be
elastic, in which the incident wavelength is unchanged
in the scattered radiation, or inelastic, in which the
scattered radiation has different wavelengths than the
incident radiation. In one form of inelastic radiation
scatter, referred to as Kaman scattering, incident
photons are scattered with either a gain or loss of
energy. The energy difference between the scattered and
incident radiation is commonly referred to as the Kaman
shift. The resultant Kaman shift spectrum provides the
energy of various molecular vibrational motions and
conveys chemical and molecular information regarding the
matter studied. The Kaman scattering effect is
extremely weak; typically a few Kaman scattered photons
exist among millions of elastically scattered photons.
CA 02263850 1999-02-19
WO 98/08066 PCT/US96/13530
- 2 -
Determining the constitution of a chemical
composition or monitoring the progress of a chemical
reaction is frequently carried out with materials
situated in inhospitable environments. Analyses of
process streams under conditions of high temperature
ancLor pressure or in the presence of corrosive
substances or powerful solvents are often required. It
may be necessary, for example, to follow the progress of
a reaction forming polymers from lower molecular weight
reactants in a high temperature continuous or batch
process. Similarly, it may be desirable to monitor as a
function of time the composition of batch reactions or
volatile materials at a distillation head. Spectrophoto-
metric apparatus such as a spectrograph and a radiation
source can be situated in a location remote from
materials such as polymer-forming compositions and
distillation mixtures that are to be analyzed in situ,
the sampling site being connected to the apparatus by
radiation conduits comprising optical fibers.
Of course, the method of the present invention is
not limited to use only in harsh environments
characterized by, for example, higher temperatures.
Quantitative in situ Raman spectrometric measurements in
accordance with the invention may be carried out,
assuming the availability of suitable optical probes, in
diverse environments, including living organisms.
A polyester is a synthetic resin that contains
ester linkages in the main polymer chain. Commercially
valuable polyesters, useful for clothing fibers,
container packaging, etc., are manufactured from various
reactants. For example, they may be produced by
esterification of dicarboxylic acids with diols,
transesterification of dicarboxylic esters with diols,
or self-condensation of hydroxycarboxylic acids.
CA 02263850 1999-02-19
WO 98/08066 PCT/US96/13530
- 3 -
Achieving particular end-use properties of a
polyester requires vigorous control of the component
ratios or composition of the materials in the reaction
vessel during manufacture. Small changes in initial
composition can dramatically affect the usefulness of
the final polyester product. Control of the conversion
of the ester or acid end groups, depending on the use of
diesters or diacids, to the reactive hydroxy end groups
is also required to ensure reliable finished polyester
product characteristics. Low conversion during the
first stage reaction limits the reactivity during the
polycondensation reaction and adversely affects the
ultimate end use properties of the polyester material.
For this reason, it is extremely important to know the
conversion or extent of the first stage reaction. Other
critical composition control parameters include the
amounts of each diacid and diol moiety, the ratio of
total diols to total diacids andior diesters in the
reaction vessel, and the degree of polymerization,
molecular weight, or size of the polymer chain.
During manufacturing, the chemical constitution of
materials in the reaction vessels may be determined by
removing a small sample for analytical testing in a
remote laboratory. Commonly used analytical methods may
be used to provide an indication of the extent of the
first stage reaction, molar amounts of reactants and
products in the mixture, and the extent of reaction.
Laboratory methods commonly used to obtain compositional
information of the extracted samples include nuclear
3o magnetic resonance (NNgt) spectrometry, gas
chromatography (GC), and liquid chromatography (LC).
These methods require the extracted sample to be
dissolved and in some cases derivatized. NNDt methods
provide reliable information; however, the required
CA 02263850 1999-02-19
WO 98/08066 PCT/US96/13530
- 4 -
instrumentation is expensive and complex and the sample
must be properly prepared prior to measurement.
PROBhEMS TO HE SOLVED BY THE INVFSNTION
Repetitious sampling and analytical measurements
applied to a chemical production process present several
significant potential problems.
First, there is the inherent danger of removing a
sample from a hot process stream, especially when the
stream is viscous as in a polymer-forming process.
Large insulated valves must be opened to allow material
to flow into a small sample container. It is not
uncommon for sampling ports in polymer lines to become
partially plugged, causing the hot material to be
unpredictably expelled from the opening.
Second, the procedure of removing a sample may
alter the sample constitution. For example, the first
stage reaction in one common polyester manufacturing
process is usually performed with an excess of ethylene
glycol (EG) in the reactor. EG is more volatile than
the oligomeric material and, when removed from the
process, may preferentially flash from the sample,
resulting in a non-representative sample. Furthermore,
as the sampled material is viscous, it clings to the
sample port valve, which may cause the current sample to
be intermixed with remnants of previously acquired
samples.
Third, the sampling and analysis procedure is
time-consuming. Many thousands of pounds of material
can be produced in the time required to remove, prepare,
and analyze a sample. The analytical data obtained from
the sample is therefore of limited value for proactive
process control.
CA 02263850 1999-02-19
WO 98/08066 PCT/US96/13530
- 5 -
Finally, because of the difficulties and cost
associated with the hazards of sample removal,
analytical sampling is typically infrequent. With
minimal analytical data points, it is difficult to gain
a statistically valid understanding of process
variations or to make proper control adjustments to the
process.
A preferred analysis method would monitor the
material as it is being produced. Such a method would
reduce the need to remove samples from the production
environment, diminish the safety concerns, and
facilitate more frequent and faster measurements.
There are, however, challenging obstacles that
prevent most analytical techniques from providing in
situ, on-line chemical constitution information in a
process environment. First, the analytical method must
be capable of accurately determining the desired
properties with sufficient precision. Second, the
analytical instrument must either be capable of
withstanding the physical environment of a processing
area or must be capable of sensing the desired
composition properties from a remote location. Third,
the interface of the instrumentation with the process
must be able to survive the harsh pressure and
temperature environment found inside the chemical
process line. Fourth, turbidity, bubbles, and other
common processing phenomena must not disturb the
analytical measurements. All of these obstacles are
overcome by the method of the present invention.
SUI~IARY OF TEE INYBNTION
A method for quantitatively monitoring in situ by
Raman spectrometry one or more selected constituents of
a chemical composition comprises: simultaneously
CA 02263850 1999-02-19
WO 98/08066 PCT/US96/13530
- 6 -
irradiating with a substantially monochromatic radiation
source a reference material and a chemical composition
containing one or more constituents, the radiation being
transmitted from the source to the chemical composition
by an excitation conduit connecting the source to an
optical probe that interfaces with the composition;
simultaneously acquiring at more than one wavelength
convolved Raman spectra of the reference material and
the chemical composition by means of a spectrograph,
which is connected to the optical probe by a collection
conduit; choosing the standard Raman spectrum of the
reference material; determining the convolution function
of the convolved spectra from the convolved Raman
spectrum and the standard Raman spectrum of the
reference material; applying the convolution function to
adjust the convolved Raman spectrum of the chemical
composition to produce the standard Raman spectrum of
the composition; and applying predetermined calibration
means to the standard Raman spectrum of the chemical
composition, by which the chemical constitution of the
composition at the time of acquisition of the convolved
Raman spectra can be ascertained.
ADVANTAGEOUS EFFECTS OF THE INVENTION
The method of the present invention is a
significant improvement over traditional analytical
methods, in that more reliable measurements are obtained
in less time and without the difficulties of
continuously removing samples. The information obtained
may be used to devise feed-back or feed-forward control
strategies to improve product quality, reduce waste,
improve process throughputs, and lessen the hazards
associated with extraction of samples from a chemical
manufacturing process.
CA 02263850 2002-07-03
W0.98108066 PC"TIUS96I13530
BRIEF DESCRIPTION OF THE DRANINGS
Figure 1 is a Raman spectrum of a poTy(ethylene
terephthalate) intermediate.
Figure 2 is a schematic diagram of a~Raman
spectrometric system.
Figure.3 is a correlation phot for determining
methyl ends in a polymer-forming composition. .
Figure 4 is a graph summari2ing the kinetics of the
3 Q ' react i an ' of ~diatethpl ter~ht~ra sate with. wthyi en a giyc o 1.
Figure ,5 . is, a graph comparing Raman and N'N~
spectrometric analytical~data for a polyester production
line.
DETAILED DESCRIPTION OF T$E INVENTION
Commercially useful chemicals such as polyesters,
for example, are typically manufaci:.ured by large scale
continuous processes at elevated temperatures. These
2o processes for the preparation of polyesters entail
esterif ication reactions such as the esterification of
dicarboxylic acids or the transest~erification of
dicarboxylic esters with diol compounds.
A diol compound contains two l:~ydroxyl .
functionalities. A great variety i~f diols can be used
in the manufacture of polyesters, including, for
example, ethylene glycol (EG)1; die~thylene glycol,
triethylene glycol, polyethylene glycol,
,,polytetramethylene glycol, polypropylene glycol,
3o polyisopropylerte glycol-, 1,4-butanediol, neopentyl _
glycol, bis-(4-hydroxymethylcyclohexylmethyl)
terephthalate, (2-hydroxyethyl)(4-
hydroxymethylcyclohexylmethyl) terephthaTate, and 1,4-
cyclohexanedimethanol (CHDM).
A dicarboxylic acid contains twa carboxylic acid
moieties. Representative dicarbo~s:ylic acids useful in the
manufacture of polyester materials include:
CA 02263850 2002-07-03
terephthalic acid (TPA), isophthalic acid, naphthalene-
dicarboxylic acid, 1,4-cyclohexanedicarboxylic acid
(CHDA), adipic acid, and various aliphatic dicarboxylic
acids.
A dicarboxylic ester. contains two ester functional
groups. Examples of useful diesters include the
esterified derivatives of any of the d.iacids just
mentioned. Examples of dicarboxylic esters include: (2-
hydroxyethyl)-(4-hydroxymethylcyclohex:ylmethyl)
terephthalate, dimethyl 1,4-naphtalene:dicarboxylate,
dimethyl 2,6-naphta=Lenedicarboxylate, dimethyl adipate,
and bis(4-hydroxymethylcyclohexylmethyl) terephthalate.
An.important diester that i,s commonly used in the
manufacture of polyester mate-vials is dim-ethyl
terephthalate (DMT) .
Poly(ethylene.terephthalate), PE~C, Xs an example of
a commercially useful polyester. Thia ~o~lymer is
typically manufactured from either DM'T or TPA and EG,
generally in two stages, as described-in Odian,
Principles of Polymerization, 3rd ed.,, Wiley, New York,
1991, pages 97 to 100, and Billmeyer, Textbook of
~ol~rmer Science, 3rd, ed., Wiley, New York, 1984 ,
pages 442 to 445. In the first stage" excess EG reacts
with either DMT or TPA to form the ini:ermediate
bis(2-hydroxyethyl)terephthalate .(BHE'.C), whose Raman
spectrum is depicted in.Figure 1.' During this process,
generally carried ~ut at temperatures of 15~-230°C,
methanol or water, depending on the uae of DMT or TPA,
respectively, is produced and continuously removed via
distillation.. During the second stag,a, referred tows
the polycondensation reaction, the maiterial is r~eated to
temperatures of. 27~-3t10°C. Polymerization proceeds
through the removal of EG and, is typically facilitated
by use.of a partial. vacuum j0.0133 to 0.133 kPa (0.1 t.o
l.torr)~. The polymerization process increases the
CA 02263850 2002-07-03
_8a_
molecular weight anti size of the molecule, thereby
altering many~chemical- and,physical properties.
. The properties~of polyester materials can be
modified by incorporation of different dio~l, diester, or
diacid components in the polymer structure. For
example, CHDM can by substituted far. E~~= in the first
stage reaction. of. PET to,form a distinct polyester which
CA 02263850 1999-02-19
WO 98/08066 PCT/US96/13530
- g -
has properties and end uses that differ from the
EG-based product. Further, one can employ various
mixtures of diols, diesters, diacids, or combinations
thereof, to achieve additional polyester materials with
unique properties. For example, the diols CHDM and EG
may be blended in a reaction with DMT to form a
glycol-modified PET. Many such modified polyesters are
described in the patent literature, including U.S.
Patent Nos. 4,259,478, 3,772,405, and 3,033,822.
A typical Raman spectrometer is composed of a
radiation source, a means of transmitting the source
radiation to a sample, a means of collecting the
scattered radiation from the sample, a means of energy
separation, or dispersion, of the scattered radiation,
and a means of detecting the radiation.
Numerous radiation sources are capable of
generating Raman scatter from a material. For
analytical measurement, these sources need to emit
monochromatic radiation of high intensity. In this
regard, lasers are well suited radiation sources. U.S.
Patent No. 3,556,659 describes a Raman spectrometer in
which a sample contained in a tube is irradiated by
radiation from a laser along the axis of the tube.
There are various classes of laser radiation
sources, including: gas lasers, such as helium-neon,
nitrogen, argon ion and krypton ion; solid state lasers,
such as ruby lasers and Nd:YAG (neodymium:yttrium-
aluminum-garnet) lasers; dye lasers; chemical lasers;
and solid state lasers, such as single mode and
multi-mode diode lasers.
Of these, gas lasers are generally accepted as
especially suitable for dispersive Raman spectrometry
because of their high degree of wavelength stability.
Unfortunately, they are often expensive, require
extensive maintenance, or have low output power. The
CA 02263850 1999-02-19
WO 98/08066 PCT/US96/I3530
- 10 -
use of semiconductor diode lasers in Roman spectrometry,
which can provide large power output in a compact,
rugged device but which may exhibit inherent
instabilities in their output properties, are described
in Wang and McCreery, Anal. Chem., 1990, Vol. 62,
pp. 2647-2651.
Because the Roman scattering process relates to a
shift from an incident wavelength, different lasers
provide spectra in different wavelength regions.
However, the Roman shift spectra in those regions are
similar, and essentially the same structural information
can be obtained through the use of different incident
laser wavelengths.
Fluorescence is a process by which absorbed
radiation induces broad emission, characteristic of the
molecular structure. The induced fluorescence signal,
if observed, is typically many orders of magnitude
larger than the Roman signal and in some cases
completely masks the Roman shift spectrum.' Thus, it is
desirable to select an incident wavelength that
minimizes fluorescence emission processes.
A well known method to reduce fluorescence
background problems is to use lasers which generate red
or near infrared radiation, with wavelengths from about
660 manometers to 1100 manometers, as described in
D.B. Chase, J. Am. Chem. Soc., 1986, Vol. 108,
pp. 7485-7488. Such a method is useful because the
fluorescence emission profile is independent of incident
wavelength and the Roman process is a shift from the
incident wavelength. Typical radiation sources
operating in this region include krypton ion gas lasers,
single mode diode lasers, multi-mode diode lasers, and
Nd:YAG lasers.
Of the numerous radiation sources available, lasers
are highly preferred because of their powerful,
CA 02263850 1999-02-19
WO 98/08066 PCT/US96/13530
- 11 -
monochromatic radiation characteristics. Of the various
types of lasers that are commercially available, diode
lasers are preferred because of the minimal maintenance
required over their extended useful lifetimes. This
advantage is very desirable in a component for process
analyzer instrumentation. Further, it is highly
preferred to utilize a laser which is pre-coupled to a
fiber optic cable. Fiber coupled diode laser devices,
referred to as pigtailed diode lasers, are commercially
available.
A pigtailed diode laser provides several
substantial advantages over other laser sources. First,
they are already coupled to a fiber optic cable, which
eliminates complex optical alignment mechanisms that can
become unfocused and cause loss of signal. This
simplicity allows for easy removal and replacement when
necessary. In addition, a diode laser typically has a
long lifetime of usefulness, thus requiring only minimal
maintenance. Furthermore, a diode laser is temperature
tunable over a small wavelength range, which provides a
compensation means for any slight wavelength drift that
may occur. Finally, diode lasers are available with
high power, making possible a greater signal and,
consequently, a shorter measurement time. A concern
with higher powered diode lasers is that they operate in
what is called "multimode", wherein many lasing modes
are all simultaneously active. These individual modes
are unstable with respect to one another and can render
the device useless for precise quantitative analytical
measurements. Instabilities in diode lasers may be
reduced but not completely eliminated through proper
control of temperature and unwanted emissions, as
described in Carrabba et al., "Compact Raman
Instrumentation for Process and Environmental
Monitoring," SPIE, 1991, Vol 1434, Environmental Sensing
CA 02263850 1999-02-19
WO 98108066 PCT/US96/13530
- 12 -
and Combustion Diagnostics, pp. 127-134. For the
control of undesirable laser emissions, Carrabba et al.
describes holographic optical edge filters which have
very high optical density at the laser wavelength.
Without controls such as those described, diode
lasers are unstable and are thus generally regarded as
of little use for Raman spectroscopic investigations.
Furthermore, the wavelength of any diode laser device
will gradually shift as the device ages. A diode laser
device, though stable for short times, is characterized
by long-term instabilities which produce a slow drift,
resulting in reduced instrument reliability.
Diode lasers capable of performing at various
incident wavelengths are commercially available. It is
preferred to utilize a laser that has a wavelength
between about 700 nm and 900 nm. Below 700 nm certain
interfering background processes such as fluorescence
are more prevalent than at higher wavelengths. However,
wavelengths beyond 900 nm adversely affect the detection
capability of currently available multichannel detection
systems.
In a preferred embodiment of the method of the
invention, a Raman spectrometry apparatus that includes
a high powered, pigtailed, multimode diode laser that
emits radiation between about 780 nm and 830 nm is
employed. However, the method described in this
invention is not limited to such instruments.
The large ratio of elastically to Raman scattered
photons requires an efficient method of photon
separation. Traditionally, this has been accomplished
with double or triple spectrograph systems, constructed
with two or three dispersive elements, respectively.
Other radiation filtering devices can sufficiently
reject the elastically scattered photons to permit the
use of smaller, more efficient single dispersive element
CA 02263850 1999-02-19
WO 98/08066 PCT/US96/13530
- 13 -
spectrograph devices; for example, holographic Bragg
diffraction filters are described in Carrabba et al.,
Appl. Spec., 1990, Vol. 44, pp. 1558-1561.
The detector element is highly important for proper
performance of the Raman instrument and must be capable
of discerning extremely low levels of radiation.
Traditional scanning monochromator systems have used
photomultiplier tubes that are capable of observing low
photon signals. Newer instruments employ array
detectors such as photodiode arrays (PDA) or charge
coupled devices (CCD). Array detectors consist of
multiple optical elements that can simultaneously
observe a region of the spectrum up to the entire Raman
spectrum. CCD detectors are multi-dimensional and able
to observe multiple Raman spectra at more than one
wavelength simultaneously, as described in Vess et al.,
SPIE, 1992, Vol. 1637, pp. 118-125, and in Angel et al.,
SPIE, 1991, Vol. 1587, pp. 219-231.
The previously mentioned paper by Wang and McCreery
describes the use of a charge coupled device together
with a near-infrared diode laser in a Raman spectrometer
of high sensitivity. Also, Newman et al., Appl. Spec.,
1992, Vol. 46, pp. 262-265 describes the use of a CCD
and diode laser with a flat field imaging spectrograph
provided with a fiber optic interface with the sample.
Raman spectrometry instrumentation that combines a
single dispersive grating spectrograph with a CCD
detector, single-mode diode laser, fiber optic cables, a
fiber optic probe, and a suitable computer is useful for
3o rapid analytical determinations. However, mechanical
stability of the spectrograph and detector system and
other optical interfaces as well as the aforementioned
diode laser instabilities limit the quantitative
CA 02263850 1999-02-19
WO 98/08066 PCT/US96/13530
- 14 -
capability of the instrument. Fourier Transform (FTy
Raman spectrometry has been proposed for quantitative
chemical analysis. Because of instrumental variations,
however, reproducibility is generally limited to, at
best, about one percent, as described in Seasholtz et
al., Appl. Spec., 1989, Vol. 43, pp. 1067-1072.
Traditional laboratory Raman instruments use a
series of lenses, mirrors, and other optics to transmit
and focus the source radiation to the sample. Advances
in fiber optic cables, as described, for example, in
Allred and McCreery, Appl. Spec., 1990, Vol. 44,
pp. 1229-1231, and Schwab and McCreery, Anal. Chem.,
1984, Vol. 56, pp. 2199-2204 provide a simplified means
to direct the radiation towards the sample. The
simplicity, flexibility, and throughput efficiency of
fiber optic cables make the prospect of remote sensing
viable.
The fused silica core of the fiber optic cable,
though a weak Raman scatterer, can contribute an
interfering background signal when long fiber lengths
are used, as discussed in U.S. Patent No. 5,112,127;
Vess et al., SPIE, 1992, Vol. 1637, pp. 118-125; Schoen
et al., A~pl. Opt., 1992, Vol. 36, pp. 7707-7715; and
Schoen et al., SPI~, 1993, Vol. 1857, pp. 116-125. The
fundamental technique used to overcome this difficulty
employs optical filters positioned near the sample.
These filters remove background-inducing radiation
before interferences are generated.
Fiber optic probes are typically used in
conjunction with fiber optics to provide a means for
transmitting radiation towards the sample and collecting
the scattered radiation, as described, for example, in
U.S. Patent No. 4,573,761. Such probes may be
constructed with combinations of fiber optics, lenses,
ancLor mirrors. In one construction, two or more fiber
CA 02263850 1999-02-19
WO 98/08066 PCT/US96/I3530
- 15 -
optics are secured closely together on the sample end.
One or more of these fiber optics is used to transmit
the radiation into the sample, and one or more
additional fiber optics is used to collect and transmit
the scattered radiation towards the detector.
After the scattered radiation has been collected
and transmitted, it is separated using a dispersive
element. The dispersion element, which is typically
included along with focusing and collimating optical
elements in a spectrograph, facilitates the separation
of various energy levels of the scattered radiation from
one another. Frequently, two or more dispersion
elements are used to reject stray light more completely
and increase resolution. However, there is a
substantial advantage in using smaller, more efficient,
single grating spectrographs with proper optical
filtering, as described in the aforementioned papers of
Allred and McCreery and Wang and McCreery, and also in
Carrabba et al., SPIE, 1991, Vol. 1434, pp.~127-134.
The large signal throughput increases thereby attained
provide a means for extremely sensitive and reproducible
measurements.
Raman spectrometry as the basis for an on-line
analytical method has been discussed in several
references. For example, Garrison, SPIE, 1992,
Vol. 1681, pp. 291-293, describes the application of a
FT-Raman system for monitoring a composition in a
distillation column wherein a small stream is removed
from a distillation column tray into a temperature
controlled sample chamber. A Raman probe is inserted
into this environment for data acquisition; the method
has a relative precision of about two percent. The
aforementioned paper by Seasholtz et al. describes a
FT-Raman laboratory method of limited quantitative
capability to develop a calibration curve for petroleum
CA 02263850 1999-02-19
WO 98/08066 PCT/US96/13530
- 16 -
fuel products. James, PCT Int. Appl. W087/06011 and
Nguyen et al., French Patent No. 2,571,144 describe
Raman radiation monitoring devices and methods for in
situ, on-line measuring of analytical properties of a
chemical or a combination of chemical components from a
remote location; however there is no indication of the
precision attainable by the described methods.
The method of the present invention is particularly
useful for in situ monitoring of a polyester production
process. Analysis of polyesters by Raman spectrometry
has been known for some time; see, for example, Bulkin
et al., Macromolecules, 1987, Vol. 20, pp. 830-835;
Bower et al., Polymer, 1982, Vol. 23, pp. 645-649; Adar
et al., Polymer, 1985, Vol. 26, pp. 1935-1943; and
DeBlase et al., J. Polym. Sci., 1985, Vol. 23,
pp. 109-115. Typically, final product polyester
materials have been investigated by off-line laboratory
analyses to determine conformation, orientation, and
crystallinity properties. Dramatic changes in the
vibrational spectrum of the polymeric materials that
correspond to processing differences have been observed.
The conformation, orientation, and degree of
crystallinity all affect the final product properties
and usefulness for a specific application.
A typical Raman spectrum of a PET monomer sample is
shown in Figure 1. This spectrum is characterized by
various peaks which are indicative of specific
vibratianal movements in the molecule. For example the
peak located at about 1610 cm ~ is associated with a
symmetric expansion/relaxation of the terephthalate ring
system. This vibrational movement is commonly referred
to as a "ring breathing mode" (cf. Grasselli and Bulkin,
editors, "Analytical Raman Spectrometry," vol. 14 in
Chemical Analysis, 1991, Wiley, New York, pp. 223 to
252).
CA 02263850 1999-02-19
WO 98/08066 PCT/IJS96/13530
- 17 -
Vibrational movements of a molecule as measured in
a Raman spectrum are specific to the molecule's nature
and composition. The abundance of available structural
information makes Raman spectrometry a highly desirable
technique for elucidating the composition of polyesters
during their formation. How to accomplish such a task
in an on-line routine method is neither clear nor
obvious. The goal of continuously monitoring
polymer-forming compositions in the course of polyester
manufacture has been achieved in the present invention.
Thus, the compositional properties of any polyester,
whose starting materials may include diacids and diols,
diesters and diols, hydroxy carboxylic acids, hydroxy
carboxylate esters, or combinations thereof, can be
monitored during its synthesis in accordance with this
invention.
In a Raman spectral determination, the observed
signal will always be a convolution of the desired
signal and an instrumental response. In general,
instrumental responses broaden, shift, or otherwise
distort the desired signal. The method of the present
invention makes it possible to measure and compensate
for both long-term and short-term variations and
instabilities in the components of the Raman
spectrometry apparatus. This is achieved by a
referencing technique described in U.S. Patent
No. 5,455,673 that simultaneously acquires the convolved
spectra of a chemical sample in a reaction stream and a
reference material, where all spectra have been
subjected to the same instabilities.
The convolution process, though non-linear in an
observed spectrum, can be represented as a
multiplication in the time domain. FT techniques are
commonly used to accomplish the conversion to and from
the time domain. In the time domain, the deconvolution
CA 02263850 1999-02-19
WO 98/08066 PCTNS96/13530
- 18 -
process is a straightforward division, using complex
numbers (which consist of both a real and imaginary
component), of the observed signal by the instrumental
response function.
The detector continuously monitors the spectra of
both a sampled chemical composition and a suitable
reference material. The convolved spectrum of the
reference material, also referred to herein as the
convolved reference spectrum, consists of a spectral
fragment with known spectral characteristics convolved
with all random instabilities in the radiation source
andior mechanical instabilities in the instrument. The
convolved reference spectrum is convolved by the
apparatus in the same way as the convolved spectrum of
the sampled chemical composition, also referred to
herein as the convolved sample spectrum.
Suitable mathematical routines are also useful for
the practice of this invention. The collected spectra
are mathematically treated with a standardization
process that compensates for all but random detector
noise variability. In this process, the following
spectral information is important: the convolved sample
spectrum, the convolved reference spectrum, the standard
reference spectrum, the standard sample spectrum, and
the convolution function.
The convolved sample spectrum, S'(x), is a digital
representation of the Raman spectrum of the unknown
sample material, as obtained from the spectrograph
detector. This spectrum is influenced by variations
from both instrumental (laser andior mechanical)
instabilities and structural changes in the sample.
As described above, the convolved reference
spectrum, R'(x), contains a spectral fragment with known
shape characteristics convolved with all instrument
instabilities. This spectral fragment must be convolved
CA 02263850 1999-02-19
WO 98/08066 PCT/US96/13530
- 19 -
with the same convolution function as the convolved
sample spectrum.
The convolution function, c(x), which enables one
to compensate for the variations resulting from
radiation source variability ancLor instrument
mechanical instabilities, contains the information
necessary to transform a standard spectrum into a
convolved spectrum, and vice versa.
The standard reference spectrum, R(x), is a
selected spectrum that should be a true representation
of the underlying shape of the convolved reference
spectrum. The standard reference spectrum may be a
theoretical mathematical representation of the invariant
portion of the convolved reference spectrum; it may also
be a previously acquired convolved spectrum of the
reference material that has been adjusted or smoothed.
Preferably, it is a spectrum obtained by averaging a
multiplicity of previously acquired convolved spectra of
the reference material. It is desirable to "linearize'~
the collected spectra with respect to the abscissa; this
may be accomplished by various interpolation methods
such as those described in W.H. Press et al., Numerical
Recipes: The Art of Scientific Computina, 1986,
Cambridge University Press, pages 77-89. A cubic spline
interpolation described on pages 86-89 is particularly
useful for this purpose. A spectrum used to provide the
standard reference spectrum need not be obtained from
the same instrument as that used to acquire the
convolved spectra of the sample and the reference
material.
Preferably, after the spectra R'(x) and S'(x) have
been obtained, they can be transformed into the time
domain using a FT method as described in, for example,
Numerical Recipes The Art of Scientific Computing,
pp. 381-383 and 407-412. R(x) is also transformed into
CA 02263850 1999-02-19
WO 98/08066 PCT/US96/13530
- 20 -
the time domain and c(x) is determined by dividing the
FT of R(x) into the FT of R'(x). As the matrices for
the FT of R(x) and R'(x) include complex numbers, this
division must properly account for both the real and
imaginary components.
The calculated convolution function, c(x), contains
the necessary information to decode the variations and
instabilities of the instrument occurring during the
spectral acquisition. The FT of S'(x) is then divided
(again both matrices contain complex numbers) with c(x)
to result in the FT of S(x). By calculating the inverse
FT on this result, a standard sample spectrum, S(x),
which accurately represents the composition of the
sample, is obtained.
If desired, S(x) may be treated by procedures to
achieve curve smoothing or to obtain the spectral
derivatives, for example. These procedures may be
useful when the spectra are used for reproducibly
extracting quantitative compositional information.
Curve smoothing methods are described in A. Savitsky and
M.J.E. Golay, Anal. Chem., 1964, vol. 36, pp. 162?-1639.
The standard sample spectrum, S(x), that is
obtained in the method of the present invention is the
resultant spectrum of the sampled chemical composition
after all random instrument variations except random
detector noise have been removed. This spectrum will
vary according to chemical composition and thus enables
a precise quantitative analysis of the sample.
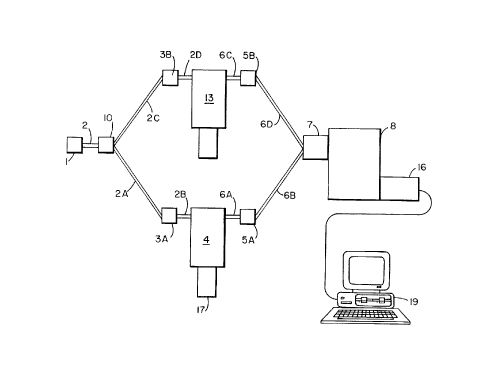
The typical Raman spectrometric system that is
schematically depicted in Figure 2 includes a radiation
source 1, an optical waveguide 2, a beam splitter 10,
means of transmitting the radiation to a remote sample
location comprising excitation conduits 2A and 2B and 2C
and 2D, radiation filters 3A and 38, optical probes 4
and 13, radiation filters 5A and 5B, collection
CA 02263850 1999-02-19
WO 98/08066 PCT/US96/13530
- 21 -
conduits 6A and 6B, a spectrograph interface 7, and a
spectrograph 8 comprising an optical dispersion element,
an array detector 16, and a computer 19 provided with
appropriate mathematical routines. This system enables
the simultaneous acquiring of the convolved spectra of a
sample 17 and a reference material 18. The system is
constructed from various components as described below.
In a preferred embodiment, the conduits 2A, 2B, 2C,
2D, 6A, 6B, 6C, and 6D, whereby radiation is transmitted
to and from the sample and the reference material,
comprise fiber optic cables. It is contemplated that a
variety of other light transmission guides could suffice
for this purpose, including combinations of optics such
as mirrors, lenses, or hollow light pipes. Fiber optics
that contain a fused silica core, doped fused silica
cladding, and a polyamide buffer are preferred, as they
provide the easiest and most efficient means of
transmitting radiation in the preferred diode laser
wavelength range.
As previously discussed, the use of fiber optics
over long distances has an associated technical
difficulty. Many of the methods previously described
are sufficient to allow the use of long fibers to remote
locations. A preferred method is one that is simple in
construction and provides an easy means by which it can
be inserted and replaced in the instrument.
In a preferred embodiment, the conduits further
comprise optical filters 3A, 3B, 5A, and 5B, each of
which may be situated between two small collimating
lenses. These optical filter devices, which are
optimized for maximum throughput, are connected to the
associated excitation and collection fiber optic cables.
Such optical filter devices are preferred because they
are small, compact, robust, and easily removed and
replaced. It is contemplated that other filtration
CA 02263850 2002-07-03
WO 98108066 PCTlUS96lI353U
- 22 -
means, described. in the literature andior commercially
available,~could serve the intended purpose of removal
of unwanted, scattered radiation. Iri accordance with
the present invention, thewincident radiation ~.s
typically passed through band pass filters 3A and 38
prior to entering the sample and reference material and
through refection filters 5A and 5B after collection.
The optical probes 4 and.l3.that provide. interfaces
with the sample matter l7 of the process stream and the
reference material 38 ritus~t possess the proper
characteristics for the satisfactory operation of the
method of the 'invention. At the process interface, the
probe provides both for.transmitti;ng the incident
radiation to the sample and collecting the scattered y
radiation from ~.t. It is critical that the interface be
stable under the operating conditions of the processing
line,; small changes at the interface can cause dramatic
losses in throughput efficiencies. Chemical process
conditions are often severe; for example, a polyester
processing line is typically operated at temperatures
between 150 and 300°C and pressures up to 20,685 kpa .
(3000 psi). Such harsh conditions limit the types of
materials that may be used to construct the interface.
In a preferred embodiment of the invention, a fiber
optic probe constructed .by .soldering metal coated, .fused
silica fiber optic cables into a protective metal
sheath, is utilized; this.probe is described in
U.S. Patent No. 5,&57,404 issued August 12,
1997, by Buchans,n et al, entitled ROBUST
SPECTROSCOPIC OPTZCAi~ PROBE. The probe ~is directly'
inserted into the process line and the previously
described optional filter devices are connected on the '
opposite end of the probe tip. This probe design
provides a simple, yet.reliable method of optically
sampling a chemical co~aposition in,a harsh physical
CA 02263850 1999-02-19
WO 98/08066 PCT/US96/13530
- 23 -
environment of a manufacturing process. As added
benefits of this design, the probe is easily removed and
replaced if damage occurs, and the need for optical
alignment during routine use is eliminated.
The optical dispersion element is used to separate
the various energy levels of the scattered radiation.
In general, the spectrograph 8 must have a suitable
resolving power to separate the radiation energy levels
to the desired degree. It should also be efficient to
minimize loss of radiation.
Useful commercially available spectrographs are
constructed with ruled gratings as the dispersion
element. Depending on the size of the spectrograph box
and the spacing of the lines on the grating, the
instrument will have differing resolving power. other
commercially available spectrographs use specially
designed holographic dispersion elements that have
enhanced throughput characteristics. A preferred
embodiment of the invention utilizes a single grating
spectrograph with a fixed grating that disperses light
such that the wavelength range 800 nm to 1000 nm is
incident on the detection region. High quality
instruments of this type are available from various
vendors.
The array detector 16 is extremely important to
effective functioning of the instrument. In order to
obtain useful spectra when bubbles and particulates are
in the process stream, the detector must have many
closely spaced channels collecting simultaneously. Two
3o present detection systems that are commonly used for
this purpose are charge coupled devices (CCD) and
photodiode arrays (PDA). CCD are preferred as these
detectors have extremely low background noise levels,
are extremely sensitive, and can be fashioned into two-
dimensional arrays, which allow multiple spectra to be
CA 02263850 1999-02-19
WO 98/08066 PCT/I1S96/13530
- 24 -
imaged on a single detector. This multiplexing
capability helps to reduce the instrument cost and
provides the means by which a dual beam standardization
method can be utilized, as described in U.S. Patent
No. 5,455,673. This standardization method increases
precision and helps to reduce the cost of sampling.
CCD detection arrays are commercially available in
a wide variety of shapes and sizes. Common arrays are
512 by 512 pixels and 386 by 576 pixels. Other larger
array formats, such as 256 by 1024 or 1024 by
1024 pixels, are also available. Such detectors must be
cooled to below room temperature to minimize
interfering, background noise levels. This can be
accomplished by cooling with liquid nitrogen, water, or
air. Some CCD devices utilize a technology referred to
as multi-pin phasing (MPP), which lowers background
signal levels and noise to achieve desirable performance
at temperatures lowered by air cooling.
In the preferred embodiment of the invention, it is
desired to minimize noise, maximize signal, and minimize
the amount of instrument maintenance required. For this
reason, properly air cooled, MPP, CCD detectors are
desired. A 512 by 512 pixel array is preferred because
it provides adequate spectral resolutionicoverage and
allows for simultaneous detection of multiple channels.
The spectrograph, detector, and laser components of
the spectrometric system are not generally designed to
withstand the environmental effects of a production
area. Therefore it is preferred to locate these devices
in a safe, controlled environment, remote from the
process sampling point. Optical fibers are extended
between the controlled environment and the process point
and connected to the optical probe, which is inserted
into the process line.
CA 02263850 1999-02-19
WO 98108066 PCTJUS96/13530 3
- 25 -
Spectra collected on the described Raman
spectrometric system are indicative of the chemical
constitution of the material flowing within the
production process. The precision and accuracy of the
method is enhanced by use of the preferred embodiment of
the instrumentation, although other combinations of
components are also useful.
Several phenomena that can cause interferences or
imprecision in the final analyses need to be understood
and controlled to gain the highest possible accuracy and
precision. These phenomena are: "cosmic ray" events;
bubbles, particulates, and turbidity in the process;
calibration point sampling; lab sampling error; and
vibrations, movement, and shifting of instrumental
components.
"Cosmic ray" events, often referred to as spikes,
occur on CCD detectors in a random fashion. They are
believed to be caused by high energy particles from
outer space which, when colliding with a CCD detector
element, cause a large, contaminating, spectral spike.
In general, the spikes from these events are very
narrow, typically 1 to 5 pixels wide. The occurrence of
a cosmic ray event is rare and unpredictable, though
there is some evidence that the event frequency depends
on solar flare activity and the time of day.
The cosmic ray spikes are troublesome because they
add a large signal in the spectrum that is not related
to the process material. Fortunately, there are several
simple mathematical routines that can be used to correct
or despike the spectral data. One such routine is
described in Takeuchi et al., Appl. Spec., 1993,
Vol. 47, pp. 129-131.
Bubbles, particulates, and turbidity can affect the
observed spectrum by obfuscating a portion of the
sampled region, causing spectral intensity variations
CA 02263850 1999-02-19
WO 98/08066 PCT/US96/13530
- 26 -
that are related to variabilities in sample volumes.
Through the use of a multichannel detection system, all
energy levels of the scattered radiation can be observed
simultaneously. The bubbles, particuiates, and
turbidity act on spectral response in a manner similar
to multiplication by a random number, which allows for
application of a correction to normalize the spectrum.
The normalization procedure, which is generally applied
to the standard sample spectrum, corrects for
discrepancies in the volume of material sampled by the
incident radiation.
The simplest normalization scheme utilizes an
internal standard that is indicative of the amount of
material sampled. For PET type polyester materials, a
scheme that normalizes the area of the ring breathing
mode located at about 1610 cm 1 is convenient and
useful. This vibrational mode is directly related to
the number of terephthalate rings sampled, enabling it
to be employed for the correction of sample volume
variabilities. This scheme, though preferred for its
simplicity, is not the only means by which normalization
can be achieved, other mathematical means by which the
spectrum is normalized may be employed.
The observed Raman spectrum is a combination of
vibrational bands that are related to the composition in
the sampled material. However, each particular
vibrational movement has a scattering efficiency which
is related to the polarizability of the vibrational
movement. Because of this, a simple analysis of
vibrational bands will not directly provide the desired
compositional information. Because no direct measure of
sample composition is obtained, calibration means to
relate the observed spectral characteristics to the
desired analytical information must be constructed.
To construct calibration means, samples correlated in
CA 02263850 1999-02-19
WO 98/08066 PCT/US96/13530
- 27 -
time with particular acquired spectra are removed from a
chemical process and analytically measured to provide
chemical constitution information. Because the acquired
spectra are convolved by instrumental instability, it is
preferred that they be converted to standard spectra
prior to construction of the calibration means. This is
achieved by determining and applying a convolution
function as disclosed in U.S. Patent No. 5,455,673. For
this process, diamond is a preferred reference material.
Comparing at a plurality of wavelengths the Raman
spectra, which are preferably standard spectra, of a
plurality of chemical compositions of known constitution
enables the construction of constitution-intensity
correlation (CIC) multivariate calibration means. The
wavelengths selected for construction of a CIC depend on
the spectral characteristics of the particular component
whose concentration in a chemical composition is to be
determined. For each component whose in situ
concentration in the composition is desired to be
monitored at any given time, a separate CIC calibration
is prepared.
The use and construction of calibration means,
including multivariate calibration and partial least
squares regression, is described in Martens et al.,
Multivariate Calibration, 1989, Wiley, New York, pages
1-6, 11-22, 25-30, 73-78, and 116-125. Other methods
for correlating the concentrations of chemical
substances with Raman spectral peak areas are described
in U.S. Patent No. 4,620,284.
For the preparation of PET type polymers from a
mixture of dimethyl terephthalate (DMT) and ethylene
glycol (EG), which may further include a limited
concentration of a glycol modifier such as cyclohexane-
dimethanol (CHDM), it is important to monitor the extent
of transesterification at various times during the
CA 02263850 1999-02-19
WO 98/08066 PCT/US96/13530
- 28 -
process. This may be accomplished by determining the
concentrations in the polymer-forming composition of
methyl ester ends (from DMT), hydroxyethyl ends (from
EG), and internal ethylene linkages, which are contained
in the intermediate bis(2-hydroxyethyl)terephthalate
(BHET). In situ determination of each of these species
requires individual concentration-intensity correlations
(CICs). Determining the quantity of glycol modifier
present at any given time requires another CIC.
Vibrations, movements, and shifting of the various
instrumental components can cause unexpected changes in
the observed spectra. The types of errors induced are
difficult to predict and may cause inaccuracies that
result in limited precision. It is therefore important
to eliminate or minimize the effects of vibrations,
movements, and shifting in the instrument, which can be
"hardened" by a robust assembling of its components in a
sturdy construction. The better hardened an instrument,
the higher precision it will ultimately be capable of
attaining.
Sample probes may be placed at any location in a
chemical manufacturing process stream, but it is
generally advisable to place a probe in a location where
it will provide information that is useful for
controlling the process and for providing analytical
information for calibration purposes.
One preferable sample probe location in a polyester
production process is near the point in the process
where the first stage reaction is near completion. This
provides a means by which analytical information
regarding extent of reaction, mole ratio of diols to
acids and or diesters, percent of diol or diacid
modifiers, and degree of polymerization can be quickly
ascertained. Such information allows for improved
CA 02263850 1999-02-19
WO 98/08066 PCT/US96/13530
- 29 -
control of the first stage of the process and improves
downstream control.
The following examples further illustrate the
invention.
Examule 1 - Demonstration of method capability in a
batch process
The technical capability of the monitoring method
was demonstrated in a laboratory reaction vessel under
conditions similar to those of a production process
environment. The transesterification reaction of DMT
and EG was continuously monitored in situ by Raman
spectroscopy as samples were removed periodically from
the vessel. A second, subsequent reaction run was used
to compare the Raman estimated data to the NMR measured
data and demonstrate thereby the validity of the
calibration.
A Raman instrument was constructed containing a
krypton ion gas laser (from Lexel, Fremont CA),
operating at 752 nm, as a radiation source. The plasma
lines from the lasing process were filtered from the
incident radiation beam by a dielectric band pass filter
as the radiation was focused onto a 200 micrometer core,
polyimide buffered, fused silica fiber optic cable. The
fiber optic transmitted the radiation to a sample probe
which was inserted directly into the reaction medium.
The scattered radiation was collected by six 200
micrometer fibers positioned closely about the
excitation fiber. The six collection fibers were
directed back towards an Instruments SA (Edison, NJ)
model 320 spectrograph. The fibers were arranged into a
linear array and positioned directly in front of the
entrance optics.
CA 02263850 1999-02-19
WO 98/08066 PCT/US96/13530
- 30 -
The entrance optics served first to collimate the
radiation, then pass it through a Kaiser Optics (Ann
Arbor, MI) holographic-band rejection filter that
eliminated virtually all elastically scattered
radiation, and finally to focus the filtered radiation
onto the entrance slit of the spectrograph. The
dispersed light was detected by an ISA liquid nitrogen
cooled CCD detector and converted into an electronic
signal.
The instrument was controlled by software that
permitted continual collection of sequential data files.
Pairs of 30-second sequential spectra were acquired and
compared to remove cosmic spike events. Following spike
removal, the two spectra were averaged. The aromatic
ring breathing vibration spectral feature at 1610 cm 1
was used as the convolved reference spectrum for the
standardization process disclosed in U.S. Patent
No. 5,455,673 to remove band shape and band position
variations. The area of the aromatic ring breathing
mode at 1610 cm 1 was used for normalization.
The resultant, standardized waveform was smoothed
in the Fourier domain by a three point halfwidth
Gaussian broadening function and a one-point halfwidth
Lorenztian narrowing function. The second derivative of
the data was calculated and the resultant standardized,
smoothed data was used to construct a CIC calibration,
using a partial least squares (PLS) data analysis
package (UNSCRAMBLER from Computer Aided Modelling ASS
of Trondheim, Norway).
Approximately 1065 grams of DMT and 865 grams of EG
were added to a large reaction vessel. A specially
designed lid with fittings for an optical probe,
thermocouple, stirrer, condenser, and sample port was
attached. A gentle stream of clean nitrogen was passed
CA 02263850 1999-02-19
WO 98/08066 PCTlUS96/13530
- 31 -
above the reaction mixture to blanket the mixture
against oxygen.
The reaction mixture was carefully heated to 180°C
as Raman spectra were being acquired. After collection
of a few baseline spectra, approximately 0.20 grams of
manganese acetate catalyst was inserted into the
mixture. After a few hours, the reaction temperature
was raised to 195°C, and after another period of time,
raised to 210°C.
At intervals during the reaction, a sample was
removed and analyzed by NMR spectrometry to determine
the number of aromatic terephthalate rings, referred to
as -T-; methyl ester ends, referred to as -CH3;
hydroxyethyl ends, referred to as -OH; internal ethylene
linkages, referred to as -2-; and free EG.
Figure 3 shows the calibration and validation
reaction values for the number of methyl ends. The
number of measured methyl ester ends, -CH3 was
normalized to the terephthalate rings, -T-, giving a
direct measure of the extent of the transesterification
reaction. This calibration curve exhibits a correlation
coefficient of 0.9999, indicating that the Raman method
is very capable of determining the analytical results
required over the entire compositional range of the
transesterification reaction.
Figure 4 shows a plot of various parameters
measured throughout the reaction. Individual spectra
were acquired approximately once per minute. The
initial 20 minutes were obtained with the vessel at
180°C and no catalyst present. After the catalyst was
added, the reaction increased rapidly. After three
hours (spectrum number 180), the reaction temperature
was raised to 195°C, and after four hours (spectrum
number 230), the temperature was further raised to
210°C.
l
CA 02263850 2002-07-03
Vw0 98108066 PCTIUS96I13530 ~,
- 32 _
The data iw Figure 4 demonstrate the exceptional
ability of the invention for determining,several.
important components in the'reaction. The number of
methyl ester ends is~indicative of the extent of
5 formation of the intez~mediate BFIET and is an important
criterion. for good polymer manufacture. The internal
ethylene units .are di=ectly related to the degree of
polymerization and molecular weight, which are other
important properties.
Example 2 - Analysis ~n a polyester production reaction
stream
To demonstrate the utility of the invention as an
in.situ, on-line, quantitative analytical tool in a
production environment, a Raman instrument Was installed
near a-polyester. production line. A robust probe,
constructed as disclosed in the aforementioned
U.S. Patent No. 5,657,404 issued August 12,1997;
entitled ROBUST SPECTROSCOPIC QPTICAL PROBE, wa:
installed.so that the sampling tip protruded into the
flowing, molten, polyester stream. The particular
process line was designated to manufacture a glycol
modified PET produced from DMT, EG, and CFiDM. The
measurement process was demonstrated over.a six week
period. Analytical data'correspon.ding to the extent of
the first stage (transesterification) reaction, mole
ratio of glycols to acids, and percent composition of
the CHDM glycol modifier were obtained.
The~Raman instrument was~constructed to. include a
2.d Watt multimode diode laser operating with 800 nm
excitation; this was pigtailed to a 100 micrometer
silica quartz core, fiber optic cable (Spectra Diode
Lab, Inc., San ,Jose, CA model number SDL=2372-P3). The
incident radiation was split into two beams with a fiber
optic beam splitter (Oz Optics Ltd., Carp, Ontario,
CA 02263850 1999-02-19
WO 98/08066 PCT/ITS96/13530 .~
- 33 -
Canada, model number FOBS-12-555-MMM-750-50150). Both
beams were focused onto individual 200 micrometer core,
polyimide buffered, quartz silica fiber optic cable
(Fiberguide Industries, Stirling, NJ). The two fiber
optics transmitted the radiation to both a sample probe
and a reference probe. The sample probe was inserted
directly into the process stream some 4o meters distant.
The radiation in each fiber optic cable was
filtered prior to entering the individual probes. The
filters were designed to transmit only a narrow energy
band (Omega Optical, Brattleboro, VT model number 800
BP10) and were inserted into fixed fiber optic filter
holding device (Oz Optics, Ltd. model number
ND-200-55-750-M-30). The reference probe was used to
illuminate a small diamond fragment, which was used as a
reference material. The sample probe was inserted
through a flange port into the process stream.
The scattered radiation from both reference and
sample was collected by individual 200 micrometer fibers
positioned closely about the excitation fibers. The
collected scattered radiation was filtered to remove
nearly all of the Rayleigh scattered radiation prior to
entering the return fiber. The filter (Omega Optical,
model number 800 REFLP) was held in a fixed fiber optic
filter holding device (Oz Optics, Ltd- model number
ND-200-55-750-M-30) and was designed for efficiently
rejecting the unwanted radiation while allowing
collection of the desired Raman scattered radiation.
Both return fibers were directed back towards an
ISA 320 spectrograph. The fibers were arranged into a
linear array and positioned directly in front of the
entrance slit. The dispersed light was detected by an
ISA liquid nitrogen cooled CCD detector and converted
into an electronic signal.
CA 02263850 1999-02-19
WO 98/08066 PCT/US96/13530
- 34 -
The instrument was controlled with software that
permitted continual collection of sequential data files.
Pairs of 30-second sequential spectra were acquired and
compared to remove cosmic spike events, and the two
despiked spectra were averaged. A cubic spline
interpolation as described in Numerical Recipes: The
Art of Scientific Computing, pages 86-89 was used to
provide equally spaced abscissa data in the convolved
reference and sample spectra. Standardization and
normalization were carried out as described in
Example 1. The resultant standardized waveform was
smoothed in the Fourier domain by a nine-point halfwidth
Gaussian broadening and a seven-point halfwidth
Lorenztian narrowing function. Five sequential smoothed
standardized waveforms were averaged together to provide
one data point every 5 minutes.
The sample probe was located in the process stream
at a location where the transesterification reaction was
assumed to be nearly complete. The temperature was
approximately 235°C and the pressure approximately
206.85 kPa (gage) (30 psig) inside the process
environment. A sample port was located close to the
sample probe, and a small sample of the oligomer was
removed once every 12 hours. This sample was analyzed
by NMR to determine the extent of the
transesterification reaction.
The second derivative, standardized smoothed
spectra that corresponded in time to the analyzed
compositions of known concentration were used to
construct a CIC calibration. Calibrations were
constructed using a partial least squares (PLS) data
analysis package (UNSCRAMBLER from Computer Aided
Modelling AiS of Trondheim, Norway).
Figure 5 shows the NMR results from the extracted
samples (shown as open circle marker points) and data
CA 02263850 1999-02-19
WO 98/08066 PCT/US96/13530
- 35 -
obtained with the Raman instrument (shown as a solid
line) over an approximate six week period for the extent
of the transesterification reaction. The NMR data
indicate a widely varying process where the point to
point deviation is the predominant trend in the data.
The major sources of variation are presumably caused by
sample removal, inherent process variations, and the
analytical measurements.
Discontinuities in the Raman data were caused by
either failure to refill the liquid nitrogen container
or accidental loss of data.
A statistical analysis of the process data
confirmed the observation that the Raman data has much
less point-to-point variation than the NMR measurements.
The Raman method demonstrated excellent relative
precision, about 0.1%. The greatest source of variance
in the NMR data was in the sampling method, not
surprising considering the manner in which samples were
removed from the process.
In addition to higher precision, the Raman method
clearly provides more frequent sampling, diminished
sample removal requirements, and much faster turn-around
times than the IJMR analysis. More frequent sampling
provides a means to better understand the nature and
duration of true variations in the process. The
decreased need to remove samples dramatically decreases
the risk of injuries. The faster turn-around time
provides a means by which a more active process control
strategy can be obtained. The use of this invention
clearly enables more frequent and precise measurement of
the variables.
CA 02263850 1999-02-19
WO 98/08066 PCT/L1S96/13530
- 36 -
Example 3 - Demonstration of method capability for mixed
xylenes
The technical capability of the method to determine
the constitution of other chemical compositions was
demonstrated by preparing a sample set of mixed xylenes.
The samples were prepared by carefully weighing varying
amounts of each component into the mixture. The molar
concentration percentages were calculated and used as
the actual values, shown as STD in Table 1 below.
The Raman instrument was constructed to contain a
2.0 Watt multimode diode laser operating with 800 nm
excitation that was pigtailed to a 100-~.m silica quartz
core, fiber optic cable (Spectra Diode Lab, Inc.,
San Jose, CA model number SDL-2372-P3). The incident
radiation was split into two beams with a fiber optic
beam splitter (Oz Optics Ltd., Carp, Ontario, Canada,
model number FOBS-12-555-MMM-750-50/50). Both beams
were focused onto individual 200-~,m core, polyimide
buffered, quartz silica fiber optic cable (Fiberguide
Industries, Stirling, NJ). The two fiber optics
transmitted the radiation to both a sample probe and a
ref erence probe .
The radiation in each fiber optic cable was
filtered prior to entering the individual probes. The
filters were designed to transmit only a narrow energy
band (Omega Optical, Brattleboro, VT model number 800
BP10) and were inserted into fixed fiber optic filter
holding device (Oz Optics, Ltd. model number
ND-200-55-750-M-30).
Both the reference and the sample fiber optic
probes were constructed in-house. The reference probe
was used t.o illuminate a small diamond fragment, which
was used as a reference material. The sample probe was
inserted into a 316 stainless steel sample tube in which
the mixed xylene samples were placed.
l a
CA 02263850 2002-07-03
The scattered radiation from both reference and
sample was collected by individual 200-~m fibers
positioned closely about.the excitavtion fibers. The
collected scattered radiation was filtered to remove
nearly all of the Rayleigh scattered radiation prior to
entering the return fiber. The filter (Omega Optical,
model dumber 800 REFLP) was held in a fixed fiber optic -
filter,holding device {Oz Optics, Ltd. model number
ND-200-55-750-M-30) and was designed to efficiently
reject the unwanted radiation; i~iFile passing the desired
Kaman scattered radiation.
Both return fibers were directed back towards an
Acton SpectraPro spectrograph (Acton Research
Corporation, Acton, MAC. The monochromator was
Eonstructed with a turret-style grating system with
three dispersive gratings. These gratings were: I50
groovesimm, blazed at 750 nm; 300 c~raoves.~am, blazed at
750 nm; and 600 k3roovesimm, blazed at 750 nm. The
300 groovesimm grating was used for the analysis and
provided approximately 1700 cm l,spectral coverage.
A fiber adapter fashioned with eight 200-~m inputs
was connected at the entrance of tare monochrom.ator to
enable eight Kaman channel collection.. The fibers were
arranged into a linear array~and positioned directly in
front of the entrance slit. One of these eight
monochromator fibers was connected o the sample probe
fiber and another Was connected to the reference probe
fiber.. The dispersed radiation waa detected by a
Princeton Instruments (Trenton, NJj thermoe3ectric-
cooled CCD detector and.converted :into an electronic
signal.. The CC~a chip was a'TEKTRONIX* 5I2 by 512 pixel,
back-illuminated detection system.
The instrument was controlled with the.CSMA data
acquisition software provided by Princeton Instruments;
30-second spectra were acquired. , cubic spline
*Trademark
CA 02263850 1999-02-19
WO 98/08066 PCT/IJS96/13530
- 38 -
interpolation was applied as in Example 2 to linearize
the convolved reference and sample spectral data with
respect to the abscissa. The standardization process
described in U.S. Patent No. 5,455,673 was applied to
remove band shape and band position variations. The
resultant standardized waveform was smoothed in the
Fourier domain by a three point half width, Gaussian
broadening and two point half width, Lorenztian
narrowing function.
The standard sample spectra from samples A-K were
used in conjunction with a partial least squares (PLS)
data analysis package (UNSCRAMBLER from Computer Aided
Modelling A.S of Trondheim, Norway) to generate a
calibration for each component of the xylene mixture.
This calibration was used to provide the composition
information from each sample.
Samples L-Q constitute an independent validation
set. These samples were measured in a similar fashion
to samples A-K, which provided a standard spectrum for
each sample. The calibration function was applied to
each standard spectrum to provide a measure of sample
composition.
The monochromator center was intentionally shifted
from 901 nm to 899 nm to simulate an instability in the
apparatus, and samples G and L-Q were measured again
(relabeled as samples R-X) to provide a new set of
standard spectra. The calibration function was applied
to each standard spectrum to provide a measure of sample
composition.
3o In Table 1 below are shown, in the column labeled
"Invention", the composition in molar percentage of the
xylene mixtures as determined from their Raman spectra
by the method of the present invention. The
discrepancies between these values and the actual
percentages, listed in the "STD" column, as shown in the
CA 02263850 1999-02-19
WO 98/08066 PCT/US96/13530
- 39 -
"Difference" column. The components are identified as
follows:
P = para-xylene, M = meta-xylene, and
O = ortho-xylene.
TABLE 1
Sample Component STD Invention Difference
A P 39.86 39.84 -0.02
M 35.22 35.19 -0.03
O 24.91 24.97 0.06
B P 39.98 40.10 0.12
M 25.01 25.07 0.06
O 35.01 34.83 -0.18
C P 34.97 34.99 0.02
M 25.13 25.21 0.08
O 39.91 39.80 -0.11
D P 34.78 34.81 0.03
M 39.93 39.94 0.01
O 25.29 25.25 -0.04
E P 39.95 39.83 -0.12
M 25.08 24.92 -0.16
O 34.97 35.25 0.28
F P 33.34 33.28 -0.06
M 33.32 33.44 0.12
O 33.33 33.28 -0.05
G P 33.42 33.51 0.09
M 33.23 33.11 -0.12
O 33.35 33.37 0.02
H P 25.12 25.14 0.02
M 39.94 39.91 -0.03
O 34.94 34.95 0.01
I P 35.04 35.05 0.01
M 39.97 39.93 -0.04
O 24.99 25.02 0.03
J P 39.97 39.93 -0.04
M 35.01 35.11 0.10
O 25.02 24.95 -0.07
CA 02263850 1999-02-19
WO 98/08066 PCT/US96/13530
- 40 -
K P 24.97 24.92 -0.05
M 35.09 35.11 0.02
O 39.95 39.97 0.02
L P 30.14 30.16 0.02
M 29.92 29.92 0.00
O 39.94 39.92 -0.02
M P 30.03 30.07 0.04
M 39.90 39.82 -0.08
O 30.07 30.12 0.05
N P 39.96 39.96 0.00
M 29.95 30.07 0.12
O 30.09 29.97 -0.22
O P 35.01 34.85 -0.16
M 35.03 34.89 -0.14
O 29.97 30.26 0.29
P P 35.00 35.12 0.12
M 30.01 29.90 -0.11
O 34.99 34.98 -0.01
Q P 30.03 30.04 0.01
M 34.99 35.00 0.01
O 34.98 34.97 -0.01
R P 33.42 33.40 -0.02
M 33.23 33.15 -0.08
O 33.35 33.45 0.10
S P 30.14 30.12 -0.02
M 29.92 29.76 -0.16
O 39.94 40.12 0.18
T P 30.03 29.91 -0.12
M 39.90 40.08 0.18
O 30.07 30.01 -0.06
U P 39.96 39.79 -0.17
M 29.95 29.88 -0.07
O 30.09 30.33 0.24
V P 35.01 34.92 -0.09
M 35.03 35.03 0.00
O 29.97 30.05 0.08
CA 02263850 1999-02-19
WO 98/08066 PCT/US96113530
- 41 -
W P 35.00 35.05 0.05
M 30.01 30.15 0.14
O 34.99 34.80 -0.19
X P 30.03 29.86 -0.17
M 34.99 35.07 0.08
O 34.98 35.07 0.09
In Table 2 below are shown the standard errors of
calibration for mixtures A-K and of prediction for the
sets of mixtures L-Q and R-X as determined, in
accordance with the invention, by applying a convolution
function to the measured Raman spectra of the samples.
Included for comparison in Table 2 are the values for
the errors of calibration and prediction absent the
application of the method of the present invention.
25
TABLE 2
Comparison Invention
Standard Error P M O P M 0
Samples A-K 0.225 0.191 0.338 0.066 0.084 0.110
Samples L--Q 0.336 0.329 0.591 0.082 0.096 0.134
Samples R-X 3.595 3.949 7.495 0.109 0.116 0.148
From the entries of Table 2 it is clear that the
invention provided a substantial reduction in the
standard error values even for the calibration sample
set A-K. The improvement was even greater with the
validation sample set ir-Q. However, it was in the case
of set R-X, where the monochromator center was
intentionally shifted by 2 nm in simulation of
spectrophotometric system instability, that the method
of the invention demonstrated its benefit most
strikingly, producing a dramatic reduction in the
standard errors of prediction.
CA 02263850 1999-02-19
WO 98/08066 PCT/US96JI3530
- 42 -
The invention has been described in detail with
particular reference to preferred embodiments thereof,
but it will be understood that variations and
modifications can be effected within the spirit and
scope of the invention.