Note: Descriptions are shown in the official language in which they were submitted.
CA 02305911 2000-04-14
v
Determining Body Composition
Using Fan Beam Dual-Energy X-ray Absorptiometry
Reference to Related Application
This present application claims the benefit of provisional Application Serial
No.
60/120,289, filed on February 16, 1999, which is hereby incorporated herein by
reference.
Field
This patent specification pertains to the field of using x-rays to determine
internal characteristics of patients or objects, and more specifically to
using dual-
energy x-ray absorptiometry to determine whole body and regional composition.
Still
more specifically, this specification is in the field of using a fan-shaped
distribution of
x-rays for such purposes.
Background
The determination of body composition (e.g., fat mass, lean mass, etc.) of a
living human subject has been recognized as having medical utility for diverse
predictive, diagnostic, and monitoring purposes. Body composition can also be
of
interest where x-rays irradiate non-human subjects or inanimate objects. For
some
purposes, whole body composition is measured or estimated while for other
purposes
the composition of parts of the body are of interest, such as limbs, hips,
etc.
Systems using dual-energy x-ray absorptiometry (DXA) have long been used to
measure or estimate parameters such as bone mineral density (BMD), e.g.,
systems
commercially available from the assignee hereof under trade designations such
as the
QDR 4500 and QDR 2000 product lines. Other types of systems have been used for
BMD measurement to a lesser extent, such as quantitative computer-aided
totilography
(QCT) and single photon absorptiometry (SPA) using isotopes as radiation
sources.
DXA systems also have been used to measure or estimate body composition, both
for
the whole body and for regions thereof. See, e.g.: Kelly TL, Berger N and
Richardson
TL, Appl. Radiat. Isot., Vol. 49, No. 5/6, pp. 511-513, 1988; Fuerst T and
Genant HK
CA 02305911 2000-04-14
( 1996) Evaluation of body composition and total bone mass with the Hologic
QDR
4500, Osteoporisis International 6, s202; Prince R, Price R. Gutteridge D,
Retallack R,
Dick I, Lemmon J, Hall S, LeDain S 1995 Comparison of bone mineral density
measurement between the Hologic QDR2000 and QDR4500A, J Bone Miner Res 10
(Suppl 1 ): s272; Kelly T ( 1996) Whole Body Enhancements: Free software
upgrades
available for QDR-4500A and QDR-4500W users with and without body composition
option QDR Insights, New Developments in Bone Mineral Measurements, Vol. 7, p.
15. Some DXA systems use a single, pencil beam shaped beam of radiation that
scans
the body, typically in a rectilinear fashion, and take dual-energy measurement
at each
of the many pixel positions arranged in a rectangular pixel matrix. Others,
such as the
QDR-4500A systems use a wider, fan-shaped distribution of x-rays, and can scan
the
entire body, typically in three scans along the length of the body, combined
to
simulate the effect of scanning with a single fan-shaped distribution that is
sufficiently
wide to encompass the entire body width, as described in commonly assigned U.
S.
Patent No. 5,748,705. The patent and publications cited above are hereby
incorporated
by reference in this patent specification as though fully set forth herein.
When pencil-beam systems are used for body composition measurements, the
attenuation measurement for all the pixels are obtained by measuring the
intensity of
x-rays that travel along essentially parallel paths. However, when a system
with a fan-
shaped x-ray distribution is used, there are geometric and other factors that
can
complicate body fat computations and introduce inaccuracies. In an effort to
account
for such factors, Hologic released a body composition option for its 4500A
system.
The option has been used commercially in this country since its introduction
in 1996,
but it is believed that a need still remains to improve body composition
analysis in
systems using fan-shaped distributions of x-rays.
Summary
This patent specification describes a new approach to body composition
analysis in DXA systems using a fan-shaped distribution of x-rays that
accounts not
only for the factors previously considered in the 1996 option for the QDR
4500A
2
CA 02305911 2000-04-14
systems, but also for mass magnification effects that the system geometry
entails. The
new approach makes use of the realization that accuracy can be improved
significantly
by taking into account the apparent changes in measured mass with changes of
the
location of the mass along the raypaths from the x-ray source to the x-ray
detector,
and by finding an effective way to make corrections for such changes in
apparent
mass.
When a fan-shaped distribution of x-rays is used, e.g., with a DXA system that
includes a patient table on which a supine patient reclines, a magnification
effect takes
place that causes a mass element nearer the table surface to be weighted more
heavily
(to appear to have more mass) than an identical mass element further away from
the
table surface. Thus, one unit of mass can be measured correctly as one unit if
on the
table surface but as less than a unit of mass if at some height above the
table surface.
For a supine patient on the table surface, a mass element at the patient's
back can
appear to have more mass than an identical mass element at the patient's
abdomen.
While in known earlier work the measured mass was calibrated to be nominally
correct
for the average-size subject, the mass for thin subjects could be
overestimated and the
mass for obese subjects could be underestimated.
The detailed disclosure set forth herein describes the recognition of the
cause
for this inaccuracy and a solution that makes the body composition more
accurate.
Brief Description of the Drawings
Fig. 1 is a simplified and schematic cross-sectional elevation illustrating a
fan-
shaped distribution of x-rays in a DXA system in which the body composition
analysis
described herein can be practiced.
Fig. 2 is a simplified and schematic longitudinal elevation of the DXA system
of Fig. 1.
Fig. 3 is simplified representation of a human subject scanned with the system
of Fig. 1 to obtain raw data measurements for pixels in a rectangular matrix.
Fig. 4 is a diagrammatic isometric view of a patient on a table of the system
of
Fig. 1, for reference in defining a coordinate system.
3
CA 02305911 2000-04-14
Figs. Sa and Sb are simplified and diagrammatic sectional views illustrating a
difference between using a pencil-beam (Fig. Sa) and a fan-beam system (Fig.
Sb).
Figs. 6a and 6b illustrate two systems for defining regions of interest -- a
previously used system (Fig. 6a) and a system used when applying the body
composition analysis described in this patent specification (Fig. 6b).
Fig. 7 is a block diagram of a system useful for estimating true body
composition using a fan-shaped distribution of x-rays.
Detailed Description
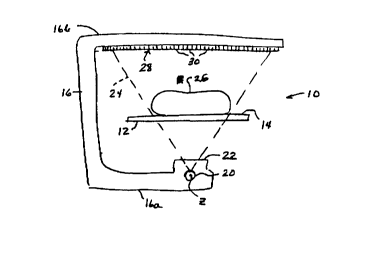
Referring to Figs. 1-3, a DXA system 10 such as in the QDR 4500A product
includes a patient table 12 having a support surface 14 that can be considered
horizontal and planar in this simplified explanation. A human subject 26 is
supine on
surface 14, with the length of the patient being along a horizontal
longitudinal axis
defined as the z-axis. A C-arm 16 has portions 16a and 16b extending below and
above table 10, respectively, and is mounted in suitable structure (not shown)
for
moving parallel to the z-axis along the length of patient H. Lower portion 16a
of the
C-arm carries an x-ray source 20 that can emit x-rays shaped by a collimator
22 into a
fan-shaped distribution 24 conforming to a plane perpendicular to the z-axis.
The x-
ray distribution can be continuous within the angle thereof or can be made up,
or
considered to be made up, of individual narrower beams. The x-ray distribution
24
encompasses the patient and impinges on an x-ray detector 28 that can comprise
an
array of individual x-ray elements 30 or can be a continuous detector where
measurements for different positions along the detector can be defined, or can
be
another form of detector of x-rays. As C-arm 16 moves along the z-axis, x-ray
distribution 24 scans patient 26 and x-ray detector 28 produces a succession
of lines of
raw x-ray data. Each line corresponds to a particular position of the C-arm in
its
movement along the z-axis and comprises a number of individual measurements,
each
for a respective pixel in the line, i.e., represents the attenuation that the
x-rays have
suffered in traveling from source 20 to a respective pixel position. For
example, a
pixel measurement is obtained from each respective detector element 30 for
each line.
4
CA 02305911 2000-04-14
A DXA system takes a high energy measurement H and a lower energy measurement
L, so that each pixel measurement comprises an high measurement H and a low
energy
measurement L. This can be done by rapidly alternating the energy level of the
x-rays
from source 20 between a higher and a lower range, for example by rapidly
switching
the x-ray tube and/or rotating or otherwise moving a suitable filter in or out
of the x-
rays before they reach patient 26, or by operating source 20 to produce a
relatively
wide x-ray energy range but using an x-ray detector 28 that can discriminate
between
energy ranges to produce H and L measurements for each pixel position in a
rectangular array such as illustrated in Fig. 3. The H and L x-ray
measurements for
the respective pixel positions are computer-processed as known in the art to
derive
estimates of parameters such as BMD.
While Figs. l and 2 illustrate an x-ray distribution 24 wide enough to
encompass the entire patient, and a C-arm 16 that moves only along the z-axis,
typically such a wide x-ray distribution is simulated by using a narrower-
angle
distribution, such as illustrated in Fig. Sb, that scans along the z-axis in
several (e.g.,
three) successive scans. At least one, and typically both, of table 12 ~ and C-
arm 16
move in a plane perpendicular to the z-axis between the scans to keep the
vertical
distance between the origin of the x-rays and table 12 constant and thereby
enable the
effective combination of the narrower-angle scans to give the H and L
measurements
that would have been obtained by the single, wide distribution illustrated in
Fig. 1.
Given a divergent distribution of x-rays, such as distribution 24, the mass of
an
attenuator that is entirely within the x-ray distribution can be estimated
from x-ray
intensity measurements taken with detector 28 if the height of the attenuator
above
table 12 is known or can be measured. This is so because attenuation, as
measured
with detector 28, is proportional to true mass density, not to projected mass
density.
For example, an attenuator of uniform thickness that remains within x-ray
distribution
24 at each of two different heights above table 12 will produce the comparable
attenuation measured per unit projected area at detector 28 at each height but
the total
projected area will differ. At a lower height above table 12, the same
attenuator
produces a wider projected area at detector 28 than at a greater height above
table 12.
5
~
CA 02305911 2000-04-14
If one multiplies the projected area at detector 28 to get mass, a different
mass would
be calculated for each different height of the same attenuator above table 12,
an
undesirable result.
In principle, the mass through which a raypath of x-rays measured for a pixel
passes can be estimated as follows. The dual-energy measurements taken by
detector
2$ are processed into attenuation measurements and are used to estimate the
average
density of the column of material (e.g., body tissue) through which the
respective
raypath passes, using calculations known in the art. The x-ray measurement for
the
high energy (e.g. 140 kVp) can be used as a measure of tissue thickness along
the
raypath, i.e., for a given pixel position. The mass of an object traversed by
the
measured x-rays can be defined as:
mass = j pdV
where p is density in glcm2 and dV (in cm; ) is a volume differential. This
relationship
can be expressed by the triple integral in the cylindrical coordinates defined
in Fig. 4:
mass = j j j p (r, 8, z) r dr d8 dz
where the first and third integrals are from 0 to ~ and the second integral is
from -n
to +~. To solve the radial integral, the limits of r can be defined as where
the density
of the body of interest goes to zero at a given angle within the x-ray
distribution. For
a body 26 on table 12, Im;~ is the distance from the origin of the x-rays
within
~ distribution 24 to the top of table 12. That is:
rm", = T sec6
where T is the distance from the origin of the x-rays to the top of table 12
at the
center of the x-ray distribution 24. The maximum value of r can be
correspondingly
defined as:
rm~ = T sec6 + t(8, z)
where t(8, z) is the thickness of body 26 along the length of r at angle 8
within x-ray
distribution 24.
The measurement for any one pixel is along a raypath, i.e., for a column of
material without the ability to directly _neasure the distribution of
attenuation within
that column. Accordingly, the average density p (r, 8, z) that is within a
raypath to a
6
CA 02305911 2000-04-14
pixel position and extends in a radial direction r (see coordinate system
defined in Fig.
4) can be defined as p (8, z). To ensure that the entire patient 26 is taken
into
account, the angle 8 is integrated over the entire patient width, from -
atan(W/2) to
+atan(W/2), where W is the width of table 12, and z is integrated over the
length L of
table 12. The limits of the triple integral set forth above then become:
0 to L for the first integral;
-atan(W/2) to +atan(W/2) for the second integral; and
Tsec6 to [Tsec6 + t (8, z)] for the third integral.
The radial integral can be explicitly solved, and becomes:
mass = J J p (8, z) t(8, z) ~ [t(8, z)]/2 + Tsec6] } d8 dz,
where the limits of the first integral are (0 to L) and the limits of the
second integral
are [-atan(W/2) to +atan(W/2)]. This is a general solution for the mass of a
patient, or
an object, on a flat surface such as table 12, at a distance T from the origin
of the x-
rays and the coordinate system, with a thickness t (8, z) along the respective
radial
direction for each x-ray attenuation measurement for a respective pixel
position. The
thickness t (8, z) can be estimated from the high energy measurements H for
the
respective pixel positions, and the attenuation or density values p (8, z) can
be
estimated from the high and low measurements (H, L) for the respective pixel
positions.
In the case of the QDR 4500A system, the thickness can be estimated in
accordance with:
t (6, z) _ [A(EH)]/[k(EH, P)]
where A(EH) is the high energy x-ray attenuation (dimensionless) measured for
the
respective pixel position, and k(EH, p) is the linear attenuation coefficient
(in units of
( 1 /length) of the column of material traversed by the raypath giving rise to
the
measurement for the respective pixel position. The density p can be estimated
for the
individual pixel positions using the patient's %Fat estimates for the
respective pixel
positions, where the %Fat is estimated from the ratio of high and low x-ray
energy
measurements for the respective pixel positions as is known in the art.
For practical reasons, such as the effect of beam hardening and other factors,
in
7
CA 02305911 2000-04-14
a preferred embodiment patient thickness is not determined explicitly, by
directly
solving the mathematical expressions set forth above. Rather, the thickness
values for
the respective pixel positions are determined from an experimentally
established, 4-
dimensional look-up table containing high and low x-ray attenuation measured
values,
density, and patient thickness. The experimental values in this look-up table
are found
using a calibration step phantom for %Fat and known human density values that
correspond to the %Fat values. The entire integral is solved by converting it
to a
summation with an angular step for the width of a pixel position. The
experimental
values for the QDR 4500A DXA system are incorporated in the body composition
option for that system made commercially available in this country in 1996,
and are
hereby incorporated by reference in this patent specification. Corresponding
values for
other systems can be derived using the corresponding methodology of step
phantom
measurements.
In a preferred embodiment, particularly suitable for DXA systems such as the
QDR 4500A, the body composition estimates that were made without directly
accounting for magnification effects can be used in a process that converts
them to
estimates that do account for this effect. In particular, a correction of
projected mass
to true mass is carried out in accordance with a preferred embodiment by using
another experimentally derived look-up table and linearly interpolating
corrected pixel
position values based on table entries. One example of this look-up table is:
1 1.01
2 7, 163, -54, 54
3 1.192 1.183 0 1.192 0 1.192
4 2.463 2.420 0 2.463 0 2.463
5 3.800 3.831 0 3.800 0 3.800
6 5.087 5.310 0 5.087 0 5.087
7 6.375 6.926 0 6.375 0 6.375
8 7.621 8.582 0 7.621 0 7.621
9 8.883 10.385 0 8.883 0 8.883
8
CA 02305911 2000-04-14
The values in the table above are factors applied to projected mass estimated
based on the body composition process commercially available in the option for
the
QDR 4500A system as of 1996. In that system, the whole body angle subtends
60°
(+/- 30° from the center of the fan-shaped x-ray distribution), where
this angle is the
result of combining the results of three separate passes along the length of
the patient
table, each pass using a narrower-angle, fan-shaped distribution of x-rays
positioned
relative to the table such as to effectively form a combined 60° fan-
shaped x-ray
distribution. For example, the first pass covers the range -30°/-
10°, the middle pass
covers the -10°/+10° range, and the third pass covers the
+10°/+30° range. It can be
expected that different correction factors would be required for the different
passes, but
in fact the 1996 process referred to above already accounts for angular
dependence of
the measurements by normalizing the physical size of each element 30 of x-ray
detector 28 regardless of pixel position, thus obviating a need for different
tables to
account for mass position corrections. If desired, rather than normalize the
measurements to account for angular dependence, the result can be achieved by
using
three separate, experimentally derived tables for the three passes with the
narrower-
angle distribution of x-rays.
Referring to the table above, the first column is line numbers. The first line
is
the version number, so that later versions, if any, can be applied to x-ray
data is
desired. Line 2 indicates the number of lines of correction factors (7 in this
example)
and the location of the three passes that make up a set of scan data for a
patient or
subject. In this example, 163 is the center pixel position of the middle pass,
its sum
with the number to the right ( 163-54=109) is the last pixel position in the
first pass,
and the sum with the last number to the right (163+54=217) is the first pixel
position
in the last pass. The pixels in a line are numbered starting at 0.
Each of lines 3-9 contains the correction factors, in the form of a projected
mass estimate (grams per pixel position) before correction, and a true mass.
The first
two numbers (1.192 and 1.183) are the projected and the true mass,
respectively. The
next two numbers (0 and 1.192) are a linear slope and a projected mass for the
first
pass with the narrower-angle x-ray distribution, where the slope (0) indicates
the linear
9
CA 02305911 2000-04-14
slope showing how the projected mass (1.192 in this case) varies as a function
of pixel
position number as one moves from one pixel position to another toward the
beginning
of the line. While in this example the linear slope is zero, in other examples
it need
not be zero. The last two numbers are the corresponding numbers for the third
pass,
S with the slope (0) indicating how the projected mass varies as a function of
pixel
position as one moves toward the end of the line for the third pass. It is
assumed in
this example that the slope for the middle pass also is 0.
With the table set forth above, the true mass T at any pixel position can be
calculated from the table entries using the relationship:
T = T1 + (M-M1)*[(T2-T1)/(M2-M1)]
where T2 and T1 are the true masses corresponding to the projected masses M2
and
M1. If an estimated projected mass M for a given pixel position is less than
the
projected mass in line 3 of the table (1.192), then M1 and T1 are take to be
0. If M is
greater than the projected mass in the last line of the table, then the last
two lines of
the table are used in the calculation of true mass.
In the more general case where the slopes are not 0, linear interpolation is
used
to calculate the projected mass for each line of data and each pixel position
within the
line, and the interpolated value of projected mass is used to determine which
line of
the table applies. Letting M1 and M2 be the interpolated values for the two
lines, and
letting T 1 and T2 be the interpolated values for the true mass using the same
linear
slope, then the above formula for T gives the corrected mass for the more
general
case.
From the table above, it is apparent that projected mass values below a
certain
threshold (approximately 3.8 grams) are mapped to lower true mass values for
the
respective pixel positions, and that projected mass values higher than the
threshold are
mapped to progressively higher true mass values for the respective pixel
position.
Lower projected mass values in the table are indicative of thinner mass
elements (i.e.,
shorter columns of matter through which the raypath for the respective pixel
position
passes). These thinner mass elements, that are undesirably magnified in known
prior
approaches, but are effectively de-magnified in accordance with the disclosure
herein,
CA 02305911 2000-04-14
using a computer implementation of the table set forth above. Similarly,
higher values
of projected mass are indicative of thicker mass elements (longer columns of
matter
through which respective raypaths pass on their way to the x-ray detector
elements).
These thicker mass elements are de-magnified in known prior approaches, but
are re-
magnified to represent better estimates of true mass values in accordance with
a
computer implementation of the table set forth above.
The region of interest subjected to the foregoing body composition analysis
can
be the entire body of a patient or a defined region thereof. Regional body
composition
estimates can be obtained by interactively graphically or otherwise defining
regions of
interest (ROI), for example on an x-ray image of the scanned body. In body
composition analysis, typical regions of interest are the limbs and the trunk.
As
illustrated in Figs. Sa and 6a for the example of a pencil beam scanner and a
region of
interest that is the arm of a supine patient on table 12, a dividing line for
the arm can
be drawn on an image of the patient on the basis of vertical raypaths from the
x-ray
source to the x-ray detector. However, in the same case for a system using a
fan-
shaped distribution of x-rays, the geometry differs, as illustrated in Figs.
Sb and 6b.
The raypaths of interest in this case are not vertical but oblique. When the
region of
interest .is the trunk, or the pelvis and leg regions, for example, the ROI
boundary lines
drawn on the screen displaying an image of the body should account for the
difference
in geometry of the relevant raypaths for pencil beam systems and systems using
a
divergent x-ray distribution such as the QDR 4500A. For example, a
modification as
illustrated in Fig. 6a has been found useful. This modification defines the
pelvis by
the illustrated triangle, the legs as the regions below the triangle and
inward of the
lines separating the arms, and the trunk as the area above the triangle and
inward of
the lines separating the arms.
The disclosed process and system have been implemented in a QDR 4500A
DXA scanner as generally illustrated in Fig. 7, where scanner 50 scans the
body of a
patient or an object to produce x-ray measurements, a computer processing unit
controls scanner 50 and processes x-ray measurements obtained thereby in
accordance
with the techniques described above under corresponding programming, a unit 54
11
- CA 02305911 2000-04-14
displays results such as in the form of images as in Figs. Sa and Sb and in
the form of
numeric results and graphs such as BMD estimates obtained from estimates from
populations matched by age andlor other characteristics, and units 52 and 54
communicate interactively with a user input unit 56. The actual physical
arrangement
of system components may differ from the functional illustration in Fig. 7.
The disclosure above is mainly in terms of body composition analysis of human
patients, but it should be clear that its approach is applicable in other
fields as well,
such as in body composition analysis of other subjects, such as live animals
and
carcasses. Finally, while a currently preferred embodiment has been described
in
detail above, it should be clear that variation that may be currently known or
that are
later developed or are later made possible by advances in technology also are
within
the scope of the appended claims also are contemplated and are within the
spirit of the
detailed disclosure.
12