Note: Descriptions are shown in the official language in which they were submitted.
CA 02325071 2000-11-02 ,
APPARATUS AND METHOD FOR COLLECTION AND
ANALYSIS OF WIRELESS SIGNAL PROPAGATION
IN A WIRELESS SYSTEM
BACKGROUND OF THE INVENTION
The present invention relates to cellular telephone systems and to modeling
cellular telephone systems for optimizing utilization of the available overall
radio
spectrum. More particularly, the present invention relates to a reliable
performance
prediction based upon a measurement technique for unobtrusive gathering of
data about
the performance of the cellular system without interruption of normal
operation and for
complex analysis of the gathered data.
The service area of a wireless communications system is partitioned into
connected service domains known as cells, where radio telephone (cellular)
users
communicate, via radio links, with the base station serving the cell. The
cells can be
further partitioned into segments. The base station is coupled to the land
line network.
Presently available commercial mobile communication systems typically include
a plurality of fixed cells each of which transmits signals to and receives
signals from
mobile units within its communication area. In AMPS or FDMA systems, each base
station is assigned a plurality of channels (each 30KHz wide) within a
frequency
spectrum over which it can communicate with mobile units. A mobile unit within
range
of the base station communicates with the base station using these channels.
Typically,
the channels used by a base station are separated from one another in some
manner
CA 02325071 2000-11-02
(typically skipping 1, 7 or 21 intermediate channels) sufficiently that
signals on any
channel do not interfere with signals on another channel used by that base
station. To
accomplish this, an operator typically allots to a base station a group of
channels each of
which is widely separated from the next. So long as a mobile unit is within
the area in
which the signal from a base station is strong enough and is communicating
with only
that base station, there is no interference with the communication. The
present invention
will also operate with GSM and iDEN systems which do not rely on the same
frequency
divisions multiple access method.
In a common type of mobile system called Time Division Multiple Access
(TDMA), which includes IS-54 and IS-136, GSM and iDEN each frequency channel
is
further time divided into additional channels within each frequency. Each base
station
sends and receives in bursts during some number of different intervals or time
slots.
These time intervals within frequency bands then effectively constitute the
individual
channels. In order to distinguish the channel divisions within a frequency and
to
distinguish channels of a common frequency between overlapping cells digital
codes are
used. ~ For example, IS-136 utilizes Digital Verification Color Codes unique
to a channel
at a cell, are used. GSM uses Base Station identification codes.
In order to allow mobile units to transmit and receive telephone
communications
as the units travel over a wide geographic area, each cell is normally
physically
positioned so that its area of coverage is adjacent to and overlaps the areas
of coverage of
a number of other cells. When a mobile unit moves from an area covered by one
base
2
CA 02325071 2000-11-02
t
station to an area covered by another base station, communications with the
mobile unit
are transferred (handed off) from one base station to another in an area where
the
coverage from the adjoining cells overlaps. Because of this overlapping
coverage, the
channels allotted to the individual cells are carefully selected so that
adjoining cells do
not transmit or receive on the same channels. This separation is typically
accomplished
by assigning a group of widely separated non-interfering channels to some
central cell
and then assigning other groups of widely separated non-interfering channels
to the cells
surrounding that central cell using a pattern which does not reuse the same
channels for
the cells surrounding the central cell. The pattern of channel assignments
continues
similarly with the other cells adjoining the first group of cells. Often
adjacent or
overlapping cells will transmit on the same frequency and both will be
received by a
mobile wireless unit. However, because of the digital codes identifying each
channel, the
mobile wireless unit can process the appropriate signal and ignore any
additional
reception.
It is desirable to provide a process by which interference between cellular
telephone system channels operating at the same frequency and/or adjacent
frequencies
may be accurately predicted over each entire cell of an entire system based
upon dynamic
information corresponding to in-use performance and for adaptively
reallocating
channels based upon the in-use interference performance to maximize capacity
while
minimizing overall interference within the system.
3
CA 02325071 2000-11-02
SUMMARY OF THE INVENTION
The performance, in terms of service evaluation quality, is the goal of the
collection and analysis taught herein. The drive testing measures RF
propagation of a
cellular system. Performance quality is determined by the analysis of the
measured test
drive data. Drive testing is used to aid in evaluation of the system, to
determine cell
placement and channel distribution and to evaluate sector interference. A
cellular
service area is analyzed and a drive route is established. Determination of a
proper and
effective drive route is essential for proper system evaluation. The drive
route is based
on a complex analysis of the system, including its electronic and geographic
features.
Once a drive route is established, one or more vehicles are driven through the
cellular
system to collect data. The vehicles are provided with radio receivers for
detecting the
signal strength from the cell sites and with positioning equipment such as GPS
receivers
to determine the location corresponding to a received signal. The vehicle are
also
equipped with data collection equipment, such as computers for collection and
correlation of the data.
The measurement system is typically installed in a vehicle. Data is collected
as
the vehicle travels a predetermined route within the service area. The
measurement
system can also be used to collect data within a building, although this
requires a
different mechanism for providing the positioning information. The typical
measurement
system consists of a scanning receiver, GPS, and laptop computer. The scanning
receiver
produces signal level measurements for a predetermined list of channels while
the GPS
4
CA 02325071 2000-11-02
provides positioning (latitude/longitude) information. The laptop computer
logs the
signal level and positioning information during the measurement event.
A scanning receiver tuned to a particular frequency, cannot distinguish
between
separate signals on that same frequency and therefore does not have the
ability to
determine if a signal originates from one or more than one cell antenna in an
AMPS/FDMA system. Because of the overlap of signals when all of the cell sites
are
active, the test vehicles cannot accurately determine a signal level from a
given antenna
location. A received signal level may be the combination of signals from more
than one
base station. In order to avoid this problem when drive testing an AMPS
system,
individual antennas on each sector are keyed-up to a constantly transmitting
state on a
single particular frequency distinct from all of the other sectors. This is
commonly
referred to as a keyed-up or beacon signal. By tuning to a particular
frequency, a
receiver in a test vehicle can accurately determine the base station
corresponding to the
received signal and can determine the signal level from that single sector.
In key up testing, a unique test channel is established on each sector that
propagates into a measurement area. By establishing a unique test channel on a
sector,
measurements for the given channel can be positively associated to the source
sector.
This methodology for establishing the unique test channel requires
modifications to the
system. The test channel is placed in a mode such that it transmits a constant
signal,
which is referred to as a "key-up". In addition, the same channel (and
sometimes
adjacent channels) is turned off ("blocked") on all other sectors that
propagate into the
S
CA 02325071 2000-11-02
measurement area. The process of keying-up and blocking channels requires that
many
channels be removed from service to perform this measurement collection.
Therefore,
the measurement collection is limited to periods when there are few mobiles
operating in
the system, typically lOpm to Sam.
If the number of sectors that propagate into a measurement area is greater
than the
number of key-up channels available, a series of overlapping drives are
performed. In
this situation, a subset of sectors are assigned key-up channels while the
measurements
are performed in an area. The area is then re-driven with a different subset
of sectors
assigned key-up channels. This process is repeated until measurements have
been
obtained for each sector that propagates into the measurement area.
The goal of collecting measured data is to obtain a complete set of
measurements
at each location. Complete means that a measurement was achieved for each
sector, or it
was determined that the sector is below a signal level that can be detected by
the
scanning receiver.
In TDMA systems IS-54 and~IS-136, GSM and iDEN, the signal contains a
digital information component identifying the transmitting antenna of a
particular signal
on a common frequency. It is not necessary to key-up base stations in order to
distinguish cell site locations. A drive test can be performed during normal
operation of
the wireless system. The receiving equipment in the drive test vehicles can
determine the
transmitting sector based on the Digital Verification Color Code, DVCC,
assigned to
6
CA 02325071 2000-11-02
W
each sector. The wireless signal for data collection can be acquired by using
test
equipment designed for TDMA systems, such as the E747A TDMA Drive-Test System
from Agilent Technologies and the SeeGull Scanning Receiver from Dynamic
Telecommunications. The scanning receivers must be combined with control and
positioning equipment as well as data collection and management elements.
The scanning receiver is capable of performing measurements and decoding a
"color code" transmitted on a digital channel. The color code is a digital
signature
incorporated in information transmitted by the channel. By associating the
channel and
color code combination detected by the receiver to the combinations known to
exist on a
sector, the measured signal level can be associated to a particular sector.
This assumes
that each combination of channel and color code provides a unique identifier,
which can
be made possible with few modifications to the system.
The ability to decode the color code on a channel is affected by low signal
levels
and interference. The probability of decoding the color code diminishes due to
these
factors. Therefore the measurement system may not be capable of decoding a
color code
at some locations. The resulting data is incomplete due to gaps in the
measurements for
affected sectors.
In some systems, it is possible to increase the probability of obtaining a
color
code by attempting rapid decodes on every channel used on a sector. In
particular, when
7
CA 02325071 2000-11-02
.
the decode is affected by interference, it may be possible to obtain a decode
on a channel
not receiving interference. There are three likely situations when this could
occur:
First, if the interfering signal transitions into momentary fade this may
allow an
opportunity for reduction of the interference and to decode the signal on the
monitored
channel.
Second, the combination of channels used in the monitored sector may be
different than the channels used on the interfering sector, providing at least
one channel
not common to the monitored sector and the interfering sector and thus a
channel that is
not receiving interference.
Third, when channels become inactive when not carrying traffic, it is possible
to
obtain a non-interference opportunity on at least one channel of a the
monitored sector.
These techniques can significantly reduce, but not eliminate, the gaps in the
measurement data.
Even with TDMA, DVCC information obtained by drive testing can be
incomplete and/or inaccurate. For example, if all of the sectors and channels
of a
particular site are assigned, the receiving equipment could measure raw RF
power,
however, it may not be possible for the test equipment to identify a signal at
a given
location. Momentary systems anomalies can also create drop spots or holes in
reception
during drive testing, thereby interfering with the collection of signal level
measurements
on a cellular system utilizing a measurement system. Certain physical
conditions, such
a bridges and/or tunnels, can create reception anomalies and or increased
interference,
thereby effecting the normalization of data. Also, the reliability factor of
signal
8
CA 02325071 2000-11-02
measurement, taught herein as an error rate, can cause assignment of varying
analysis
weight to certain collected data.
The present invention teaches the implementation of data collection weighting
and geostatistical analysis techniques in the evaluation of collected drive
data. Originally
found in the field of mining and petroleum exploration the present invention
teaches the
application of geostatistical techniques to interpret sparse measurements. The
present
invention recognizes the applicability of these techniques to the evaluation
of drive test
data and teaches the method for application of geostatistical analysis to a
geospatial
region of a cellular system drive test. These robust techniques, when applied
as herein
taught, are capable of interpolating infomnation for locations where
measurements are
not available. The process considers the directional correlation of the data
to provide an
unbiased estimate. In particular, the use of Kriging honors the variable
nature of the data
in a geospatial relationship.
The applicability of geostatistics to geological exploration can be found for
example in United States Patent 5,729,451 to Gibbs, et al. Gibbs teaches a
data fusion
workstation apparatus and method which utilizes algorithms and can be used for
applications such as, e.g., hydrogeological modeling, steady-state
hydrological flow
modeling, transport uncertainty determination, flow/transport fusion, oil
reserve
management, water supply development and geo-technical engineering projects.
The use of geostatistical techniques, as taught herein, allow the gaps in the
9
CA 02325071 2000-11-02
measurement data to be interpolated, therefore resulting in a complete set of
measurements at each location. In addition, it is possible to interpolate
values in areas
where measurements where not attempted. For example, it is typically not
feasible to
obtain measurements for every street in a cellular network. These methods
would allow
values to be interpolated for streets not measured, and for locations between
roads.
Besides actual measurement values, there is information that can be used to
provide a more accurate interpolation. The interpolation algorithms can
utilize modeled
propagation values as secondary information to bolster the estimation. Also,
in cases
where it may not be possible to associate a measurement to a particular sector
(due to
inability to decode a color code), the measurement information can still be
used to
determine an upper bound of the signal level that would be present at a
location.
For example, control channels (and key-up channels) transmit a continuous
signal. When a measurement is obtained on these channels, it is assured that
the signal
level received by any sector using that channel in such a mode is below the
value
measured. This upper bound information can be incorporated in providing a more
accurate estimate.
These and other features of the invention will be better understood by
reference to
the detailed description which follows taken together with the drawings in
which like
elements are referred to by like designations throughout the several views.
,~ CA 02325071 2000-11-02
BRIEF DESCRIPTION OF THE DRAWINGS
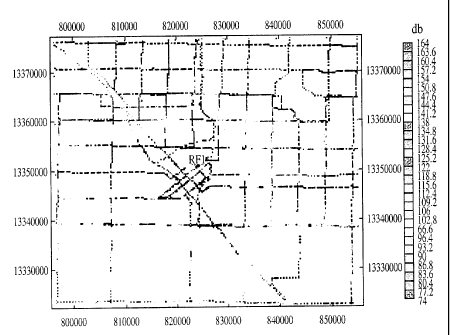
Figure 1 is an exemplary map of a portion of a cellular telephone system.
Figure 2 is an exemplary drive test planning map projected on the cellular
telephone system of Figure 1.
Figure 3 is an exemplary map of an area illustrating the location of six cell
sites
and an exemplary drive map plan for evaluation of the sites.
Figure 4 is a graphical view illustrating exemplary raw RF signal strength
data
obtained in an exemplary drive test for Figure 3.
Figure 5 is a graphical view illustrating exemplary successfully decoded
digital
code signals data obtained in an exemplary drive test for Figure 3.
Figure 6 illustrates the application of a bin grid to the test area.
Figure 7 is a variogram illustrating decreasing correlation with distance to a
sill.
Figure 8 is a diagram illustrating the filling in of missing data points using
the
geostatistical methods taught by the present invention.
Figure 9 is a diagram of the data of an exemplary drive test of after
geostatistical
interpretation.
DETAILED DE ~RIPTION OF EXEMPLARY EMBODIMENTS
Figures l and 3 illustrate exemplary street maps of portions of exemplary
cellular
systems. The maps of Figures 1 and 3 also illustrates the locations of a
plurality of
exemplary cell sites with base stations 13. The site may be divided into three
or more
segments by use of directional antennae. The sites could be divided into any
number of
11
CA 02325071 2000-11-02
~J
segments including a single segment per cell, three segments are illustrated
in Figure 1
only for the sake of example. The system may have additional not illustrated
cells 13
which overlap to provide effective coverage in the region of the cellular
system
illustrated in Figures 1 and/or 3.
Figure 2 illustrates an exemplary drive test route p1an15 overlayed on the
cellular
system illustrated in Figure 1. Figure 3 illustrates a drive test plan for the
system of cell
sites RF1 through RF6. The drive plan 15 is a carefully determined route which
will
provide maximum efficient coverage of the cellular system. The drive plan 15
is
established by evaluation of the distribution of the antennae 13 of the
cellular system and
through analysis of the geographical features of the area of the cellular
system. The drive
test planning criteria are more fully described in co-pending applications of
the common
assignee.
As detailed in copending applications, a vehicle equipped with appropriate
cellular signal receiving and measuring equipment is driven through the
cellular system
in accordance with the drive test plan map to collect actual signal reception
data. A
statistically significant number of measurements 17 are taken throughout the
cellular
system as illustrated in Figures 4 and S to determine the relative signal
strength between
each base station 13 and each mobile unit location. The path loss of the
signal is
measured in dB. As the strength of the received signal decreases, it has a
greater path
loss or signal loss which is recorded as greater positive dB number. For
example, in
Figure 8, the path loss measured at location 19 is between +94 and +1 l4dB (a
signal
12
l CA 02325071 2000-11-02
path loss drop of at least 94dB from the original signal strength at the
antenna). The
path loss at location 21, which is farther from the antenna RFI, is measured
between
+154 and +174dB (a signal loss drop of at least 154dB from the original signal
strength
at the antenna). The greater the positive number, the lower the signal
strength at the
measurement location. Area 23 is between 114 and 134 and area 25 is between
134 and
154.
A drive test cannot cover all of the area of a cellular system. Total drive
coverage
is both impractical and impossible. It is impractical because of the time and
resource
limitations in drive testing. It is impossible because some parts of a
cellular system are
inaccessible due to natural and man made obstacles. The data obtained by the
drive test
process is also incomplete even in the areas tested because of the inherent
imperfections
of actual measurement conditions, even if parts of the drive plan are driven
multiple
times. In most instances, if portions of the drive plan are driven more than
once,
repetition of a portion of a drive plan will accumulate differing results for
the same
mobile locations. These differences must be weighted and accounted.
Because cellular planning decisions including site location and channel
interference is currently determined based upon this imperfect data set, a
reliable and
robust method for interpretation of the drive test results must be used. The
present
invention teaches the techniques to be applied to drive test results to make
the best
determination from available data to estimate needed parameters. Because the
distribution of RF signal and channel allocation is complex, even a large data
set may not
13
CA 02325071 2000-11-02
's,",J
prove sufficient to resolve accurately the actual distribution properties that
determine the
cellular service quality performance. It is important that an analysis of the
data collected
during drive testing be performed to fill in the gaps in a manner which is
both accurate
and robust. The algorithm for resolving the data into a complete usable data
set must
also account for the error estimate of particular elements of the data set.
Geostatistical analysis techniques offer a way of describing the spatial
continuity
that is an essential feature of many natural phenomenon and provide
adaptations of
classical regression techniques to take advantage of this continuity. In
geostatistics, the
application of highly developed algorithms modified to the parameters of the
provision of
cellular service, as taught in the present invention yields significantly
enhanced results
over other data smoothing techniques.
The application of geostatistical techniques to the analysis of cellular
system
drive test data is a multi-part process. The process includes the following
elements for
interpretation of the collected data: binning, merging and kriging:
First the data is gathered through a drive test method. In a key-up method of
data
collection, Figure 4, the measured data will be raw RF power on a given
frequency as
measured at a particular location. This form of raw RF power collection will
yield a
number of RF power readings corresponding to the location of the power
reading. As
illustrated in Figure 4, measurement of RF power yields an almost continuous
set of data
because RF power will be detected even if the signal strength is weak or has
interference.
14
CA 02325071 2000-11-02
i
When measuring RF power on a given frequency, a test drive will yield results
at
almost all locations because the receiver will almost always receive a signal
reading,
down to the signal level threshold of detectable by the scanning receiver.
Therefore there
will be few actual measurement gaps in the set of data collected during a
drive test.
With the no-key up method of the present invention, Figure 5, the collection
equipment must not only determine signal strength but must also decode the
digital code
associated with the signal which identifies the digital channel and/or sending
antenna.
Accurately decoding a digital signal is more difficult than reception of raw
RF and
requires a stronger and/or clearer signal reception. The inability to decode a
digital code
due to signal strength, interference or other factors can lead to significant
gaps in the
data collection, as illustrated in Figure 5. The existence of gaps in the
collected data
gives rise to the need for the statistical interpretation of the data as
taught in the present
invention to fill in the gaps.
The measurement area is divided by a grid, Figure 6, into bins of a
predetermined
geographic area. The data collected, Figure 5, is grouped into bins of
physically close
data locations. All of the data points which lie within a single grid square
or bin are
averaged to determine a single value for each grid. This averaging of the data
reduces
distortions which could result from a greater number of measurements in some
areas and
a lesser concentration of measurements in other areas. When conducting a drive
test
sampling is performed at a constant rate, however, the rate of travel of the
sampling
vehicle may vary and therefore a greater number of samples will be obtained in
an area
IS
CA 02325071 2000-11-02
where the vehicle is traveling more slowly. Certain areas may be sampled at a
greater
density due to slow traffic or other factors and other areas may be sampled
less densely
due to fast traffic, bad reception or other factors.
After collection and averaging of the data by bins, the data is analyzed to
fill in
the missing data points with accurate estimations. In order to accurately
apply
geostatistical analysis techniques, such as Kriging, an evaluation of the data
to determine
the variance of data based upon the separation of the data points must be
performed and a
correlation of the variance based upon the size of the separation must be
determined
This analysis is referred to as the development of a variogram for the data
set.
By applying the teachings of the present invention it is possible to use a
DVCC
data sampling and obtain reliable results. The kriging model should account
for the trend
(path loss decay) in the variogram computation and modeling. RF propagation
exhibits
non-stationary (trend) properties which are accommodated in the analysis model
taught
herein.
A generalized data analysis workflow according to the present invention
includes:
variogram analysis: trend, short scale, omnidirectional, anisotropy
(directional correlation
in data); variograrn modeling; kriging interpolation; Post Analysis:
histograms and cross-
plots.
Development of an appropriate variogram requires a spatial continuity model.
16
CA 02325071 2000-11-02
i~ y
The purpose of spatial continuity analysis is to quantify the variability of
Path Loss
measurements with respect to distance and direction. Geographic location is
considered
when the data exhibit a directional correlation, a property known as
anisotropy.
Quantifying the spatial information involves comparing data values measured at
one location with values of the same attribute measured at other locations.
For example,
two path loss measurements in close proximity are more likely to have similar
values
than two path loss measurements further apart. By determining the correlation
with
respect to separation distance; estimates of the unmeasured locations can be
made based
upon the values at the measured locations.
For each azimuth and lag (separation) distance studied, all measured values
can
be spatially correlated and expressed as a statistical value known as the
variogram, and is
calculated using the following expression:
Yrn~ = E ~Zc~~ _ Zc~+n>lz
2n
where:
Zc~~ = the sample location at xi
Zc,~+n~ - the sample location at xi + the lag distance, h
n = the number of data pairs
The variogram '~~,~ term is a measure of dissimilarity, or increasing variance
as a
function of distance. The variogram is the sum of the squared differences of
all data pairs
17
CA 02325071 2000-11-02
falling within a lag divided by twice the number of pairs found for that lag.
Computing
and plotting y~,~ as a function of increasing lag distance, h, results in a
plot of the
experimental variogram, Figure 7.
With increasing distance, y~h~ tends to reach a constant value known as the
sill
(the dashed horizontal line, Figure 7). For a variogram, the sill is the
variance (a2) of the
measured data. The distance at which the sill is reached by the variogram is
called the
range or correlation length. The sill and range are useful properties when
comparing
directional trends in the data. Figure 7 illustrates a hypothetical
anisotropic variogram
showing a short scale correlation range of 800 meters and a long scale range
of 2200 m.
Spatial continuity analysis is one of the most important steps in a
geostatistical
study, because it strongly influences the kriging and conditional simulation
results, and
associated uncertainties. Kriging and conditional simulation applications
require
knowledge of the variogram function for all-possible distances and azimuths.
This
requires a model of the experimental variogram in order to know the variance
at any
location, not just along specific inter-distance vectors corresponding to
angular/distance
classes.
To understand various aspects of the RF 1 variogram, different experimental
variograms are computed, including near range, long range anisotropic and long
range
omni-directional. The near range variogram and long range variograms for RF
18
CA 02325071 2000-11-02 -
demonstrate that RF data has an inherent trend of diminishing power as a
function of
distance. Data with an inherent trend is referred to as non-stationary and
will tend not to
flatten at the sill (variance = 1.0), rather it continues to increase in
variance with distance.
Non-stationarity is expected because Path Loss (signal) decays in Free Space
as
approximately 20 logo[R], where R is the distance from the antenna. Correct
variogram
modeling requires removal of the trend to avoid biasing the interpolated
values during
geostatistical analysis of the data.
The practice of cross-validation is used to test the "goodness" of the spatial
model
and the search ellipse design. The procedure compares re-estimated values with
measured values, just as one computes residuals between predicted and measured
values
in regression or analysis of variance.
After the variograms for the collected data are established, the data further
manipulated through Kriging interpolation to determine the values for the
missing data
locations. Contouring data by hand or by computer uses some type of
interpolation
procedure. There are many algorithms used in computer mapping, all requiring
some
criterion to be satisfied. Inverse weighted distance is a commonly used
mapping
algorithm and its formulation is easily understood. The weights used in the
interpolation
process are based on how far each control point (measured value) is from the
target
location (bin center). Thus, control points closest to the target location
receive higher
weights. However, if the data exhibit strong anisotropy, it does not hold that
the closest
control point should receive the greatest weight, rather more distant control
points need
19
CA 02325071 2000-11-02
i~
to have greater influence on the interpolated value.
Kriging is a geostatistical interpolation technique. It is a unique linear
weighted-
averaging method, similar to inverse weighted distance, but kriging weights
depend upon
the variogram model of spatial correlation.
Figure 8 illustrates the kriging results for the data collected as illustrated
in Figure
at all bin locations. Figure 9 illustrates the details of the downtown area in
the vicinity
of RF 1 of Figure 3.
Improvements in the application of geostatistical analysis techniques can be
made
by the use of Polar Coordinates to investigate trends and variogram
development, the
use of more complex data sets to investigate the effect of topography, water,
and other
physical factors. The use of co-kriging can be implemented to assist in the
quantitization
of minimum measurement error for improved approximation of unmeasured
locations
and to minimize the effects of drift and to determine optimum bin size
Although the present invention has been described in terms of preferred
embodiments, it will be appreciated that various modifications and
alterations, might be
made by those skilled in the art without departing from the spirit and scope
of the
invention. The above-described exemplary embodiments are therefore intended to
be
illustrative in all respects, rather than restrictive, of the present
invention. Thus the
present invention is capable of many variations in detailed implementation
that can be
CA 02325071 2000-11-02
~../ U
derived from the description contained herein. All such variations and
modifications are
considered to be within the scope and spirit of the present invention as
defined by the
following claims.
21