Note: Descriptions are shown in the official language in which they were submitted.
CA 02341021 2005-07-20
-1-
METHOD FOR DETERMINING WARP POTENTIAL IN WOOD
Field
The present invention relates to a method for determining warp
potential, such as crook and/or twist potential, in wood-including, without
limitation, trees, logs, processed logs, and lumber.
Background
Warp stability of lumber and wood products is an increasingly important
consideration. Three types of warp, known as crook, bow, and cup, can be
traced
to differential length change within a board. Figure 2 of Perstorper et al.,
Quality
of timber products from Norway spruce, WOOD SCI. TECH. 29 (1995), 339-352,
illustrates different types of warp. Crook refers
to in-plane, facewise curvature of wood relative to a longitudinal axis. Bow
refers
to in-plane facewise curvature relative to a longitudinal axis. Crook and bow
are
closely related and differ primarily according to the planar surface used to
define
the warp. Crook refers to in-plane, facewise curvature of wood relative to a
length axis. Twist, another type of warp, refers to a rotational instability
about an
axis of wood (usually the longitudinal axis). Twist appears to be associated
with
varying grain angle patterns (Brazier). Warp tendency apparently is influenced
by
a myriad of factors (see Table 1).
Table 1
Factor Reference Authors
Com ression wood Yin , Kretschmann, Bendtsen
D in stresses Martensson and Svensson
Earl ood vs, late Kifetew, Lindber , Wiklund; Pentane
wood
rain an le Balodis, Ormarsson
1o sw Ta for and Wa
Loagitudinal shrinkageOtmarsson; Simpson and Gerhardt; Ying,
Kretschmann, Bendtsen;
McAlister and Clark
Microfibril angle Barber and Meylan; Tang and Smith; Ying,
Kretschmann,
Bendtsen: Walker
Moisture content Si son and Gerhardt
Tents ~
radial and tangentialKifetew, Lindberg, Wiklund; Meylan
shrinks es
Specific ravity Pentane ; Yin , Kretschmann, Bendtsea
stress and strain Ormarsson; Sandland; Hsu and Tang; Fridley
and Tang: Simpson
and Gerhardt, Iruda ara' and Ha i i
CA 02341021 2001-02-16
WO 00/12230 PCTNS99/20048
-2-
Dimensional and warp stability have always been valued attributes.
Furthermore, new products emerging from dimension lumber, such as premium-
grade joists and studs, require superior dimensional and warp stability
performance. The ability to quantify warp potential of wood products would
enhance the capability of the forest products industry to service these
important
markets.
Moreover, inefficient processing of raw timber and lumber wastes
tremendous forest resources. Lumber warp reduces product grade and product
value. Additionally, warp-prone lumber and lumber products perform poorly in
uses or environments unsuitable for warp-prone wood. Millions of dollars are
wasted every year because no method exists for efficiently and accurately
detecting warp-prone lumber.
If warp-prone wood could be nondestructively identified during or prior to
processing and product placement, processing raw timber and lumber into wood
products would become more efficient. Raw logs could be culled prior to
manufacturing, and wood-products manufacturing processes could be altered to
direct raw lumber to various end products according to quality and value. For
example, warp-prone trees could be identified while standing in forests or
after
cutting, and processed into products where warp is an irrelevant consideration
(e.g. paper products, chipping, etc.). Green warp-prone lumber could be
identified at the mill, separated, and kiln-dried using special warp-reducing
techniques (e.g. rapid-drying, high-heat drying, final steaming, restraint-
drying,
etc.). Lumber having low warp potential could be dried using simpler and more
economical methods.
Natural resources are unnecessarily wasted by using certain types of wood
in inappropriate applications. If warp tendency of raw logs could be
predicted,
then warp-prone logs could be processed differently. For example, warp-prone
logs could be cut into lumber with cuts being coordinated to reduce warp. The
orientation of boards taken from certain logs could be altered to reduce warp,
or
the thickness of the lumber could be varied, since thicker lumber generally
warps
less. Alternatively, warp-prone logs could be culled and processed for
specific
CA 02341021 2005-'07-20
-3-
uses (e.g. chipped, lumber for pallets, etc.). Lumber cut from warp-prone logs
also could be specially processed (e.g. special kiln drying techniques) or
used in
selected applications (e.g. relative constant moisture applications).
Additionally, warp-prone lumber could be identified for use in only certain
S applications. For example, exterior window and door casings experience
fluctuating moisture and temperature conditions during use. Warp prone lumber,
even if initially straight when dried, could warp in such changing
environments.
Consequently, if warp-prone lumber could be identified, its-use in warp-
inducing
environments could be avoided. Extremely warp-prone wood may be suitable
only for uses where warping is not a significant problem (e.g. for pallets,
landscape applications, etc.). In such cases, warp-prone green lumber could be
processed without expensive drying techniques.
Warp stability has been studied from both the experimental and theoretical
viewpoints. For example, earlier studies explored the links between drying
warp
and certain lumber characteristics, such as knots, slope-of grain, and
juvenile
wood content [Beard, J . , et al. , Tlte influence of growth characteristics
on warp in
two structural grades of southern pine lumber, 43 FOREST PROD. J. 6, 51 (June
1993); Balodis, V . , In, fluence of Grain Angle on Twist in Seasoned Boards,
5
WOOD SCIENCfi 44-50 ( 1972)] . While some relationships were discovered, no .
commercially viable processes for detecting warp apparently have been
developed.
Others have attempted to mathematically model the mechanical phenomena
that govern warp instability. A general approach considers elastic, shrinkage,
creep, and mechanosorptive elements, including their anisotropic variability
and
temperature dependence. Such models are complicated. See, e.g., Ormarsson
(1995).
Matthews et al.'s United States Patent No. 4,606,645,
describes measuring fiber angle in a fibrous
solid material relative to three mutually orthogonal reference axes. The '645
patent is understood to teach the measuring and analysis of light reflected
from a
wood sample to determine the grain angle of the sample. These measurements are
CA 0234102,11 2005'-07-20
-4_
then understood to be used in evaluating the strength of the wood. This
reference
is. not understood to relate to determining warp potential of wood.
Kliger et al. teaches a destructive method for analyzing a board.
Longitudinal shrinkage was determined by cutting sticks from a piece of
lumber,
S averaging the shrinkage of each stick to determine a single value for
longitudinal
shrinkage, and modeling crook. Kliger teaches only a fairly approximate method
for modeling crook. Kliger's method also depends on destroying the wood piece
to determine crook. Furthermore, the authors employed a model which specified
only a single radius of curvature whereas warp in wood can occur about more
than
one radius of curvature.
A practical and accurate method for predicting crook and bow has, despite
extensive efforts, not been developed. Additionally, the amount of information
which must be known to predict warp has proved daunting.
~ Summary
A method for determining warp potential of wood is described which addresses
the
needs and problems identified above. One embodiment comprises a method for
determining warp potential of wood, comprising nondestructively obtaining
lengthwise
shrinkage rate information of wood, the lengthwise shrinkage rate information
determined
using at least one measuring location on the wood; nondestructively obtaining
at least one
grain angle of wood, the at least one grain angle determined using at least
one measuring
location on the wood; and analyzing warp the lengthwise shrinkage rate
information and at
least one grain angle to determine the warp potential of the piece of wood.
The method
can be practiced on softwoods, hardwoods, and combinations thereof.
30
CA 02341021 2005-07-20
4a
The method can comprise obtaitling lengthwise shrinkage rate and grain
angle information from a third party arid then determining warp potential, but
more likely involves actually measuring at least one lengthwise shrinkage rate
and
at least one grain angle. However, by determining a baseline value for
particular
wood, or a particular wood set, then the method of the present invention can
be
practiced by obtaining at least one lengthwise shrinkage rate, for example,
and
then comparing the measured value to the baseline to determine warp potential.
For example, wood having a higher lengthwise shrinkage rate than the
determined
baseline value for that wood or wood set would have a higher propensity for
warp.
CA 02341021 2001-02-16
WO 00/12230 PCTlUS99/20048
-5-
The method typically comprises measuring plural lengthwise shrinkage
rates and plural grain angles to determine warp potential. The method can be
practiced by determining longitudinal shrinkage differences that exist at
sections
along the length of a piece. A piece of lumber generally is warp stable if no
differences exist at any cross section along its length. Thus, the invention
can be
practiced by making two or more shrinkage measurements at each cross section
whose curvature or twist is being predicted.
If the wood comprises lumber, lengthwise shrinkage rate and grain angle
measurements typically are made on at least one planar surface of the lumber.
The method typically comprises determining lengthwise shrinkage rates and
grain
angles at at least two measuring locations separated by a predetermined
distance,
such as at substantially one-foot intervals along the lumber. The lengthwise
shrinkage rates and grain angles can be made at t:he same measuring locations
or
different measuring locations.
Particular embodiments of the present invention measure lengthwise
shrinkage rates and grain angles indirectly, such as by using electromagnetic
energy (e.g. infrared radiation, microwave radiation, electricity, light)
acoustic
energy (e.g. ultrasound), and combinations thereof. Working embodiments of the
method have used ultrasound energy and laser light to determine lengthwise
shrinkage rates and grain angles.
For example, one working embodiment measured the speeds of ultrasound
pulses across certain distances through wood having a certain moisture
content.
The speeds of the ultrasound pulses were used to determine (1) localized
modulus
of elasticity (MOE) measurements of the wood, which were then correlated to
the
lengthwise shrinkage rates; and (2) grain angles. In another example,
lengthwise
shrinkage rates were determined from speeds of ultrasound pulses using an
empirically derived formula (such as an exponential formula), and grain angles
were measured by determining differences between two ultrasound velocities.
Plural lengthwise shrinkage rates and plural grain angles also can be
30 determined using this method. Warp potential can then be correlated to
actual
empirically determined lengthwise shrinkage rates and grain angles. The method
CA 02341021 2005-07-20
of the present invention determines warp potential that correlates with actual
measured warp with an RZ value of at least 0.2, more typically about 0.5, and
preferably about 0.6 or greater.
Another embodiment of the present invention for nondestructively
determining warp potential in wood comprises providing a piece of wood having
at least one planar surface, positioning the piece of wood adjacent to a
device for
analyzing energy which has been imparted to the wood to determine at least one
lengthwise shrinkage rate and at least one grain angle. The warp potential of
the
piece of wood is then determined from the at least one lengthwise shrinkage
rate
and at least one grain angle. Electromagnetic energy (e.g. infrared radiation,
microwave radiation, electricity, light) acoustic energy (e.g. ultrasound),
and
combinations thereof can be used to determine lengthwise shrinkage rate and
grain
angle. Working embodiments generally used ultrasound energy. Lengthwise
shrinkage rates and grain angles are determined at predetermined intervals
along
the wood, generally at regularly spaced intervals along the wood, such as
substantially one-foot intervals.
One of ordinary skill in the art will recognize that the present invention
also is directed to commercial production of lumber or for silviculture
practices.
For example, such an embodiment can be used to determine lengthwise shrinkage
rates, grain angles, and warp potentials of raw logs having removed cants (to
provide at least one planar surface), or green lumber, during the milling
process.
CA 02341021 2005-07-20
6a
In various embodiments there is provided a method for determining warp
potential
in wood, comprising providing a piece of wood; positioning the piece of wood
adjacent to
a device for analyzing energy; imparting energy to the wood; analyzing the
energy after it
is imparted to the wood; and analyzing the energy to determine the warp
potential, the
analysis comprising determining at least one difference between plural grain
angles.
In various embodiments there is provided a method for cultivating, harvesting
and
processing trees, comprising nondestructively determining warp potential of
trees; and
cultivating, harvesting and processing trees based upon the determined warp
potential.
In various embodiments there is provided a method for determining warp
potential
of wood, comprising nondestructively and indirectly measuring at least one
lengthwise
shrinkage rate of wood using electromagnetic or acoustic energy;
nondestructively and
indirectly measuring plural grain angles of wood using electromagnetic or
acoustic energy,
the at least one lengthwise shrinkage rate and plural grain angles measured
using at least
one measuring location; determining a difference between plural grain angles;
and
analyzing the lengthwise shrinkage rate and the difference between plural
grain angles to
determine the warp potential of the piece of wood, where determining warp
potential
further comprises using a finite element model.
Still another embodiment of the present invention for nondestructively
determining
warp potential of wood comprises obtaining lengthwise shrinkage rates and
grain angles of
wood at plural measuring points along the wood and determining warp potential
of the
wood based on non-averaged lengthwise shrinkage rates and non-averaged grain
angles.
Watp potential is determined using a finite element model (FEM) such as the
formula
CA 02341021 2001-02-16
WO 00/12230 PCT/US99/20048
>-h,=~,(2{E}T(E]{E}-{E}T(E]{Eo}+}~}T~a'o}~y__~{u}T{F'}dy_ J{u}T{d~}dS-{D}'~{P}
n s
In which {u} _ [u v w]T, the displacement field
{s} _ [sX Ey sZ yxY yyT yZx ]T, the strain field
[E] = the material property matrix for an orthotropic material
{EO}, {60} = initial strains (including shrinkage induced strains) and
initial stresses
{F} _ [Fx FY FZ] ~~, body forces
f~} _ (c~x ~Y ~Z] ~~, surface tractions
{D} = nodal degrees of freedom of the board representation
{P} = loads applied to the degrees of freedom from the external
environment
S, V = surface area and volume of the board representation.
Cook, R. Malkus, D. and Plesha, M. Concepts and Applications of Finite
Element Analysis, 3'd Ed, John Wiley and Sons, New York, 1989.
A person of ordinary skill in the art will recognize that the method
15 described herein for determining warp potential can be automated. For
example,
a computer could be used to determine warp potential, lengthwise shrinkage
rates,
grain angles, or all three. Moreover, certain or all of the data acquiring
steps,
such as determining ultrasound velocities, can be automated.
Brief Description of the Drawings
FIG. 1 illustrates determining crook potential from lengthwise shrinkage
rates.
FIG. 2 illustrates one working embodiment of the invention.
FIG. 3 illustrates the correlation between measured crook versus predicted
crook and the effects of MOE and grain angle on the accuracy of determining
crook potential.
FIG. 4 illustrates the accuracy of infrared radiation to measure lengthwise
shrinkage rate.
CA 02341021 2001-02-16
WO 00/t2230 PCT/US99/20048
_g_
FIG. 5 illustrates a comparison between dry and green ultrasound
measurements .
FIG. 6 illustrates a relationship between longitudinal shrinkage rates and
distance from pith.
FIG. 7 illustrates measured longitudinal shrinkage rate trends for loblolly
pine based on distance from pith.
FIG. 8 illustrates a comparison of crook potential determined by the
present invention and crook predicted by another method.
FIG. 9 illustrates a comparison of crook potential determined by the
IO present invention and crook predicted by another method.
FIG. 10 illustrates a comparison of crook potential determined by the
present invention and crook predicted by another method.
FIGS. 11A-11B illustrate ultrasound profiles for crooked wood samples.
FIGS. 12A-12B illustrate ultrasound profiles for crooked and straight wood
15 samples.
FIGS. 13A-13B illustrate ultrasound profiles for crooked and straight wood
samples.
FIGS. 14A-14B illustrate a comparison between ultrasound profiles with
corresponding lengthwise shrinkage rate profiles..
20 FIG. 15 illustrates the relationship between lengthwise shrinkage rate and
MOE.
FIG. 16 illustrates mechanical bending MOE as a predictor of lengthwise
shrinkage rate.
FIG. 17 illustrates the relationship between lengthwise shrinkage rate and
25 ultrasound unit time.
FIG. 18 illustrates ultrasound velocity measured in green specimens as a
predictor of lengthwise shrinkage rate.
FIG. 19 illustrates ultrasound velocity measured in dry specimens as a
predictor of lengthwise shrinkage rate.
30 FIG. 20 illustrates data and equations relating bending MOE and
longitudinal shrinkage rate for two data sets
CA 02341021 2001-02-16
WO 00/12230 PCT/US99/20048
-9-
FIG. 21 illustrates data and equations relating ultrasound unit time and
lengthwise shrinkage rate for two data sets.
FIG. 22 illustrates the effect of grain angle on lengthwise shrinkage rate
based on tensor transformation.
FIGS. 23A-23C illustrates the accuracy of determined crook potentials for
2x4 inch plantation wood samples.
FIG. 24 illustrates the accuracy of determined crook potentials for 2x4 inch
hemlock samples at different moisture contents.
FIG. 25 portrays the DIMENS program as a functional flow-chart.
FIG. 26 illustrates a data grid for gathering grain angles.
FIG. 27 illustrates 3-by-3 data patches for gathering grain angles.
FIG. 28 illustrates grain angle measurements taken by a variety of devices.
FIG. 29 illustrates the correlation between determined twist potential and
measured twist.
FIG. 30 illustrates a dive angle profile for a twisted piece of wood.
FIG. 31 illustrates a dive angle profile for a straight piece of wood.
FIG. 32 illustrates a dive angle profile for another twisted piece of wood.
FIG. 33 illustrates typical ultrasound profiles for twisted and straight 2x4
inch boards.
FIG. 34 illustrates typical ultrasound profiles for a twisted and a straight
2x4 inch board.
FIG. 35 illustrates typical ultrasound profiles for a twisted and a straight
2x4 inch board.
FIG. 36 illustrates grain angle maps for a twisted and a straight 2x4 inch
board.
FIG. 37 illustrates effects of grain angle on ultrasound unit time and
swelling rate.
FIG. 38 illustrates using ultrasound to detect grain angle differences.
FIG. 39 illustrates typical ultrasound profiles for straight and twisted 2x6
inch boards.
FIG. 40 illustrates correlation between twist and ultrasound measurements
CA 02341021 2001-02-16
WO 00/12230 PCT/US99/20048
-10-
Detailed Descriptio~t
I. Introduction
Several different types of warp have been identified-crook, bow, cup, and
twist. Crook, bow, and cup result from differential lengthwise shrinkage
within
wood, while twist results from differential grain angles within wood.
Overall warp within a piece of wood depends primarily on the particular
types of warp known as crook and twist. Crook and twist are illustrated in
Figure
2 of Perstorper et al. Crook appears as a bend or curve along a particular
axis of
a piece of wood (usually the longitudinal axis) and results from differential
length
10 changes within the wood as the wood is dried. Crook also can be correlated
to
bow and cup. Twist is rotational distortion about a particular axis of a piece
of
wood (usually the longitudinal axis), and is a more complicated form of
dimensional instability than crook. Twist appears primarily associated with
spiral
grain. See, e.g., Brazier, An Assessment of the Incidence and Significance of
Spiral Grain in Young Conifer Trees, FOREST PROD. J., 308-312 (August 1965).
Despite many studies and research efforts, establishing a method for
practically detecting lengthwise shrinkage rates and grain angles, and thus a
way
to predict warp, has proved difficult. Certain aspects of the present
invention
concern the development of a finite element model (FEM) simulation of warp.
Causative factors of warp were identified to gain a fundamental understanding
of
warp mechanics, establish the relative importance of warp-related factors, and
develop a means to predict warp. This program employed warp measurements of
lumber from prior drying studies together with physical testing of the same
lumber
to quantify its mechanical properties.
A three-dimensional FEM for lumber (entitled DIMENS) was developed
which successfully and accurately determines warp potential based on
lengthwise
shrinkage rates and grain angles of wood. This model has provided a method for
determining the influence and importance of warp-related factors, determine
warp
potential, and predict what warp will result from a particular drying regime.
Determining warp potential provides a basis for predicting what actual
warp will occur during drying or during cycles of drying and wetting (such as
CA 02341021 2001-02-16
WO 00/12230 PCT/US99/20048
-11-
seasonal cycles). Once warp potential is determined, warp can be predicted
according to the rapidity, magnitude, and methods of drying. For example, if a
piece of wood will be quickly dried over a few days from 30% moisture content
(MC) to 11 % MC, warp can be predicted using the determined warp potential for
5 the piece. Additionally, the accuracy of the determined warp potential can
be
measured after drying by comparing the predicted warp to the actual warp of
the
piece.
In particular working embodiments, ultrasound propagation measurements
were used to determine warp potential. For continuity, all ultrasound
10 measurements discussed herein were performed with the testing device at a
single
frequency of detection. Multiple frequency testing could be performed, as
could
ultrasound measurements at a frequency other than that used for the
representation
embodiments described herein.
The method of the present invention can be practiced on any wood
15 resource used in the forest products industry, such as, but not limited to,
standing
trees, raw logs soon after harvesting, processed logs awaiting milling,
processed
lumber (such as planks, boards, and studs), manufactured wood products (such
as
plywood, oriented strand board, fiberboard, etc.), and engineered wood
products
(such as laminated veneer and finger jointed lumber). The wood may be
evaluated
20 in the forest, after loading onto a log truck for delivery, during
transport, at the
mill, or elsewhere. The method may be practiced on any type of wood, including
but not limited to, hardwoods, softwoods, and combinations thereof.
In one specific forest production application (which can be adapted for use
in for silviculture practices), the method of the present invention can be
used as an
25 aid to thinning forest stands. It is common for forests to have a high
density of
trees of the same or different species. Ecological competition (for sunlight,
water,
mineral resources, etc.) inhibits growth of densely populated forests.
Selective
cutting of forest stands (thinning) designates certain trees for harvesting
while
leaving others behind. Therefore, one embodiment of the present invention
30 comprises selective cutting of forest stands based on warp potential
determined for
wood of standing trees. Those trees having low warp potentials are selected
for
CA 02341021 2001-02-16
WO 00/12230 PCT/US99/20048
-12-
harvesting since the lumber produced from such trees will be of a higher
grade.
Trees having high warp potentials are not harvested and remain standing.
If a stand of trees is to be clear-cut, trees having high warp potentials can
be designated for early removal and processing for low-grade applications
(e.g.
5 wood for pallets, landscaping applications, chipping, etc.). The overall
quality of
trees remaining in the stand will increase, thus leading to a higher grade of
lumber
during the production process.
Timber, in the form of felled logs, also can be evaluated directly on-site
soon after harvesting. Logs can then be sorted and directed for site-specific
delivery, thus increasing delivery efficiency.
11. Determining Crook Potential
A. Introduction
Empirical studies and a finite element model (FEM) simulation have been
conducted to identify causative factors of crook from among a collection of
possible warp-related factors (see Table 1). These studies provided a
fundamental
understanding of warp mechanisms, established the relative importance of
causative factors, and allowed the development of a method for predicting
warp.
This program employed warp measurements of lumber from prior drying studies
20 and physical testing of the same lumber to quantify its mechanical
properties.
Crook potential of wood was determined using a pattern of local lengthwise
shrinkage rates within the wood. Acoustic velocity in wood, such as ultrasound
velocity in wood, was related to the magnitude of the wood's lengthwise
shrinkage
rates.
Localized measurement of acoustic velocity in wood, such as ultrasound
velocity in lumber, was used to quantify patterns of lengthwise shrinkage
rates in
sufficient detail to enable practical determinations of crook potential in the
wood.
As seen in FIG. l, lengthwise shrinkage rates can be measured at different
locations on a board and compiled to form a lengthwise shrinkage map (FIG.
lA).
30 This map can then be used to determine the crook potential of the piece
(FIG. IB).
FIG. 1B shows the determined crook potential (labelled "FEM prediction" in the
CA 02341021 2001-02-16
WO 00/12230 PCT/US99/20048
-13
graph legend) and the actual crook measured during different drying cycles. A
total of four different cycles were performed: two cycles of drying the wood
from
an environment of 90% relative humidity (RH) to an environment of 20% RH;
and two cycles of changing the relative humidity from 20 % RH to 90 % RH .
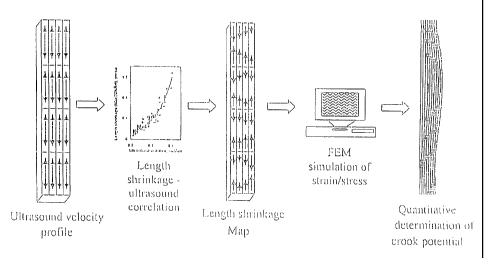
FIG. 2 provides an overall picture of one embodiment of the present
invention. Lengthwise shrinkage rates can be correlated to ultrasound
velocity.
Therefore, ultrasound velocity can be measured at locations on a piece of
wood,
such as a board, and compiled to form an ultrasound velocity profile. Once the
ultrasound-lengthwise shrinkage relationship is quantified, the ultrasound
velocity
profile can be converted into a lengthwise shrinkage map. The data comprising
the lengthwise shrinkage map can then be entered into a computerized finite
element model (FEM) simulation of strain and stress components of the board.
One such model described below is the DIMENS model. The FEM simulation
then quantitatively determines the crook potential for the piece of wood.
15 Once a crook potential is determined, the accuracy of that determination
can be assessed by comparing it to the actual crook. FIG. 3 shows that the
accuracy of the determined crook potential depends almost entirely on the
measured lengthwise shrinkage rates of the wood. FIG. 3 shows the measured
crook experienced by a board during a drying cycle. The board was dried from
20 18 percent moisture content (%MC) to 5 %MC by reducing the environmental
humidity from 90 % RH to 20 % RH . A highly crooked 36-inch region in the
middle of the board is set off by vertical lines. Crook potentials determined
using
four different FEM simulations are represented by dashed lines. Lengthwise
shrinkage rates were measured in each case, but the models differed according
to
25 whether other wood characteristics were actually measured or represented by
an
empirical constant. Under the first model (labeled "Measured E's & LS"), the
localized modulus of elasticity (MOE) measurements were made. Under the
second model (labeled "Constant E = 912,000 psi & Measured LS"), a constant
MOE of 912,000 pounds per square inch (psi) was used. Under the third model
30 (labeled "Constant E = 2,000,000 psi & Measured LS"), a constant MOE of
2,000,000 pounds per square inch (psi) was used. Under the fourth model,
CA 02341021 2001-02-16
WO 00/12230 PCT/US99/20048
-14
localized modulus of elasticity (MOE) measurements were made and the grain
angle for the entire piece was set to zero. As shown, the characteristics of
MOE
and grain angle had very little effect on the model's ability to determine
crook
potential. Therefore, crook potential can be accurately determined using
lengthwise shrinkage rate measurements in an FEM simulation.
Transmitting energy (such as acoustic energy) through wood is not the only
way to measure lengthwise shrinkage rates. Energy reflected from wood, such as
infrared radiation reflected off a planar surface of wood, also can be
correlated to
the magnitude of the wood's lengthwise shrinkage rates. As seen in FIG. 4,
localized infrared (IR) spectroscopic analysis of infrared radiation reflected
from
lumber can be used to quantify patterns of lengthwise shrinkage rates in
sufficient
detail to enable practical determinations of crook potential in the wood. FIG.
4
shows the relationship between shrinkage rates predicted based on IR
measurements and actual measured shrinkage that occurred during drying. IR
measurements were made using a near-IR spectrometer, the Field-Spec
spectrometer, obtained from Analytical Spectral Devices, Inc. of Boulder,
Colorado. Actual shrinkage was measured by exposing specimens to 90% RH,
drying to 20% RH, and then measuring actual shrinkage to the nearest //10,000
inch. FIG. 4 demonstrates that measuring lengthwise shrinkage rates using IR
spectroscopy is just as accurate as using ultrasound. Therefore, one
ordinarily
skilled in the art will understand that lengthwise shrinkage can be accurately
measured using a variety of techniques as described in more detail below, such
as
energy transmitted through wood or energy reflected from the surface of wood.
The measurement method, or methods, chosen will depend on cost, equipment
availability, expertise, harvesting or manufacturing methods, or other
considerations.
These and other aspects of the present invention are described below.
B. Terms and Phrases
The following definitions are provided for certain terms and phrases used
in this application. These definitions are provided solely for convenience,
and
CA 02341021 2001-02-16
WO 00/12230 PCT/US99/20048
-15
should not be construed to provide a meaning having a scope less than would be
understood by a person of ordinary skill in the art.
A lengthwise shrinkage rate is the shrinkage rate a particular segment of
wood undergoes during drying. There is an important distinction between
longitudinal and lengthwise shrinkage rates. Longitudinal shrinkage rate is
defined to be shrinkage along the axis of the wood fibers. Lengthwise
shrinkage
rate parallels the length axis of the piece, an axis of measurement that may
or may
not be precisely parallel to the fiber direction. Unless the grain angle is
zero
degrees with respect to a lengthwise shrinkage rage measurement, lengthwise
shrinkage rates are differentiated from longitudinal shrinkage rates. For
small
grain angles, the difference between lengthwise and longitudinal shrinkage
rates
will be small. As discussed later, if the grain angle exceeds 10 degrees, this
difference can become significant and may explain some scatter witnessed in
lengthwise shrinkage rate data.
Lengthwise shrinkage rate patterns also closely correlate with modulus of
elasticity (MOE) patterns. Modulus of elasticity is a solid property defined
to be
the ratio of stress-to-strain below the material's elastic limit obtained from
a
uniaxial test or a bending test. Local MOE variations can be used to predict
lengthwise shrinkage rate variations.
Determining warp potential depends on analyzing lengthwise shrinkage rate
and grain angle patterns. Such patterns can be determined by measuring
absolute
shrinkage rates and grain angles or from relative shrinkage patterns and
relative
grain angle patterns. Determining warp potential of wood does not require
measurement of absolute shrinkage rates, so long as the relative shrinkage
pattern
can be assessed
For example, a piece of lumber could have an absolute lengthwise
shrinkage rate at a first edge of 1.1 % and a lengthwise shrinkage rate at a
second
edge of 1.2 % . The relative shrinkage pattern would be 0.1 % . All other
pieces
having the identical relative shrinkage pattern would have the same magnitude
of
distortion, such as another piece having an absolute lengthwise shrinkage rate
at a
first edge of 2.4 % and a lengthwise shrinkage rate at a second edge of 2.5 %
.
CA 02341021 2001-02-16
WO 00/12230 PCT/US99/20048
-16
A person of ordinary skill in the art will readily appreciate that the method
of the present invention is useful for, but is not limited to, .analyzing warp
potential in lumber. "Lumber" includes wood products processed from raw logs
or timber, including planks and boards. Lumber also includes, again without
limitation, oriented strand board, fiberboard, paperboard products, straw-
based
products, etc. Alternative embodiments of the present method can be used to
evaluate warp potential of standing timber (i.e. growing trees prior to
harvest),
raw logs (i.e. harvested trees), and processed logs (i.e. logs made ready for
milling) .
An embodiment of the present invention can be used to determine crook
potential of cut logs. Lengthwise shrinkage patterns of cut logs can be
determined
by analyzing lengthwise shrinkage as measured at the ends of cut logs. Such
measurements can be made in the filed using, for example, spectroscopy.
Embodiments of the present invention use methods of light spectrometry to
infer
shrinkage patterns within the log's cross section by observing the ends of
logs.
Alternative embodiments infer shrinkage patterns at any wood cross section by
extracting and analyzing core samples of wood at that cross section.
An embodiment of the present invention can be used to determine crook
potential of wood having at least one planar surface, such as a log having a
planar
surface (i. e. , a cant) . Other alternative embodiments can determine warp
potential
of wood having plural major planar surfaces, such as a board or a plank. Still
other alternative embodiments can determine warp potential of standing trees,
such
as a tree having small portions of interior wood exposed to provide planar
surfaces
for measuring lengthwise shrinkage rates.
Lengthwise shrinkage rates can be measured at particular "measuring
locations" along the wood. A measuring location is understood to be a location
on
or within the wood where a lengthwise shrinkage rate is measured. For example,
working embodiments of the invention measured lengthwise shrinkage rates using
ultrasound velocity. Ultrasound velocity can be measured by sending an
ultrasound pulse through wood from a first transducer to a second transducer.
In
such an embodiment, the measuring location would be the segment of wood
CA 02341021 2001-02-16
WO 00/12230 PCT/US99/20048
-17
located substantially around and between the transducers comprising the path
of
the ultrasound pulse. A measuring location also can refer to a point or small
region on a piece, such as if an IR spectroscope probe is used.
Measuring locations may be separated by a predetermined distance.
Working embodiments employed measuring locations spaced along one or both
edges of a board by a predetermined distance of from about 12 to about 96
inches,
more typically from about 12 to about 48 inches. Still other alternative
embodiments use a predetermined distance of about a foot for separating
measuring locations along the lengthwise span of the board.
Separation distance can be determined for a particular application by
considering factors such as the spatial dimensions of the wood being studied,
type
of wood (e.g. hemlock, loblolly pine, etc.), and methods used to measure
lengthwise shrinkage rates. Not every measuring location needs to be separated
by the same predetermined distance, and predetermined distances may vary along
the axes of the wood. For example, as seen in FI(J. 1, measuring locations
were
spaced every foot along the length of the wood while spaced approximately
every
1.5 inches across the width of the wood. Moreover, one pair of measuring
locations might be separated along the edge of a board by a first distance
that is
the same, substantially the same as, greater than, or less than a second
separation
distance between a second pair of measuring locations.
As a general rule of thumb, working embodiments have established
measuring locations along a width axis by dividing the width by an integer of
from
about 3 to about 6, typically about 5, and the length axis by an integer of
from
about 10 to about 15, typically about 12.
FIG. lA shows lengthwise shrinkage rates taken at 32 such measuring
locations specified by eight length locations and four cross-width locations
on an
eight-foot long, 1 inch by 6 inch board from loblolly pine (i.e., pinus
taeda).
Working embodiments of the invention provide "nondestructive" methods
for determining crook potential in lumber. For example, ultrasound propagation
measurements were used to determine crook potential in a piece of wood (see,
e.g., FIG. 2). As another example, IR spectroscopy can be used to measure
CA 02341021 2001-02-16
WO 00/12230 PCT/US99/20048
-18
lengthwise shrinkage rates (see FIG. 4), and these lengthwise shrinkage rates
can
be used to determine crook potential in a piece of wood.
"Nondestructive" means that the wood used in practicing the present
invention is not significantly harmed or damaged and the piece is not
significantly
materially altered by the method of the present invention. For example, in
working embodiments of the present invention, lengthwise shrinkage rates were
established using energy transmission speeds or velocities, such as ultrasound
velocity. No material was removed from the piece of wood studied and the wood
was not damaged by practicing the method. By comparison, prior methods
10 determined lengthwise shrinkage rates by removing large segments of wood
(sometimes referred to as "sticks"} from the piece, or by cutting the wood
entirely
into smaller pieces, both of which methods significantly materially altered
the
piece of wood being studied. Such significant material alteration caused the
wood
to be destroyed entirely, or, at the very least, rendered useless for
structural
applications (see, e.g., Kliger et al.).
C. DIMENS Modet
A three-dimensional FEM for lumber, called DIMENS, was developed
which successfully and accurately determines crook potential given lengthwise
shrinkage rates. Additional information concerning the development of the
DIMENS model is provided below in Example 2.
The DIMENS model describes the strains that arise in a piece of lumber as
a result of the shrinkage that accompanies a change in moisture content. In
the
DIMENS model, local strains were initially determined by a number o~ localized
physical parameters, including moisture-related shrinkage coefficients, normal
and
shear moduli of elasticity, and fiber grain angles. It was later determined
that
crook is primarily related to the variation of lengthwise shrinkage rates (see
FIG.
3). In contrast, the magnitude and variation of other factors, including grain
angle
and MOE, have little effect on determining crook potential (see FIG. 3).
For example, crook potentials were determined using the DIMENS model
and particular constant MOE values selected from the range of from about
CA 02341021 2001-02-16
WO 00/12230 PCT/US99/20048
-19
200,000 psi to about 5,000,000 psi, more typically from about 500,000 psi to
about 2,000,000 psi, yet the variance of these crook potentials was
insignificant
(see FIG. 3}. The influence of grain angles apparently was captured in
measurements of lengthwise shrinkage rates, and hence crook potential can be
accurately determined by analyzing lengthwise shrinkage rates alone and
assuming
grain angles are already incorporated into the lengthwise shrinkage rate
measurements .
The DIMENS model provides a tool for studying the influence of factors
affecting dimensional stability of wood and to determine crook potential. Once
crook potential is determined, crook can be predicted for a piece of wood
undergoing a particular drying regime. Variations in lengthwise shrinkage
rates
across a piece of lumber were found to be the most important measurement in
determining crook potential.
Surprisingly and unexpectedly, measured local grain angle variations were
found to have only minor importance in determining crook potential (see FIG.
3,
model labeled "Angles = 0.0). In other words, grain angle had an insignificant
correlation to crook prediction, and incorporating grain angle into the DIMENS
model had a negligible effect on determining crook potential. This finding is
believed to support the idea that grain angles were captured in measurements
of
lengthwise shrinkage rates. Therefore, specifically incorporating local grain
angle
variations in the DIMENS model would, in essence, be accounting for grain
angle
a second time (in addition to its assumed inclusion in lengthwise shrinkage
rate
measurements) .
Mechanosorptive effects, creep, and other time-dependent complexities of
wood behavior could also be ignored in determining crook potential.
Lengthwise shrinkage rates were found to be closely related to ultrasound
velocity in both dry and green samples. FIG. 5 demonstrates that ultrasound
unit
time ("unit time" the inverse of velocity) in dry wood is closely correlated
to
ultrasound unit time in green wood, though ultrasound travels faster in dry
wood.
For example, an ultrasound unit time of 0.30 sec/km in dry wood corresponds to
an ultrasound unit time of about 0.40 sec/km in green wood. Ultrasound
CA 02341021 2001-02-16
WO 00/12230 PCT/US99/20048
-20-
velocities were measured in 2-foot specimens of green and dry wood by setting
the
transducers at each end of the specimen and measuring velocity of ultrasound
transmission through the specimens.
Distance from pith does not appear to be a reliable predictor of within-
5 board shrinkage rates as demonstrated by FIGS. 6-8. FIG. 6 shows that
lengthwise shrinkage rates predicted according to distance from pith (i.e.
ring
from pith) vary considerably according to how the wood is dried. The results
of
this study, labeled "FPL Data," were published in Ying, L., et al.,
Longitudinal
Shrinkage in Fast-Grown Loblolly Pine Plantation Wood, Forest Prod. J.
10 44(1):58-62 (1994). Since predicted lengthwise shrinkage rates varied
considerably according to drying regime, lengthwise shrinkage rates cannot be
accurately determined by measuring distance from pith.
FIG. 7 shows that lengthwise shrinkage rates predicted according to
distance from pith also vary considerably according to the height in the stem
of the
15 tree where the distance from pith measurements were taken. Four sets of
data
were collected. The FPL data set is the same as seen in FIG. G. Each of the
Weyerhaeuser data sets was collected by cutting 3-inch disks from Loblolly
pine at
the specified heights and removing quarter-inch thick diameter wafers from
those
disks. As clearly indicated by FIG. 7, lengthwise shrinkage rate predictions
based
20 on distance from pith measurements vary considerably according to height in
stem. For example, at a distance from pith of 5 rings, predicted longitudinal
shrinkage rates varied from about 0.00006 in./in./% MC to about 0.0003
in. /in./ % MC. Since predicted lengthwise shrinkage rates varied considerably
according to the height in stem at which distance from pith measurements were
25 taken, lengthwise shrinkage rates cannot be accurately determined by
measuring
distance from pith.
Crook potential has been successfully predicted by the DIMENS model
based on ultrasound velocity measurements of small samples cut from larger
boards. Determinations of crook potential based on ultrasound velocities
within
30 uncut boards also were possible. Additionally, ultrasound velocity
measurements
CA 02341021 2001-02-16
WO 00/12230 PCT/US99/20048
-21-
of both green wood and of dry wood can be used to predict crook tendencies in
lumber (see FIG. 5).
Support for the DIMENS model's results is provided in FIGS. 8-10, which
compare actual crook behavior with predictions of crook for the same boards
5 based on the crook potential determined by DIMENS. Actual crook was
measured by drying and re-moisturizing a particular board. In drying a board,
the
moisture content of the board was lowered from about 20 % db to about 5 % db
by
reducing the relative humidity (RH) of the environment from 90 % RH to 20
RH. Boards were re-moisturized by reversing the drying cycle-increasing the
10 relative humidity of the environment from about 20% RH to about 90% RH. The
three boards described in FIG. 8-10 were cut from second-thinning 24 year-old
loblolly pine. Crook potential was determined by DIMENS using specific
patterns
of lengthwise shrinkage rates. In FIG. 8-10, the determined crook potential is
indicated by a solid line labeled "strain model," actual crook measurements
are
15 indicated by thin solid lines, and crook predicted by the prior method of
Kliger et
al. is plotted using a dashed line (labeled "edge calculation").
The crook potentials shown in FIG. 8-10 were obtained from
measurements of lengthwise shrinkage rates and MOE on three different boards.
From each of these boards, a 36-inch long segment that contained the most
severe
20 crook was selected. Lengthwise shrinkage rates and MOE were measured on
each
of nine identically sized 12-inch long specimens sawn from each segment. As
shown in FIG. 8-10, these measured patterns provided calculated results in
excellent agreement with the actual crook. In other words, the crook potential
determined from measured lengthwise shrinkage rates accurately matched the
25 actual crook of the piece as the piece was dried or re-moisturized.
FIG. 3 shows that accuracy of determining crook potential is not greatly
affected if the pattern of MOE is assumed to be uniform throughout the piece
of
wood, or if the pattern of grain angles is entirely omitted. While a pattern
of
localized MOE measurements may be used to predict lengthwise shrinkage
30 patterns, practicing the method of the present invention does not require
determining an overall MOE for the entire piece of wood.
CA 02341021 2001-02-16
WO 00/12230 PCT/US99/20048
-22-
FIGS. 11-13 show that crook-prone lumber exhibits a recognizable
gradient, or trend, in lengthwise shrinkage rates across the width of the
board.
Boards that do not crook exhibit little or no such consistent trend. In each
figure,
ultrasound unit times-which, as described above, can be correlated to
lengthwise
5 shrinkage rates-were measured at regular intervals across the width of the
board
and down the length of the board. For example, FIG. 11A shaws ultrasound
measurements taken at one-inch intervals across the width of the board and one-
foot intervals down the length of the board. FIG. 13A shows ultrasound
measurements taken at two-inch intervals across the width of the board and
four-
10 foot intervals down the length of the board.
As seen from FIGS. 11-13, crook-prone lumber exhibits a recognizable
gradient, or trend, in lengthwise shrinkage rates across the width of the
piece
while straight lumber exhibits no such recognizable gradient. For example,
FIG.
12A shows Board #130173 with a measured crook of 1.4 inches. At length
15 position 84-96 inches, the ultrasound unit time declines from about 0.38
sec/km
(at a cross-width location of about 0 inches) to about 0.34 sec/km. With the
exception of one length location set of measurements (length position 72-84
inches), all ultrasound measurements at various length positions show a
similar
declining trend in ultrasound unit time across the width of the board.
20 In contrast, FIG. 12B shows Board #70506 which exhibited no crook. At
each length position, the ultrasound unit time at one edge of the board (cross-
width
location 0 inches) is substantially the same as the ultrasound unit time at
the other
edge of the board (cross-width location 3 inches). In other words, the
straight
board exhibited no recognizable gradient, or trend, in lengthwise shrinkage
rates
25 across the width of the piece.
Hypothetical FIG. 14 emphasizes the correlation between ultrasound unit
time and lengthwise shrinkage rates, assuming an exponential relationship as
seen
in FIG. 17. As FIG. 14 shows, a recognizable gradient, or trend, in ultrasound
unit time measurements across the width of a piece at one length position
would
30 correspond to a similar recognizable gradient, or trend, in lengthwise
shrinkage
CA 02341021 2001-02-16
WO 00/12230 PCT/US99/20048
-23-
rates across the width of the piece at the same length position. While this
relationship would not be linear, it would be consistent and measurable.
Wood with crook potential therefore can be identified by consistently lower
lengthwise shrinkage rates within one segment of the piece, and higher
lengthwise
5 shrinkage within another segment. However, since it is not possible to
directly
measure lengthwise shrinkage rates nondestructively, indirect methods have
been
developed to measure lengthwise shrinkage rates.
One such indirect method was developed by measurements on 12-inch long
specimens from the 36-inch board segments. 'this study revealed an inverse
10 relationship between lengthwise shrinkage rate and bending MOE, as shown in
FIGS. 15 and 16. Crook potential therefore can be determined from localized
MOE measurements.
FIG. 15 shows the correlation between lengthwise shrinkage rates and
MOE based on measurements taken on boards from 24 year-old loblolly pine.
15 The boards were cut into 12-inch sticks and subjected to drying by reducing
the
environment from 90 % RH to 20 % RH .
FIG. 16 demonstrates that the correlation between lengthwise shrinkage
rates and MOE does not vary according to height in stem (as opposed to the
variance seen in predicting lengthwise shrinkage rates based on distance from
pith
20 measurements; see FIG. 7). Wood samples were obtained in essentially the
same
manner as the wood illustrated in FIG. 15.
Determining crook potential BY localized MOE measurements is
inefficient because making rapid, non-destructive measurements of local
bending
MOE is difficult. However, MOE can be correlated to ultrasound velocity.
25 Based on the relationship between MOE and lengthwise shrinkage rates, it
was
determined that lengthwise shrinkage rates could also be correlated to
ultrasound
velocity. This MOE-lengthwise shrinkage rate relationship is discussed below.
Ultrasound scanning of a number of crooked and straight boards of varied
dimensions and from different raw material resources further confirmed that
30 lengthwise shrinkage rates could be correlated to ultrasound velocity.
Measurements were made using a commercially available Sylvatest~ apparatus,
CA 02341021 2001-02-16
WO 00/12230 PCT/US99/20048
-24-
available from Sandes SA, of Granges / Veveyse, Switzerland, which measures
the time-of flight of a 14-kHz ultrasound signal between handheld sender and
receiver probes. Other sounding, resonating or velocity testing devices may be
utilized, so long as the signal may properly propagate through the wood
sample.
5 The probes were positioned on the face of a board at predetermined distances
along the board length, and readings of lengthwise unit travel time were taken
at
measuring locations across the face and along the length of the board.
For raw logs, the probes could be correspondingly located on the surface
of the raw log or on the surface of the log from which a cant has been
removed.
10 Such measurements also can be taken along the lengths of standing trees.
Thus,
harvesting decisions could be made in the field. For example, crook prone
trees
could be harvested early during a thinning operation, which would produce
higher-grade lumber, whereas trees having less crook potential could be cut
later.
Determining crook potential provides a basis for predicting the actual
15 crook, which will occur during drying, or during cycles of drying and
wetting
(such as seasonal cycles). Once crook potential is determined, crook can be
predicted according to the rapidity, magnitude, and methods of drying. For
example, if the piece of wood will be quickly dried over a few days from 30
moisture content (MC) to 15 % moisture content (MC), crook can be predicted
20 using the determined crook potential for the piece. Actual crook has been
measured after drying and compared to the predicted crook to assess the
accuracy
of the determined crook potential for the particular piece (see, e.g., FIGS. 8-
10).
One of ordinary skill in the art will appreciate that DIMENS provides only
one basis for practicing the present invention. Alternative FEM's for
determining
2S crook potential could be developed using methods of the present invention.
D. Acoustic Energy
As discussed above, ultrasound velocities can be used to predict crook
potential. Ultrasound is one type of acoustic energy, having a frequency range
of
30 from about ten kHz to about several megahertz, that can be used to practice
the
present invention. Acoustic energy also includes frequency ranges other than
in
CA 02341021 2001-02-16
WO 00/12230 PCT/US99/20048
-25-
the ultrasound range. For example, stress waves, having a frequency range of
from about 100 Hz to the ultrasound range, also can be used to practice the
present invention. Generally, any acoustic energy having a wavelength less
than
that of the separation distance between two measuring locations can be used to
5 practice the present invention.
Ultrasound velocities may be measured in a variety of ways. A working
embodiment of the present invention employs ultrasound pulses. An ultrasound
velocity can be quantified by determining the transmission speed (i.e. the
speed at
which the pulse is transmitted through the wood) and the direction vector of
the
10 ultrasound pulse. Ultrasound velocity can be measured based on one
ultrasound
pulse or plural ultrasound pulses.
The use of acoustic energy is not limited to such devices, however. A
person of ordinary skill in the art will realize that other sounding or
resonating
devices, or other frequencies may be utilized, so long as the acoustic signal
may
15 properly propagate through the wood. For example, the commercially
available
Sylvatest apparatus employs acoustic signals in the upper end of the audible
range
of sound (about 14 kHz). In fact, any device which causes an acoustic signal
to
propagate through the wood may be used in the present invention, including
acoustic signals generated during harvesting, milling, or manufacturing, such
as
20 by a saw, planer, or sander.
Based on these results, a working embodiment of the invention employs a
measuring device to obtain velocity measurements of acoustic signals in wood.
For example, a commercially available Sylvatest~ apparatus, which measures the
time-of flight of a 14-kHz ultrasound signal between handheld sender and
receiver
25 probes, was used in working embodiments of the present invention. The
ultrasound measurements were then used to establish lengthwise shrinkage rates
in
the wood and thereby determine the crook potential.
For ease of use, all ultrasound measurements discussed herein were
performed with the testing device at a single frequency of detection. Multiple
30 frequency testing also could be performed, however.
CA 02341021 2001-02-16
WO 00/12230 PCT/US99/20048
-26-
Because the relationship between lengthwise shrinkage rates and ultrasound
unit times is nonlinear, differences in unit times may understate actual
differences
in lengthwise shrinkage rates. This discrepancy increases with longer unit
times
as illustrated by the hypothetical example of FIG. 14, which shows how a
smaller
5 gradient in unit time (at a higher average unit time) can correspond to a
larger
gradient in lengthwise shrinkage rate. Since determining crook potential is
based
on lengthwise shrinkage rates, it may sometimes be important to quantify the
shrinkage-ultrasound unit time relationship in order to properly interpret
ultrasound measurements and thus accurately determine crook potential.
10 Infrared (IR) radiation has also been used to measure lengthwise shrinkage
rates. Information about wood chemistry can be obtained by IR spectroscopy,
and
lengthwise shrinkage rates can be estimated from this chemical information.
Other methods of analyzing wood chemistry, such as nuclear magnetic resonance
(NMR) spectroscopy, could also be used in place of or in addition to IR
15 spectroscopy.
Other embodiments of the invention could determine lengthwise shrinkage
rates using any method capable of providing the desired information,
particularly
microfibril angle, including without limitation, microwave radiation,
electricity (to
measure dielectric potentials or in analyzing a pizoelectric effect), X-ray
20 diffraction (to measure microfibril angles), and combinations of these
methods.
One of ordinary skill in the art will recognize that methods of the present
invention can use a single type of energy or different types of energy in
combination. Some embodiments employ only one type of energy (e.g. ultrasound
only, infrared only, etc.), while other embodiments employ two or more types
of
25 energy in combination (e.g. ultrasound and infrared; ultrasound and
microwave;
infrared and microwave; ultrasound, infrared and microwave; etc.).
Another factor in the practical application of this method is the effect of
knots and other wood defects on energy transmissions, such as ultrasound
measurements. FIG. 17 demonstrates the effect of knots or other defects. Data
30 for this figure was collected from wood samples obtained in essentially the
same
manner as the wood illustrated in FIG. 15. In the lengthwise shrinkage
CA 02341021 2001-02-16
WO 00/12230 PCT/US99/20048
rate/ultrasound unit time relationship shown in FIG. 17, the two farthest-
outlying
data points (shown as solid symbols residing below the general correlation
curve)
were from specimens containing large knots. This suggests that knots
exaggerate
unit time, resulting in an overestimation of lengthwise shrinkage rates which
can
5 be compensated for to maintain accuracy in determining crook potential.
Knots and other wood defects can be detected by X-ray, such as the CAE-
Newnes XLG (x-ray lumber gauge) available from the CAE-Newnes company of
Richmond, British Columbia, Canada. or other detection methods. The effects of
knots or other defects can, however, be minimized and alleviated.
10
E. Automation of Method
Determining crook potential may be done by computer, in whole or in
part. Working embodiments used one or more computers to measure ultrasound
velocities, compute lengthwise shrinkage rates, and determine crook potential.
15 Alternative embodiments employ computers to determine crook potential by
processing previously obtained lengthwise shrinkage rates for a piece of wood
(e.g. lengthwise shrinkage rate data supplied by a third party). Still other
embodiments employ one or more computers solely for FEM modeling to
determine crook potential.
20
F. Green versus Dry Wood
A set of ultrasound measurements made on a collection of specimens both
before and after drying demonstrates that ultrasound measurements of green and
dry lumber are closely related. As shown in FIGS. 18 and 19, the same
25 relationship between lengthwise shrinkage rates and ultrasound velocity
measurements are seen in both green lumber and dry lumber. The data displayed
in these figures was collected using the same methods as those illustrated in
FIG.
16.
Therefore, the methods developed using dry lumber measurements are
30 applicable to green lumber as well.
CA 02341021 2001-02-16
WO 00!12230 PCT/US99/20048
-28-
Furthermore, the method of the present invention can be practiced on wood
having any moisture content. Alternative embodiments can be practiced on
pieces
of wood having moisture contents ranging from fresh cut (over 100 % MC) to
completely dry (about 0 % MC), more typically practiced on pieces of wood
5 having moisture contents ranging from about 0 % MC to about 50 % MC, even
more typically from about 4 % MC to about 20 % MC.
G. Bow and Cup
As described above, bow exhibits relationships similar to crook. See
10 Perstorper, et al. Therefore, determining bow potential based on lengthwise
shrinkage rates also is as feasible as determining crook potential.
Cup potential can be determined using the method of the present invention
as well. However, rather than measuring lengthwise shrinkage rates, such
embodiments employ measurements of transverse shrinkage rates. In all other
15 aspects, the analysis is the same as that for determining crook potential.
H. Examples
The following examples are provided to illustrate particular features of the
present invention. The scope of the present invention should not be limited to
20 those features exemplified.
Example #1: Ultrasound Measurements of Loblolly Pine
Results are shown in FIGS. 11-12 for 1x6 boards sawn from Mid-South
pruned second-thinning loblolly pine. Using a 12-inch probe separation,
25 ultrasound readings were taken at five locations across the width of the
board, at
predetermined one-foot intervals along the length of the board. The crooked
boards (FIG. 11A, 11B and 12A) characteristically exhibited relatively high
unit
times (i.e., greater lengthwise shrinkage rates) at or near one edge of the
board,
with a trend of unit time decreasing across the width toward the opposite
edge.
30 The straight board (FIG. 12B), in contrast, show no consistent trend across
the
width. FIG. 13 shows results for 16-ft. 2x8's from Mid-South second thinnings.
CA 02341021 2001-02-16
WO 00/12230 PCT/US99/20048
-29-
With longer boards, ultrasound unit times were measured using a 48-inch probe
separation.
Exan:ple #2: Developnzent of DIMENS Model
5 During drying, wood undergoes "drying strain." The mechanics of wood
drying strain potentially involves about four components of strain:
total = Emechanical + Eshrinkage + ~creep + ~mechanosorptive, (1)
where mechanical strain represents strains assumed to occur instantaneously as
load is applied. Shrinkage strains are a function of shrinkage coefficients
and
10 moisture change and are also assumed to occur instantaneously with moisture
change. Creep strains are time dependent deformations associated with
sustained
loads. Mechanosorptive strains are a result of an interdependency between
strains
and stresses induced during moisture change. Differential shrinkages
associated
with warp can cause all four types of strain to occur within a board.
15 Although dimensional instability problems associated with crook have been
studied over the years, the most significant recent advances and largest
technical
effort appear to have been undertaken at Lund University in Sweden by Omarsson
and others (Omarsson, S., A Finite Element Study of the Shape Stability of
Sawn
Timber Subjected to Moisture Variations, thesis, Division of Structural
Mechanics,
20 Lund Institute of Technology, Lund, Sweden (1995)). Among their advances
was
the development of a three-dimensional FEM built within the commercial program
ABAQUS (Hibbitt, Karlsson & Sorenson, Inc.., ABAQUS v. 5.4 (1994),
Pawtucket, RI) that included strain rates as shown in Eq. 2:
Etotal = ~mechanical + Eshrinkage + ~mechanosorptive, (2)
25 The model was designed to simulate dimensional instability through the kiln-
drying process. Moisture transport was computed using a two-dimensional linear
diffusion model. Elastic material properties and shrinkage coefficients were
computed and assigned to the finite element mesh using empirical relationships
based on radial distance from the pith. Grain angles were included in the
model to
30 simulate a uniform spiral grain. Verification of the determined warp
potentials
CA 02341021 2001-02-16
WO 00/12230 PCT/US99/20048
-30-
was limited to a favorable comparison with the measured warp patterns of seven
10-mm by 10-mm by 30-mm spruce specimens with different end-ring
configurations. The model predictions tended to follow warp profiles suggested
by intuition.
5 In contrast, the objectives of the study leading to the present invention
were pursued with exploratory testing programs, development of a stand-alone
three-dimensional finite element model (FEM), and analysis of data.
Data used were obtained from a set of nominal 1-inch thick loblolly pine
boards from the Mid-South subjected to post-drying humidity cycles of 20% RH-
10 23°C and 90% RH-23°C environments. These data are referred to
as the Stanish
Data Set (Stanish, M. Dimensionally Stable Building Materials, WEYERHAEUSER
INTERNAL SIGNIFICANT PRESENTATION ON PROJECT O42-1041 (1994),
Weyerhaeuser Technology Center, Tacoma, WA). Warp profiles were recorded
as the boards were cycled from one condition to another.
15 Another data set consisted of bending modulus of elasticity (MOE),
ultrasound, and lengthwise shrinkage rates measured from small clear-cut
samples
of Loblolly Pine taken from 40 trees covering 8 different regions in the
South.
This data set will be referred to as the Huang Data Set (Huang, C.L., Regional
Wood Quality Differences of Loblolly Pine Plantations (199 }, WEYERHAEUSER
20 INTERNAL TECHNICAL REPORT, Weyerhaeuser Technology Center, Tacoma, WA).
The FEM of the present invention is a three-dimensional model utilizing
20-node isoparametric elements with orthotropic material properties referred
to as
DIMENS. The DIMENS model is a linear, elastic model with no time dependent
strains and with total strain initially computed as shown in Eq. 3:
25 Etotal = ~mechanical + Eshrinkage.
This approach was chosen because the Stanish data set showed that warp
profiles
tend to repeat in shape and magnitude through repeated moisture cycles,
suggesting that creep and mechanosorptive effects were not predominant for
these
conditions. Additionally, DIMENS provided a computationally simpler model.
30 These assumptions are not intended to suggest that creep and
mechanosorptive
effects can be ignored in all warp situations. However, in accordance with a
CA 02341021 2001-02-16
WO 00/12230 PCT/US99/20048
-31-
preferred embodiment of the present invention, creep and mechanosorptive
effects
can be ignored while still accurately determining crook potential. The model
included and ignored factors as shown in Table 2.
5 Table 2. Factors included and ignored in the DIMENS model
Factors Included Factors Ignored
Mechanical property variationsTime dependent effects such
element as creep
by element - primarily E
Grain an le variations Different dryin conditions
Uniform MC changes Temperature effects
Steady state shrinks a Variation of shrinkage rate
with MC
Lengthwise shrinkage rates are assumed to be constant over a wide range
of moisture contents. As shown in FIG. 6, this assumption is an approximation.
10 Lengthwise shrinkage rates from green to 15 %> EMC are much lower than
lengthwise shrinkage rates from 8% to oven dry. This difference can be taken
into account when using DIMENS to predict crook.
A mathematically correct model is established by comparison with a series
of closed-form solutions. The most significant aspect of DIMENS model
15 development was to establish a method of assigning elastic and shrinkage
properties to each finite element reflecting those properties in the actual
board
under consideration. Each finite element requires the assignment of,
~ modulus of elasticity in the L, R, T material directions (3 E values),
~ shear modulus in the LR, LT, RT planes (3 G values),
20 ~ Poisson's ratios in the LR, LT, RT planes (3 v values),
~ shrinkage rates in the L, R, T, LR, LT, RT directions (6 SR values),
~ fiber direction angles (2 values, surface and dive) and distance from the
pith to establish the ring angle.
To simplify data needs, typical property values for loblolly pine were used
25 for analysis except EL, SRS, and the 2 fiber direction angles as shown in
Table 3.
CA 02341021 2001-02-16
WO 00/12230 PCT/US99/20048
-32-
Table 3. Material Input Properties for Finite Element Analysis
Property Value Source (see reference
section
for complete citationl
E~ Measured MOE from bending Measurement
test for
specimen
ER, ET 145,000 psi and 95,000 Bodig and Goodman
psi
GLR, Gm, 120,000 psi, 1 10,000 psi,Bodig and Goodman
Gflr
130,000 psi
<Fi, <LT, 0.13, 0.27, 0.35 Green and Kretschmann
<aT and
Bodig and Goodman
SRS Measured lengthwise shrinkageMeasurement
rate
or predicted from distance
from pith
SRR, SRT -495'" SR~2 + .139" SRS Based on work by Meylan
+ .00179
-600" SR~Z + .207 SRS +
.00259
SRLR, SRLT,0, 0, 0 Assumption as employed
by
SRar Omarsson
angles, measured for particular Measurements
board under
distance consideration
from
pith
SR~R, SR~.T and SRRT were set to zero, and SRa and SRT were adjusted according
5 to the value of SRL based on work by Meylan, B.A, Cause of High Longitudinal
Shrinkage in Wood, FOREST PRODUCTS JOURNAL, 18(4): 75-78 (1968). The
research effort focused on methods to predict E~ (modulus of elasticity in the
longitudinal material direction) and SRS. (shrinkage rate in the longitudinal
material
direction), and measurement of the fiber direction (grain) angles.
10 Three possibilities were initially present for predicting lengthwise
shrinkage rates: fibril angle, ring number from pith, and modulus of
elasticity.
Although the literature shows fibril angle to be highly correlated with
lengthwise
shrinkage rate (see Ying, et al.) the impracticality in measuring it in a
production
environment removed it from serious consideration.
15 Investigators at Lund University used ring number from the pith as a
predictor for longitudinal shrinkage (Ormarssan, et al., Influence ofAnnual
Ring
Orientation on Shape Stability of Sawn Timber, in QUALITY WOOD DRYING
THROUGH PROCESS MODELING AND NOVEL TECHNOLOGIES, PROCEEDINGS OF THE
ST" INTERNATIONAL IUFRP WOOD DRYING CONFERENCE (1996), 427-436). Data
20 from the USDA FS Forest Products Lab (Ping, et al.) and Weyerhaeuser
(Megraw, R.A., WOOD QUALITY FACTORS IN LOBLOLLY PINE, TAPPI Press,
Atlanta, GA (1985)) are shown in FIGS. 6-7. It is clear from FIG. 7 (FPL
Data),
CA 02341021 2001-02-16
WO 00/12230 PCT/US99/20048
-33-
that lengthwise shrinkage rates for loblolly pine cannot be solely a function
of ring
from pith as it also shows a high dependency on height in stem. FIG. 7 also
shows lengthwise shrinkage rates measured from the Huang data set. While the
trends shown in FIG. 7 may be present, considerable variability suggests that
ring
5 from pith and height in stem are not adequate predictors of lengthwise
shrinkage
rate.
Among the factors of specific gravity, rings per inch, ring from pith,
height in stem, and lengthwise modulus of elasticity (MOE), the latter was
initially
found to provide the strongest relationship with lengthwise shrinkage rates.
FIG.
10 20 shows the relationship observed in the Huang and Stanish data sets.
Lengthwise shrinkage rate can vary by more than an order of magnitude with the
highest shrinkage rates occurring only in samples with MOE values near the
minimum (less than 600,000 psi). FIG. 21 shows the correlation, observed in
the
Huang and Stanish data sets, between ultrasound unit time and lengthwise
15 shrinkage rates, thus emphasizing again the fact that lengthwise shrinkage
rates
can be accurately determined from ultrasound velocities.
In some studies, Huang measured ultrasound velocity when the specimens
were green and again after they were air dried to a uniform moisture content
ranging from 12 to 15 % . FIGS. 18-19 show the relationship between ultrasound
20 velocity (km/sec) and lengthwise shrinkage rate for green and dry states
respectively. The similarities between FIGS. 18 and 19 show that ultrasound
velocity measured either when the wood is green or dry are equally effective
in
determining lengthwise shrinkage rates.
Stresses and strains, including shrinkage induced strains, are second-order
25 Cartesian tensors and thus are assumed to obey the laws of tensor
transformation.
Therefore, the effect of grain angle on apparent lengthwise shrinkage rates
can be
computed. As grain angle increases, radial and/or tangential components of
shrinkage contribute and dramatically increase the observed lengthwise
shrinkage
rate. FIG. 22 shows this computed effect on lengthwise shrinkage rates for
grain
30 angles in the longitudinal-tangential plane.
CA 02341021 2001-02-16
WO 00/12230 PCT/US99I20048
-34-
Note that the range of measured lengthwise shrinkage rates from the Huang
data set cover the same range of values observed for grain angles from 0 to 35
degrees. Because of this anticipated strong influence of grain angle, grain
angle
measurements were sought as an input to the DIMENS model.
5 To aid development of the DIMENS model, 8 loblolly pine boards from
the Stanish data set were taken to obtain a more detailed set of measurements.
All
samples consisted of nominal 1-inch by 6-inch by 8 ft. boards with all
containing
one or more knots. The warp characteristics of these 8 boards were identified
as
three with high crook, two with high twist, and three that were straight.
10 A 36-inch high crook region in each board was identified and cut into nine
1.5-in. by 12-in. specimens. Modulus of elasticity, ultrasound (Sylvatest, 14
kHz), and length were measured at an MC of approximately S % for each 12-in.
specimen. Length changes were recorded as the specimens were cycled from
20 % RH to 90 % at 23 ° C . To capture the overal l trend in grain
angle with a
15 minimum of measurements, laser grain angle measurements were gathered every
7
inches. The laser scanner provided both in-plane surface and out-of-plane
surface
(dive) angle readings, something the other techniques could not provide.
Patches
of 9 readings were taken to capture and smooth the localized variation in
grain
angle.
20 The DIMENS model and test results were used to conduct four types of
analyses to determine crook potentials in a set of specific hoards from the
Stanish
data set. The four types of analyses distinguish different methods for
assigning
material properties to the each finite element as follows.
Type 1 Assign element E~ based on ring from pith and measured
25 full-length board MOE, predict element longitudinal
shrinkage rate (SRS,) from element E~, assign measured grain
angles to corresponding finite elements.
Type 2 Assign E~, and longitudinal shrinkage rate (SRS) to the
corresponding element based on measurements of MOE and
30 lengthwise shrinkage rate (LSR), respectively, from nine
CA 02341021 2001-02-16
WO 00/12230 PCT/US99/20048
-35-
1.5-in by i2-in specimens cut from a high warp 36-inch
section of the subject board, assign all grain angles as 0Ø
Type 3 Assign EL based on the measured MOE from the small
specimens and assign SRS based on the LSR predicted from
MOE, assign all grain angles as 0Ø
Type 4 Assign EL to each finite element based on the average board
MOE and use ultrasound measurements to predict a
corresponding value of LSR, assign the LSR's to the finite
element SRL's with all grain angles assigned as 0Ø
10 Analyses were conducted on 36-inch samples of high warp boards from the
Stanish data set (except where noted). Each board sample was separated into 12
elements across the 5.5-inch width, 1 element: through the 0.75-inch
thickness, and
12 elements along the 36-inch length for a total of 144 elements. Grain angles
were set to zero in Analysis Types 2 through 4 since it was believed that the
15 influence of grain angles was captured in measurements of lengthwise
shrinkage
rates.
Analysis Type 1 followed the logic employed at Lund University where
element properties and shrinkage assignments were dependent on ring from pith.
Results from analysis Type 1 did not accurately determine crook potential
proving
20 that location within log and averaged log property and shrinkage
characteristics
are insufficient warp prediction parameters. king from pith proved to be an
unreliable predictor of MOE and lengthwise shrinkage rate gradients were not
accurately predicted, resulting in consistently inaccurate determination of
crook
potentials.
25 Analysis Type 2 successfully determined crook potential based on
measured MOE's and measured lengthwise shrinkage rates assigned to the finite
elements. FIGS. 8-10 show the actual measured crook potential and computed
crook for three high crook boards. The actual crook shown in these figures
consists of the difference between the board shapes at 90 % RH and 20 % RH
after
30 two cycles of moisture exposure. Two straight boards (specimens 19-Sla and
2-
52c (profiles not shown)) were also analyzed by the same procedure. Determined
CA 02341021 2001-02-16
WO 00/12230 PCT/US99/20048
-36-
crook potentials were essentially straight and compared favorably with the
actual
measured crooks.
Analyses type 3 and 4 were directed at identifying methods to predict
lengthwise shrinkage rate gradients within boards via indirect, nondestructive
5 measurements. MOE and ultrasound measurements were explored as predictors
of lengthwise shrinkage rates for 12-inch samples cut from 8 boards from the
Stanish data set. Equations were fit to these data and those obtained from the
Huang data set.
FIG. 20 shows the data and resulting equations. Again, lengthwise
10 shrinkage rates are plotted as grain angles, knots and other growth defects
within
the 1.5-in by 12-in beams make direct measurement of true longitudinal
shrinkage
impossible. The best fit to the Huang and Stanish data sets are the following
equations 4 and 5:
LSRHuang - 0.00267e~ 6.349.r10 ~MOE+2.212.cI0mzMOEz) r and
15 LSR =0.00804e~ 8'500.r10-~MOE+7.084x10-~ZAfOEz-2.959.r10-~$MOE~+4.828210-
2SMOE4~ (5
S tan ialr
where LSR = Lengthwise shrinkage rate (in. /in. / % MC), and MOE = Modulus of
Elasticity (psi) measured from a bending test.
The Huang and Stanish data sets are each based on loblolly pine, but each
set of data was gathered at different moisture content (5 % vs. 12 % ). The
20 moisture content difference may explain the difference in the equations.
Similarly, equations were fit to ultrasound and lengthwise shrinkage rate
measurements as shown in FIG. 21. The best fit equations are equations 6, 7
and
8. Again, the data sets yield two different equations. In this case, the
ultrasound
measurements for the Stanish data set were measured at approximately 20 % MC
25 and the Huang data set was measured in the range of 12 to 15 % . The
ultrasound
unit arrival times would change by approximately 5 % to bring the values to a
common moisture content. Equations 6, 7 and 8 are as follows:
LrSR =3.059x10 4e~7'650x10-°(ltime~z."~+57.80Utinre~z.,.,'-
157.IUtime~z,;~~+1552.SUtimc~z~~,
Huang ,
LSRS ~n,.s,r = 9.43x10⁻⁶ e~1 °.4u'irn~2a ~ ) , and
30 LSRs,~nis~, - 7.681x10⁻⁶e~1''S.4U~imc~z",,)
CA 02341021 2001-02-16
WO 00/12230 PCT/US99/20048
-37-
where LSR = lengthwise shrinkage rate (in./in./%MC) and Utime = unit
ultrasound arrival time (sec./km) each measured on 12-in samples at the
approximate moisture content indicated.
Equations 5, 7 and 8 representing the Stanish data set were used to predict
5 lengthwise shrinkage rates based on measurements of MOE or unit ultrasound
arrival time for the three high crook profile boards. These predicted
lengthwise
shrinkage rates were assigned to corresponding finite elements, and Type 3 and
4
analyses were performed. FIGS. 8-10 show the determined crook potential and
the actual measured crook profiles.
10 Based on the three comparisons in FIGS. 8-10, ultrasonic unit arrival time
is as good or better than MOE as a predictor of lengthwise shrinkage rate.
The sensitivities of assigned MOE and grain angle on predicted crook
profiles were considered through a series of DIMENS simulations. Except as a
predictor of lengthwise shrinkage rate, the DIMENS model showed little
15 sensitivity to changes in the MOE.
Based on the results presented above, ultrasound unit arrival time is a
viable technique for detecting differential lengthwise shrinkage rates and
providing
a basis for determining crook potentials with the DIMENS model. Ultrasound
velocity patterns were measured on green 16-ft. 2x4's. These were converted to
20 lengthwise shrinkage rates, which were used in the DIMENS model to predict
crook potential for each piece. In each case, modulus of elasticity was set to
a
uniform 800,000 psi throughout the simulated board, grain angles were set to
0.0
and lengthwise shrinkage rates were predicted based on ultrasound
measurements.
In these additional analyses, ultrasound readings were gathered in-situ
without
25 cutting the boards. A comparison of measured and predicted warp profiles
for the
boards, as seen in FIG. 23, showed that the DIMENS model correctly determined
crook potential.
Therefore, ultrasound measurements can be used to determine crook
potential in lumber. From these predictions, decisions can be made concerning
30 how to process and use the lumber. For example, lumber with a predicted
crook
in excess of a threshold can be processed using special drying techniques and
then
CA 02341021 2001-02-16
WO 00/12230 PCT/US99/20048
-38-
sold for use in environments having relatively constant moisture or for warp
insensitive applications. Lumber or logs with a higher predicted crook
likewise
can be separated for particular cases.
FIG. 25 is a flowchart of a method used according to the DIMENS model.
5 While it is possible to compute the DIMENS model by hand or using a
calculator,
the model is usually embodied in the form of a computer program (102). For
example, working embodiments of the present invention use a DIMENS model
written in the FORTRAN programming language, compiled, and executed on a
commercially available personal computer running the Microsoft° Windows
95
10 operating system. Alternative embodiments of the computerized DIMENS model
are possible, such as models written in different programming languages or
compiled programs running on different computers running different operating
systems. One embodiment of the DIMENS computer program is listed in
Appendix A.
15 The DIMENS model offers the choice ( 104) of analyzing an already
existing FEM input file, or generating an FEM input file from independent
measurements such as lengthwise shrinkage rates and grain angles obtained from
ultrasound measurements. If the user chooses to analyze data, the user
supplies an
existing FEM input file, such as a file previously generated by the user or
20 someone else. If the user chooses to generate data, two options are
available to
the user. First, the user may supply the data independently, such as from a
separate source file (106). Second, the can be queried for basic board
information
(108).
In many embodiments, the user of the DIMENS program begins with an
25 independent database of lengthwise shrinkage rates (and possibly other
measurements) gathered from a particular piece of wood. The user may supply
this data ( 106), such as ultrasound measurements, which is converted and read
as
data maps of grain angle and longitudinal shrinkage rates (110).
Alternatively, the
DIMENS program may prompt the user for this basic board information (108).
30 Once the data maps of grain angle and longitudinal shrinkage rate are read,
the
model computes a finite element mesh to represent the board (1I2). Note that
the
CA 02341021 2001-02-16
WO 00/12230 PCT/US99/20048
-39-
grain angle can be set to zero in this model. The model then computes the pith
relative to the location of each finite element (112). In lumber, the location
of the
pith is determined according to ring number. Finally, the model generates a
graphic representation of the finite element mesh ( 116) and creates an FEM
input
5 file for analysis (118). At this point, the user has finished using the
DIMENS
model to generate the FEM input file (I28). I3owever, the user has the option
to-at that moment or any time later-use the FEM input file as a source file
fer
further analysis under the DIMENS model (1C14).
If the user chooses to continue further analysis (104), the DIMENS
10 program asks the user for a previously generated FEM input file (120), such
as the
file the user just generated. Alternatively, the user may designate any
suitable
FEM input file generated previously, such as an FEM input file generated by
another DIMENS program running on a different computer in a different
location.
After the FEM input file is designated as the source file for further
15 analysis, the program conducts an FEM analysis to compute displacements and
stresses throughout the finite element mesh (122). The analysis is based on 20-
node isoparametric elements yielding displacements and stresses through the
finite
element mesh (122). Based on these computed displacements and stresses, a
graphic representation of the deformed finite element mesh is generated (124),
20 which comprises a quantitative determination of crook potential, such as
the
graphic representation seen in FIG. 2. Finally, output files for further
processing
of finite element results are generated (126) and the program ends (128).
Example #3: Using Infrared Radiation to Measure Lengthwise shrinkage rates
25 Infrared (IR) energy may be used in addition to or in place of other
indirect
measurement methods, such as ultrasound energy, in measuring lengthwise
shrinkage rates. FIG. 4 shows the relationship between lengthwise shrinkage
rates
and actual measured shrinkage. The relationship between lengthwise shrinkage
rates and IR measurements exhibits a nonlinear characteristic similar to that
of the
30 relationship between lengthwise shrinkage rates and ultrasound measurements
(see
FIG. 17). These IR measurements were obtained by IR spectroscopy analysis,
CA 02341021 2001-02-16
WO 00/I2230 PCT/US99/20048
-40-
and predicted lengthwise shrinkage rates were determined by a PLS statistical
model derived from the IR spectra.
Example ~4: Comparison with Previous Methods
5 As stated above, Kliger et al. teaches a destructive method for
measuring longitudinal shrinkage and approximate method for modeling crook.
FIGS. 8-10 illustrate a comparison between the method of Kliger et al. (edge
calculation) and the method of the present invention (strain model) for
particular
boards. As can be readily seen in these figures, the method of the present
10 invention demonstrates a superior method for determining crook potential
compared to the method of Kliger et al.
To determine crook potential using the method of the present invention,
a procedure essentially similar to that of Example ~2 was followed. To
determine
the edge calculation of the method of Kliger et al. , an average lengthwise
15 shrinkage rate for each of the two edges was determined. The radius of
curvature
was calculated using the two averaged LSR's and geometric analysis. Crook for
the given board length was calculated using the radius of curvature.
In all boards, the method of the present. invention determined a crook
potential that more closely matched actual measured crook. In boards
exhibiting a
20 high amount of crook, the crook potential determined using the present
method
provided much better correlation to actual measured crook than the Kliger et
al.
method. For example, board 54-14A of FIG. 9 demonstrated highly variable
crook along the length of the board, exhibiting both positive and negative
crook
displacement. The present method determined a crook potential closely
correlated
25 to the actual measured crook, while the method of Kliger et al. incorrectly
predicted a negative crook displacement along the entire length of the board.
In another example, board 54-16A of FIG. 8 demonstrated high crook
displacement and a declining magnitude of crook displacement along the length
of
the board. The present method determined a crook potential that, when plotted,
30 closely matched the curve of the plotted actual crook displacement. The
Kliger et
CA 02341021 2001-02-16
WO 00/12230 PCT/US99/20048
-41-
al. method, however, did not correctly predict the same pattern of magnitude
in
actual crook displacement.
Example #5: Standing Timber and Harvested Logs
5 This example describes a method that can be used to practice the present
invention on standing trees. Acoustic measurements are made around the
perimeter of a standing tree at a measuring location, or locations, such as at
substantially 4-foot intervals along the long axis of the tree. These acoustic
measurements are then used to determine warp potential of the wood as
discussed
10 herein.
Alternatively, core samples can be taken from a standing tree.
Measurements, such as acoustic energy measurements, are then made along the
diameter of the core in the direction of the tracheids. These measurements are
then used to determine warp potential as described herein.
15
III. Determining Twist Potential
Twist refers to a rotational distortion of a piece of wood about an axis,
such as the longitudinal axis of a piece of lumber. Spiral grain is the
alignment of
wood tissues, particularly tracheids and fibers, at an angle relative to the
20 longitudinal axis of the stem (Brazier). The term "grain angle" refers to
the
alignment of wood tissues relative to some specified axis and includes spiral
grain
as well as other types of grain angle alignments. For example, diving grain
(another type of grain angle) occurs when fiber direction is not parallel to
the
longitudinal axis of a piece of lumber, but is either angled upward or
downward in
25 reference to the plane defining at least one face of the lumber, if the
lumber is
rectangular in cross-section (see Matthews et al.'s U.S. Patent No.
4,606,645).
The present invention provides a method for predicting what twist will
occur in a piece of wood. The invention comprises (1) obtaining at least one
grain
angle measurement of wood, and (2) determining twist potential of the wood
based
30 on the at least one grain angle.
CA 02341021 2001-02-16
WO 00/12230 PCT/US99/20048
-42-
Determining twist potential provides a basis for predicting what actual twist
will occur during drying or during cycles of drying and wetting (such as
seasonal
cycles). Once twist potential is determined, twist can be predicted according
to
the particular characteristics of drying such as drying time, extent,
temperature,
5 particular methods, etc. For example, if the piece will be quickly dried
over a
few days from 30% moisture content (MC) to 12% moisture content (MC),
predicted twist can be established using the determined twist potential for
the
piece.
10 A. Types of Wood
Any type of wood may be used in practicing the present invention. For
example, the method may be used on standing trees growing in a forest. Grain
angles of standing trees may be determined by the method of Foulger, A.N.,
Through-Bark Measurement of Grain Direction; Preliminary Results, FOREST
15 SCIENCE, 15(1):92-94 (1969). Twist potential can then be determined from
these
grain angle measurements.
The method also may be practiced on logs on-site immediately after
harvesting, during transport, at a mill, or anywhere during the production
process.
The method also may be practiced on lumber, including green lumber, at the
mill
20 or any other location in the production process. The present invention also
encompasses silviculture practices (such as selective harvesting and thinning)
and
wood product manufacturing processes where decisions regarding the use or
destination of wood are made after determining the twist potential of the
wood.
25 B. Measuring Grain Angle
1. Types of Energy and Devices
Grain angle can be measured using a variety of methods, and any device
and method suitable for measuring grain angle in wood may be used. As
described below, devices are commercially available that can be adapted for
30 measuring grain angle in accordance with the method of the present
invention.
CA 02341021 2005-07-20
-43-
Particular embodiments of the present invention determined grain angles
using acoustic energy, electromagnetic energy, electrical energy and
combinations
thereof. Working embodiments have, for example, used laser scanning methods,
including the apparatus of U.S. Patent No. 4,606,645,
_ to determine grain dive angles based on patterns of reflection
of laser light off the surface of wood. The use of laser-scanning devices is
illustrated by FIG. 26. In a working embodiment, laser grain angle
measurements
were gathered at three locations across the board (at the edges and in the
middle of
the board) every 7 inches along the length of a board. The laser scanner
provided
both in plane surface and out-of plane surface (dive) angle readings. In this
working embodiment, as illustrated in FIG. 28, grain angles were measured in
patches of 9 readings arranged in a 3-by-3 matrix with the intent to capture
and
smooth the localized variation in grain angle.
Other embodiments of the present invention measure spiral grain (a type of
grain angle) of trees or logs by analyzing patterns of bark or cambium. Spiral
grain of trees or logs also can be measured by cutting a planar surface
through the
bark and cambium into the wood of a tree or log and measuring the dive angle
patterns by laser scanner.
Additionally, the method of the present invention can be practiced by
observing the spiral grain patterns on the exterior surface of a log or fret.
The
grain angle patterns within the interior of a log or tree also can be
estimated using
acoustic velocities around the perimeter of the log or tree. A log or tree
where
these perimeter measurements vary significantly trill likely contain more warp
prone wood than a log or tree where these measurements are uniform.
Still other working embodiments use electricity to determine grain angles.
For example, working embodiments measure dielectric potentials of wood to
determine one or more grain angles. Such embodiments used the commercially
available Metriguardn Model 520 Grain Angle Indicator, which is available from
Metriguard, Inc. of Pullman, Washington, or other sinular devices.
FIG. 28 demonstrates that grain angle measurements can be accurately
determined using a variety of methods. This figure is based on data collected
by
CA 02341021 2001-02-16
WO 00/12230 PCT/US99/20048
_q.4_
scanning 1x6 inch boards cut from 24 year-old Loblolly pine. Laser scanning
was
accomplished by the method of U.S. Patent No. 4,606,645. Microscopic
measurements were taken by light microscope observation of the wood surface.
Dielectric measurements were taken using the Metriguard apparatus.
5 Other working embodiments use acoustic energy, particularly ultrasound
energy, to determine grain angles. Ultrasound is understood to mean sound
frequencies of about several hundred kilohertz to about several megahertz. For
continuity, all ultrasound measurements discussed herein were performed with
the
testing device at a single frequency, which was 14 kHz. However, different
10 ultrasound frequencies or plural ultrasound frequencies can be used with
the
method of the present invention.
Working embodiments measured the velocities of ultrasound pulses through
wood to determine one or more grain angles. Such embodiments used the
commercially available Sylvatest~ apparatus, which is available from
Sylvatest,
15 Inc.
The use of acoustic energy is not limited to such devices, however. A
person of ordinary skill in the art will realize that other sounding or
resonating
devices, or other frequencies may be utilized, so long as the acoustic signal
may
properly propagate through the wood. In fact, any device which causes an
20 acoustic signal to propagate through the wood may be used in the present
invention, including the acoustic signals generated in wood by a saw, planer,
or
sander during the milling process.
2. Nondestructive Measurements of Grain Angle
Previous methods for measuring grain angle (see, e.g., Brazier) were
25 destructive, whereas working embodiments of the present invention provide
nondestructive methods for determining crook and/or twist potential in lumber.
3. Ultrasound
Working embodiments of'the invention provide nondestructive methods for
measuring grain angle. In particular, ultrasound propagation measurements are
30 used to determine the twist potential for a piece of wood. For example,
FIG. 29
illustrates the twist potential determined using ultrasound versus the actual
CA 02341021 2001-02-16
WO 00/12230 PCT/US99/20048
-45-
measured twist for 16-foot boards cut from different types of wood (hemlock,
southern pine, and plantationwood) in different cross-sectional sizes. In each
case, twist potential was determined by averaging the differences in grain
angle
measurements taken at each edge of the board at the positions indicated along
the
5 length of the board. As shown, the determined twist potentials accurately
correlate to the actual measured twists with R' values of about 0.50.
When using ultrasound to measure grain angle, the effect of knots and
other defects (which can alter the ultrasound velocity or path and can
therefore
affect the unit time measurement) should be addressed. Localized defects, such
as
10 knots, generally have local impacts on the ultrasound signal. For example,
one
particular 2x6 specimen (#5256) had knotty regions near the 4-ft. and 8-ft.
locations, which coincide closely with anomalous spikes in the ultrasound
profiles.
Such "noise" can interfere with identification of edge-to-edge grain angle
variations. Thus, working embodiments of the present method that used
15 ultrasound to measure grain angle compensated for the noise to better
distinguish
twist-prone lumber. One way to compensate for such noise is simply to ignore
measurements with these anomalies. Another way to compensate for such noise
would be to use statistical algorithms, which reduce the significance of
anonomolous measurements.
20 A related issue concerns the span along the length of the board over which
the diagonal unit times are measured. For longer spans, or for thinner boards,
the
cross-diagonal paths become closer to parallel and consequently, the
difference in
the two unit times is reduced for any given grain angle. Therefore, for a
given
board thickness, the maximum feasible span is a function of the need to
maintain
25 significant unit time differences. A comparison of determined twist
potentials
using both 12-inch and 24-inch spans showed that either span could be used to
distinguish twist-prone pieces, at least for material that was two inches
thick.
4. Measuring locations
Grain angles can be measured at particular measuring locations along the
30 wood. A measuring location is understood to be a location on or within the
wood
where a grain angle is measured. For example, working embodiments of the
CA 02341021 2001-02-16
WO 00/12230 PCT/US99/20048
-46-
invention have measured grain angles according to ultrasound velocity.
Ultrasound velocity was measured by the elapsed travel time of an ultrasound
pulse through wood from a first transducer to a second transducer. In such an
embodiment, a measuring location would be the segment of wood located
5 substantially around and between the transducers.
Measuring locations may be separated by at least one predetermined
distance based on factors such as the spatial dimensions of the wood being
studied,
type of wood, and methods used to measure grain angles. Some working
embodiments employ measuring locations spaced along one or both edges of a
10 board by a predetermined distance of from about 12 to about 48 inches.
Alternative embodiments use a predetermined distance of about a foot for
separating measuring locations along the lengthwise span of the board.
Not every measuring location needs to be separated by the same
predetermined distance, and predetermined distances may vary along the axes of
15 the wood (See, e.g., FIG. 26). For example, measuring locations might be
spaced
every foot along the length of the wood while spaced by less than an inch
across
the width or face of the wood. In some embodiments, measuring locations may
touch or even overlap (see, e.g., FIG. 27 where each dark circle represents a
measuring location). Also a first pair of measuring locations may be separated
by
20 a first distance that is the same as, substantially the same as, longer or
shorter than
a second distance between a second pair of measuring locations.
For example, FIG. 30 shows an 8-foot long, 2-by-four inch SPF board
with measuring locations clustered at the edges of the board at one-foot
intervals
down the length of the board.
25
S. Grain Angle Measurements Obtained from Third Parties
Grain angles may be measured by the person, or persons, practicing the
invention (as described above). Grain angle measurements also may be obtained
from a third party. For example, the user of the invention could be a computer
30 technician who does not specifically measure grain angles in a piece of
wood, but
instead analyzes a collection of grain angles supplied by a third party.
CA 02341021 2001-02-16
WO 00/12230 PCT/US99/20048
-47-
C. Determining Twist Potential
Once the at least one grain angle is obtained, the twist potential for the
wood can be determined. The method of the present invention can employ one
5 grain angle or plural grain angles to determine twist potential. If plural
grain
angles are measured, the pattern of grain angles may be analyzed.
The twist potential of wood depends on the pattern grain angle within the
piece. As currently understood, twist potential appears to be related to the
edge-
to-edge grain angle variation within the board (as viewed from the face of the
10 board), such as the grain angle patterns illustrated in FIGS. 30-36. In
contrast,
straight boards (i.e. boards with substantially little or no twist) exhibit
little or
substantially no such edge-to-edge variation in grain angle, such as the grain
angle
pattern illustrated in FIGS 31, 33C, 34B, 35B and 36C.
In FIGS. 30-32, dive angles were measured by the laser-scattering method
15 of U.S. Patent No. 4,606,645. FIG. 33-35, grain angles were determined
using
the same ultrasonic technique illustrated in FIG. 37-38. The SPF studs were
purchased on the commercial market. Other boards were cut from 15 year-old
loblolly pine and mill-run hemlock.
The relationship between edge-to-edge grain angle variation and
20 determining twist potential can easily be seen by comparing FIG. 31 with
FIG. 32.
In FIG. 31, dive angles consistently vary across the width of the board. For
example, at length position 60 inches, grain angle at the lowest cross-width
location (approximately 0.4 inches) is approximately 3 degrees in the positive
direction, while the grain angle at the same length position at the highest
cross-
25 width location (approximately 3.1 inches) is approximately 3 degrees in the
negative direction. In contrast, the dive angles of FIG. 31 vary only slightly
across the width of the board and are consistently less than 2.5 degrees in
magnitude. This difference in edge-to-edge grain angle variation in twisted
versus
straight boards is further illustrated by comparing FIGS. 30, 33A-C, 34A-B,
35A-
30 B and 36A-C.
CA 02341021 2001-02-16
WO 00/12230 PCTNS99/20048
-48-
Lumber with a potential to twist therefore is identifiable by a consistently
lower grain angle (as viewed from the board's face, or wider surface) at or
near
one edge of the piece, and a higher grain angle at or near the opposite edge.
Not only can twist-prone pieces of wood be identified from determined
5 twist potentials, but particular twist-prone regions can be identified
within a piece
of wood when determining twist potential for the wood.
1. Edge-to-Edge Variation in Grain Angles Measured by Ultrasound
Working embodiments typically have used plural grain angles for detecting
10 edge-to-edge variation in grain angles across the face of a hoard. Sample
results
from such embodiments are shown in FIGS. 33-35 for a variety of board
dimensions and materials. Each graph of FIGS. 33-35 illustrates the difference
between cross-diagonal ultrasound unit time measurements taken along one edge
of a board with the difference observed along the other edge. Since ultrasound
15 velocity can be correlated to grain angle, edge-to-edge variation in
ultrasound
velocity indicates a similar edge-to-edge variation in grain angle. Ultrasound
scans of a number of twisted and straight boards of varied dimensions and from
different raw material sources confirmed the feasibility of distinguishing
twist-
prone lumber from stable lumber and serve to illustrate the method.
20 In twist-prone pieces (i.e. where twist potential was determined to be
higher than in straight pieces), the pattern of grain angles along one edge is
dissimilar to the pattern of grain angles along the other edge. In particular,
in
twist-prone pieces, the grain angles (as measured by ultrasound) along one
edge
are consistently higher or lower (in magnitude, direction or both) than the
grain
25 angles along the other edge. For example, FICJ. 33A shows such variation in
grain angles. The board of FIG. 33A (board #5) was an 8-foot long two-by-four
stud cut from hemlock. These ultrasound measurements were plotted as
differences between diagonal unit times as an indicator of grain angle (see
Example #2 below). Similar edge-to-edge variations in ultrasound measurements
30 also are seen in FIGS. 33B, 34A and 35A.
CA 02341021 2001-02-16
WO 00/12230 PCTNS99/20048
-49-
In straight, stable lumber, the pattern of grain angles along one edge is
similar to that along the other edge in terms of grain angle magnitude and
direction. For example, the board illustrated in FIG. 33C shows such a similar
relationship. The board of FIG. 33C was an g-foot long two-by-four inch stud
cut
5 from hemlock. Ultrasound measurements were taken along each edge and plotted
as differences between diagonal unit times as an indicator of grain angle (see
Example #2 below). Similar edge-to-edge consistency in ultrasound measurements
is also seen in FIGS. 34B and 35B as well.
10 2. Edge-to-Edge Variation in Grain Angles Measured by Laser Scattering
FIG. 36 shows that edge-to-edge variation in grain angles also can be
measured and detected by laser scattering. Here, grain angles were determined
by
dive angle measurements taken at locations substantially adjacent to the edges
of a
board. In particular, dive angle measurements were taken on eight-foot long
SPF
15 two-by-fours obtained from the commercial market. Dive angles were plotted
two-dimensionally. FIG. 36A shows the pattern of dive angles in the straight
board. Dive angles were generally less than 2 degrees in magnitude and no
consistent edge-to-edge variations existed. FIG. 36C shows the pattern of dive
angles in the twisted board. Dive angles were generally greater than 2 degrees
in
20 magnitude and, at each interval down the length of the board, a consistent
edge-to-
edge trend in dive angles was seen. For example, at the 12-inch length
location,
dive angles at the proximate cross-width locations (0.4 to 0.9 inches) were
about 2
degrees in the positive direction while dive angles at the distant cross-width
locations (2.6 to 3.1 inches) were 4 to 6 degrees in the negative direction.
25
D. After Determination of Twist Potential
If sufficiently accurate measurements are obtained, the resulting
information enables trim decisions to be made based on twist potential. That
is,
trimming may be utilized to eliminate highly unstable twisted ends, if such
30 twisting is severe enough to cause the entire length to be downgraded.
Other
processing techniques (such as kiln-drying under pressure) may be used.
CA 02341021 2001-02-16
WO 00/12230 PCT/US99/20048
-50-
Subsequently, actual twist can be measured after drying and compared to
the predicted twist based on the determined twist potential. The accuracy of
the
model used to determine twist potential can then be refined or extrapolated to
other similar pieces.
5
E. Silviculture
Twist potential can also be used in silvicultural practices and
manufacturing processes. For example, harvesting decisions for particular
stands
of trees could be made in the field. Trees having high twist potential could
be
10 thinned from a stand and directed to applications where the twist potential
of the
harvested would is not an important consideration (e.g. chipping, use as
lumber
for pallets, etc.). Under such a practice, the overall quality of wood in the
entire
stand would improve. Alternatively, in sustainable forestry practices, trees
having
low twist potentials could be harvested as a source of wood for structural
15 applications, leaving behind trees having high twist potentials.
Raw logs could be analyzed in the field and distributed to appropriate
destinations. For example, logs having high twist potentials could be sent to
paper
mills for processing while logs having low twist potentials could be sent to
lumber
mills for manufacturing into planks, boards, studs and other types of lumber.
20 Particular pieces of lumber could be analyzed for use in particularly
sensitive applications. For example, boards having very low twist potentials
could
be designated for further processing and manufacture into products used in
environments where humidity or rainfall amounts vary considerably.
Additionally, the method of the present invention could be practiced using
25 determined twist potential thresholds. A first threshold may be set (e.g.
an
average difference in diagonal unit times of 50 sec/km x 1000 across the
board)
with boards meeting or exceeding this threshold being separated out for
specific
handling and/or uses where twisting is not a significant concern. Also, boards
with a twist angle variation at a second higher level could be further
separated for
30 different handling. Any number of thresholds could be set with one of the
CA 02341021 2001-02-16
WO 00/12230 PCT/US99/20048
-51-
thresholds, for example, being triggered if the sign of the dive angle changes
across the board.
F. Examples
5 The following examples concerning twist are provided to illustrate
particular features of the present invention. The scope of the present
invention
should not be limited to those features exemplified.
Example #1: Laser-Scattering Detection of Grain Angle
10 FIGS. 30-32 illustrate the typical pattern of grain angle in twisted boards
as
compared to that in straight pieces. Twist was measured as the moisture
content
of the boards was altered by reducing the relative humidity (RH) from 90 % RH
to
20 % RH (causing a change in the wood's equilibrium moisture content from
about
20 % db to about 5 % db). Grain angles were measured on eight-foot long SPF
15 boards measuring two inches high by four inches wide. Fiber angles were
measured on the face of the boards at one-foot intervals using a laser
scattering
method (see U.S. Patent 4,606,645) which provides both the dive and surface
angle components of the fiber angle. FIGS. 26 and 27 illustrate the grid
pattern
used to make grain angle measurements.
20 Lumber that is prone to twist typically exhibited a recognizable trend of
increasing or decreasing fiber dive angle from one edge to the other edge
across
the face of the board. Boards that did not twist exhibited little or no such
consistent trend. In many twisted pieces, the sign of the dive angle changed
from
one edge of the board to the opposite edge (see, e.g., FIG. 30).
25
Example #2: Ultrasound Detection of Grain Angle
In testing for crook-prone lumber, ultrasound tests were conducted on
wood samples to determine ultrasound velocity, shrinkage, and grain angle
within
the wood samples. FIG. 37 illustrates that ultrasound unit time (inverse
velocity
30 measured in sec/km) increases with increasing grain angle. This
relationship
makes it possible to use ultrasound to detect variations in grain angle.
CA 02341021 2001-02-16
WO 00/12230 PCT/US99/20048
-52-
One way to detect grain angle differences, in particular, is illustrated in
FIG. 38. In this method, the ultrasound unit time of travel was measured on a
first path (A~-Bz} through the board from one face to the other face, and also
along
a second path (Az-B~) through the board from one face to the other face. If
the
5 grain angle is zero (FIG. 38A), each of the two cross-diagonal ultrasound
paths
are identical and the angles X and Y are identical. Therefore, the ultrasound
unit
times (inverse velocities) along these paths are identical. If the dive angle
is not
zero (FIG. 38B), the angles X and Y are different, and the ultrasound unit
times
along the two cross-diagonal paths are different. The relative values of these
two
10 ultrasound unit times will indicate the sign of the grain angle, and the
difference
between them will relate to the magnitude of the grain angle.
Consequently, twist potential for lumber will be indicated in general by
differences in ultrasound unit times taken at one or more measuring locations
on
the lumber. Additionally, a person practicing the present invention could
detect a
15 consistent trend of increasing or decreasing difference in ultrasound unit
times
along the first and second paths taken at measuring locations spread across
the
face of a board from edge to edge (see, e.g., F:IGS. 33-35). In many cases,
this
consistent trend appears as a change in direction of grain angles from the
positive
direction at one edge of the board to the negative direction at the other edge
of the
20 board, as shown in FIG. 37.
Example #3: Green Lumber
A number of the examples discussed above have used ultrasound
measurements from kiln-dried lumber samples. To predict the twist potential in
25 lumber prior to drying, working embodiments must necessarily rely on
ultrasound
measurements of green lumber. Results were obtained by applying a Sylvatest~
ultrasound test to sixty-one 16-ft. lengths of green 2x4 hemlock. The lumber
was
then kiln-dried and planed. Finally, the moisture content, crook, bow, and
twist
of each piece were measured.
30 This test confirmed that the same relation between twist potential and the
edge-to-edge differential in the diagonal unit time difference found in dry
pieces
CA 02341021 2001-02-16
WO 00/12230 PCT/US99/20048
-53-
exists in green lumber. Therefore, tests in green wood will predict warp
defects
in processed wood.
To compare the results from all 61 boards, an average edge-to-edge
differential was calculated for each board by averaging the differentials at
the five
5 measuring locations along each length. FIG. 13 shows how the measured dry
twist relates to the averaged green ultrasound data. An obvious correlation
appears, with a linear Rz of about 0.58. Although moderate scatter exists,
even
these simple average differentials are selective enough to serve as a useful
predictor of twist potential in green lumber.
10 Having illustrated and described the principles of our invention with
reference to several specific examples, it should be apparent that these
examples
may be varied in arrangement and detail without departing from these
principles.
CA 02341021 2001-02-16
WO 00/12230 -54- PCT/US99/20048
APPENDIX A
C*************************************************************
******
5 PROGRAM DIMENS
C*************************************************************
******
USE MSFLIB
C
10 C PROGRAM TO CREATE A SIMPLE RECTANGULAR MESH
AND DISPLAY IT
C LINEAR ELASTIC FNIITE ELEMENT ANALYSIS WITH
INITIAL STRAINS
C
15 C WRITTEN BY STEVEN CRAMER - UNIVERSITY OF
WISCONSIN - 1997
C WITH CONTRIBUTIONS FROM W . CHEN - 1986 AND
OTHERS - 1997
C
20 IMPLICIT DOUBLE PRECISION (A-H,O-Z), INTEGER(I-N)
CHARACTER*3 ANSWER
CHARACTER*1 AXIS
CHARACTER*70 WTITLE,FNAME
INTEGER*2 IHR,IDAY,IMIN,IMON,IYR,ISEC,Il00TH
25 LOGICAL ANALY,SHONODNO
COMMON/KONTRL/NUMNOD,NDOF,NELE,NNPE,NSD,NEQ,I
BAND
COMMON/LIMITS/MAXELE,MAXNOD
COMMON/CPDS/CORD(3,5000),FEXT(15000),disp(15000)
30
COMMON/BOARD/BODIMY,BODIMX,BODIMZ,YINC,XINC,ZINC,N
ELX, NELY, NELZ
COMMON/ELEM/KFIX(3,5000),LINK(20,2500),MAT(2500)
COMMON /MATRL / NMAT,RMAT(9,2500)
35 COMMON /DEVICE/ IIN,IOUT,IBUG,NGP,IWP,ITP,INP,IEP
COMMON/VIEW/AXIS,WTITLE,VIEWD,SHONODNO,ANALY,
SMAG
COMMON/INTR/IHR,IDAY,IMIN,IMON,IYR,ISEC,Il00TH
ANALY = . FALSE.
40 SMAG=0.0
C
C CONTROL SIZE OF WINDOW
C
CA 02341021 2001-02-16
WO 00/12230 PCT/US99/20048
-55-
CALL WSIZER !open file 10 as terminal window
C
C SET PROGRAM LIMITS
C
5 MAXNOD=5000
MAXELE = 2500
C
C SET PROGRAM CONTROL VALUES
C
10 NDOF = 3
NNPE=20
NSD=3
NGP=27
ITP=0
15 INP=1
IEP=1
C
C BRANCH BETWEEN ANALYSIS AND PROBLEM SETUP
MODE
20 C
WRITE( 10,2000)
READ(10,*) ANSWER
C ANALYSIS MODE
C*************************************************************
25 **
IF(ANSWER.EQ.'YES'.OR.ANSWER.EQ.'yes') THEN
WRITE( 10,2030)
WRITE(10,2010)
READ(10,*) FNAME
30 IIN = 5
IOUT=16
Do 7 I = 1,9
If (Fname(I:I) . EQ. ' .' )Goto 8
7 Continue
35 8 I = I-1
OPEN(S,FILE=Fname(:I) // '.dat') ! 5 & ?.dat = INPUT
OPEN(16,FILE=Fname(:I) // ' .out') ! 16 & ?.out =
OUTPUT
OPEN( 11, FILE = Fname( : I) / / ' . ang' ) ! 11 & ? . ang =
40 angles for plotting
OPEN(12,FILE=Fname(:I) // ' .plt') ! 12 & ?.plt = FOR
PLOTTING
CA 02341021 2001-02-16
WO 00/12230 PCT/US99/20048
-56-
OPEN(13,FILE=Fname(:I) // ' .crk') ! 13 & ?.crk =
displacements FOR PLOTTING
CALL READIN
C
5 C INITIALIZE DISPLACEMENT ARRAY
C
NEQ=NUMNOD*NDOF
DO 10 J=1,NEQ
DISP(J}=0.0
10 10 CONTINUE
C
CALL GETTIM(ihr,imin,isec,il00th)
CALL ANALYZE
CALL PLOTOUT
15 CALL TIMIT
ANALY = .TRUE.
CALL DRAWSECT
C going to need to work with planes
c three-D point plot is not visible in
AXUM
20 C
C OPEN TEXT/DATA FILES
C
C OPEN (S,FILE='ORTH03Dl.DAT')
C OPEN(S,FILE='TRYIN2.DAT')
25 c OPEN (6,FILE='ANGLES.DAZ")
C OPEN (16,FILE='DIMENS.OUT')
ELSE
C
C PROBLEM SETUP - MESH GENERATION AND PROPERTY
30 ASSIGNMENT
C*************************************************************
**
WRITE(10,2010)
READ(10,*) FNAME
35 WRITE(10,2020)
Dol7I= 1,9
If (Fname(I:I) .EQ. '.')Goto 18
17 Continue
18 I = I-1
40 IOUT =16
OPEN(16,FILE=Fname(:I) // ' .dat') ! 16 & ?.dat = output
OPEN(14,FILE=Fname(:I) // ' .gaa')
OPEN(15,FILE=Fname(:I) // ' .gab')
CA 02341021 2001-02-16
PCT/US99/20048
WO 00/12230
-57-
OPEN(13,FILE=Fname(:I} II ' .lse')
C 13 & ? .lse = measured shrinkage and E data
C SEE SUBROUTINE SHRNKEIN FOR MORE INFO ON
FILE
13
5 C 14 & ?.gaa = grain angle data on A Face
C 15 & ? . gab = grain angle data on B Face
C SEE SUBROUTINE ANGLES FOR MORE INFO ON FILES
14& 15
C
10 C DATA INPUT ROUTINE
C
CALL INDATA
CALL ANGLESIN
CALL SHRNKEIN
15 C
C GENERATE NODAL COORDINATES
C
CALL NODES
C
20 C GENERATE NODAL/ELEMENT CONNECTIVITY
CALL ELEMENTS
C
C READS AND ASSIGNS ANGLES & ASSIGN MATERIAL
PROPERTIES
TO
ELEMENTS
25 CALL MATERIAL
C
C COMPUTE NUMBER OF EQUATIONS
NEQ=NUMNOD*NDOF~
IIN =10
30 IOUT =16
C
C DRAW MESH TO SCREEN
CALL DRAWSECT
C
35 C WRITE TO OUTPUT FILE
CALL DUMP
ENDIF
C
2000
FORMAT(1X,'PROGRAM
DIMENS
-
DIMENSIONAL
40 STABILITY
ANALYSIS'
,
1 /,2X,' Do you wish to generate data or perform the
analysis?' ,
2 /,4X,'If ready to run analysis, type "yes"',
3 /,4X,'If generating data, type "no"')
CA 02341021 2001-02-16
WO 00/12230
-58-
PCT/US99/20048
2010 FORMAT(1X,'Enter file name with no extension')
2020 FORMAT{/,1X,' ********** PROBLEM SETUP MODE
**********')
2030 FORMAT(/,1X,' ********** CONDUCT ANALYSIS MODE
5 **********~
1 /,12X,' USE EXISTING DATA FILE' )
STOP
END
SUBROUTINE WSIZER
10 C
C WINDOW SIZER
C
USE MSFLIB
LOGICAL(4) RESULT
15 TYPE (QWINFO) WINFO
OPEN (lO,FILE='USER',TITLE='DIMENS -
DIMENSIONAL STABILITY')
C MAXIMIZE FRAME WINDOW
WINFO.TYPE=QWIN$MAX
20 RESULT=SETWSIZEQQ(QWIN$FRAMEWINDOW,
WINFO)
C MAXIMIZE CHILD WINDOW
RESULT = SETWSIZEQQ( lO,WINFO)
END
25 SUBROUTINE INDATA
C
C GENERATE INPUT DATA
C
IMPLICIT DOUBLE PRECISION (A-H,O-Z), INTEGER(I-N)
30
COMMON/BOARD/BODIMY,BODIMX,BODIMZ,YINC,XINC,ZINC,N
ELX,NELY,NELZ
COMMON/BOARD2/PITH(3,2),RPI(2),BASEE,RFAC,DELMOIST
WRITE(10,700)
35 READ(10,*) BODIMX,BODIMY,BODIMZ
WRITE(10,710)
READ(10,*) NELX,NELY,NELZ
YINC =BODIMY/DBLE(REAL(NELY))
XINC =BODIMX/DBLE(REAL(NELX))
40 ZINC =BODIMZ/DBLE(REAL(NELZ))
WRITE(10,720)
READ(10,*) PITH(1,1),PITH(2,1),PITH(3,1)
WRITE(10,730)
CA 02341021 2001-02-16
WO 00/12230
-59-
READ(10,*) PITH(1,2),PITH(2,2),PITH(3,2)
PCT/US99/20048
C WRITE(10,740)
C READ{10,*) RPI(1),RPI(2)
C WRITE(10,750)
5 C READ(10,*) BASEE
WRITE( 10,760)
WRITE(10,770)
READ(10,*) RFAC
WRITE(10,780)
10 READ(10,*) DELMOIST
C
C FORMAT STATEMENTS
C
700 FORMAT(2X,'Input board dimensions in X, Y, Z directions')
15 710 FORMAT(2X,'Input number of elements in X, Y, Z directions')
720 FORMAT(2X,' Input pith location at initial end in' ,
1' X, Y, Z coordinates')
730 FORMAT(2X,'Input pith location at terminating end in',
1' X, Y, Z coordinates' )
20 740 FORMAT(2X,' Input rings per inch at initial and terminating end' ,
1' of board')
750 FORMAT(2X,'Input base modulus of elasticity for board')
760 FORMAT(2X,' Are annual ring widths high and near constant or ' I 3x
1 'progress from pith, wide to narrow?')
25 770 FORMAT(2X,'Input a value between .1 and .1 where .1 = wide
and' /
1 ' constant rings and .4 = wide at pith progressing to narrow')
780 FORMAT(2X,'Input the change in moisture content for the board')
RETURN
30 END
SUBROUTINE READIN
IMPLICIT DOUBLE PRECISION (A-H,O-Z), INTEGER(I-N)
C
DIMENSION Z1(3),Z2(3),IZ(3)
35
COMMON/BOARD/BODIMY,BODIMX,BODIMZ,YINC,XINC,ZINC,N
ELX , NELY, NELZ
COMMON ICPDS/ CORD(3,5000),FEXT(15000),DISP(15000)
COMMON /ELEMI KFIX(3,5000),LINK(20,2500),MAT(2500)
40 COMMON /KONTRL/
NUMNOD,NDOF,NELE,NNPE,NSD,NEQ,IBAND
COMMON I MATRL I NMAT,RMAT(9,2500)
CA 02341021 2001-02-16
WO 00/12230
-60-
PCTNS99/20048
COMMON /SHRINK/
BETAM(3,2500),DELM(2500),EPSNAU(2500,6)
COMMON IQEI E(6,6),RA(3,3),ELM(6,6,2500),
1 PHI(2500),RHO(2500),AMDA(2500),C(6,6)
5 COMMON /DEVICE/ IIN,IOUT,IBUG,NGP,IWP,ITP,INP,IEP
C
C READ IN CONTROL INFORMATION
C
10 READ(IIN,*)NUMNOD,NDOF,NELE,NNPE,NSD,NMAT,NGP,IWP,IT
P,INP,IEP
READ(IIN,*)BODIMY,BODIMX,BODIMZ,YINC,XINC,ZINC,NE
LX,NELY,NELZ
C
15 C---- READ AND WRITE NODAL DATA
C
WRITE(IOUT,2000)
5 DO 30 I = l ,NUMNOD
READ(IIN,*)N,(Z1(J),J=1,3),(IZ(J),J=1,3),(Z2(J},J=1,3)
20 DO IO J =1,NSD
10 CORD(J,I)=Z1(J)
DO 20 J =1,NDOF
IF(IZ(J).EQ.O) KFIX(J,I)=1
IF(IZ(J).EQ.1) KFIX(J,I)=0
25 IF(IZ(J).EQ.2) KFIX(J,I)=2
20 FEXT((I-1)*NDOF+J)=Z2(J)
WRITE(IOUT,2001 )N,(Z 1 (J),J =1,3),(IZ(J),J =1,3),(Z2(J),J =1,3)
30 CONTINUE
C
30 C---- READ AND WRITE ELEMENT DATA
C
WRITE(IOUT,2002)
DO 40 I=1,NELE
READ(IIN,*)N,MAT(I),(LINK(J,I),J=1,NNPE)
35 WRITE(IOUT,2003)N,MAT(I),(I,INK(J,I),J=1,NNPE)
40 CONTINUE
C
C---- READ AND WRITE MATERIAL DATA
C
40 WRITE(IOUT,2004)
DO 50 I=1,NMAT
READ(IIN,*) N,(RMAT(J,I),J=1,9)
CA 02341021 2001-02-16
WO 00/12230
-61-
PCT/US99/20048
READ (IIN , *)
ALPHAD,BETAD,GAMMAD,BETAM(1,I),BETAM(2,I),BETAM(3,I),
1 DELM(I)
5 WRITE(IOUT;2005)N,(RMAT(J,I),J=1,9),ALPHAD,BETAD,GAMMAD
BETAM(1,I),BETAM(2,I),BETAM(3,I);DELM(I)
C
XCORD =0.0
10 YCORD=0.0
ZCORD=0.0
C DO 55 ASSUMES NMAT=NUMBER OF ELEMENTS
C THIS IS TO STORE GRALN ANGLES TO FILE FOR
LATER ANALYSIS
15 DO 55 J=1,8
XCORD=XCORD+CORD(1,LINK(J,I))
YCORD=YCORD+CORD(2,LINK(J,I))
ZCORD=ZCORD+CORD(3,LINK(J,I))
55 CONTINUE
20 XCORD = XCORD/8.0
YCORD =YCORD/8.0
ZCORD=ZCORD/8.0
WRITE(11,2500)
ALPHAD,BETAD,GAMMAD,XCORD,YCORD,ZCORD
25 CALL ANGLECON(I,ALPHAD,BETAD,GAMMAD)
50 CONTINUE
C
C
100 WRITE(IOUT,3000}
30 RETURN
1000 FORMAT(I5,3F20.0,2X,3I1/3F20.0)
1001 FORMAT(16ISI1bI5)
1002 FORMAT(IS,SF15.O/SF15.0)
1003 FORMAT(3F10.0)
35 2000 FORMAT(//1,40H NODAL DATA
(#,X,Y,Z,KX,KY,KZ,FX,FY,FZ),/,
1X,10(1H-)}
2001 FORMAT(I5,3f10.2,3I3, lX,3f10.2)
2002 FORMAT(//1,33H ELEMENT DATA
40 (#,MAT#,Nl,N2,...),/,1X,12(1H-))
2003 FORMAT(2I5/20I5)
2004 FORMAT(///,35H MATERIAL DATA
(#,RMAT1,RMAT2,...),/,1X,13(1H-})
CA 02341021 2001-02-16
WO 00/12230
-62-
PCTNS99/20048
2005 FORMAT(I3,9E12.413X,3F10.2,1X,3F10.5,1X,F8.1)
2500 FORMAT(2X,3F9.3,3F8.2)
3000 FORMAT(/)
END
5 SUBROUTINE NODES
IMPLICIT DOUBLE PRECISION (A-H,O-Z), INTEGER(/-N)
COMMON/KONTRL/NUMNOD,NDOF,NELE,NNPE,NSD,NEQ,I
BAND
COMMON/LIMITS/MAXELE,MAXNOD
10 COMMON/CPDSICORD(3,5000),FEXT(15000),disp(15000)
COMMON/ELEM/KFIX(3,5000),LINK(20,2500),MAT(2500)
COMMON/BOARD/BODIMY,BODIMX,BODIMZ,YINC,XINC,ZINC,N
ELX,NELY,NELZ
15 C
C ESTABLISH NODAL COORDINATES
C
C SET INITIAL VALUES
C
20 NODNUM=0
NX=1
NY=2
NZ=3
DO 180 I =1,NELZ + 1
25 ZLOC = (I-1 )*ZINC
DO 120 J=1,NELX
YLOC=YINC*(-.5)
XLOC=(J-1)*XINC
DO 100 K=1,NELY
30 C
C BEGINNING COLUMN EDGE
C
IF(NODNUM.GT.MAXNOD) CALL ERROR(I,MAXNOD)
NODNUM = NODNUM + 1
35 YLOC =YINC*.5 +YLOC
CORD{NY,NODNUM) =YLOC
CORD(NX,NODNUM) =XLOC
CORD(NZ,NODNUM) =ZLOC
NODNUM =NODNUM+ 1
40 YLOC=YINC*.5+CORD(NY,NODNUM-1)
CORD(NY,NODNUM)=YLOC
CORD(NX,NODNUM) =XLOC
CORD(NZ,NODNUM)=ZLOC
CA 02341021 2001-02-16
WO 00/I2230
-63-
100 CONTINUE
NODNUM=NODNUM+ 1
YLOC=YINC*.5 +CORD(NY,NODNUM-1)
CORD(NY,NODNUM) =YLOC
CORD(NX,NODNUM)=XLOC
CORD(NZ,NODNUM)=ZLOC
C
C MIDNODE COLUMN
C
10 XLOC=XINC*.5+XLOC
DO 110 L=1,NELY
NODNUM = NODNUM + 1
YLOC=(L-1)*YINC
CORD(NY,NODNUM) =YLOC
15 CORD(NX,NODNUM) =XLOC
CORD(NZ,NODNUM) = ZLOC
110 CONTINUE
NODNUM=NODNUM+ 1
CORD(NY,NODNUM) =BODIMY
20 CORD(NX,NODNUM)=XLOC
CORD(NZ,NODNUM) = ZLOC
120 CONTINUE
C
C END COLUMN
25 C
XLOC =BODIMX
YLOC = YINC*(-.5)
DO 130 K=1,NELY
NODNUM =NODNUM + 1
30 YLOC=YINC*.5+YLOC
CORD(NY,NODNUM) =YLOC
CORD(NX,NODNUM) =XLOC
CORD(NZ,NODNUM) = ZLOC
NODNUM = NODNUM + 1
35 YLOC=YINC*.5+CORD(NY,NODNUM-1)
CORD(NY,NODNUM) =YLOC
CORD(NX,NODNUM) =XLOC
CORD(NZ,NODNUM)=ZLOC
130 CONTINUE
40 NODNUM =NODNUM + 1
YLOC=YINC*.5 +CORD(NY,NODNUM-1)
CORD(NY,NODNUM) =YLOC
CORD(NX,NODNUM) =XLOC
PCT/US99/20048
CA 02341021 2001-02-16
WO 00/12230
-64-
CORD(NZ,NODNUM)=ZLOC
C
C MIDELEMENT SWATH
C
5 C SKIP IF FAR Z END OF BOARD
IF(I.EQ.(NELZ+1)) GOTO 180
PCT/US99I20048
C
XLOC =-XINC
ZLOC = ZLOC + .5 *ZINC
10 DO 150 J=1,NELX+1
XLOC = XINC + XLOC
DO 140 K=l,NELY+1
IF(NODNUM.GT.MAXNOD) CALL ERROR(1,MAXNOD)
NODNUM = NODNUM + 1
15 YLOC = (K-1)*YINC
CORD(NY,NODNUM) =YLOC
CORD(NX,NODNUM) =XLOC
CORD(NZ,NODNUM) =ZLOC
140 CONTINUE
20 YLOC =BODIMY
CORD(NY,NODNUM) = YLO(:
CORD(NX,NODNUM) =XLOC
CORD(NZ,NODNUM) = ZLOC'.
150 CONTINUE
25 180 CONTINUE
NUMNOD=NODNUM
C
C INITIALIZE BOUNDARY CONDITION AND NODAL LOAD
ARRAYS
30 ICOUNT=0
DO 200 I =1,NUMNOD
DO 200 J=1,3
ICOUNT = ICOUNT + 1
FEXT(ICOUNT) =0.0
35 KFIX(J,I)=0
200 CONTINUE
RETURN
END
SUBROUTINE ELEMENTS
40 IMPLICIT DOUBLE PRECISION (A-H,O-Z), INTEGER(/-N)
COMMON/KONTRLINUMNOD,NDOF,NELE,NNPE,NSD,NEQ,
BAND
COMMON/LIMITSIMAXELE,MAXNOD
CA 02341021 2001-02-16
WO 00/12230
-65-
PCTNS99/20048
COMMON/ELEM/KFIX(3,5000),LINK(20,2500),MAT(2500)
COMMONIBOARDIBODIMY,BODIMX,BODIMZ,YINC,XINC,ZINC,N
ELX,NELY,NELZ
5 C
C ESTABLISH NODALIELEMENT LINKAGE IN LINK
C
C CHECK LIMITS
C
10 NELE=NELX*NELY*NELZ
IF(NELE.GT.MAXELE) CALL ERROR(2,MAXELE)
C
NODNUM=0
NELENUM =0
15 NODSTOR2=(NELY*2+ 1)*(NELX+ 1)+(NELY+ 1)*NELX
NODSTOR = NODSTOR2 + (NELY + 1 ) *(NELX + 1 )
NODMIDB =0
DO 130 I =1,NELZ
NODBEG = (I-1)*NODSTOR-NELY-3
20 DO 120 J =1, NELX
NODBEG=NODBEG+NELY+2
NODMIDB = (1-J)*(2*(NI:LY) + 1 )
DO 110 K=1,NELY
NELENUM = NELENUM + 1
25 NODBEG =NODBEG +2
NODBACK=NODBEG+NODSTOR
NODMID = NODBEG + NODSTOR2 + NODMIDB
LINK{1,NELENUM) =NODBACK+NELY*3 +4
LINK(2,NELENUM) = NODBACK+ NELY*3 +2
30 LINK(3,NELENUM)=NODBEG+NELY*3+2
LINK(4,NELENUM) =LINK(3 ,NELENUM) +2
LINK(S,NELENUM) = NODBACK +2
LINK(6,NELENUM) =NODBACK
LINK(7,NELENUM) = NODBEG
35 LINK(B,NELENUM)=NODBEG+2
LINK(9,NELENUM) = NODBACK+ NELY*3 + 3
LINK( 10, NELENUM) = NODMID + NELY + 2-K
LINK(11,NELENUM) =LINK(3,NELENUM) + 1
LINK(12,NELENUM) =LINK(lO,NELENUM)+ 1
40 LINK(13,NELENUM)=NODBACK+1
LINK( 14,NELENUM) = NODMID + 1-K
LINK( 15 , NELENUM) = NODBEG + 1
LINK(16,NELENUM) =LINK( 14,NELENUM) + 1
CA 02341021 2001-02-16
WO 00/12230 PCT/US99/20048
-66-
LINK(17,NELENUM) =NODBACK+ NELY*2 + 3-K
LINK(18,NELENUM)=LINK(17,NELENUM)-1
LINK( 19, NELENUM) = NODBEG + NELY*2 + 2-K
LINK(20, NELENUM) = LINK( 19, NELENUM) + 1
5 110 CONTINUE
120 CONTINUE
130 CONTINUE
DO 150 I=1,NELE
MAT(I) =I
10 150 CONTINUE
RETURN
END
SUBROUTINE DUMP
IMPLICIT DOUBLE PRECISION (A-H,O-Z), INTEGER(I-N)
15 C
C PRINT TO FILE MESH INFORMATION
C
COMMONIKONTRLINUMNOD,NDOF,NELE,NNPE,NSD,NEQ,I
BAND
20 COMMON/CPDS/CORD(3,5000),FEXT(15000),disp(15000)
COMMON/BOARD/BODIMY,BODIMX,BODIMZ,YINC,XINC,ZINC,N
ELX,NELY,NELZ
COMMON/ELEM/KFIX(3,5000),LINK(20,2500),MAT(2500)
25 COMMON /MATRL / NMAT,RMAT(9,2500)
COMMON IQEI E(6,6),RA(3,3),ELM(6,6,2500),
1 PHI(2500),RHO(2500),AMDA(2500),C(6,6)
COMMON /SHRINK/
BETAM(3,2500),DELM(2500),EPSNAU(2500,6)
30 COMMON (DEVICE/ IIN,IOUT,IBUG,NGP,IWP,ITP,INP,IEP
C
C WRITE CONTROL INFORMATION
C
35 WRITE(IOUT,2000)NUMNOD,NDOF,NELE,NNPE,NSD,NMAT,NGP,I
WP,ITP,INP,IEP
WRITE(IOUT,2006)BODIMY,BODIMX,BODIMZ,YINC,XINC,ZI
NC,NELX,NELY,NELZ
C
40 C---- WRITE NODAL DATA
C
DO 20 N =1, NUMNOD
WRITE(IOUT,2001)N,(CORD(J,N),J=1,3),(KFIX(J,N),J=1,3),
CA 02341021 2001-02-16
WO 00/12230 PCT/US99/20048
-67-
1 FEXT((N)*3-2),FEXT((N)*3-1),FEXT((N)*3)
20 CONTINUE
C
C---- WRITE ELEMENT DATA
5 C
DO 40 I=1,NELE
WRITE(IOUT,2003)I,MAT(I),(LINK(J,I),J =1,NNPE)
40 CONTINUE
C
10 C---- WRITE MATERIAL DATA
C
C PRINTING OUT ALPHA, BETA, GAMMA GRAIN ANGLES
STORED TEMPORARILY IN
C PHI,RHO,AMDA
15 DO 50 I=1,NMAT
WRITE(IOUT,2005)I,(RMAT(J,I),J =1,9)
WRITE(IOUT,2010)PHI(I),RHO(I),AMDA(I),BETAM(1,I),
1 BETAM(2,I),BETAM(3,I),DELM{I)
50 CONTINUE
20 100 WRITE(IOUT,3000)
RETURN
2000 FORMAT(1X,IS,I3,I5,8I4)
2001 FORMAT(I5,3F10.2,1X,3I3, lX,3f7.0)
2003 FORMAT(2I5/20I5)
25 2005 FORMAT(I3,9E12.4)
2006 FORMAT(6F8.1,3I3)
2010 FORMAT(3F8.3,3F12.8,1X,F8.I)
3000 FORMAT(/)
END
30 C
C*************************************************************
*******
C******** GRAPHICS PORTIONS OF PROGRAM
***********************
35 C*************************************************************
*******
SUBROUTINE DRAWSECT
IMPLICIT DOUBLE PRECISION (A-H,O-Z), INTEGER(I-
N)
40 CHARACTER*3 ANSWER
CHARACTER*1 AXIS
CHARACTER*70 WTITLE
LOGICAL SHONODNO,SHOW,ANALY
CA 02341021 2001-02-16
WO 00!12230 PCT/US99/20048
-68-
COMMON/VIEW/AXIS,WTITLE,VIEWD,SHONODNO,ANALY,
SMAG
C
5 SHOW = . TRUE.
100 WRITE(10,700)
READ(10,*) ANSWER
IF(ANSWER.EQ.'NO'.OR"ANSWER.EQ.'no')
SHOW = . FALSE.
10 IF(.NOT.SHOW) RETURN
CLOSE(20)
SHONODNO = . TRUE.
WRITE(10,705)
READ(10,*) ANSWER
15 IF(ANSWER.EQ.'NO' .OR.ANSWER.EQ.'no')
SHONODNO=.FALSE.
WRITE(10,710)
READ ( 10 , *) AXIS
WRITE(10,720) AXIS
20 READ(10,*) VIEWD
IF(ANALY) THEN
WRITE(10,730)
READ( 10, *) SMAG
ENDIF
25 IF(VIEWD.LTØ0) VIEWD=0.0
IF(AXIS.EQ.'Z'.OR.AXIS.EQ.'z') CALL ZVIEW
IF(AXIS.EQ.'Y'.OR.AXIS.EQ.'y') CALL YVIEW
IF(AXIS.EQ.'X' .OR.AXIS.EQ.'x') CALL XVIEW
GO TO 100
30 700 FORMAT(/,1X,' Would you like to plot a cross section of the
mesh?' )
705 FORMAT(/,1X,'Show node numbers?')
710 FORMAT(/,2X,'Input the axis you would Iike to view from',
1 '(X,Y, or Z)')
35 720 FORMAT(/,2X,'Input the view point from the origin of the',A2,
1' axis')
730 FORMAT(/,1 X,' Input magnification factor for displacements' )
RETURN
END
40 SUBROUTINE CHARVER(INTE,NUMBER)
C THIS SUBROUTINE CONVERTS INTEGER DATA TO
CHARACTER DATA
C
CA 02341021 2001-02-16
WO 00/12230 PCT/US99/20048
-69-
CHARACTER*4 NUMBER
CHARACTER CAR(10)
DATA CAR/'0','1','2','3','4','S','6','7','8','9'l
C
5 ITH =INTE/ 1000
IH = INTE/ 100-ITH* 10
IT=INTE/10-ITH*100-IH*10
IS =INTE-ITH* 1000-IH* 100-IT* 10
C
10 NUMBER = CAR(ITH+ 1)//CAR(IH+ 1)//CAR(IT+ 1)//CAR(IS+ 1)
IF(ITH.EQ.O) NUMBER=CAR(IH+1)//CAR(IT+1)//CAR(IS+1)
IF(ITH.EQ.O.AND.IH.EQ.O) NUMBER=CAR(IT+1)//CAR(IS+1)
IF(ITH.EQ.O.AND.IH.EQ.O.AND.IT.EQ.O)
NUMBER = CAR(IS + 1 )
15 C
RETURN
END
SUBROUTINE ZVIEW
20 USE MSFLIB
IMPLICIT DOUBLE PRECISION (A-H,O-Z), INTEGER(I-N)
INTEGER(2)
MAXX,MAXY,STATUS,NODES(8),NODESA(8),NODESB(8)
INTEGER*4 COLOR
25 CHARACTER*70 WTITLE
CHARACTER*4 CORDNUMS
CHARACTER*1 AXIS
LOGICAL SHONODNO,ANALY
COMMON/ELEM/KFIX(3,5000),LINK(20,2500),MAT(2500)
30 COMMON/CPDS/CORD(3,5000),FEXT(15000),disp(15000)
COMMON/BOARD/BODIMY,BODIMX,BODIMZ,YINC,XINC,ZI
NC,NELX,NELY,NELZ
COMMON/SCREEN/
MARX,MAXY,WCORD(8,2),CORDNUMS(8)
35 COMMON/RINGS/ XBEG,XEND,YBEG,YEND
COMMON /QE/ E(6,6),RA(3,3),ELM(6,6,2500),
1 PHI(2500),RHO(2500),AMDA(2500),C(6,6)
COMMON/VIEW/AXIS,WTITLE,VIEWD,SHONODNO,ANALY,
SMAG
40 DATA NODESA/7,15,8,20,4,11,3,19/
DATA NODESB/6,13,5,17,1,9,2,18/
C
CA 02341021 2001-02-16
WO OO/I2230 PCT/US99/20048
-70-
WTITLE='View From Z Axis'
CALL GRAPHICSMODE
CALL CLEARSCREEN( $GCLEARSCREEN )
SCALER=BODIMX
5 IF(BODIMY.GT.BODIMX) SCALER=BODIMY
STATUS = SETWINDOW(.FALSE.,-SCALER*.3,-
SCALER*.3,SCALER* 1.5,
1 SCALER*1.5)
NELIN=NINT(VIEWD/ZINC)
10 C
C NEED TO CORRECT FOR VERY LAST X-SECTION OF
ELEMENTS
C
IF((NELIN*ZINC).GT.(ZI:NC*(NELZ-1))) THEN
15 NELIN = NELIN-1
DO 100 I=1,8
NODES(I) = NODESB(I)
100 CONTINUE
ELSE
20 DO 110 I=1,8
NODES(I) = NODESA(I)
110 CONTINUE
ENDIF
NUMEVIEW=NELX*NELY
25 NUMELE=NUMEVIEW*NELIN
NEL = NUMELE
C
C SETUP SCREEN COORDINATES AND DRAW LINES
C
30 COLOR=SETCOLORRGB(#000000) !BLACK
IF(ANALY) COLOR=SETCOLORRGB(#OOOOFF) !BRIGHT
RED
DO 150 I =1, NUMEVIEW
NEL=NEL+ 1
35 XCORD=0.0
YCORD =0.0
DO 120 J=1,8
WCORD(J,1)=CORD(1,(LINK(NODES(J),NEL)))
40
WCORD(J,2)=CORD(2,(LINK(NODES(J),NEL)))
XCORD =XCORD + WCORD(J,1 )
YCORD = YCORD + WCORD(J,2)
CA 02341021 2001-02-16
WO 00/12230 PCT/US99/20048
-71-
IF(SHONODNO) CALL
CHARVER(LINK(NODES(J),NEL),CORDNUMS(J))
120 CONTINUE
CALL DRAWLINES
5 C
C PLOT RING ANGLES
C
XCORD=XCORD/8.0
YCORD = YCORD/8.0
10 YDIM=(WCORD(3,2}-WCORD(1,2))
XDIM=(WCORD(7,1 )-WCORD(1,1))
YINC =YDIM*.25
XINC = (DTAND(AMDA(NEL)))*YINC
IF(ABS(XINC).GT.(XDIM*.5)) THEN
15 XINC=XDIM*.25
YINC=XINC/DTAND(AMDA(NEL))
ENDIF
XBEG=XCORD +XINC
YBEG=YCORD-YINC
20 XEND = XCORD-XI:NC
YEND = YCORD + YINC
CALL DRAWRING
C
150 CONTINUE
25 IF(.NOT.ANALY) RETURN
C
C DRAW DEFORMED SHAPE
C
COLOR=SETCOLORRGB(#000000) !Black
30 SHONODNO = . FALSE.
NEL= NUMELE
DO 220 I=l,NUMEVIEW
NEL=NEL+1
DO 200 J=1,8
35
WCORD(J,1)=CORD(1,(LINK(NODES(J),NEL)))+
1 SMAG*(DISP((3*LINK(NODES(J),NEL))-2))
WCORD(J,2)=CORD(2,(LINK(NODES(J},NEL)))+
40 1
SMAG*(DISP((3*LINK(NODES(J),NEL))-1))
200 CONTINUE
CALL DRAWLINES
CA 02341021 2001-02-16
WO 00/12230 PCT/US99/20048
-72-
220 CONTINUE
C
END
SUBROUTINE XVIEW
USE MSFLIB
IMPLICIT DOUBLE PRECISION (A-H,O-Z), INTEGER(I-N)
INTEGER(2)
MAXX,MAXY,STATUS,NODES(8),NODESA(8),NODESB(8)
CHARACTER*70 WTITLE
CHARACTER*4 CORDNUMS
CHARACTER*1 AXIS
LOGICAL SHONODNO,ANALY
COMMON/ELEM/KFIX(3,5000),LINK(20,2500),MAT(2500)
COMMON/CPDS/CORD(3,5000),FEXT(15000),disp(15000)
COMMON/BOARD/BODIMY,BODIMX,BODIMZ,YINC,XINC,ZI
NC,NELX,NELY,NELZ
COMMON/SCREEN/
MAXX,MAXY, WCORD(8,2),CORDNUMS(8)
COMMON/VIEW/AXIS,WTITLE.,VIEWD,SHONODNO,ANALY,
SMAG
DATA NODESA/6,14,7,15,8,16,5,13/
DATA NODESB/2,10,3,11,4,12,1,9/
C
WTITLE='View From X Axis'
CALL GRAPHICSMODE
CALL CLEARSCREEN( $(JCLEARSCREEN )
SCALER =BODIMZ
IF(BODIMY.GT.BODIMZ) SCALER=BODIMY
STATUS = SETWINDOW(.FALSE.,-SCALER*.1,-
SCALER*.1,SCALER*1.2,
1 SCALER*1.2)
NELIN = NINT(VIEWD/XINC)
NUMEVIEW = NELZ*NELY
C
C NEED TO CORRECT FOR VERY LAST X-SECTION OF
ELEMENTS
C
IF((NELIN*XINC}.GT.(XINC*(NELX-1)}) THEN
NELIN = NELIN-1
- 40 DO 100 I=1,8
NODES(I)=NODESB(I)
100 CONTINUE
ELSE
CA 02341021 2001-02-16
WO 00/12230 PCT/US99/20048
-73-
DO 110I=1,8
NODES(I)=NODESA(I)
110 CONTINUE
ENDIF
5 C
C SETUP SCREEN COORDINATES AND DRAW LINES
C
DO 160 K=1,NELZ
NEL=NELIN*NELY
10 NEL=NEL+(K-1 )*(NELY*NELX)
DO 150 I=1,NELY
NEL=NEL+ 1
DO 120 J=1,8
15 WCORD(J,1)=CORD(2,(LINK(NODES(J),NEL)))
WCORD(J,2)=CORD(3,(LINK(NODES(J),NEL)))
IF(SHONODNO) CALL
CHARVER(LINK(NODES(J),NEL),CORDNUMS(J))
20 120 CONTINUE
C
CALL DRAWLINES
150 CONTINUE
160 CONTINUE
25 IF(.NOT.ANALY) RETURN
C
C DRAW DEFORMED SHAPE
C
COLOR=SETCOLORRGB(#OOOOFF) !BRIGHT RED
30 SHONODNO = . FALSE.
DO 230 K =1, NELZ
NEL=NELIN*NELY
NEL = NEL+ (K-1 )*(NELY*NELX)
DO 220 I =1, NELY
35 NEL=NEL+ 1
DO 200 J=1,8
WCORD(J,1) =CORD(2,(LINK(NODES(J),NEL)))+
1 SMAG*(DISP((3*LINK(NODES(J),NEL))-1))
40
WCORD(J,2) = CORD(3, (LINK(NODES(J),NEL)}) +
1
SMAG*(DISP((3*LINK(NODES(J),NEL))))
CA 02341021 2001-02-16
WO 00/12230 PCTNS99/20048
-74-
200 CONTINUE
CALL DRAWLINES
220 CONTINUE
230 CONTINUE
5 C
END
SUBROUTINE YVIEW
USE MSFLIB
IMPLICIT DOUBLE PRECISION (A-H,O-Z), INTEGER(I-N)
10 INTEGER(2)
MARX,MAXY,STATUS,NODES(8),NODESA(8),NODESB(8)
CHARACTER*70 WTITLE
CHARACTER* 1 AXIS
CHARACTER*4 CORDNUMS
15 LOGICAL SHONODNO,ANALY
COMMON/ELEM/KFIX(3,5000), LINK(20,2500),MAT(2500)
COMMON/CPDS/CORD(3,5000),FEXT(15000),disp(15000)
COMMON/BOARD/BODIMY,BODIMX,BODIMZ,YINC,XINC,ZI
NC,NELX,NELY,NELZ
20 COMMON/SCREEN/
MAXX,MAXY,WCORD(8,2),CORDNUMS(8)
COMMON/VIEW/AXIS,WTITLE,VIEWD,SHONODNO,ANALY,
SMAG
DATA NODESA/2,18,6,14,7,19,3,10/
25 DATA NODESB/1,17,5,16,8,20,4,12/
C
WTITLE='View From Y Axis'
CALL GRAPHICSMODE
CALL CLEARSCREEN( $GCLEARSCREEN )
30 SCALER=BODIMX
IF(BODIMZ.GT.BODIMX) SCALER=BODIMZ
STATUS = SETWINDOW(.TRUE.,-SCALER*.1,-
SCALER*.1,SCALER*1.2,
1 SCALER* 1.2)
35 NELIN=NINT(VIEWD/YINC)
C
C NEED TO CORRECT FOR VERY LAST X-SECTION OF
ELEMENTS
C
40 IF((NELIN*YINC).GT.(YINC*(NELY-1))) THEN
NELIN = NELIN-1
DO 100 I=1,8
NODES(I)=NODESB(I)
CA 02341021 2001-02-16
WO 00/12230 PCT/US99/Z0048
-75-
100 CONTINUE
ELSE
DO 110 I=1,8
NODES(I) = NODESA(I)
5 110 CONTINUE
ENDIF
C
C SETUP SCREEN COORDINATES AND DRAW LINES
C
10 COLOR=SETCOLORRGB(#000000} !BLACK
IF(ANALY) COLOR=SETCOLORRGB(#OOOOFF) !BRIGHT
RED
NEL =1-NELY + NELIN
DO 160 K= l,NELZ
15 DO 150 I=1,NELX
NEL=NEL+NELY
DO 120 J=1,8
WCORD(J,1)=CORD(l,(LINK(NODES(J),NEL)))
20
WCORD(J,2)=CORD(3,(LINK(NODES(J),NEL)))
IF(SHONODNO) CALL
CHARVER(LINK(NODES(J),NEL),CORDNUMS(J})
120 CONTINUE
25 C
CALL DRAWLINES
150 CONTINUE
160 CONTINUE
IF(.NOT.ANALY) RETURN
30 C
C DRAW DEFORMED SHAPE
C
COLOR=SETCOLORRGB(#000000) !BLACK
SHONODNO= . FALSE.
35 NEL=1-NELY+NELIN
DO 230 K= l,NELZ
DO 220 I =1, NELX
NEL = NEL + NELY
DO 200 J=1,8
40
WCORD(J,1) =CORD( l ,(LINK(NODES(J),NEL})) +
1 SMAG*(DISP((3 *LINK(NODES(J),NEL))-2})
CA 02341021 2001-02-16
WO 00/12230 PCT/US99/20048
-76-
WCORD(J,2)=CORD(3,(LINK(NODES(J),NEL)))+
1
SMAG*(DISP((3*LINK(NODES(J),NEL))))
5 200 CONTINUE
CALL DRAWLINES
220 CONTINUE
230 CONTINUE
C
10 END
SUBROUTINE GRAPHICSMODEQ
USE MSFLIB
IMPLICIT DOUBLE PRECISION (A-H,O-Z), INTEGER(I-
N)
15 LOGICAL STATUSMODE
INTEGER(2)MAXX, MARY, NUMFONTS, INDEX
INTEGER(4)BKCOLOR,COLOR
CHARACTER*1 AXIS
CHARACTER*4 CORDNUMS
20 CHARACTER*70 WTITLE
LOGICAL SHONODNO,ANALY
TYPE (WINDOWCONFIG) MYSCREEN
TYPE (QWINFO) WINFO
COMMON/SCREEN/
25 MAXX,MAXY,WCORD(8,2),CORDNUMS(8)
COMMON/VIEW/AXIS,WTITLE,VIEWD,SHONODNO,ANALY,
SMAG
OPEN (20,FILE='USER',TITLE=WTITLE)
30 C SET HIGHEST RESOLUTION GRAPHICS MODE
MYSCREEN. NUMXPIXELS =-1
MYSCREEN.NUMYPIXELS=-1
MYSCREEN.NUMTEXTCOLS =-1
MYSCREEN. NUMTEXTROWS =-1
35 MYSCREEN. NUMCOLORS =-1
MYSCREEN.FONTSIZE=-1
MYSCREEN.TITLE=WTITLE
C
STATUSMODE=SETWINDOWCONFIG(MYSCREEN)
40 WINFO.TYPE=QWIN$MAX
RESULT=SETWSIZEQQ(20, WINFO)
C
C DETERMINE THE MAXIMUM DIMENSIONS
CA 02341021 2001-02-16
WO 00/12230 PCT/US99/20048
_77_
C
STATUSMODE=GETWINDOWCONFIG(MYSCREEN)
MAXX=MYSCREEN.NUMXPIXELS - 1
MAXY = MYSCREEN. NUMYPIXELS - 1
5 C
C SET COLOR OPTIONS
C
BKCOLOR=SETBKCOLORRGB(#FFFFFF)
COLOR=SETCOLORRGB(#000000) !BLACK
10 C
C SET FONT OPTIONS
C
NUMFONTS = INITIALIZEFONTS Q
INDEX = SETFONT('t"Arial"hl4p')
15 END
SUBROUTINE DRAWLINES
USE MSFLIB
IMPLICIT DOUBLE PRECISION (A-H,O-Z), INTEGER(I-
N)
20 CHARACTER*1 AXIS
CHARACTER*70 WTITLE
CHARACTER*4 CORDNUMS
INTEGER*2 MAXX,MAXY
LOGICAL SHONODNO,ANALY
25 TYPE (WXYCOORD) WXY
COMMON/SCREEN/
MAXX,MAXY, WCORD(8,2),CORDNUMS(8)
COMMON/VIEW/AXIS,WTITLE,VIEWD,SHONODNO,ANALY,
30 SMAG
CALL
MOVETO W(WCORD(1,1)+O.OS,WCORD(1,2),WXY)
IF(SHONODNO) CALL
OUTGTEXT(CORDNUMS(1))
35 CALL
MOVETO W(WCORD(1,1),WCORD(1,2),WXY)
DO 100 I=2,8
STATUS =
LINETO W(WCORD(I,1),WCORD(I,2))
40 IF(SHONODNO) THEN
CALL
MOVETO W(WCORD(I,1)+O.OS,WCORD(I,2),WXY)
CALL OUTGTEXT(CORDNUMS(I))
CA 02341021 2001-02-16
WO 00/12230 PCT/US99/20048
_78_
CALL
MOVETO W(WCORD(I,1),WCORD(I,2),WXY)
ENDIF
100 CONTINUE
5 STATUS = LINETO W(WCORD(1,1),WCORD(1,2))
END
SUBROUTINE DRAWRING
USE MSFLIB
IMPLICIT DOUBLE PRECISION (A-H,O-Z), INTEGER(I-
10 N)
TYPE (WXYCOORD) WXY
COMMON/RINGS/ XBEG,XEND,YBEG,YEND
CALL MOVETO_W(XBEG,YBEG,WXY)
STATUS = LINETO W(XEND,YEND)
15 END
C
C******************* END OF GRAPHICS
********************************
C
20 SUBROUTINE ERROR(IERROR,JERROR)
IMPLICIT DOUBLE PRECISION (A-H,O-Z), INTEGER(I-N)
WRITE(10,700)
WRITE( 16,700)
700 FORMAT(/,'** FATAL PROGRAM ERROR **'/)
25 GOTO (10,20,30,40,50,60,70,80,90,100) IERROR
C
10 WRITE(10,710) JERROR
WRITE(16,710) JERROR
710 FORMAT(2X,'NUMBER OF NODES =',IB,' EXCEEDS
30 DIMENSION')
STOP
20 WRITE(10,720) JERROR
WRITE(16,720) JERROR
720 FORMAT(2X,'NUMBER OF ELEMENTS =',IB,' EXCEEDS
35 DIMENSION' )
STOP
30 WRITE(10,730) JERROR
WRITE(16,730) JERROR
730 FORMAT(2X,'BAND WIDTH =',I4,' EXCEEDS
40 DIMENSION')
STOP
40 WRITE(10,740) JERROR
WRITE(16,740) JERROR
CA 02341021 2001-02-16
WO 00/12230 PCT/US99/20048
_79_
740 FORMAT(2X,'LENGTH OF PITH =' ,I3,1X,' (INTEGER
VALUE)'
)
STOP
50 WRITE(10,750) JERROR
5 WRITE(16,750) JERROR
750 FORMAT(2X,' DISTANCE TO PITH =' ,I3,1X,' (INTEGER
VALUE)'
)
STOP
60 WRITE(10,760)
10 WRITE(16,760)
760 FORMAT(2X,'CHECK GRAIN ANGLE DATA FILES')
STOP
70 WRITE(10,770) JERROR
WRITE(16,770) JERROR
15 770 FORMAT(2X, ' ERROR IN GRAIN ANGLE
INTERPOLATION
' ,
1 'ROUTINE AT POINT ',I5)
STOP
80 WRITE(10,780)
JERROR
20 WRITE(16,780) JERROR
780 FORMAT(2X, ' LONGINTUDINAL E IS < 0.0 FOR
ELEMENT' ,I4)
STOP
90 WRITE(10,790)
25 WRITE(16,790)
790 FORMAT(2X, ' ERROR IN CALIBRATE, EINTRCPT <
0' /
I 2X,' RINGS ARE TOO WIDE FOR THIS DISTANCE FROM
THE PITH'
)
STOP
30 100 WRITE( 10, 800)
WRITE(16,800)
800 FORMAT(2X, ' NUMBER OF DATA POINTS IN LSE FILE
EXCEEDS'
1 2X, 'DIMENSION
OF 200,
NO.OF PTS
=',I4)
35 STOP
RETURN
END
C **********************************************************
SUBROUTINE
TIMIT
40 C **********************************************************
USE MSFLIB
IMPLICIT DOUBLE PRECISION (A-H,O-Z)
C
CA 02341021 2001-02-16
WO 00/12230 PCT/US99/20048
-80-
INTEGER*2 IHR,IDAY,IMIN,IMON,IYR;ISEC,I100TH
COMMON/INTR/IHR,IDAY,IMIN,IMON,IYR,ISEC,Il00TH
C
C
5 TIME 1= IMIN*60 + ISEC + I 100TH/ 100
CALL GETTIM(ihr,imin,isec,il00th)
TIME2 =IMIN*60 +ISEC +I100TH/ 100
TIME2 = TIME2-TIME 1
WRITE(10,500) TIME2
10 500 FORMAT(SX,'EXECUTION TIME=',F10.2,' SECONDS')
RETURN
END