Note: Descriptions are shown in the official language in which they were submitted.
CA 02344755 2001-04-18
EMLN: EL493560553US
Attorney Docket No. 65304-0155
Symyx 99-90
INSTRUMENT FOR HIGH THROUGHPUT MEASUREMENT OF MATERIAL
PHYSICAL PROPERTIES AND METHOD ~DF USING SAME
BACKGROUND
Technical Field
The present invention relates to an apparatus and method for determining
physical
characteristics of an array of materials as functions of mechanical
perturbations and
environmental conditions.
Discussion
Combinatorial chemistry generally refers to methods and materials for creating
collections of diverse materials or compounds-commonly known as libraries-and
to
techniques and instruments for evaluating or screening librariE;s for
desirable properties.
Combinatorial chemistry has revolutionized the process of dmg discovery, and
has enabled
researchers to rapidly discover and optimize many other useful materials.
Scientists realized that efficient screening techniques vvere essential for
any successful
combinatorial research effort. However, since much of the original work in
combinatorial
' chemistry focused on biologically active compounds, early researchers
typically employed
conventional biological assays as screening methods. Many of these assays were
ideally
suited for screening combinatorial libraries because they required little or
no sample
preparation and they could generate useful results using small sample sizes (a
mg or less)
generally produced in a combinatorial synthesis.
But as researchers began applying combinatorial methods to develop novel non-
biological materials, they increasingly found that conventional instruments
and methods for
characterizing materials were often unsatisfactory for screening. For example,
instruments
for characterizing physical properties of materials viscometers, rheometers,
dynamic
analyzers, and other mechanical property test instruments-are generally
unsuitable for
screening purposes because they were designed to process one sample at a time.
Although
the throughput of these,serial instruments would likely benefit from
automation, many
mechanical property test instruments require time-consuming sample
preparation; demand
more sample than is ordinarily prepared in a high speed research program, and
exhibit
sluggish environmental control, making such instruments impractical for use as
screening
-1-
CA 02344755 2001-04-18
EMLN: EL493560553US
flttorney Docket No. 65304-0155
Symyx 99-90
tools. Furthermore, the long time scales associated with measuring mechanical
properties of
polymers, ceramics and other engineered materials often make serial approaches
unsuitable as
screening methods.
Moreover, competitive pressures are forcing scientists to continually expand
their set
of screening tools. Many material scientists have embraced combinatorial
methodologies
because the techniques allow them to develop novel materials in a fraction of
the time as
conventional discovery methods. This has allowed researchers to tackle a wider
range of
material design challenges and to consider a broader set of characteristics
that ultimately
translates into improved material performance. Of course, new design
challenges and
additional screening criteria mean that laboratories must acquire more
screening tools, which
if purchased as separate instruments, might offset cost savings. associated
with combinatorial
' methods. '
Thus, there exists a need for versatile instruments and techniques for
screening
combinatorial libraries, and especially instruments and methods for measuring
physical
properties of materials. The present invention, at least in part, satisfies
that need. .
SUNiNIARY OF THE INVENTION
The present invention provides an apparatus and rriethod for screening
combinatorial
libraries that addresses many of the problems encountered. when using
conventional
. instruments: For example, the disclosed apparatus can measure physical
properties of library
members in parallel and can perform tests on small amounts ofmaterial, which
are easily
prepared by automated liquid and/or solid handling techniques. Compared to
conventional
instruments, the .disclosed apparatus affords faster sample loading and
unloading, for
example, through the use of disposable sample arrays and test probes. The
present invention
is operationally flexible, and permits a single instrument to perform many
different material
tests through proper selection of sample array format and test probe design.
Rapid serial
measurements may also be performed.
Thus, one aspect of the present invention provides and apparatus for measuring
bulk
physical properties of aui array of material samples. The apparatus includes a
moveable
sample holder for containing the array of material samples, and an array of
probes for
mechanically perturbing the array of material samples. The apparatus also
includes an
actuator for translating the moveable sample holder and the array of material
samples. The
-2-
CA 02344755 2001-04-18
r a
EMLN: EL493560553US
Attorney Docket No. 65304-O1 SS
Symyx 99-90
actuator moves the array of material samples in a direction normal to a plane
defined by the
ends of the probes so that the material samples contact the probes. In
addition, the apparatus
includes a sensor for monitoring the response of the materials to mechanical
perturbation by
the,probes. Typical sensors include force sensors.
A second aspect of the present invention provides a system for screening a
combinatorial library of materials by measuring bulk physical properties of
the materials.
'The system includes an array of material samples and probes for mechanically
perturbing the
samples. Depending on the particular physical property being tested, the array
includes
materials deposited at predefined regions on flexible or rigid siubstrates, or
materials
contained in a group of vessels. The system also includes an actuator for
translating the array
of material samples in a direction normal to a plane defined by the ends of
the probes so the
material samples contact the probes. The system also includes a sensor for
monitoring the
response of the array of material samples to mechanical perturbations by the
probes.
A third aspect of the invention provides a method of screening a combinatorial
library
of materials. The method includes providing an array of material comprising at
least five
individual samples, and mechanically perturbing the array of rriaterials by
contacting at least
two of the material samples with probes simultaneously. In addition, the
method includes
monitoring responses of the samples during the mechanical perturbations.
Depending on type
of mechanical perturbation, the method can screen libraries of materials based
on
measurements of many different bulk physical properties. For example, the
inventive method
can measure physical properties related to Young's modulus-including flexure,
uniaxial
extension, biaxial compression, and shear. In addition, the metlhod can
measure physical
properties related to hardness (indentation), failure (stress and strain at
failure, toughness),
adhesion (tack, loop tack), and flow (viscosity, melt flow indexiing, and
rheology), among
others.
BRIEF DESCRIPTION OF THE DRAVVINGS
Fig. 1 is a perspective view of one embodiment of a parallel dynamic
mechanical
analyzer (PDMA).
Fig. 2 shows a cross-sectional view of an isolation block module that
separates the
probe test fixtures and the sample array from the force sensors.
-3-
CA 02344755 2001-04-18
EMLN: EL493560553US
Alaorney Docket No. 65304-0155
Symyx 99-90
Fig. 3 shows a close-up cross sectional view of the probe shown in Fig. 2, and
illustrates the use of a permanent magnet to attach the test fixhue to the
threaded cylindrical
core of the composite shaft.
Fig. 4 shows a cross sectional view of two adjacent isolation block modules,
and
illustrates interactions of probes and force sensors. '
Fig. 5 shows a perspective bottom view of one of the sensor boards.
Fig. 6 shows a top view of a portion of one of the sensor boards.
Fig. 7 is a flow chart for the data acquisition control.
Fig. 8 shows a cross-section view of representative components of material
sample
array and test fixtures that the PDMA of Fig. 1 can use to screen libraries of
materials based
on flexure measurements:
Fig. 9 shows typical results of a flexure measurement for a single element of
a
material sample array. '
Fig. 10 shows typical results of flexure measurements rriade in a "direct"
mode.
Fig. 11 shows typical results of flexure measurements made in an "oscillatory"
mode.
Fig. 12 shows a graph of stiffness versus displacement of the first
translation actuator
(coarse stage).
Fig. 13 shows a cross-section view of a portion of a maberial sample array and
test
fixtures that the PDMA can use to screen libraries of materials based on
uniaxial extension or
. biaxial compression measurements.
Fig. 14 shows a cross-section view of representative components of material
sample
array and test fixtures that the PDMA of Fig. 1 can use to screen libraries of
materials based
on shear force measurements.
Fig. 15 shows a cross-section view of a portion of a material sample array and
a
representative test fixture that the PDMA of Fig. 1 can use to screen
libraries of materials
based on indentation measurements.
Fig. 16 shows force-displacement curves for indentation measurements of melt-
pressed polystyrene samples mounted on a rigid substrate.
Fig. 17 shows a cross-sectional view of a portion of a material sample array
and a
representative test fixture that the PDMA of Fig. 1 can use to screen
libraries of materials
based on viscosity or viscosity-related measurements.
CA 02344755 2003-09-16
Fig. 18 shows a cross-sectional view of a portion of a material sample array
and
representative test fixtures that the PDMA of Fig. 1 can use to screen
libraries of materials
based on melt flow indexing.
Fig. 19 shows real and imaginary parts, F'(~) and F"(c~), of the force exerted
on test
S fixtures by fluid motion of a polyisobutylene sample.
Fig. 20 shows F'(m) for three polyisobutylene standards.
Fig. 21 shows a perspective view of test fixture for an embodiment for
adhesive
failure.
Figs. 22 shows a cross-sectional view of a first embodiment of a sample
holder, a
material sample array, and test fixtures that the PDMA of Fig. 1 can use to
screen libraries of
materials based on adhesion.
Fig. 23 shows a partial cross-sectional view of a second embodiment of a
sample
holder, a material sample array, and test fixtures that the PDMA of Fig. 1 can
use to screen
libraries of materials based on adhesion.
Fig. 24 shows a representative plot of force and sample holder displacement
versus
time for adhesion measurements using the sample holder, the material sample
array and test
fixtures shown in Fig. 22.
Fig. 25 is a graph of the results from the example.
DETAILED DESCRIPTION OF THE PREFERRED EMBODIMENTS
Overview of Apparatus and Method
The present invention comprises a system and method for screening
combinatorial
libraries of materials by measuring the response of individual library members
to mechanical
perturbations. Throughout and in accord with this specification, the number of
member of a
combinatorial library of materials may vary depending on the embodiment being
practiced.
Generally, an array of materials comprises a plurality of materials for which
a property
measurement is desired. In some embodiments, an array of materials will
comprise 8 or
more, 16 ar more, 24 or more or 48 or more materials, each of which is
different from the
others. Arrays of materials and methods of making such arrays are described in
detail, for
example, U.S. Patent Nos. 6,004,617 and 6,030,917
The materials in the arrays may be any type of material for which a property
-5~
CA 02344755 2001-04-18
EMLN: EL493560553US
Attorney Docket No. 65304-0155
Symyx 99-90
measurement is desirable. Examples of the types of materials that may be in an
array include
non-biological polymers (such as polyethylene, polypropylene;, polystyrene,
polymethacrylicacid, polyacrylamide, polymethylmethacrylatE; and the like,
including
copolymers or higher order polymers of the same monomers), metals (including
all types of
alloys), composites, etc. The materials in the array may be in various forms,
including
amorphous, crystalline and mixtures thereof. The only limitation on the type
of material is
that the material must be capable of being deposited in a manner compatible
with the property
testing described herein. Those of skill in the art will appreciate from this
specification that
members of the array may be the same or different materials. Also, standards
(such as
calibration standards) or blanks may be employed in the array i:or known
scientific purposes.
Relative comparison of the properties of members of the array :is a
particularly useful
embodiment of this invention.
Throughout this specification, the specific embodiment discussed in detail is
a ninety-
six parallel embodiment. This particularly preferred embodiment has many
detailed features,
which may not be necessary in other embodiments of this invention. For
example, force
sensors are placed remotely to the samples and are set at certain, spacing.
Those of skill in the
art can easily modify such design parameters for other embodiments; such as by
placing the
sensors at other spacing, not placing the sensors substantially in a plane and
not placing the
samples remote to the sensors (e.g., using an integrated probe and sensor).
These are design
choices for the present invention and describe other embodiments of the
invention.
Those of skill in the art will also appreciate that lower on higher throughput
may serve
the needs of a particular application of this invention. Thus, 8 o:r more, 16
or more, 24 or
more or 48 or more test probes in parallel are within the scope o:P this
invention. These
probes may all be in the same test fixture or in multiple test fixh~res. Also,
different types of
probes described herein may be in a single test fixture. In terms of
throughput, a single
material (e.g., a sample) may, have up to ten different properties measured
simultaneously. In
addition, up to 96 materials may have one or more properties measured
simultaneously in 10
minutes or less, preferably 5 minutes or less and even more preferably in 1
minute or less. In '
some embodiments, throughput of 30 seconds or less or even 10 aeconds or less
may be
accomplished for an array of the sizes discussed herein, e.g., up to 96
materials in the array.
Generally, the samples are associated with specific locations or regions of
the sample
holder such that the location of individual samples may be known. Thus,
samples may be
CA 02344755 2001-04-18
EMLN: EL493560553US
Attorney Docket No. 65304-0155
Syrnyx 99-90
contained by the sample holder, placed on the specific locations of the sample
holder or fixed
to the sample holder (e.g., if the sample holder is replaceable) or otherwise
specifically
located. The method of knowing the location of an individual sample is not
critical to this
invention and is described herein based on the samples being contained in the
sample holder
. 5 for illustration purposes only. Also generally, preferred embodiments of
attachment means
are described for various parts (such as clamping, threading, magnetic
coupling, springs, etc.),
but those of skill in the art will appreciate that this is simply a :matter of
design choice and the
invention herein is not lirruted to the specific embodiments described in
detail.
As used in this disclosure, the term "mechanical perturbations" generally
refers to
controlled straining and/or shearing of a library member. The ;actual
displacement of the
material may be small (for example, about thirty ~.m or less). 7f'he system
generally includes
a sample holder for containing or securing the library members, one or more
probes for
mechanically perturbing individual library members, and one or more sensors
for measuring
the response of each of the library members to the mechanical perturbations.
Library
members undergoing screening make up a sample array, and individual library
members
constitute elements of the sample array that are confined, to specific
locations on the sample
holder. Although the system can screen libraries of varying size, a most
preferred
embodiment is a library comprising an eight-by-twelve rectangular array of
material samples
in which, similar to a standard ninety-six well mierotiter plate, the centers
of adjacent arra
Y
elements are spaced nine-mm apart.
During screening, the probes mechanically interact with the elements of the
sample
array. In some embodiments the probes have about the same lateral spacing as
the elements
of the sample array so that there is a one-to-one correspondence between
individual probes
and sample array elements. In addition, since the sample array and the ends of
the probes
, also define two generally planar surfaces, the system can perturb all of the
sam le arra
Y
elements simultaneously by displacing the sample array (sample holder) and/or
the probes in
a direction normal to the two surfaces. If adapted to perturb all o~f the
elements
simultaneously, the system may include a rectilinear translation stage that is
attached to the
sample holder or the probes. In other embodiments, the system may perturb
individual or
groups of sample array elements. In these embodiments, the system may include
a
translation mechanism capable of three-dimensional motion, which is attached
to a single
probe, to a group of probes, or to the sample holder:
CA 02344755 2001-04-18
EMLN: EL493560553US
Attorney Docket No. 65304-0155
Symyx 99-90
Since the bulk physical properties of materials can depend strongly on
environmental
conditions temperature, pressure, ambient gas composition (:including
humidity), electric
and magnetic field strength, and so on-the screening system may include a
control system
for regulating environmental conditions. Useful control systems include an
environmental
chamber that encloses the sample holder, the sample array, and the probes. As
discussed
below, the system may locate the sensors outside of the environmental chamber
if their
performance is strongly influenced by any of the environmental control
variables, such as
temperature.
The system uses software running on a general-purpose; computer to control the
mechanical perturbations and to acquire and record the response of the
sarriple array elements
to the mechanical perturbations. Computer software also regulates conditions
in the
environmental chamber, if present. As discussed below, one o:r more data
acquisition boards,
which are under the direction of the software, link the computer to the
peripheral control
elements, sensors, and so on.
The versatile system can screen libraries of materials b~~sed on many
different bulk
physical properties. For example, the system can measure physical properties
related to
Young's modulus-including flexure, uniaxial extension; biaxi:al compression,
and shear. In
addition, the system can measure physical properties related to hardness
(indentation), failure
(stress and strain at failure, toughness), adhesion (tack, loop tack), and
flow (viscosity, melt
flow indexing, and rheology), among others. As described below, the system can
choose
from among many screening criteria or physical properties by selecting the
proper sample
array format and probe design.
Parallel Dynamic Mechanical Analyzer (PDMA)
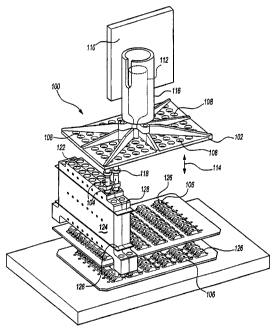
Fig. 1 shows a prospective view of a parallel dynamic mechanical analyzer
(PDMA)
100 that can be used to screen a library of materials by measuring responses
of the materials
to mechanical perturbations. - The PDMA 100 includes a samplE; holder 102 for
containing or
securing the library members, probes 104 for perturbing individual library
members, and
sensors 106 (e.g., force sensors) for measuring the response of each of the
library members to
the mechanical perturbations. The library members comprise a sample array (not
shown) in
which individual library members constitute elements of the sannple array that
are confined to
specific locations 108 on the sample holder 102. The particular sample holder
102 shown in
Fig: 1 contains a sample array comprised of an eight-by-twelve rectangular
array of material
.-g.-
CA 02344755 2001-04-18
EMLN: EL493560553US
Attorney Docket No. 65304-0155
Symyx 99-90
samples located on nine-mm centers. But in general, the PDMLA can analyze
sample arrays
having two or more elements, and preferably, at least eight elements to ensure
adequate
screening throughput. The PDMA 100 generally has as many probes 104 as
desired, for
example there may be as many as there are samples in the array, although for
clarity, Fig. 1
shows only two probes 104. In the embodiment shown in Fig. 1, each of the
probes 104 has
about the same lateral spacing as the elements of the sample array so that one
probe 104 is
associated with one sample array element. Alternatively, the P'DMA may employ
fewer
probes 104 than sample array elements, so that a probe or group of probes
perturbs multiple
sample array elements. Alternatively, there may be more probes than samples.
The PDMA 100 includes first 110 and second 112 tran;>lation actuators for
displacing
the sample array in a direction normal 114 to surfaces containing the sample
array and the
ends of the probes 104. The first translation actuator 110, which is attached
to the sample
holder 102 via a housing 116 that surrounds the second translation actuator
112, provides
relatively coarse displacement of the sample holder 102. A useful first
translation actuator
110 includes a motorized translation stage available from POL'YTEC PI under
the trade name
M-126 Translation Stage, which has a translation range of twenty-five mm and a
resolution of
0.1 p,rn. The second translation actuator 112, which is attached directly to
the sample holder
102, provides relatively fine displacement of the sample holder' 102. A useful
second
translation actuator 112 includes a preloaded piezoelectric stacl'{ available
from Polytec PI
under the trade name P-753 LISA Linear PZT Stage Actuator, which has a
translation range
of 30 ~m and can provide an 100-N pushing force and a 20-N pulling force:
Other
erribodiments for these parts will be within the scope of those o~f skill in
the art. The PDMA
100 typically controls the first 110 and second T 12 translation actuators
using a DC motor
controller and an amplifier/position servo controller, respectively, which are
linked to a
general-purpose computer (not shown). In an alternative embodiment, the first
110
translation actuator is mounted on an x-y translation stage (not shown), which
allows
movement of the sample holder 102 in a direction about parallel to the
surfaces containing the
sample array and the ends of the probes 104. This latter embodiment is useful
when the
sample holder 102 must be moved laterally to align different groups of sample
array elements
with the probes 104 during screening-i.e., when the.PDMA ennploys fewer probes
104 than
sample array elements and the probes 104 are stationary.
-9-
CA 02344755 2001-04-18
EMLN: EL493560553US
Attorney Docket No. 65304-0155
Symyx 99-90
Each of the probes 104 includes a test fixture 118 that contacts one of the
sensors 106
through a solid or composite shaft 120 shown in phantom in F'ig. 1. Each shaft
120 passes
through an aperture 122 in an isolation block module 124 that separates the
probe test fixture
118 from the sensor 106. For clarity, Fig. 1 shows only two isolation block
modules 124,
although this embodiment of the PDMA 100 ordinarily includes twelve such
modules 124-
one isolation block module 124 for each row of eight probes 104.
Alternatively, the PDMA
may include a single isolation block for separating the probe test fixtures
118 from the
sensors 106. For reliable measurements, each test fixture 118 should contact
its associated
sample array element in a specific location 108 on the sample holder 102. This
requires a
mechanism for locating the composite shaft 120 along a line extending from the
center 126 of
a particular sensor 106, normal to the surface of the sample away. Although
conventional
linear bearings can be used to align the composite shaft 120, f action between
the linear
bearings and the shaft 120 limits the displacement resolution at low force
levels. In addition,
the PDMA can also use air bearings, but the size and expense ~of air bearings
often make them
impractical for use with a PDMA employing relatively large numbers of probes
104.
Fig. 2, which illustrates the use of two flexure strips 15~0 to align the
probes 104 with
the sample array elements, shows a cross-sectional view of one of the
isolation block modules
124 as seen through a cuttir<g plane containing centerlines of tlae apertures
122 shown in Fig.
1. The flexure strips 150 are sandwiched between generally planar surfaces of
upper 152 and
intermediate 154 segments of the isolation block module 124 and between
generally planar
surfaces of the intermediate 154 and lower 156 segments of the isolation
module 124. The
two flexure strips 150 shown in Fig. 2 comprise relatively thin (from about
10' ~,m to about
102 Vim) rectangular membranes having spaced-apart holes that are
substantially aligned with
each composite shaft 120 within the apertures 122 of the isolation block
modules 124.
As shown in Fig. 2, the composite shaft 120 is comprised of a rigid;
substantially
cylindrical core 158 and a thermally insulating outer sheathing having upper
160,
intermediate 162, and lower 164 sections that are threaded onto the core 158.
When installed
in the apertures 122, the abutting ends of the upper 160 and intermediate 162
sections of the
sheathing and the intermediate 162 and lower 164 sections of tlhe sheathing
lie in planes
containing the two flexure strips 150. Since the diameters of the core 158 and
the holes in the
flexure strips 150 are about the same, the periphery of the holes are clamped
between the
abutting ends of the upper 160, intermediate 162, and lower sections of the
sheathing. The
-10-
CA 02344755 2001-04-18
EMLN: EL493560553US
~rttorney Docket No. 65304-0155
Symyx 99-90
. flexure strips 150 are also clamped along the periphery of each aperture
122, adjacent
interfaces between the upper 152, intermediate 154, and lower segments 156 of
the isolation
block module 124. The resulting clamped membranes or diaphragms 166, which
span
annular gaps 168 between the shafts 120 and the isolating block module 124,
support and '
align the probes 104.
The geometry of the diaphragms 166 makes each of the flexure strips 150
compliant
for displacements normal 114 to the surface supporting or containing the
sample array, but
mechanically stiff for displacements parallel to the sample array. The use of
two flexure
strips 150 also makes each combination of shaft 120 and diaphragms 166
mechanically stiff
for angular displacements away from the direction normal 114 to the surface of
the sample
array. Moreover, through proper selection of materials and dunensions, the
flexure strips 150
exhibit effective spring constants-for displacements normal 7t 14 to the
sample array-
substantially less than effective constants of the sensors 106. In this way,
the flexure strips
150 ordinarily exert minimal influence on the measured responses to mechanical
perturbations, unless they are used to "pre-load" the sensors 106 as discussed
below. Useful
materials for the flexure strips 150 include metallic and polymeric films. For
example, one
particularly useful flexure strip material is polyimide film, which is
available from DuPont
under the trade name KAPTON in thickness ranging from about from about
thirteen ~.m to
about one hundred twenty five ~,m. Other useful flexure materials include
stainless steel foil,
. 20 diaphrams (in general) and comzgated bronze, for example, the; flexure
may be mechanically
machined stainless steel. Since the effective spring constants oaf the
diaphragms 166 and
typical sensors 106 are temperature-dependent, the use of thernnally
insulating sheathing 160,
162, 164 on the shafts 120 permits the PDMA 100 to vary the temperature of the
sample
arrays without significantly affecting the measured response.
As noted previously, an important feature of the PDMA. 100 is its ability to
screen
materials based on many different physical properties. One wary the PDMA 100
achieves this
flexibility is by using interchangeable (and, in some embodiments, disposable)
test fixtures
118 with an appropriate sample array format and sample holder 102. For
example, one
screening method may employ a probe 104 equipped with a ball-tip indenter test
fixture 118
to rank the hardness of material samples arrayed on a rigid plate;. Another
screening method
may employ a probe 104 fitted with a flat-tip stylus test fixture 118 to
deduce Young's
modulus from flexure measurements of material samples arrayed on a flexible
substrate. In
-11-
CA 02344755 2001-04-18
EMLN: EL493560553US
Attorney Docket No. 65304-0155
Symyx 99-90
either case, the PDMA 100 should provide a mechanism for removing and securely
attaching
the test fixtures 118. Suitable attachment mechanisms include mechanical and
electromagnetic couplings, as well as devices employing permanent magnets.
Fig. 3 , shows a close-up cross sectional view of the probe 104 shown in Fig.
2, and
illustrates the use of a permanent magnet 190 to attach the test :C~xture 118
to the threaded
core 158 of the composite shaft 120. As shown in Fig. 3, the probe 104
includes a base 192
having first 194 and second ends 196 that adjoin, respectively, the test
fixture 118 and the
upper section 160 of the thermally insulating outer sheathing. A substantially
cylindrical
bore 198 extends parhvay into the base 192 and is sized and threaded to
connect the core 158
of the shaft 120 to the second end 196 of the base 192. The test fixture 118
is removably
attached to the first end 194 of the base 192 by magnetic flux originating
from the permanent
magnet 190 that is embedded in the base 192 of the probe 104. A tubular
magnetic shield
200, which typically has a lower modulus than either the probe base 192 or the
permanent
magnet 190, is wedged into an annular space between the probe; base 192 and
the permanent
magnet 190. The shield 200, which helps secure the magnet 190 within the probe
base 192,
extends outward from the first end 194 of the base 192 and mates with a
substantially circular
slot 202 formed in the test fixture 104. The slot 202 is sized to receive the
tubular shield 200
with minimal interference, and the,shield 200 has a tapered end 204 that helps
guide it into
the slot 202 during attachment of the test fixture 118 to the probe base 192.
In the
embodiment shown in Fig. 3, the test fixture 118 and the probe base 192
include flanges 206,
208 for accessing them during removal or attachment.
As can be seen in Fig. 3, the test fixture 118, the base 192, and the shield
200 enclose
the permanent magnet 190, which helps minimize stray magnetiic flux that may
influence
sample measurements of nearby probes 104. Generally, the probe 104 components
are made
from materials having a high magnetic permeability-a relative permeability
substantially
greater than unity-to ensure effective magnetic shielding. Suitable materials
include nickel-
iron alloys containing copper, molybdenum, or chromium and mixtures thereof. A
particularly useful shielding material is available under the trade; name HI-
PERM 49 from
Carpenter Technology. Other useful shielding materials include: cold-rolled
steel that has
been chrome-plated to resist corrosion. The permanent magnet 190 should be
fabricated from
a material that provides sufficient force to secure the test fixture 118 to
the probe base 192
-I2-
CA 02344755 2001-04-18
EMLN: EL493560553US
Attorney Docket No. 65304-0155
Symyx 99-90
during screening. Useful permanent magnets 190 include samarium cobalt
magnets, ceramic
ferrite magnets, aluminum-nickel-cobalt magnets, and neodymium-iron-boron
magnets.
Fig. 4 illustrates interactions of the probes 104, the sensors 106, and a
material sample
array 230. Fig. 4 shows a cross sectional view of the PDMA 100 of Fig. l taken
from a plane
that cuts through the two isolation block modules 124 and contains centerlines
of two
adjacent probes 104. During screening, each test fixture 118 portion of the
probes 104
interacts with one element of the sample 230 array, which is positioned at a
predefined
location 108 of the sample holder 102. Movement of the sample holder 102 in a
direction
normal 114 to the surface of the sample array 230 results in forces that are
transmitted to the
sensors 106 via each probe test fixture 118, probe base 192, annd composite
shaft 120. Each
composite shaft 120, which includes a rigid core 158 wind thermally insulating
outer sheathing
160, 162, 164, contacts the force sensor 106 directly or indirectly as
discussed below.
The relatively large footprint of each sensor 106 shown in Fig. 4 makes it
impracticable to mount all of the sensors 106 on a single plane while
maintaining nine-mm
spacing between centers 126 of adjacent sensors 106. Of cowrse, using sensors
with smaller
footprints may allow for mounting in a single plane. To provide nine-mm
spacing, the
PDMA 100 employs sensors 106 mounted on first 232 and second 234 sensor
boards, which
rest on upper 236 and lower 238 rigid support plates, respectively. Both
support plates 236,
238 include holes that extend from top surfaces 240, 242 of flue plates 236,
238 to bottom
surfaces 244, 246 of the plates 236, 238. The holes are arrayed on nine-mm
centers, and are
' either threaded or non-threaded. Non-threaded holes 248 in the upper support
plate 236 are
substantially aligned with through-holes 250 in the first sensor board 232.
The non-threaded
holes 248 and the through-holes 250 are sized to provide passageways for rods
252 that
transmit forces from the composite shafts 120 to sensors 106 mounted on the
second (lower)
sensor board 234. The PDMA 100 thus maintains the most preferred spacing by
distributing
the force sensors 106 among'two boards 232, 234-thereby doubling the surface
area
available to mount the force sensors 106-and by arranging the sensors 106 so
their centers
126 are nine-rnm apart when projected on the surface of the saunple array 230.
When using
smaller sensors or when nine-mm spacing is not desired, the P'DMA may dispense
with one
of the two sensor boards. As many sensor boards as is practical for a
particular embodiment
may be employed.
-13-
CA 02344755 2001-04-18
EMLN: EL493560553US
Attorney Docket No. 65304-0155
Symyx 99-90
Fig. 5 and Fig. 6 provide further details of the sensors 106 and sensor boards
232,
234, showing respectively, a bottom perspective view and a close-up top view
of the first
sensor board 232. The first 232 and second 234 sensor board.. generally
comprise a flexible
mufti-layer dielectric sheet 27.0 (e.g., polyimide) and a rigid frame 272
(e.g., FR-4 epoxy
glass laminate) that is bonded to the periphery of the dielectric; sheet 272.
Electrically
conductive traces 274 are embedded on top 276 or bottom surfaces 278 of the
dielectric sheet
270, or between layers of the flexible sheet 270, forming a double-sided flex
circuit 280.
Each sensor 106 is mounted on the top surface 276 of the flex circuit 280, and
leads'282 on
the sensors 106 are connected to conductive traces 274 that te~~ninate at a
standard card edge
connector 284. Conventional ribbon cables can be used to linlk the card-edge
connector 284
with peripheral recording and control devices (not shown) allowing
communication between
the sensors 106 and the peripheral devices.
As shown in Fig. 5, the first 232 and second 234 sensor boards include
generally
planar stiffeners 286 (e.g., FR-4 epoxy glass laminates) attached to the
bottom surface 278 of
the sensor boards 232, 234 directly below the sensors 106. Each of the
stiffeners 286 has
about the same footprint as the sensors 106, and helps distribute loads on,
and prevent
bending of, the sensors 106. Note however, the stiffeners 286 do not prevent
movement of
the sensors 106 in a direction normal 114 to the sample array 230 since the
sensors 106 are
mounted on the flexible dielectric sheet 270. Although other Embodiments can
use rigidly-
mounted sensors, the PDMA 100 shown in Fig. 1 uses sensor's 106 mounted on the
flex
circuit 280 to allow "pre-loading" of the sensors 106 as discussed below. Pre-
loading may of
course be performed by other methods, which those of skill in the art will
appreciate from a
review of this specification.
The first sensor board 232 shown in Fig. 6 also include;s.a plurality of
through-holes
250 that are located between the sensors 106. Following assembly of the PDMA
100, the
through-holes 250 are substantially aligned with unthreaded holes 248 in the
upper support
plate 236 (Fig. 4). As noted above, the unthreaded holes 248 in the upper
support plate 236
provide passageways for rods 252 that transmit forces from the composite
shafts 120 to
sensors 106 mounted on the second (lower) sensor board 234. Thus, the centers
126 of the
sensors 106 and the through-holes 250 of the first sensor board 232 are
arrayed on nine-mm
centers.
-14-
CA 02344755 2001-04-18
EMLN: EL493560553US
Attorney Docket No. 65304-0155
Symyx 99-90
Referring to Fig. 4-6, threaded holes 288, 290 in the upper 236 and lower 238
support
plates are sized to receive set-screws 292 that the PDMA 100 can use to pre-
load each of the
sensors 106 mounted on either the first 232 or second 234 sensor boards. As
noted in the
description of Fig. 2, the flexure strips 150 used to align the probes 104,
are compliant for
displacements normal 114 to the plane containing the sample .array 230, but
are mechanically
stiff for displacements in other directions. Moreover, the effective spring
constants of the
flexure strips 150 are substantially less than the spring constants of the
sensors 106 so that the
flexure strips 150 ordinarily exert minimal influence on the measured
responses of the sample
array 230 to mechanical perturbations. However, since the sensors 106 are
mounted on the
flex circuit 280, the set-screws 292 can apply a force to the stiffeners 286
and the sensors 106
in absence of a force on the test fixture 118. A force recorded by the sensors
106 will
therefore be the sum of the force acting on the test fixture 118 and the pre-
load force. Since
many commercial force sensors can detect only tensile or compressive loads,
pre-loading
permits a compressive sensor to detect small tensile loads, or a tensile
sensor to record small
compressive loads, expanding the capabilities of the PDMA 100. Note that the
lower support
plate 238 and the second sensor board 234 both include unthrE;aded holes 294,
296 that
provide access to the set-screws 292 in the upper support plate; 236.
The PDMA 100 can use a wide variety of sensors 106, including miniature force
sensors. Most of the sensors 106 incorporate signal conditioning electronics.
Suitable force
sensors include piezoresistive micromachined silicon strain garages that form
a leg of a
conventional Wheatstone bridge circuit. A useful low-compliant force sensor is
available
from Honeywell under the trade name FSL05N2C. The Honeywell force sensor has a
500-g
range (4.9 N full scale), which is suitable for most of the screening methods
described in
subsequent sections. As noted earlier, many farce sensors can. tolerate only
modest variation
in temperature without compromising accuracy and precision. The use of a
composite shaft
120 having an insulating sheathing 160, 162, 164 (Fig. 2) pernnits substantial
temperature
variation of the sample array 230 without significantly affecting the
temperature and accuracy
of the sensors 106.
In an alternative embodiment, force sensors are incorporated into the flexure
strips
150 by placing strain gages on the diaphragms 166 (Fig. 2). Strain resulting
from the
application of a knowwforce-typically a deadweight load applied to the rigid
shaft 120-is
recorded and used to develop a calibration curve for the force ;sensor. The
principal
-15-
CA 02344755 2001-04-18
EMLN: EL493560553US
Attorney Docket No. 65304-0155
Symyx 99-90
disadvantage of this approach is the extensive signal conditiorung
requirements associated
with strain gage measurements.
Referring again to Fig. 1 and Fig. 2, the PDMA 100 may include an
environmental
chamber,(not shown) that encloses the sample holder 102, the probes 104,
and.the upper 152
or intermediate 154 segments of the isolation block modules 124. The chamber
may be filled
with a gas of known composition to study its influence on bullk physiical
properties of the
sample array 230 elements. Or the chamber may be filled witlh an inert gas to
reduce
oxidation of the sample array 230 elements during screening. Generally, the
annular gap 168
between the composite shafts 120 and the cylindrical apertures 122 is
minimized to limit the
1,0 flow of gas out of the isolation block modules 124. In addition, the
flexures 150 in the
annular gaps 168 restrict gas efflux from the isolation block modules 124.
Alternatively, the enviromnental chamber may comprise a substantially gas-
tight
enclosure that surrounds the sample holder 102, the probes 10'4, the isolation
block modules
124, and the sensors 106. The enclosure may be further separated into two
compartments-
one that encloses the sample holder 102 and the material samples 23.0, and one
that encloses
the sensors 106 and the isolation block modules 124. The latter embodiment
allows
blanketing the sample holder 102 and material samples 230 wiith a first gas
that is different
than a second gas blanketing the sensors 106. In this way, the PDMA can vary
the
environment of the material samples 230 independently of the sensors 106,
while maintaining
the sensors 106 at conditions different than or the same as the laboratory
environment.
The environmental chamber may include devices for regulating and/or monitoring
the
temperature of the sample array 230 elements. Useful devices include one or
more heating or
cooling elements placed within a gas stream that feeds the environmental
chamber containing
the sample array 230. Other useful devices include an array of"radiant heaters
positioned
adjacent to the sample array 230. Alternatively, the PDMA 1CI0 may include
resistance
heaters or thermoelectric devices that are attached to the sample holder 102,
which heat or
cool individual or groups of sample array 230 elements. The I'DMA 100 may also
include
devices such as thermocouples, thermistors, or resistive therma devices (RTD)
for
monitoring the temperature of individual sample array 230 elements. In some
embodiments,
the PDMA 100 includes a temperature controller, such as a data acquisition
board, for
subjecting the sample array 230 to a desired temperature-time ;profile. The
temperature
controller automatically adjusts the power supplied to the heatiing and
cooling devices in
-16-
CA 02344755 2001-04-18
EMLN: EL493560553US
Attorney Docket No. 65304-0155
Symyx 99-90
response to signals received from the temperature monitoring devices.
Typically, software
running on an external computer communicates and coordinates functions of the
temperature
controller and the temperature monitoring devices.
PDMA Control and Data Acquisition
Fig. 7 shows schematically a system 300 for data acquisition and control of
the
PDMA. As noted in the discussion of Fig. 1, the PDMA 100 includes first 110
and second
112 translation actuators for displacing the sample array 230 (1?ig. 4) in a
direction normal
114 to the probes 104. The first translation actuator 110 provides relatively
coarse
displacement of the sample holder 102; it positions the elements of the sample
array 230 near
the probe 104 test fixtures 118, and can be regulated using a DC motor
controller (not
shown). The second translation actuator 112 provides relatively fine
displacement of the
sample holder 102 and is responsible. for carrying out mechanic;al~
perturbations of the sample
array 230 elements.
The second translation actuator 112 shown in Fig. 7 comprises a piezoelectric
translation stage. A primary data. acquisition board 302 (e.g., rTational
Instruments 6030E),
which is located in an external computer 304, controls the operation of the
second translation
actuator 112. The primary board 302 generates a voltage, Y~, vcrhich is
proportional to the
desired displacement of the actuator 112 (and sample holder 102). This voltage
is fed to a
piezoelectric amplifier 306 that monitors the position of the actuator 112 via
a capacitive
position sensor 308. In response to V,, the piezoelectric amplifiier 306
varies the charge, V2,
which it supplies to the actuator 112 to move the sample holder 102 to its
desired position.
The position sensor 308 generates a voltage, Y3, which is read by the
amplifier 306 and
indicates the actual position of the second translation actuator 112.
As shown i~ Fig. 7, the primary data acquisition board 302 and the external
computer
304, respectively, read and record Y3: In response to the value of Y3, the
primary board 302
updates VI as necessary and generates a timing pulse, which triggers
acquisition of Y3 from
the position sensor 308, thereby synchronizing signals V, and V,;. The
acquisition of Vj also
generates a second timing pulse, Y4, which triggers acquisition of voltages
Vs,~, V6;, and Y
from the sensors 106. Secondary data acquisition boards 310 acquire Ysi; V6f,
and V~ J, where
subscript "i"refers to a particular data line (channel) of the data
acquisition board 310. Thus,
measurements of the response of the sample array 230 to mechaJZical
perturbations is
synchronized with the motion of the second translation actuator 112 (and
sample holder 102),
-17-
CA 02344755 2001-04-18
EMLN: EL493560553US
Attorney Docket No. 65304-0155
Symyx 99-90
and the measurement of the actuator 112 position. Although l4he system 300
shown in Fig. 7
uses three secondary data acquisition boards 310 having 32 channels each, the
number of
boards 310 will depend on the number of available data channels and sensors
106:
Alternatively, the PDMA may use a single data acquisition board to control the
actuator l 12
position and to acquire sensor 106 data, assuming the board h;as a sufficient
number of data
channels and output signals.
Software running on the computer 304 coordinates the. activities of the boards
302,
310 and allows the user to specify screening parameters including positions of
the first 110
and second 112 translation actuators at any given time, the nwmber of sample
array 230
elements, and so on. Operation of the data acquisition and control system 300
with respect to
specific physical property tests is discussed below.
Screening Methods, Sample Arrays and Holders, Probe Test Fixtures
The PDMA 100 of Fig. 1 is designed to screen material sample arrays 230 based
on
measurements of many different bulk physical properties. For example, the PDMA
100 can
measure properties related to Young's modulus, which includes flexure,
uniaxial extension,
biaxial compression, and shear. The PDMA 100 can also measure physical
properties of
material samples 230 related to hardness (indentation), failure (stress and
strain at failure,
toughness), adhesion (tack, loop tack), and flow (viscosity, melt flow
indexing, and
rheology), among others.
As described in the next sections, the screening criteria. or measurement
techniques
depend on selection and use of appropriate sample array 230 format, sample
holder 102
configuration, and probe 104 test fixture 118 design. We use different
reference numbers to
distinguish between separate embodiments of the sample array 230, sample
holder 102,
probes 104 and test fixtures 118. For example, probe.104 test :fixtures I 18
shown generally in
Fig. 1 are labeled 322 in Fig. 8 (flexure); 422 in Fig. 13 (uniax:ial and
biaxial compression);
462 in Fig. 14 (shear); 402 in Fig. 15 (indentation), 542 in Fig. 17
(viscosity and rheology);
and the like.
Determination of Young's Modulus from Flexure Measurements"Push-Pin Test"
Fig. 8 shows a cross-section view of representative components of a material
sample
array 320 and test fixtures 322 that the PDMA 100 can use to screen libraries
of materials
based on flexure measurements. 'The sample array 320 generally includes a
flexible substrate
-18-
CA 02344755 2003-09-16
324 clamped between perforated plates 326, 328 that comprise a sample holder
330. One or
both sides of the flexible substrate 324 are coated with material samples 332
at discrete,
predefined regions on the substrate 324. The predefined regions generally
correspond to
unclamped portions of the flexible substrate 324, which in Fig. 8, coincide
with circular
perforations 334 in the plates 326, 328. Each of the test fixtures 322 has a
hemispherical end
336 of known radius that contacts the sample array 320 over a surface area
that is
substantially less than the unclamped area of the flexible substrate 324.
Useful substrate 324
materials include polyimide films, which generally range in thickness from
about 10' ~,m to
about 102 pm. The material samples 332 have comparable thickness, and are
typically twenty
~.m or so thick.
In some cases, clamping may be insufficient to secure the flexible substrate
324
between the perforated plates 326, 328. Thus, in an alternative embodiment,
the flexible
substrate 324 is bonded to one of the perforated plates 326, 328 using a
pressure sensitive
adhesive. The adhesive should be less compliant than the flexible substrate
324, and during
its application, care should be taken to ensure a uniform bond line adjacent
to the circular
perforations 334. Washers or similar shim stock (not shown) can be used to
define a standoff
between the two perforated plates 326, 328.
Various methods can be used to make the sample arrays 320. For example, a
sample
array 320 comprised of polymers can be prepared by depositing known amounts of
solid
samples 332 at predefined regions on the flexible substrate 324. Following
deposition, the
samples 332 and substrate 324 are compressed under melt-flow conditions to
create polymer
films of requisite thickness. Alternatively, the polymer samples 332 can be
dissolved in one
or more solvents and deposited at predefined regions on the flexible substrate
324 using
conventional liquid handling techniques such as automated pipetting. To
prevent liquid
samples 332 from spreading beyond their respective predefined regions, the
flexible substrate
324 is pretreated--e.g., by selective etching or by silane treatment-to modify
the surface
energy of the substrate 324 in or out of the predefined regions. Upon
deposition, the
-19----
CA 02344755 2001-04-18
EMLN: EL493560553US
Attorney Docket No. 65304-0155
Symyx 99-90
liquid samples 332 are confined to regions having like surface; energies, and
form solid films
following evaporation of the solvent. After brief annealing under vacuum to
remove residual
solvent, the thickness at the center of each sample 332 can be measured using
a variety of
known techniques; including optical reflection profilometry and optical
interference
profilometry. Finally, metallic or organometallic compounds can be directly
deposited on the
flexible substrate 324 by chemical vapor deposition, physical vapordeposition,
or similar
techniques.
In some instances, the size and placement of the material samples 332 on the
flexible
substrate 324 can affect the physical measurements. For exair ple, as shown in
Fig. 8, each of
the material samples' 332 covers a substantial portion but not a.ll of the
substrate 324
delineated by the circular perforations 334 in the sample holder 330 plates
326, 328.
Although films made by solution deposition techniques often 1'nave relatively
uniform
thickness near their centers, they exhibit substantial variation away from
their centers, which
can influence flexural measurements. To minimize edge effects, material
samples 332 made
by solution deposition techniques should generally extend beyond the regions
defined by the
circular perforations 334. In addition, the material samples 332 shown in Fig.
8 are typically
deposited on one side of the substrate 324, and generally on the side of the
substrate 324
facing away from the test fixtures 332. This helps eliminate forces resulting
from adhesion
between the test fixtures 322 and the samples 332 and from plastic deformation
of the '
samples 332 at the contact points between the test fixtures 322 and the sample
array 320.
Samples 332 may be located on the side of the flexible substrate 324 facing
the test fixture
322 as long as plastic deformations are unlikely or combined measurements of
adhesion and
flexural modulus are desired.
Fig. 9 shows results of a flexure measurement for a single element of the
material
sample array 320 shown in Fig. 8. Flexure measurements or "push-pin" tests,
generally
comprise translating the sample holder 330 and material sample array 320 in a
direction 114
normal to a plane containing the flexible substrate 324, and recording the
force exerted on the
test fixtures 322 as a function of the displacement of the array :320 (or
second translation
actuator 112). An analysis of the resulting force-displacement curve 360 in
the absence of a
3,0 material sample 332 coating yields the elastic modulus, E~, of the
substrate 324. Comparison
of force-displacement curves 362; 360 obtained with and without the coating
yields the ratio
of the sample 332 elastic modulus, E2, to the substrate 324 elastic rnodulus.
As described
20-
CA 02344755 2001-04-18
EMLN: EL493560553US
Attorney Docket No. 65304-O1 SS
Symyx 99-90
below, the analysis of the force-displacement curves employs well-known
analytical and
numerical models for the behavior of a clamped membrane.
Fig. 10 and Fig. 11 show, respectively, results of flexure measurements made
in a
"direct" mode or an "oscillatory" mode. In terms of the PDM:A components shown
in Fig: 8,
~5 the direct mode comprises initially translating the sample holder 330 and
material sample
array 320 against the test fixtures 322 at a known rate until the sample 332
reaches a given
maximum deflection or normal 114 displacement. The method includes reversing
the
displacement until the sample 332 returns to its original position, and
analyzing the resulting
force-displacement cur a to characterize the mechanical properties of the
sample 332. Fig.
L0 10 shows representative force-displacement curves 380 for the; initial 382
and return 384
displacements of 13.7-p,m thick polyimide (K.APTON) films undergoing strain
rates ranging
from 25 ~m/s to 250 p,m/s. As expected, the force-displacement curves 380 are
independent
of strain rate.
Like the direct measurements, the oscillatory mode coxnprises translating the
sample
15 holder 330 and material sample array 320 against the test fixtures 322 at a
known rate until
the sample 332 reaches a given maximum deflection or normal 114 displacement.
However,
following the initial displacement, the method includes translating the sample
holder 330 and
sample array 320 along the deflection direction 114 in an oscillatory motion
of known
amplitude and frequency. As described in detail below, the amplitude and
initial
. 20 displacement are typically chosen to ensure that, throughout the entire
motion, the_ sample
332 or substrate 324 deflections remain in a linear deflection rf;gime defined
below.
Fig. 11 shows oscillatory force-displacement curves 400, 402 for,
respectively, a 50-
pm thick polyimide (KAPTON) substrate 324 with and without a 30-~m thick
polystyrene
coating (sample 332). The oscillatory technique yields frequency-dependent
modulus values
25 that for some~samples 332 relate to characteristic modes of
mol'.ecular,deformation. Thus, the
oscillatory technique is often called "dynamic mechanical spectroscopy"
because, it is
analogous to conventional spectroscopic measurements, which identify
characteristic
frequencies of electronic transitions. One advantage of the oscillatory
technique over the
direct method is that, if the measurements are performed in the linear
deflection regime, the
30 force-displacement curve is also sinusoidal, exhibiting the same; frequency
as the test fixture
322 or probe deflection. As a result, the effective bandwidth of the
measurement is
comparatively low, and the associated signal-to-noise ratio is comparatively
high.
-21-
CA 02344755 2001-04-18
EMLN: EL493560553US
Attorney Docket No. 65304-0155
symyx 99-90
To measure modulus using the oscillatory method, the sample holder 330
is~attached
to the second translation actuator 112, and the test fixtures 322 are attached
to the probes 104:
The first (coarse) translation actuator 110 positions the sample holder 330
near the probes
104, but at a sufficient distance so that none of the test fixtures 322
contact the flexible
substrate 324 or any elements 332 of the sample array 320. Using the second
translation
actuator 112, the PDMA 100 makes initial stiffness measurements (force per
displacement
amplitude) of the sample ariay 320 elements 332. Next, the first actuator 110
translates the
sample holder 330 closer to the test fixtures 322 by a predeter~~ined amount
typically, a
step size of one half of the oscillatory displacement amplitude used in
measuring stiffness--
and the PDMA 100 repeats the stiffness measurements. The PIMA 100 continues
this
process until all of the material samples 332 of the array 320 are in contact
with the test
fixtures 332.
The stiffness measurements can be understood by reference to Fig. 7 and Fig.
12.
Referring first to Fig. 7, software running on the computer 304 directs the
primary data
acquisition board 302 to generate a sinusoidally varying output voltage, IrS.
The output
voltage corresponds to a typical second translation actuator 112 oscillation
amplitude of, for
example, five Vim, at a fixed frequency (e.g., ten Hz) and for a fixed number
of cycles (e.g.,
sixty six). The amplitude of oscillation is chosen so as to produce a
reasonably large signal at
the sensors 106 for the samples 332 of interest. The first two waveforms are
usually
discarded to eliminate transients. The remaining data are Fourier transformed
to extract the
actual amplitude of the oscillation of the second translation actuator 112 (or
sample holder
330) and the amplitude of the force recorded by the sensors 106 ;~t the drive
frequency. .
Dividing the force amplitude by the motion amplitude yields the stiffness
(N/m). The raw
data for each sensor 106 may also be cross-correlated against the raw data for
the actual
second translation actuator 112 motion in to extract the relative phase of the
two signals.
This phase serves as a measure of the character of the deformation (elastic
versus viscous)
and can be used to separate the measured stiffness into an elastic or storage
contribution and a
viscous or loss contribution.
Fig. 12 shows a representative stiffness-displacement 406 curve measured at a
drive
frequency of ten Hz, an oscillation amplitude of 5 ~,m, and a coarse stage
(first translation
actuator 11) displacement step size of 2.5 ~.m. The material sample 332 is a
thin film of a
polystyrene-poly(ethene-co-butene)-polystyrene block copolymer, which has been
deposited
22-
CA 02344755 2001-04-18
EMLN: EL493560553US
Attorney Docket No. 65304-0155
Symyx 99-90
on a 0.002-inch thick polyimide flexible substrate 324. At the beginning of
the modules
measurements, as represented liy a first region 408 of the stiffr:~ess-
displacement curve 406,
the probes 104 are not in contact with the material samples 332. In this
region of the curve
406, the sensors 106 record only electrical noise during oscillation of the
second translation
actuator 112, and the resulting measured stiffness is low (e.g., :less than
about ten N/m). As
the test fixtures 322 of the probes 104 are brought into contact with the
sample array 320, the
sensors 106 initially see a periodic but non-sinusoidal signal at the drive
frequency. This
phenomenon is represented by a second region 410 of the stiffriess-
displacement curve 406,
and corresponds to contact between the probe and sample 332 at the maximum
oscillation
amplitude of the second translation actuator 112. Fourier transforms of these
signals .show a
number of higher order harmonics that may be used to identify the point at
which, for a given
probe 106 and sample 332; the test fixture 322 first contacts the; sample
array 320 element
332. Upon further movement of the first translation actuator 1110 (and sample
holder 330),
the signals from the sensors I 06 become increasingly sinusoidal; Fourier
transforms of these
signals show decreasing levels of higher order harmonics. Along this third
region 412 of the
stiffness-displacement curve 406, the measured stiffness increases with
displacement of the
first translation actuator 110 and the sample holder 330.
Eventually, the probes 106 are in contact with the material samples 332
throughout
the oscillation of the second translation actuator, as represented by a fourth
region 414 of the
stiffness-displacement curve 406. Here, the output signals from the sensors
106 are almost
purely sinusoidal, and the stiffness becomes independent of the position of
the first
translation actuator 1 I0. In this region 414 of the curve 406-the "linear
deflection
regime"-the force, exerted by a given sample 332 is a lineax function of the
oscillation
amplitude of the second translation actuator 112. Also, in this region 414 of
the stiffness-
displacement curve 406, the subsfirate 324 modules and the material sample 332
modules can
be calculated using analytical models that describe the deflection of a
circular membrane
clamped along its circumference. See discussion of equations I-IX below.
The width of the region 412 of the stiffness-displacement curve 406 in which
the
stiffness rises rapidly with displacement, is approximately equal. to twice
the amplitude of the
oscillation of the second translation actuator 112. Thus, using a first
(coarse) actuator 110
step size of one half the oscillation amplitude ensures at least four data
points throughout this
region and provides a reasonably accurate estimate of the sample 332 stiffness
at the edge of
23-
CA 02344755 2001-04-18
EMLN: EL493560553US
Attorney Docket No. 65304-0155
Symyx 99-90
the linear deflection regime ("linear stiffness"). To bring all of the samples
332 into contact
with the test fixtures 332, it may be necessary to drive the first .actuator
110 to a position in '
which some samples 332 are in a fifth region 416 of the stiffness-displacement
curve 406.
This region 416 of the curve 406 is outside of the linear deflectiion regime
414 and exhibits a
rise in the sample stiffness with increasing displacement of the first
translation actuator 110.
The PDMA automatically determines linear stiffness for each stiffness-
displacement
curve 406 of the material samples 332 by starting from the initi~~l first
translation actuator 110
position and identifying the first stiffness measurement that exceeds a
predetermined
threshold value (e.g., twenty five N/m). Once this threshold is crossed, the
stiffness measured
2AlC + 1 steps later, where A is the oscillation amplitude of the second
actuator 112 and C is
the first (coarse) translation actuator 110 displacement, is assumied to be
equal to the linear
stiffness and is recorded.
The moduli of the substrate 324 and the material samples 332, can be obtained
from
the force-displacement curves 360, 362, 400, 402 using analytical models that
describe the
deflection of a circular membrane clamped along its circumference. For
deflections of up to
about one-half of the thickness of the circular membrane-the linear deflection
regime-the
deflection, y, is given by the expression:
_ Fr2
y 16~ D ' I
II
D 121-vZ '
where E is the modulus of the clamped film or membrane, r is th.e radius of
the film, 8is the
thickness of the film, F is the force resulting from the deflection, v is
Poisson's ratio, which is
often assumed to be of order 0.3, and D is the plate constant. Se~~ W. C,
young, Roark-ss
Formulas for Stress and Strain (1989): For larger film displacements, the
deflection is
approximated by:
Fr2 =k y +k y 3 III
Es4 1(s~ 2 s ,
C~
where k~ and k~ are constants that depend on the ratio of the area of test
fixture 322 contact to
24-
CA 02344755 2001-04-18
EMLN: EL493560553US
Altorney Docket No. 65304-0155
Symyx 99-90
the area of the clamped film 324. Values of these constants have been
tabulated for a wide
range of area ratios. Depending on the relative magnitudes of ahe deflection
and film
thickness, equations I-III yield the substrate 324 modulus, El, i:or values of
F and y from the
force-displacement curves 360, 362, 402.
Given the modulus of the substrate 324, one may obtaizi the modulus of the
samples
322 from analytical models that describe the deflection of a composite
circular film or plate
clamped alor<g its circumference. The plate constant D for a composite plate
formed from
two materials having moduli E! and E?, and thickness 8~ and SZ, is given by:
-~
In the expression for D,
K=1+~c3 +3(1+z~2 V
1+1/~c '
~ _ EE-,',' , and
z - sl . vII
Z
If subscripts "1" and "2" in equations IV-VII refer to the sample; 332 and
substrate 324,
respectively, and iff= F2/F, represents the ratio of forces measured at the
same deflectiony
for the coated and non-coated substrates, then for small deflections described
by equations I
and II, equation V becomes:
f =1+sz3+3(1+z~2 .
VIII
1 + 1/sa
Expanding equation VIII and collecting like-terms yields:
(~c~ZZ2 +(sz~(4r2 +6a+4- f~+(1- f~=0.
25-
CA 02344755 2001-04-18
EMLN: EL493560553US
Attorney Docket No. 65304-0155
Symyx 99-90
Since z, f and E, are known, equation IX can be solved for E, a~;id E~ can be
calculated from
equation VI.
Qther embodiments of the flexure measurements includle: (i) omitting the
coating if
the mechanical properties of the flexible substrate are of intere:>t, as would
be the case for
freely standing metal films; (ii) replacing the circular substrate 324 with a
rectangular beam
or other structure of known geometry; and (iii) relaxing the constraint that
each of the test
fixtures 322 has a hemispherical end 336 that contacts the sample array 320
over a surface
area that is substantially less than the unclamped area of the fle:~ible
substrate 324.
Young's Modulus-Uniaxial Extension and B;ax;at r~.,mpression
Fig. 13 shows a cross-section view of a portion of a material sample array 420
and test
fixtures 422 that the PDMA ,100 can use to screen libraries of materials based
on uniaxial
extension or biaxial compression measurements. The sample array 420 generally
includes a
rigid substrate 424 that is~attached to a moveable sample holder 426. Discrete
material
samples 428 belonging to a library of materials are sandwiched 'between the
rigid substrate
424 and the test fixtures 422. If measuring tensile forces resultnng from
uniaxial extension,
the material samples 428 are bonded to the rigid substrate 424 a'c~d the test
fixtures. Using the
second translation actuator 112, the sample holder 426, rigid substrate 424,
and sample array
420 are translated away from the test fixtures 422 in a direction 430 normal
to a plane
containing the material sample array 420. During the translation, the PDMA 100
records
tensile forces exerted on. the test fixtures 422 at the sensors 106 ~~s a
function of displacement
from the sample array 420. ,
When measuring biaxial compression, the material samples 428 of Fig. 13 are
not
bonded to the rigid substrate 424 and the test fixtures 422: Instead, the
samples 428 will flow
laterally when compressed. Surfaces 432, 434 of the substrate 424 and test
fixtures 422 that
contact the material samples 428 have low coefficients of friction and are
designed to
minimize sample deformation associated with friction. The substrate 424 and
the test fixtures
422 may be fabricated from a low fi"iction material such as a fluoropolymer,
or their surfaces
432, 434 may be coated with lubricating oil. In preferred embodiments, the
surface 434 of
each test fixture. 422 is generally smooth, flat, axisymmetric, and has a
diameter comparable
to the diameter of the material sample 428. In a representative measurement,
the test fixtures
422 and the sample array 420 are brought into contact by the first translation
actuator 110,
26-
CA 02344755 2001-04-18
EMLN: EL493560553US
Attorney Docket No. 65304-0155
Symyx 99-90
and the second translation actuator 112 compresses the material samples 428 at
a defined
displacement rate while the sensors 106 measure forces exertecC on the test
fixtures 422. In am
alternative embodiment, the second translation actuator 112 compresses the
material samples
428 sinusoidally at a known amplitude and frequency, while the sensors 106
measure the
compressive forces on the test fixtures 422. Comparison of the; force and
displacement
waveforms yields the complex compressive modulus of the material samples 428
at that
frequency. Note that compressive measurements at small strains are not limited
to solids, but
can be performed on viscoelastic liquids as well. The resulting waveforms
yield the biaxial
extensional rnodulus of the liquid samples 428.
Young's Modulus-Shear
Fig. '14 shows a cross-section view of representative components of a material
sample
array 460 and test fixtures 462 that the PDMA 100 of Fig. 1 cart use to screen
libraries of
materials based on shear force measurements. Each element 464 of the sample
array 460 and
corresponding test fixture 462 comprise portions of a cylinder that has been
bisected along a
plane containing its symmetry axis: The base 466 of the test fixture 462 is
contained within a
cylindrical cup 468 having a tapered recess 470 positioned parallel to, but
displaced from, the
cylinder (test fixture 462) axis. The tip 472 of the sample array 460 element
464 is formed
into a tapered pin 474 that mates with the tapered recess 470. Inserting the
pin 474 into the
recess 470 brings the rectangular faces 476, 478 of each sample array element
464 and test
fixture 462 together; thereby compressing and shearing material samples 480
present on the
faces 476, 478. The sample array elements are bound to a rigid plate 482,
which is attached
to a moveable sample holder 484. The material samples 480 many be formed into
sheets of
desired dimensions, which are laminated to one or both faces 476, 478 prior to
measurement.
Alternatively, the samples 480 may be dissolved in a solvent and deposited on
one or both of
the faces 476, 478 by standard liquid handling techniques. Following
evaporation of the
solvent, the samples 480 are compressed between the faces 476, 478 of the test
fixture 462
and the sample array element 464. A typical measurement comprises°
displacing the sample
array 460 relative to the test fixtures 462 in a direction 486 paralael to
their faces 476, 478,
while measuring the resulting shear forces on the test fixtures 462.
Alternatively, the second
translation actuator 112 can execute a sinusoidally varying displacement of
the sample array
460, while measuring amplitudes and relative phases of the resulting shear
forces on the test
fixtures 462. Such measurements can yield Young's modulus, rheological
modulus, and
27-
CA 02344755 2001-04-18
EMLN: EL493560553US
Attorney Docket No. 65304-0155
Symyx 99-90
adhesion characteristics. In a closely related test, the PDMA c:an measure,
for a given force,
the time required for adhesive or cohesive, failure of material samples 480.
Young's Modulus and Hardness-Identation
Fig: 15 shows a cross-section view of a portion of a material sample array 500
and a
representative test fixture 502 that the PDMA of Fig. 1 can use; to screen
libraries of materials
based on indentation measurements. In a typical indention xrieasurement, the
force required
to drive the test fixture 502 a known distance into a material saunple 504 is
measured by the
sensors 106 and related to various properties of the material sample 504. The
resulting
deformation generally involves both plastic and elastic components, which
complicates the
analysis. The analytical difficulties generally limit the use of the technique
to index
measurements, where material samples 504 are ranked based on the penetration
forces for a
given displacement speed and penetration depth. Although the. samples 504 may
be mounted
on a flexible substrate such as polyirnide, the penetration force will include
a contribution
from the deformation of the substrate. Thus; the samples are generally
disposed on a rigid
substrate 506, such as aluminum' or stainless steel, which is attached to a
moveable sample
holder 508. Each of the test fixtures 502 may be a stainless steel hemisphere
of known
diameter, a stainless steel stylus (pointed tip) of known opening angle, or a
flat-topped
cylindrically symmetric rod.
Fig. 16 shows force-displacement curves 520 for melt-pressed polystyrene
samples
mounted on a rigid substrate. The three curves 522, 524, 526 represent force-
displacement
profiles for penetration depths of 35 Vim, 80 ~,rn, and 120 ~,m, respectively.
Although the
force-displacement curves are somewhat reproducible for small!. deformations,
plastic
deformation appears at about ten percent of the sample thickne:>s.
Viscosi
Fig. 17 shows a cross-sectional view of a portion of a material sample array
540 and a
representative test fixture 542 that the PDMA 100 of Fig. 1 can use to screen
libraries of
materials based on viscosity-related measurements. Generally, the driving
force necessary to
move a body of known size, shape and surface texture through a liquid at a
given relative
velocity will provide a measure of viscosity. However, whethw the force
measurement can
be related to the viscosity of the liquid depends strongly on the complexity
of the flow field
induced by the relative motion.
28-
CA 02344755 2001-04-18
EMLN: .EL4.93560553US
Attorney Docket No. 65304-0155
Symyx 99-90
Since the embodiment shown in Fig. 17 produces a relatively simple flow field,
it can
yield an accurate measurement of viscosity. Each test fixture :542 generally
comprises a
cylindrically symmetric well 544 that contains a liquid sample 546. In
addition to the liquid
samples 546, the material sample array 540 includes spaced-apart cylindrical
rods 548 having
axes substantially aligned with the symmetry axes of the wells 544. The
cylindrical rods 548
are attached to a rigid plate 550, which is mounted on a moveable sample
holder 552. For
each test fixture 542, the ratio of the well 544 depth to the well 544 radius
is generally much
greater than unity. As a,result, the relative displacement of the rods 548 and
wells 544
induces flow that is dominated by the motion of the liquid sample 546 within
an annular gap
554 formed between the rod 548 and well 544-not by flow ari~und the end of the
rod 548. A
viscosity measurement includes using the second translation actuator 112 to
insert the rods
548 into the wells 544 at a constant rate, and measuring the forces on the
test fixtures 542 at
the sensors 106. This displacement may be reversed, in which the sensors 106
measures the
force required to remove the rods 548 from the wells 544 at a a~nstant
displacement rate.
In a closely related second embodiment, each of the test fixtures 542 includes
a
through-hole (not shown), centered on the bottom 556 of each of the wells 544.
The through-
hole has a diameter much less than the diameter of the wells 544. Instead of
the cylindrical
rod 548 shown in Fig. 17, the second embodiment includes thin, wires, polymer
fibers, or
other cylindrical filaments (not shown) having diameters less than the
diameter of each
through-hole. One end of each filament is attached to the rigid plate 550,
while the other end
passes through the through-holes in the bottom 556 of the wells 544.
Typically, the end of
the filament located adjacent the through-hole is left "free," provided the
filament has
sufficient flexural stiffness to remain substantially aligned with khe well
544 axis. If lacking
the requisite stiffness; the filaments are constrained by threading; them
through a small
diameter clearance holes in plates (not shown) located adjacent the test
fixtures 542. The
wells 544 are filled with a high viscosity liquid such as a polymE:r melt;
viscous entrainment
of the liquid and surface tension are sufficient to contain the liquid within
each well 544. To
perform viscosity measurements, the second translation actuator 112 draws
filaments through
the through-holes at a constant rate and the sensors 106 measure forces
exerted on the test
fixtures 542 (wells 544). The length of the filament is generally greater than
the depth of the
well so that a steady-state velocity profile can be_ achieved in the through-
hole. Compared to
the first embodiment, this method simplifies sample preparation :for high
viscosity liquids,
29-
CA 02344755 2001-04-18
EMLN: EL493560553US
Attorney Docket No. 65304-0155
Symyx 99-90
and generates results more applicable to common industrial processes such as
fiber, band, and
sheet coating.
Fig. 18 shows a cross-sectional view of a portion of a nnaterial sample array
580 and
representative test fixtures 582 that the PDMA 100 of Fig. 1 em use to screen
libraries of
materials based on melt flow indexing. The sample array includes first 584 and
second 586
cylindrical reservoirs, and liquid samples 588 that are initially contained in
the first reservoirs
584. The second reservoir 586, which has slightly larger volume than the first
reservoir 584,
is attached to a rigid plate 590 that is mounted on a moveable sample holder
592. A
cylindrical tube 594 having an inner diameter much less than the diameters of
the first 584
and second 586 reservoirs provides fluid communication betwE;en the two
reservoirs 584,
586. In addition, vent holes 596 located adjacent the rigid plate 590 provide
fluid
communication between the second reservoirs 586 and the atmosphere. The test
fixtures 582
include pistons 598 inserted in open ends 600 of the first reservoir 584.,
Each of the pistons
598 have diameters that closely match the inner diameter of the; first
reservoir 584, which
~ ensures a liquid-tight seal between the piston 584 and the first reservoir
584.
Screening based on melt flow indexing includes displacing the sample array 580
and
sample holder 592 toward the pistons 598 at a constant rate usvng the second
translation
actuator 112, which forces the liquid samples 588 through the csylindrical
tubes 594 into the
second reservoir 586. The screening method also includes measuring and
recording the
forces exerted on the test fixtures 582 (pistons 598) at the sensa~rs 106
while the liquid
samples 588 flow through the cylindrical tubes 594. If one neglects friction
between the .
pistons 598 and the walls of the first reservoirs 584, the viscosity, ~, at a
given shear rate can
be determined from the Hagen-Poiseulle expression for laminar' flow in a
cylindrical tube:
Q=~ d40P X
1281rJ
where Q is the volumetric flow rate, d and 1 are the inner diameter and length
of the
cylindrical tube 594, and DP is the pressure drop across 1: In equation X, Q
is the product of
the displacement rate and the cross sectional area of the first reservoir 584;
OP is
approximately the measured force divided by the cross sectional. area of the
first reservoir
584.
-30-
CA 02344755 2001-04-18
EMLN: EL493560553US
Attorney Docket No. 65304-O1 SS
. Symyx 99-90
Rheology
The sample array 540 and test fixtures 542 shown in Fiig. 17 also can be used
to
measure rheological {flow) characteristics of complex fluids. 'The sample
array 540 includes
cylindrical rods 548 or stainless steel pins of known length and diameter that
have been
coated with a viscous fluid sample 546. The test fixture 542 is comprised of a
hollow
cylinder or well 544, which has an inner diameter that varies v~rith axial
distance. Near the
bottom 556 of the well 544, the inner diameter is substantially greater than
the outer diameter
of the stainless steel pin 548; near the open end 558 of the well 544, the
inner diameter is
slightly larger than the outer diameter of the pin 548. Within .tlhe well 544,
the transition from
small to large inner diameter is abrupt, and the length of the small diameter
region is known.
Rheological measurements using the PDMA 100 of Fig;. 1 generally comprises
using
the first translation actuator 110 to insert the pin into the well 5~44
sufficiently far so the fluid
sample 546 coats the length of the small diameter region of the well 544. The
method also
includes translating the material sample array 540 (sample holder 552)
sinusoidally using the
second translation actuator 112, whzch shears the fluid sample :546 confined
in the annular
gap 554 betw~n the pin 548 and the cylindrical well 544. During the shearing,
the sensors
106 measure the forces exerted on the test fixtures 542. Knowing the
dimensions of the pin
548 and the well 544, one can relate the relative amplitude and phase of the
resulting force-
time waveforms to the complex viscoelastic modulus of the fluiid, G.
Fig. 19 and Fig. 20 show results from typical rheologicz~l measurements for
various
polyisobutylene (PIB) standards. Fig. 19 shows the real 620 and imaginary 622
parts, F'(c~)
and F"(tv), of the force exerted on the test fixtures 542 by the fluid motion
of one of the PIB
samples (9 x 10³ weight average molecular weight). Fig. 20 shows F'(c~) for
three 640, 642,
644 PIB standards, having weight average molecular weights of"24:2 x 10³, 9 x
103, and 4 x
103, respectively.
Failure Characteristics
Failure of materials may be identified from a discontinuiay in measured force-
displacement curves. The stress and strain at failure may be calculated from
this curve for
specimens of known geometry; the toughness of the material, wlhich is a
measure of the
energy involved iri producing failure, may be estimated from the; area under
the stress-strain
-31-
CA 02344755 2001-04-18
EMLN: EL493560553US
Attorney Docket No. 65304-0155
Symyx 99-90
curve. If the sample is supported on a flexible substrate, though, these
failure characteristics
will reflect the properties of the sample-substrate composite.
One way to avoid such difficulties with flexural and tensile measurements
involves
using a material sample array 320 similar to the array shown in Fig. 8.
However, when
failure testing, the portions of the flexible substrate 324 within the
circular perforations 334
are cut in half prior to deposition of the material samples 332. The samples
332 are deposited
on the substrate 324 as described above, except care is taken to ensure that
the material
samples 332 extend across the cut edges of the substrate 324 v~~ithout wetting
the surface of
the cut. Each of the resulting composites is deformed as described earlier for
flexural or
tensile measurements of Young's modulus: the. sample array 320 is displaced
away from the
test fixtures 322 until failure occurs, as indicated by a discontinuity in the
force-displacement
curve. Although the resulting force-displacement curve may b~e used to
deteirnine ~'oung's '
modulus, the deformation of uncut substrates is generally different than the
deformation of
cut substrates.
In an alternative approach, the material samples 332 are deposited on a thin,
brittle
substrate 324, such as a thin ceramic layer or rice paper, that will fail at
small strains. Next,
the PDMA 100 subjects the. array 320 of composite films or mmnbranes to
flexural or tensile
deformation, and the point at which the substrate 324 fails is identified by a
discontinuity in
the force-displacement curve. At the failure point, the mechaniical load is
completely
transferred to the sample, arid the test is continued until the sample fails.
A third approach uses a sample holder 680 and sample array 682 shown in Fig.
21.
The sample holder 680 comprises a frame 684 and U-shaped cups 686, and the
sample array
682 includes material samples 688 deposited at intersections 690 of
filamentous or rod-
shaped substrates 692. Suitable substrate 692 materials include; metals,
ceramics, and fibers.
The substrate 692 comprises lower 694 and upper 696 filaments, which are
attached to the
frame 684 and the U-shaped cups 686, respectively. The U-shaped cups 686 are
slidably
mounted in the frame 684 so that the lower 694 and upper 696 filaments
intersect at right
angles and at the center of the openings 698 of the U-shaped cups 686. When
the bottoms
700 of the cups 686 are in contact with the probes 104, translating the sample
holder 680
toward the probes 104 exerts a force on the cups 686, causing tloeni to
translate in a direction
perpendicular to a plane containing the substrate 692. In the absence of
material samples 688
-32-
CA 02344755 2001-04-18
EMLN: EL493560553US
Attorney Docket No. 65304-0155
Symyx 99-90
at the substrate intersections 690, this motion causes the lower 694 and upper
696 filaments
to separate.
To perform a failure test, the cups 686 are inserted in tlhe frame 684 and the
substrate
692 materials are laid up in the sample holder 680-first aeros~s the frame 684
and then across
the cups 686. The lower 694 and upper 696 filaments are secured through
mechanical
clamping or gluing. If necessary, the filamentous substrates 692 are cut to
permit
independent motion of substrates 692 associated with differenlt cups 686. One
advantage of
this latter design is that large numbers of filament intersections 690 (e.g.
96) may be
assembled with Limited numbers of substrate filaments 692 (e.;g. 20). The
material samples
688 are deposited at the substrate intersections 690 by liquid deposition and
are annealed as
necessary. The sample holder 680 is then attached to the second translation
actuator 112.
Measurements may be performed in at least two ways. First, the sample array
682
and the probes 104 are translated relative to one another at a known velocity,
beginning from
a position in which none of the probes 104 are in contact with the cups 686
and ending with
all of the cups 686 being displaced away from the frame 684 b;y a known
amount. vThe latter
position is generally selected to cause mechanical failure (separation) of the
lower 694 and
upper 696 filaments at all of the substrate intersections 690. 'IThe PDMA
records the force
exerted on each cup 686 at the sensors 106 either as a function of position,
or as a function of
time at a given position. In addition, the PDMA determines the maximum force
at failure, the
position where failure occurred, and the area under the force-displacement
curve. If the
sample dimensions are known, the stress and strain experience,3 by the
material samples 688
may be calculated. Thus, PDMA may be used to measure stress-strain
characteristics at large
strains. Subsequent determination of the failure mechanism~is generally done
by visual
inspection.
Second, the sample array 682 (sample holder 680) and the probes 106 are
stepped
through a series of relative displacements using the first (coarse;)
translation actuator 110. At
each step, the second translation actuator 112 translates the sarr~ple array
682 in an oscillatory
manner at a known amplitude and frequency and the stiffness of each material
sample 688 is
determined in the manner disclosed above for measuring modulLus from flexure
measurements
at small strain. If the dimensions of the samples 688 are known, the stress
and strain
experienced by the material may be determined from the stiffness.
-33-
CA 02344755 2001-04-18
EMLN: EL493560553US
Attorney Docket No. 65304-0155
Symyx 99-90
Adhesion-Probe Tack and Loop Tack
The PDMA can also be used to measure adhesion. The sample array generally
comprises a substrate of known surface energy, and material samples that are
deposited on
predefined regions of the substrate's surface. Suitable substrates include
metals (e.g.
aluminum), polymeric films (e.g. polyimide or polyethylene i~erephthalate)),
and
semiconductors (e.g. polished silicon wafers). Suitable probe test fixtures
have surfaces of
known dimensions and. surface energy and include an axially oriented stainless
steel cylinder,
a stainless steel hemisphere of known radius, and a loop formed from a strip
of polymer film
of known loop radius and width. The method generally comprises contacting each
test fixture
with a corresponding material sample for a fined length of time; separating
the test fixtures
from the samples at a fixed velocity; and recording the forces required to
separate the test
fixtures from the samples:
Fig. 22 shows a partial cross-sectional view of a first e~;nbodiment of a
sample holder
730, test fixtures 732, and material samples 734, which the PDiMA can use to
screen libraries
of materials based on tack. The sample holder 730 includes a ,group of weights
736, which
initially rest in wells 738 formed in the sample holder 730. Each of the
weights 736 is
associated with one of the test fixtures 732, which has a working surface 740
of known
composition and geometry, such as a stainless steel cylinder with a flat top.
The weights 736
shown in Fig. 22 each have a relatively narrow base portion 742 that can pass
through
clearance holes 744 located in the bottom 746 of the wells 738. In addition,
the clearance
holes 744 are sized to admit the test fixtures 732 when the sample holder 730
is lowered onto
the probes 104: The area of the working surface 740 of a particular test
fixture 732 can be the
same or different as the bottom surface 748 of a corresponding weight 736,
though generally
the areas are the same.
To perform a tack measurement, either the bottom surfaces 748 of the weights
736 or
'the working surfaces 740 of the test fixtures 732 are coated with the
material samples 734 of
known thicknesses (one sample 734 per test fixture 732). The 1PDMA then
translates the
sample holder 730 toward the probes 104, bringing,the weights 736 and test
fixtures 732 into
contact. The PDMA then moves the sample holder 730 beyond the point of initial
contact so
that the weights 736 are supported by the test fixtures 732, which results in
the application of
a known force to the.materials samples 734. After a set time hsus elapsed, the
PDMA
withdraws the sample holder 730 at a predetermined rate. During withdrawal,
the bottoms of
-34-
CA 02344755 2001-04-18
EMLN: EL493560553US
Attorney Docket No. 65304-0155
Symyx 99-90
the wells 738 make contact with the weights 736, pulling each. of the weights
736 from its
corresponding test fixture 732. This force opposes a pre-load force applied to
each of the
sensors 106 by the flexure strips 150 (see discussion of Fig. 4). For a
particular sensor 106,
test fixture 732, and material sample 734, the resulting drop in. the pre-load
force relative to
its steady state value is a measure of the adhesive force of the aample 734.
Eventually the
bond fails, and the sensor 106 reading returns to its steady state value. The
area above the
force sensor-displacement curve (measured with respect to the force applied by
the weight) is
a measure of the adhesion energy of the sample. The maximmn elongation of the
material
sample 734 at failure can be estimated from the knowledge of the film
thickness and the
sample holder 730 position at failure.
Fig. 23 shows a partial cross-sectional view of a second embodiment of a
sample
holder 770, test fixtures 772, and material samples 774, which can be used to
screen libraries
based on tack. Each of the test fixtures 772 comprises a hollow lower portion
776, which is
connected to the base 192 of the probe 104, and a removable cap 778, which is
threaded onto
1 S the lower portion 776. of the test fixture 772 forming a cavity 780. Each
of the test fixtures
732 also includes a poppet 782 having head 784 and base 786 portions, and a
relatively
narrow neck 788 portion: The cap 778 has a clearance hole 79iD that is sized
to allow only the
neck 788 portion to pass through, thereby allowing movement of the poppet 782
along the
1 longitudinal axis of test fixture 772, while retaining the base 786 of the
poppet 782 within the
cavity 780. The test fixture 772 includes a compliant spring 752 located
within the cavity
780, which exerts a force on the base 786 portion of the poppet 782. As can be
seen in Fig.
23, the sample holder 770 has a generally flat surface 794 of known
composition, such as
stainless steel. .
To perform a tack measurement, either the top; surfaces 796 of the test
fixtures 772 or
the flat surface 794 of the sample. holder 770 are coated with material
samples 774 (one
material sample 774 per test fixture 772). The PDMA then brings the flat
surface 794 and the
test fixtures 772 into contact so that the poppet 782 of each of tlhe test
fixtures 772 is
compressed against the flat surface 794 of the sample holder 770. Because the
spring 792 is
more compliant than the sample holder 770 and other portions of the test
fixtures 772, all of
the poppets 782 experience nearly the same compressive force against the
sample holder 770
despite any variations in heights of the test fixtures 772. After a set time
has elapsed, the
sample holder 770 is withdrawn at a predetermined rate. Although the poppets
782 initially
-35-
CA 02344755 2001-04-18
EMLN: EL493560553US
Attorney Docket No. 65304-0155
Symyx 99-90
remain attached to the flat surface 794 of the sample holder 7T0, the base 786
portion of the
poppet 782 is retained in the cavity 780, resulting in a force that opposes
the pre-load force
applied to each of the sensors 106. This drop in the value of the pre-load
force is measured
by each of the sensors 106, and is analyzed in an identical manner to that
given for the first
embodiment shown in Fig. 22.
The PMDA using a sample holder 730 and test fixtures 732 shown in Fig: 22 was
used to deternzine the adhesive characteristics of a commercially available
formulation
(BASF ACRONALTM DS 3510 ~. Approxirizately ten ~,l of tlhis emulsion was
deposited on
the bottom surface 748 of a brass weight 736 and dried at roomy temperature
and humidity for
one hour to fonrxi a thin film of adhesive. The weight 736 was placed in the
sample holder
730 of the PDMA with the bottom surface 748 facing the probes 104. The sample
holder 730
was lowered at 25 pm/s so as to bring the weight 736 into contact with a
stainless steel test
fixtures 732 having a rounded tip with a 1/16-inch diameter: Upon contact, the
sample holder
730 was held in.position for 2000 ~,s before being retracted at a rate of 25
~,m/s.
. Fig. 24 shows a force-displacement curve 820 for this experiment. A first
region 822
of the curve 820 exhibits a sharp increase in the force exerted on the test
fixtures 732 once the
weight 736 is brought into contact. The shape of this region 822 of the curve
820 reflects the
penetration of the test fixture 732 through the adhesive layer on the bottom
surface 748 of the
weight 736. Within about~20 pm, the force reaches a relatively constant value
of 0.16 N
(second region 824) approximately equal to the weight of the probe 104. Upon
retraction, the
measured force remains high until the weight 736 is seated in the well 738 of
the sample
holder 730 (third region 826). The force then drops below the vutial force
measured when
the weight 736 and the test fixture 732 are not in contact, reflecting the
presence of a tensile
force--an adhesive bond--between the weight 736 and the test :fixture 732.
('The offset value
of the force resulting from pre-loading of the sensor 106 has been subtracted
from these
values; thus, tensile forces appear as negative values.) As shown by the
fourth 828 and fifth
830 regions of the curve 820, this tensile force rises to a maximu~xn value
before falling off,
possibly reflecting failure of the initial morphological structure within the
adhesive and
subsequent plastic deformation of the failed state. Eventually, the adhesive
bond fails
completely (sixth region 832), and, the measured force approaches the value
measured at the
start of the experiment. An estimate of the work of adhesion may be made from
the area
between these two curves.
-36-
CA 02344755 2001-04-18
EMLN: EL493560553US
Attorney Docket No. 65304-0155
Symyx 99-90
Example of Parallel Solid Modulus Measurements
The PDMA described herein was used to determine the solid modulus at small
strains
of a thin film of a commercial polystyrene-block butadiene-block styrene)
copolymer
supplied by Aldrich. A sheet of polyimide (DuPont KAPTOI'f HNT~ 0.002" thick
was
mechanically clamped between the top and bottom sample plates and measured at
an
oscillation amplitude of 2.5 pm and a frequency of 10 Hz. 'The data were
measured on two
channels simultaneously and show a linear stiffness of 145 Nhn; from the
thickness of the
polyimide and the dimensions of the clearance holes in the sannple plates
(0.250"), this
corresponds to a solid modulus of 2300 MPa, in good agreement with previously
published
values for this material.
A film of the block copolymer was prepared by casting; from a 5 wt% solution
in
toluene onto a water surface at room temperature. Following the slow
evaporation of the '
solvent, the film was dried for 2 hours in air and 12 hours in vacuum at room
temperature
before annealing for 12 hours under vacuum at 100 °C and 2 hours at 150
°C in order to
remove all residual solvent and relax any mechanical stresses induced by the
film casting
procedure. A strip of material measuring 0.28 x 5.8 x 15.85 mm was cut from
this film. The
modulus of this strip was measured, in a conventional dynamic mechanical
thermal analyzer
(Rheometrics DMTA-I~ to be 10 t 2 MPa over a frequency range from 1 to 1000
Hz. See
Fig. 25. At the same time, a second strip of material 0.28 mm thick was glued
to the
previouslymeasured piece of polyimide with a drop of toluene;, permitted to
dry for 2 hours
in vacuum, and mechanically clamped between the top and bottom plates of the
sample
fixture. The stiffness of this composite material was measured on the same two
channels
simultaneously. From the linear stiffness of the composite (1340 N/m), the
thicknesses of the
polyimide and copolymer layers, and the previously measured modulus for
polyimide, the
modulus of the copolymer was measured to be 13.7. MPa, in good agreement with
the value
recorded by the conventional measurement.
It is to be understood that the above description is intended to be
illustrative and not
restrictive. Many embodiments will be apparent to those of skill in the art
upon reading the
above description. The scope of the invention should therefore be determined
not with
reference to the above description, but should instead be determined with
reference to the
appended claims, along with the full scope of equivalents to which such claims
are entitled.
-37-