Note: Descriptions are shown in the official language in which they were submitted.
CA 02356677 2001-06-22
'WO 00/39749 PCT/US99/30881
SYSTEM AND METHOD FOR PRINT ANALYSIS
This is a continuation-in-part patent application of U.S. patent application
serial no.
09/220,669, filed December 24, 1998.
BACKGROUND OF THE INVENTION
1. Field of the Invention
The present invention relates generally to a system and method for analyzing
the
printing properties of a substrate, and more particularly, to a system and
method for analyzing
a test pattern printed by a printing device to determine the printing
properties of a substrate.
2. Background of the Related Art
The evaluation of the printing properties of a substrate, for example, a paper
sheet,
traditionally has involved the manual evaluation of printed images on a
substrate by highly
trained technicians. Due to human involvement, manual evaluation techniques
tend to be
quite subjective, thus causing a lack of consistency between any two or more
evaluations of
the same printed image. This is true whether the evaluation is performed by
one or more
technicians. In addition, the process of manually evaluating printed images is
time
consuming and, consequently, expensive.
In an attempt to eliminate the subjectivity inherent in manually evaluating
printing
properties of a substrate, a number of standard test patterns have been
developed. The test
patterns are typically designed to magnify expected paper deficiencies. The
test patterns are
advantageous because they eliminate the need for a technician to rely solely
on the printed
image in his evaluation. For example, if a well known Graphic Arts Technical
Foundation
(GATF) dot-growth test pattern is printed on a substrate and a predetermined
amount growth
occurs, portions of the test pattern visibly merge. While the standard test
patterns have
improved the evaluation of printing properties of a substrate to a limited
extent, some
subjectivity still remains and, therefore, the results remain prone to error.
More recently, computer-based print analysis systems have been developed. The
computer-based systems have eliminated a number of problems associated with
the manual
evaluation techniques. In particular, because the computer-based systems
operate
automatically according to software instructions, the subjective nature of the
manual
CA 02356677 2001-06-22
w0 00/39749 PCT/US99/30881 -
_2_
evaluation techniques has been virtually eliminated. In addition, the amount
of time in which
it t<~kes to evaluate printing properties has been substantially reduced.
One such print analysis system available for evaluating the printing
properties of a
substrate is ImageXpertT"' (KDY Inc., Nashua, NH). ImageXpertT"' applies
algorithms
embodied in print analysis software to evaluate test patterns in order to
quantitatively
measure the printing properties of a substrate. The software carries out a
number of tests on
standard test patterns, including assessing dot quality, line quality, edge
sharpness, and
feature resolution. Although automated systems such as ImageXpertTM have
improved
results obtained in evaluating the printing properties of substrates, there
are several problems
with these prior art computer-based systems.
For example, existing printing property analysis systems evaluate the test
patterns in a
one-dimensional manner. More specifically, these prior art systems typically
evaluate only
overall growth of a test pattern printed on a substrate. Importantly, however,
the systems do
not consider multi-dimensional growth of a printed test pattern. More
specifically, existing
print analysis systems do not consider: (i) the change of a test pattern's
area through wicking
of ink into the substrate; and (ii) the change of a test pattern's area
through bleed occurring
between contiguously printed inks. Accordingly, these prior art print analysis
systems tend to
overlook certain important defects due to multi-dimensional growth.
Also, because test patterns must be scanned into a computer which supports
print
analysis software, errors may be introduced into the test patterns due to the
rectilinear
geometry of most standard test patterns in use. That is, misalignment of the
straight line
edges of standard test patterns with the scanner heads of scanners tend to
introduce abasing
errors that affect the results.
The above problems may be exacerbated by the fact that the printed test
patterns are
often printed on printers driven by printer drivers which introduce additional
variables not
accounted for in print analysis software. Thus, the data that is analyzed by
the print analysis
software may not be an accurate representation of the original test patterns.
In view of the above, there is clearly a need in the art for an improved
method and
system for evaluating the print quality of a printing device which solves the
foregoing
problems.
CA 02356677 2001-06-22
WO 00/39749 PCT/US99/30881 '
-3-
SUMMARY OF THE DISCLOSURE
The subject invention is directed to a novel and unique system and method for
print
analysis. The system and method is used for analyzing a test pattern printed
by a printing
device onto a substrate to determine the printing properties of the substrate.
A system is disclosed for determining print defects of a test pattern formed
on a
substrate by a printing device, the system includes a memory storing a first
digital
representation of the test pattern, wherein the test pattern comprises (i) a
first cell having a
background of a first color and a pattern of a second color and (ii) a second
cell having a
background of the second color and a pattern of the first color. The system
further includes a
processor in communication with the memory, the printing device, and a
scanner. The
processor is programmed to print the test pattern onto the substrate using the
printing device,
receive from the scanner a second digital representation of the test pattern,
and analyze at
least a portion of the second digital representation of the test pattern to
determine the print
defects of the test pattern.
A method is disclosed for determining print defects of a test pattern formed
on a
substrate by a printing device, the method includes generating a first cell of
the test pattern on
the substrate, wherein the first cell has a background of a first color and a
pattern of a second
color, generating a second cell of the test pattern on the substrate, wherein
the second cell has
a background of the second color and a pattern of the first color, converting
the first and
second cells into a digital representation of the test pattern, and analyzing
at least a portion of
the digital representation of the first and second cells to determine the
print defects of the test
pattern.
The patterns of the first and second colors each have a plurality of dots. In
addition,
each of the plurality of the dots has a diameter of about 0.1 inch. Further,
each dot of the
pattern of the first color has a unique x and y coordinate and each dot of the
pattern of the
second color has unique x and y coordinates that correspond to a dot of the
pattern of the first
color.
The analysis described above can include determining a first mean area of the
pattern
of the first color, determining a second mean area of the pattern of the
second color and
evaluating a difference between the first and second mean areas to calculate a
gain index of
the test pattern. Alternatively, the analysis can include determining a first
amount of
CA 02356677 2001-06-22
WO 00/39749 PCT/US99/30881 '
-4-
migration between the pattern of the second color and background of the first
color,
determining a second amount of migration between the pattern of the first
color and the
background of the second color, and evaluating a difference between the first
and second
amounts of migration.
The method can further include generating a third cell of the test pattern on
the
substrate, wherein the third cell has a background of the first color and a
pattern of the first
color. In addition, generating a fourth cell of the test pattern on the
substrate, wherein the
fourth cell has a background of a second color and a pattern of a second
color.
The analysis can then include selecting a color-band for the first and second
colors,
determining a first amount of the first color in the first and second cells
from the selected
color-band, determining a second amount of the second color in the first and
second cells
from the selected color-band, determining a third amount of the first color in
the third and
fourth cells from the selected color-band, determining a fourth amount of the
second color in
the third and fourth cells from the selected color-band, and determining a non-
uniformity
index based on a ratia of a difference between the first and second amounts to
a difference
between the third and fourth amounts.
A raggedness index can also be calculated by first determining a mean
circularity of
the dots of at least one of the patterns. The raggedness index is then
determined by dividing
the mean circularity by a predetermined value.
Another method is disclosed for assessing the print quality of a printing
device. The
method includes printing a test pattern onto a substrate using the printing
device, wherein the
test pattern comprises (i) a first cell having a background of a first color
and a pattern of a
second color and (ii) a second cell having a background of the second color
and a pattern of
the first color. The substrate having the test pattern printed thereon is
scanned to generate a
digital representation of the test pattern. At least a portion the digital
representation of the
test pattern is then analyzed to determine the print quality of the printing
device.
Further features of the system and method for print analysis will become more
readily
apparent from the following detailed description taken in conjunction with the
drawings.
CA 02356677 2001-06-22
WO 00/39749 PCT/US99/30881
-5-
BRIEF DESCRIPTION OF THE DRAWINGS
So that those of ordinary skill in the art to which the subject invention
pertains will
more readily understand how to make and use the system and method described
herein,
embodiments of the invention will be described in detail with reference to the
drawings,
wherein:
FIG. 1 is a schematic representation of a system for print analysis;
FIG. 2 is a flow chart illustrating the operation of a system for print
analysis;
FIG. 3 is a test pattern used in analyzing printing defects;
FIG. 4 is a flow chart illustrating the steps taken to determine print
defects;
IO FIG. S is a flow chart illustrating the steps taken to select a color-band
for a color-
pair;
FIG. 6 illustrates the process of selecting a color-band for a color-pair;
FIGS. 7(a) and 7(b) illustrate the selection of a threshold value for a color-
pair;
FIGS. 8(a) and 8(b) illustrate the determination of a non-uniformity index
(NUI); and
FIG. 9 is a test pattern used in analyzing printing defects.
These and other features of the system and method disclosed herein will become
more
readily apparent from the following detailed description of the embodiments
taken in
conjunction with the drawings.
DETAILED DESCRIPTION OF THE PREFERRED EMBODIMENTS
Reference is now made to the accompanying Figures for the purpose of
describing, in
detail, the preferred embodiments of the present invention. The Figures and
accompanying
detailed description are provided as examples of the invention and are not
intended to limit
the scope of the claims appended hereto.
The present invention provides a novel and unique method and system for
analyzing
the printing properties of a substrate. The system and method analyzes a new
test pattern
including two or more cells having "inverse color-pairs" printed thereon to
facilitate the
determination of a wide variety of print defects. As used herein, an "inverse
color-pair"
refers to a pair of cells, wherein a first cell has a pattern of a first color
on a background of a
second color and a second cell has a pattern of the second color on a
background of the first
color. Unlike the prior art, the analysis of inverse color-pairs permits the
inventive system
CA 02356677 2001-06-22
'WO 00/39749 PCT/US99/3088I '
-6-
and method to determine print defects with regard to mufti-dimensional growth
of the test
pattern printed on a substrate.
Those skilled in the art will recognize that the present invention can also be
used for
analyzing the print quality of printing device 30 (e.g.. a personal computer
type ("PC-type")
printer) or other types of printing machines such as in-line printing presses
used in, for
example, offset-lithography, flexography, and gravure. Many of the variables
encountered
during such an analysis can be reduced by using a controlled substrate, for
example, high
quality paper which is maintained in a controlled environment.
Referring now to FIG. 1 there is illustrated a print analysis system 10
configured in
accordance with an embodiment of the present invention for analyzing the
printing properties
of a substrate. The system 10 includes a personal computer 20 in communication
with a
printer 30 and a scanner 40. Printer 30 is capable of printing the test
pattern 42 stored on the
personal computer 20 onto a substrate 44. Scanner 40 is capable of scanning
and transmitting
a digital representation of the substrate 44 with the test pattern 42 printed
thereon to the
personal computer 2U for analysis. The printing properties of the substrate
are determined by
analyzing the type and degree of print defects that exist in the digital
representation of the test
pattern.
In one embodiment, personal computer 20 includes a 266 MHz MMX Pentium~
processor 50 (Intel Corp., Santa Clara, CA) which is in communication with
memory 52. In
one embodiment, memory 52 includes 96 Mbytes of random access memory (RAM),
eight
(8) Mbytes of RAM for a video monitor (not shown), and one ( I ) Gbyte of hard
disk storage.
These elements are configured and communicate in a well-known manner.
Printer 30 may be any of the various printers available in the market. In one
embodiment, printer 30 is used to print test pattern 42, which is scanned by
scanner 40 and
analyzed by personal computer 20. In another embodiment, other printing
devices may be
used to print test pattern 42, and printer 30 may be used for printing reports
relating to the
analysis of test pattern 42.
Scanner 40 may be any available scanner, for example a high resolution machine
such
as a DuoScan~ 1000 dpi scanner (Bayer Corporation. AGFA Division, Ridgefield
Park, NJ).
Thc; DuoScan~ scanner has a two-bulb scanning head and sensors for receiving
both reflected
and transmitted light. Alternatively, a lower resolution machine can be used,
such as an HP
CA 02356677 2001-06-22
'WO 00/39749 PCT/US99/30881 --
6200C or HP 6250C PrecisionScan Pro~ (Hewlett-Packard Company, Palo Alto. CA).
The
above machines have the ability to receive instructions from well-known TWAIN-
compliant
software programs (drivers) stored in the memory 52 of personal computer 20.
Referring to FIG. 2, personal computer 20 runs on a Windows NT (Microsoft
Corp.,
Redmond, WA) operating system 62 and includes the following application
programs: a
drawing application program 64; a portable document format (PDF) reading
program 66; an
image analysis application program 68; and a spreadsheet application program
70. A
graphical user interface (GUI) 72 enables a user to readily control the
application programs.
In one embodiment, the GUI 72 is written in Microsoft's Visual Basic.
Appropriate printer
and scanner drivers 74 and 76 enable the printing and scanning capabilities
described herein.
In general operation, personal computer 20 stores a digital version 46
(digital test
pattern) of test pattern 42 in memory 52. A drawing application program 64
such as Canvas~
(De:neba Systems Inc., Miami, FL) may be used to generate the digital test
pattern 46 and
may also enable a user to alter the configuration of the digital test pattern
46 to facilitate the
1 S particular type of printing device that is to be used or substrate to be
tested. Drawing
application program 64 reads and transmits the digital test pattern 46 to the
printer 30 via the
printer driver 74.
Alternatively, digital test pattern 46 may be stored in memory 52 in the well-
known
PDF format. In this case, a PDF reading program 66 such as Acrobat~ Reader
(Adobe
Systems Inc., San Jose, CA) may be used to read and transmit the digital test
pattern 46 to the
printer 30 via the printer driver 74.
After the drawing application program 64 (or the PDF reading program 66)
transmits
the digital test pattern 46 to the printer 30, the digital test pattern 46 is
printed onto a substrate
44, for example, a sheet of paper. Those skilled in the art will recognize
that the digitized test
pattern 46 can be printed on a substrate 44 made of material other than paper.
For example,
substrates can be made of plastics such as mylar or velum to facilitate
analyzing the print
quality of a printing device.
After the digital test pattern 46 has been printed by the printer 30 onto the
substrate
44, the printed test pattern 42 and substrate 44 are scanned by scanner 40.
The printed test
pattern 42 and substrate 44 are scanned as re-digitized test pattern 48 using
a TWAIN-
corr~patible scanner driver 76. After scanning, the re-digitized test pattern
48 is stored in
CA 02356677 2001-06-22
WO 00/39?49 PC'f/US99/30881 '
_g_
memory 52 at which time it is available for analysis by the image analysis
application
program 68. In one embodiment. an image analysis application program 68 such
as
OptimasTM (Media Cybernetics, L.P., Silver Spring. MD) is used to analyze
print defects of
the re-digitized test pattern 48. GUI 72 may be used to activate the image
analysis application
program 68.
The image analysis application program 68 includes a number of standard
software
functions for manipulating and analyzing the re-digitized test pattern 48. For
example, such
standard software functions allow a user to assign gray-scale values to
pixels, apply threshold
values to distinguish pixels, count pixels, and perform arithmetic operations.
The image
analysis application program 68 also includes a number of custom software
functions that are
programmed using a programming language such as Media Cybernetics' Analytical
Language
for Images (ALI), which is provided with OptimasTM. The custom software
functions include
a number of equations that are used to manipulate re-digitized test pattern 48
in order to
determine the defects thereof. The custom software functions are described in
detail below.
The results of the image analysis application program 68 are transmitted to a
spreadsheet application program 70, such as Microsoft's Excel. The results are
formatted on
a spreadsheet and sent to the printer 30 via the printer driver 74. The user
is then able to use
the results, for example, by comparing them to test results obtained earlier
for printer 30.
The results can also be stored in memory 52 for later use, such as for
evaluating the
printing properties of a particular type of substrate over an extended period
of time.
Furthermore, the results can be accumulated to perform statistical analysis or
the like.
As noted above, the print quality of printing device 30 can be analyzed
utilizing the
above described print analysis system. The print quality of print devices
other than printer 30
ma;y also be evaluated using the print analysis system 10. For example, test
pattern 42 can be
printed onto a substrate by a printing machine of the type used in offset
lithography (not
shown). Thereafter, the substrate having the test pattern 42 printed thereon
can be scanned
into scanner 40 and analyzed by personal computer 20 in a manner similar to
that described
above.
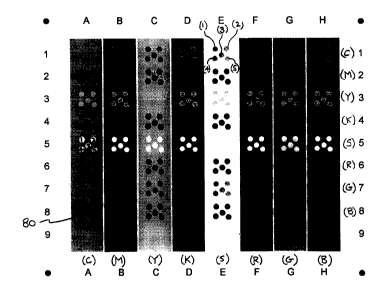
Referring now to FIG. 3 there is illustrated an embodiment of test pattern 42.
The
exemplary test pattern includes eight (8) parallel bars A-H. The first four
(4) bars A-D are
colored in the four primary colors of cyan (C), magenta (M), yellow {Y), and
black (K),
CA 02356677 2001-06-22
W0 00/39749 PCT/US99/30881
_g_
respectively. The fifth bar E is an unprinted area of the substrate, which
therefore assumes
the' color of the substrate, e.g., the color of paper on which the test
pattern may be printed.
The remaining three (3) bars F-H are colored in the secondary colors of red
(R), green (G),
and blue (B), respectively.
Each bar A-H has nine (9) areas which are referred to herein as "cells". The
cells are
positioned in rows 1-9 of the test pattern. Although the cells in each bar A-H
of the described
embodiment are rectangular in shape, they may have other shapes without
departing from the
scope of the invention.
Throughout this detailed description, each cell is referred to by an alpha-
numeric
character -- based on its column and row -- which identifies the cell. For
example, the cells
in the upper-left and the lower-right corners of' the test pattern are
referred to as cells A 1 and
H9, respectively.
In the described embodiments, each of cells A1-H8 is shown to contain five (5)
dots.
The dots are printed within unprinted areas of their respective backgrounds.
Each group of
I S the five (5) dots in a cell is referred to herein as a "dot group". The
dots within each dot
group are the same color. In addition, the dot groups within each row (I-8) of
cells are the
same color.
More specifically, the dot groups in row 1 (cells A 1-H 1 ) are each cyan (C).
The dot
groups in row 2 (cells A2-H2) are each magenta (M). The dot groups in row 3
(cells A3-H3)
are each yellow (Y). The dot groups in row 4 (cells A4-H4) are each black (K).
The dot
groups in row 5 (cells AS-HS) are each the color of the substrate on which the
test pattern is
printed. The dot groups in row 6 (cells A6-H6) are each red (R). T'he dot
groups in row 7
(cells A7-H7) are each green (G). Finally, the dot groups in row 8 (cells A8-
H8) are each
blue (B).
The dot groups of the cells along the diagonal (i.e., Al, B2, C3, D4, E5, F6,
G7, and
H8) have dots that are the same color as the bars on which they are printed.
For example, cell
Al has a cyan dot group printed on a cyan bar. Row 9 (cells A9-H9) does not
have any dot
groups printed thereon.
The problem of aliasing and moire patterns is well-known in the printer-
related arts.
Aliasing is the jagged appearance of diagonal lines on printouts and on video
monitors and a
moire pattern is a pattern created when a first pattern is superimposed on
second pattern
CA 02356677 2001-06-22
'WO 00/39749 PCT/US99/30881 --
-10-
which is offset from the first. The result is alternatively referred to as the
moire effect.
Either or both of these phenomena occur when a digital image of one resolution
and/or
registration is mapped into a digital image space of a different resolution
and/or registration.
In the case of a digitally printed image being re-digitized with a scanner, it
is virtually
impossible to perfectly align the rectilinear grid of the printed image with
the rectilinear grid
of the scanner. Some x and y offset, as well as angular skewing of the two
grids, is common.
In view of the problems associated with aliasing and moire patterns, two
characteristics of the dot groups have been controlled. That is, the diameters
of the dots have
been fixed at one-tenth (0.1 ) of an inch and the dot positions within each
dot group have been
randomized.
Fixing the diameters of the dots at one-tenth (0.1 ) of an inch allows the
printer driver
74 to render a whole number of pixels in the x and y diameter axes of each
dot. This
technique attempts to minimize abasing effects that are normally introduced
when a dot
diameter is used that is not a whole number of the pixels.
1 S For example, on a 300 dots-per-inch (dpi) printer, the one-tenth (0.1 )
inch diameter
dots are exactly 30 pixels tall and 30 pixels wide. On a 1440 dpi printer, the
one-tenth (0.1 )
inch diameter dots are exactly 144 pixels tall and 144 pixels wide. It is thus
seen that a whole
number of pixels will print within the diameter of a one-tenth (0.1 ) inch dot
in the x and y
direction. Of course, dots having other diameters -- whether or not they equal
a whole
number of pixels -- can be used. In the latter case, the advantages of using a
whole number
of pixels will not be realized. In an alternate embodiment dot group, the dots
in each dot
group have different diameters to further reduce the creation of moue
patterns.
The dots have been randomized within each dot group by offsetting each of the
five
dots within a dot group so that no two dots share the same x or y coordinates.
This technique
attempts to further reduce the creation of moue patterns by reducing repeating
patterns that
otherwise would be introduced during scanning.
In the described embodiments, the dot groups are not randomized in relation to
each
other, i.e., the dot groups within the test pattern are equally spaced fi~om
each other.
However, it is foreseeable that randomization of the dot groups can be
employed to further
reduce the effects of repeating patterns.
CA 02356677 2001-06-22
WO 00/39749 PC:T/US99/30881 '
-11-
Five (5) dots per dot group have been chosen in order to reduce memory and
processing requirements of personal computer 20, while at the same time
allowing for
acceptable within-group analysis. Although more dots per dot group would be
beneficial,
this would increase the memory and computation requirements for the personal
computer 20.
As processor speeds and memory capacities increase and become more economical,
the
number of dots per dot group can be increased to allow for a greater number of
samples for
analysis.
It is foreseeable that an embodiment of the present invention can include
patterns or
groups of patterns other than the dot groups described above. The patterns or
groups of
patterns would facilitate a determination of the printing characteristics of a
printing device in
a n:~anner similar to that described herein for the dot groups.
Still referring to FIG. 3, it is seen that the test pattern includes twenty-
eight (28)
inverse-color-pairs (ICPs). An ICP refers to a pair of cells, wherein a first
cell has a dot
group of a first color printed on a background of a second color and a second
cell has a dot
I 5 group of the second color printed on a background of the first color. A
first cell of a
parxicular ICP is referred to herein as an "inverse-color cell" of a second
cell of the ICP, and
visa versa.
The ICPs in the test pattern may be divided into four groups. The custom
software
functions (described below) use the four groups to analyze print defects of
the test pattern.
The: groups and their constituent ICPs are tabulated below, wherein "S"
indicates the color of
the substrate 44.
CA 02356677 2001-06-22
WO 00/39749 PCT/US99/30881 '
-12-
Colors Colors ColorsColors
Group ICP of of Group ICP of of
(Cel l # Cel Cell (Cell # 1 & #2) Cell Cell
1 & #2) I # #2 # #2
1 1
First E4 and D5 K on S on Fourth B I and C on M on
S K A2 M C
C 1 and A3 C on Y on
Y C
Second E 1 and C on S on F I and A6 C on R on
AS S C R C
E2 and B5 MonS SonM GI and A7 Cone GonC
E3 and C5 YonS Sony H1 and A8 ConB BonC
E6 and FS R on S on C2 and B3 M on Y on
S R Y M
E7 and G5 GonS SonG F2 and B6 MonR RonM
E8 and I-ISB on S on G2 and B7 M on G on
S B G M
H2 and B8 MonB BonM
Third DI and A4 C on K on F3 and C6 Y on R on
K C R Y
D2 and B4 M on K on G3 and C7 Y on G on
K M G Y
D3 and C4 Y on K on H3 and C8 Y on B on
K Y B Y
D6 and F4 RonK Kong G6 and F7 RonG Gong
D7 and G4 GonK KonG H6 and F8 RonB Bong
D8 and H4 BonK Kong H7 and G8 Gong Bone
Of course, cells A9-H9 and the cells on the diagonal do not have respective
ICPs.
Although this embodiment of the test pattern includes twenty-eight (28) ICPs,
it is
foreseeable that a minimal number of ICPs can be advantageously employed to
determine the
printing properties of a substrate. For example, it is foreseeable that one or
two ICPs can be
printed along the edge of a printed sheet during printing on an off set
lithography printing
machine. Analysis of the ICPs would almost immediately provide an operator of
the printing
machine with valuable information regarding the stability of the printing
process. In
addition, the results obtained therefrom may be electronically transmitted
back to the printing
machine to automatically adjust the variables of the printing process.
As noted above, prior art print quality analysis systems evaluate test
patterns in a one-
dimensional manner. That is, they typically evaluate only the overall growth
of a test pattern
printed on a substrate. In contrast, an embodiment of the present invention
evaluates multi-
dirnensional growth of a test pattern. This mufti-dimensional method of
analysis is an
CA 02356677 2001-06-22
WO 00/39749 PCT/US99/30881 '
-13-
improved criterion for testing the printing properties of a substrate because
it provides a more
complete measure of the printability of the printer.
For example, a certain amount of outward growth of a character may be
acceptable
while the same amount of outward growth in combination with a reduction in a
characters
openings (e.g., inward growth) may be unacceptable. As a more specific
example, the
outward growth of the letter 'B' may be acceptable because the letter would
appear only
slightly larger (e.g., '$'). On the other hand, the outward and inward growth
of the letter 'B'
will cause the letter to be slightly larger and, in addition, cause a
reduction in the size of the
letter's openings. In the latter case, the letter would be perceptually
emboldened (e.g., 'B')
and thereby unacceptable.
The one-dimensional nature of existing print quality analysis systems extends
to the
evaluation of two contiguously printed inks also. For example, the prior art
systems do not
concurrently consider the mufti-directional interaction of a printed
background of a first color
with a printed pattern of a second color. As will be described below, an
embodiment of the
present invention concurrently considers the mufti-directional interaction of
contiguously
printed inks.
Referring to FIG. 4, an embodiment of a procedure for analyzing print defects
on re-
digitized test pattern 48 is illustrated. This procedure is executed according
to the software
instructions contained in the custom software functions of image analysis
application
program 68.
As will be explained in more detail below, one aspect of the procedure
compares each
color in re-digitized test pattern 48 with all other colors therein. Because
there are eight (8)
different colors in re-digitized test pattern 48 (C, M, Y, K, R, G, B, and the
color of the
substrate), there are a total of twenty-eight (28) possible color
combinations. Therefore,
twenty-eight {28) comparisons are made between the colors in re-digitized test
pattern 48.
For example, cyan (C) is compared against M, Y, K, R, G, B, and the color of
the substrate;
magenta (M) is compared against C, Y, K, R, G, B, and the color of the
substrate; etc.
Each combination of two colors is referred to as a "color-pair". The color-
pairs are
compared in order to enable the image analysis application program 68 to more
accurately
differentiate between the colors in each color-pair. This, in turn, makes it
possible for the
custom software functions to provide more accurate results.
CA 02356677 2001-06-22
'WO 00/39749 PCT/US99/30881
-I 4-
It is well known in the art that each color on a substrate is converted into
its
equivalent R, G, and B colors when scanned into a computer by a scanner. In
the detailed
description that follows, the representation of a color in its equivalent R,
G, and B colors is
collectively referred to as the "RGB equivalent" of that color. Also, each of
the three
secondary colors (R, G, and B) of an RGB equivalent is referred to as a "color-
band". In
addition, each color-band of a first color of a color-pair corresponds to a
color-band of a
second color of the color-pair. That is, the red (R) color-bands of the first
and second colors
of a color-pair correspond, the green (G) color-bands of the first and second
colors of a color-
pair correspond, and the blue (B) color-bands of the first and second colors
of a color-pair
correspond. The color-bands in the first and second color of a color-pair that
correspond are
referred to as "corresponding color-bands".
Still referring to FIG. 4, at step 100, for each color-pair, one of the three
corresponding color-bands is selected to represent the color-pair in the
analyses of re-
digitized test pattern 48. The color-band selected is that which best
distinguishes the
1 S differences between the two colors. At step 200, each selected color-band
is evaluated to
determine a threshold value for each color-pair. At step 300, the selected
color-bands and the
threshold values determined at steps l00 and 200, respectively, are used to
facilitate analysis
of re-digitized test pattern 48 for print defects.
FIG. 5 is a flow chart illustrating an embodiment of step 100 for selecting a
color-
band for a color-pair. In the description of the flow chart illustrated in
FIG. 5, reference is
made to FIG. 6, wherein there is illustrated an example of the selection of a
color-band for a
color-pair 120 consisting of a first color 121 and a second color 122.
At step 102, substrate 44 having the test pattern printed thereon is scanned
into
scanner 40 as re-digitized test pattern 48. During the scanning process, each
color of the test
pattern is converted and stored in memory 52 as its RGB equivalent. For
example, the first
color 121 and second color 122 of color-pair 120 (FIG. 6) are converted to R1,
G1, and B1
and R2, G2, and B2, respectively.
At step 104, each RGB equivalent is converted to its equivalent gray-scale
value. For
example, R1, G1, and B1 of first color 121 (FIG. 6) are converted to their
equivalent gray-
CA 02356677 2001-06-22
WO 00/39749 PCT/US99/30881
-15-
scale values Rgs 1, Ggs 1, and Bgs 1,, respectively. Similarly, R2, G2, and B2
of second color
12:~ are converted to their equivalent gray-scale values Rgs2, Ggs2, and Bgs2,
respectively.
It is noted here that scanner 40 scans the test pattern into the computer 20
as pixels.
Therefore, when the test pattern is scanned into computer 20 as described
above at step 102,
it is scanned in as RGB equivalents of the pixels which are generated by
scanner 40. In
addition, when each RGB equivalent is converted to its equivalent gray-scale
value as
described above at step 102, it is the RGB equivalent of each pixel that is
converted to
equivalent gray-scale values.
It is also noted that a region of interest (ROI) is generated about the five
(S) colored
dots within each cell at step 104 to ensure that color-band selection is based
on the five (S)
colored dots and the colored background of each cell. It is well known in the
art that
selecting ROIs avoids errors which may be introduced by including data scanned
in from
outside the area of each cell. FIG. 3 illustrates an ROI $0 for cell A8. ROIs
are also used for
threshold selection (200) and print defect analysis (300), described below.
At step 106, the pixels making up each color, each having a gray-scale value
assigned
thereto, are used to generate histograms. Thereafter, the mean gray-scale
value of each
histogram is determined. For example, all of the pixels of Rgsl, Ggsl~ ~d Bgsl
(FIG. 6)
having the same gray-scale values are counted and their frequency (total
number of pixels
having the same gray-scale value) graphed on a histogram, wherein the x-axis
represents the
gray-scale level and the y-axis represents the frequency with which they
occur. In this
example, the mean gray-scale values for Rgsl, Ggsl, and Bgsl are calculated to
be fifty (50),
sixty-five (65), and twenty (20), respectively. The mean gray-scale values for
Rgs2, Ggs2
and Bgs2 are calculated to be 240, 250, and 220, respectively.
At step 108, corresponding histograms are superimposed to form compound
histograms. For example, the Rgsl histogram (FIG. 6) is superimposed onto the
Rgs2
histogram, the Ggsl histogram is superimposed onto the Ggs2 histogram, and the
Bgsl
histogram is superimposed onto the Bgs2 histogram. Each of the compound
histograms are
bi-nodal. That is, each compound histogram exhibits two distinct humps or bell-
shaped
curves.
CA 02356677 2001-06-22
WO 00/39749 PCT/US99/30881
-16-
At step 110, the mean gray-scale values in each compound histogram are
subtracted to
detf~rmine the largest difference. That is, the mean gray-scale values for the
compound
histogram of the red (R) color-band are subtracted, the mean gray-scale values
for the
compound histogram of the green (G) color-band are subtracted, and the mean
gray-scale
values for the compound histogram of the blue (B) color-band are subtracted.
The color-band
having the largest difference between mean gray-scale values is selected as
the representative
color-band for that particular color-pair. Here, the blue (B) color-band
having a difference of
200 would be selected because it is greater than the differences in the red
(R) color-band
( 190) and the green (G) color-band ( 185).
Step 112 of the program includes storing the superimposed histograms of the
selected
color-band in memory 52. For example, the blue (B) color-band Bgsl/Bgs2 (FIG.
6) is stored
in memory 52 and is used in all threshold value determinations (step 200) and
in print defect
analysis (step 300) involving, for example, ICPs.
With continued reference to FIG. 5, at step 114, the image analysis
application
program 68 determines whether additional color-pairs need to be evaluated. If
other color-
pairs are to be evaluated, then the program returns to step 108. The program
terminates at
step 116 after all of the color-pairs have been evaluated.
Those skilled in the art will recognize that using select color-bands of a
color-pair, as
opposed to using all color-bands of a color-pair, substantially improves the
ability to
differentiate between the colors of the color-pair. This improved ability
further enhances
threshold value determinations and print defect analyses. An additional
advantage is the
reduced number of calculations that the processor 50 must carry out, resulting
in substantially
increased processing speed and efficiency.
After the color-band of a color-pair has been selected at step 100 (FIG. 4), a
threshold
value for the color-pair is selected at step 200. In general, a threshold
value is a number
which is used to divide a set of values into two groups. For the particular
application herein,
i.e., the threshold value of a color-pair, the threshold value is the gray-
scale value which
distinguishes the two colors of a color-pair. For example, if a threshold
value of 150 is
applied to a first pixel having a gray-scale value of 100 and a second pixel
having a gray-
scale value of 200, the first pixel would fall into a first group and the
second pixel would fall
into a second group.
CA 02356677 2001-06-22
WO 00/39749 PCTNS99/30881 '
-17-
Threshold values are applied in an analogous fashion to the color-bands
selected to
represent a color-pair. For example, a threshold value can be applied to the
blue (B) color-
ban.d Bgsl/Bgs2 that was determined at step I 10 of FIG. 6. If the threshold
value is
appropriately selected, all of the pixels of first color will be to the left
of the threshold value
and all of the pixels of the second color will be to the right of the
threshold value.
In prior art image analysis systems, a single threshold value is established
for all
color-pairs. Because a common thresholding value does not account for the
distinctions
between selected color-bands of different color-pairs, errors will exist for
those color-pairs
whose histograms stray too far toward the left or the right.
For example, in FIGS. 7(a)(i)-(iii), a single threshold value of 125 is
selected for three
color-bands, each color-band representing a color-pair. The color-band (a)(i)
has a gray-scale
value for a first color of 50 and for a second color of 200, the color-band
(a)(ii) has a gray-
scale value for a first color of 120 and for a second color of 230, and the
color-band (a)(iii)
has a gray-scale value for a first color of 50 and for a second color of 180.
Although the single threshold value of I 25 is satisfactory for the color-band
(a)(i),
i.e., all of the pixels of the first color fall to the left of the threshold
value and all of the pixels
of the second color fall to the right of the threshold value, it is
unsatisfactory for the color-
bands (a)(ii) and (a)(iii).
As illustrated in FIGS. 7 (a)(ii) and (a)(iii), errors will be introduced into
any
calculation based on the single threshold value of 125 since pixels that
should be considered
as part of one group will be counted as part of another group. For example, a
number of the
pixels in color-band (a)(ii) that should be considered as part of the group to
the left of the
threshold value will be considered as part of the group to the right of the
threshold value.
FIGS. 7(b)(i)-(iii) illustrates the affect of determining a threshold value
for each
color-pair by a method conforming to an embodiment of the present invention.
In general,
the ''variable thresholding" method includes taking the difference between
each mean gray-
scale value of a selected color-pair. Then, the difference is divided by two
(2) and added to
the lower mean gray-scale value. Thereafter, any pixel to the left of the
threshold value is
considered as part of the first group, i.e., the first color group of pixels,
and any pixel to the
right of the threshold value is considered as part of the second group, i.e.,
the second color
CA 02356677 2001-06-22
WO 00/39749 PCT/US99/30881 '
-18-
group of pixels. Each color-pair is evaluated to determine its unique
threshold value. The
thrcahold value for each color-pair is stored in memory 52.
For example, in FIG. 7, the color-band (b)(i) has a gray-scale value identical
to that of
the color-band (a)(i), i.e., 50 for the first color and 200 for the second
color. Variable
thrfaholding produces a threshold value of 125 ((200 - 50)/2 + 50). Also, the
color-band
(b)l;ii) has a gray-scale value identical to that of the color-band (a)(ii),
i.e., 120 for the first
color and 230 for the second color. Variable thresholding for this color-pair
produces a
threshold value of 175 ((230 - 120)/2 + 120). Finally, the color-band (b)(iii)
has a gray-scale
value identical to that of the color-band (a){iii), i.e., 50 for the first
color and 180 for the
second color. Variable thresholding produces a threshold value of l 15 ((180 -
50)/2 + 50).
From the examples above, it is clear that variable thresholding results in
reduced-error pixel
grouping between color-pairs.
As described above, an embodiment of the present invention includes step 100
whE;rein the color-band that represents the largest difference between each
color-pair is
selected and step 200 wherein a threshold value is determined for each color-
pair. Thereafter,
one or more custom software functions may be executed at step 300 to determine
printing
defects in the re-digitized test pattern 48. The custom software functions,
referred to
generally as "print defect indices", may be executed individually through the
GUI 72 or
automatically in a predetermined sequence. The results obtained therefrom are
transmitted to
spreadsheet application program 70. The custom software functions of step 30U
are described
in detail below.
In one embodiment of the invention, the print defect indices include general
equations
for gain index (GI), raggedness index (RI), and non-uniformity index (NUI).
The print defect
indices enable a user to readily determine deviations in printing properties
with respect to
theoretically perfect print. A custom software function for determining a
weighted sum (WS)
is also included to provide a single number representing the overall printing
properties of a
substrate.
"Theoretically perfect print" is where ink pixels dry perfectly on the surface
of the
substrate with no migration of the ink in the paper, i.e., no wicking. If the
test pattern is
printed "perfectly", then all of the print defect indices will be equal to
zero percent (0 %) and
the weighted sum would be equal to one-hundred percent ( 100%) since there
would be no
CA 02356677 2001-06-22
WO 00/39749 PCT/US99/30881 -
-I 9-
deviation from perfect print. Of course, it is impossible to obtain perfect
print; however, by
utilizing the print defect indices a user can determine a standard, or
benchmark, by which to
gauge the substrate being analyzed. Thereafter, periodic print testing
(sampling) is conducted
to ensure the substrate type being tested remains consistent.
The gain index (GI) enables a user to determine the overall change of a
character
which is printed onto a substrate. In particular, GI looks at the change of a
character's area
through wicking of printed ink into the substrate. In addition, GI looks at
the change of a
character's area through bleed between inks that are printed contiguously. The
more that
print on a substrate deviates from perfect print, the larger the GI percentage
will be.
The GI is determined by taking one-half of the absolute value of the
difference
between the mean areas of the dots in each cell of an ICP. The result is
divided by the dot
area. of a perfect dot, e.g., the area of a dot having one-tenth (0.1 ) of an
inch diameter. The
ratio is multiplied by one-hundred (100) and the gain caused by the printer
driver 74 (Gpd) is
subtracted.
In one embodiment of the present invention, the areas of the dots are
determined
using standard software functions in the image analysis application program
68. The area-
calculation function initially evaluates the pixels in the cells of interest
and determines which
pixels are of a first color group and which pixels are of a second color
group. This procedure
takes advantage of the color-band and threshold selection processes described
above at steps
100 and 200. respectively. The number of pixels representing the dots in the
cells of interest
are then multiplied by the area that each pixel encompasses. For example, if a
dot that is
printed with a 600 dpi printer is determined to have 2900 pixels, the area is
calculated by
multiplying 2900 pixels x 2.78 p in2 (the approximate area of a 600 dpi
pixel). The area of
the :?900 pixel dot is equal to 8.05 x 10⁻³ in2.
The print-driver gain (Gpd) is subtracted from the GI because it is recognized
that
printer drivers have an impact on the size, shape, ink density, and color
composition of
printed areas. For example, certain printer drivers compensate for
characteristics of a printer
engine by reducing the amount of ink that is dispersed onto the substrate.
Gp~ is determined empirically through testing and thereafter input into the
appropriate
custom software function(s). For a discussion concerning the effects of
printer drivers on
CA 02356677 2001-06-22
WO 00/39749 PCT/US99/30881 '
-20-
printer output see A Method For Measuring Ink-Jet Wicking Using A Document
Scanner
And A Personal Computer, R. Rosenberger, TAPPI Journal, Vol. 81: No. 3, pp71-
81 (March
1998), incorporated by reference herein.
The equation for the gain index (GI) has the general form:
Ad ~ Ad
n n
UI = 100 * n n - G pd
2 * ~ rP
S
wherein: Ad = area of one of the dots in a cell;
A d = area of one of the dots in the inverse color cell;
n = total number of dots;
rp = reference radius of a perfect dot (e.g., 0.05 inch); and
C~/,d = gain due to the printer driver.
The GI can be determined between an ICP including a cell having printed dots
on an
unprinted background and a cell having unprinted dots on a printed background.
Examples
of ICPs having this characteristic are in the first and second ICP groups. GIs
evaluating these
ICP~s are referred to herein as monochrome gain indices (MGIs).
Alternatively, the gain index can be determined between an lCP including a
cell
having printed dots of a first color on a printed background of a second color
and a cell
having printed dots of the second color on a printed background of the first
color. Examples
of ICPs having this characteristic are the ICPs in the third and fourth ICP
groups. GIs
evaluating these ICPs are referred to herein as duochrome gain indices (DGIs).
Note that the term "chrome" as used herein (with monochrome and duochrome)
refers
to those colors generated by the application of ink, i.e., C, M, Y, K, R, G,
and B. The term
chrome is not intended to refer to the color of a substrate. Therefore,
"monochrome"
identifies a single printed color on a substrate and "duochrome" identifies
two printed colors
on a substrate.
CA 02356677 2001-06-22
WO 00/39749 PCTIUS99/30881 -
-21-
Referring to FIG. 3, an example of the application of the general equation for
monochrome gain index (MGI) is given below for the ICP El and A$ which is from
the
second ICP group. E 1 has cyan dots on an unprinted substrate and A$ has
substrate-colored
dots on a cyan background. In FIG. 3, the five ($) dots of E1 are labeled 1-$
and the five ($)
$ substrate-colored dots in A$ are labeled 1-$. The area for dot one (;1 ) in
cell E 1 is identified
below as AEI.I, the area for dot two (2) of cell E1 is identified below as
AEI.2, etc. The area
for dot one (1) in cell A$ is identified below as AA5,1, the area for dot two
(2) of cell AS is
identified below as A,,~3.2, etc. The MGI for ICP E1 and A$ (MGIgI/AS) is as
follows.
AE1.1 +AEL2 +~E1.3 +'4E_L4__+ AE15 '4.~1>.i +_ '4f15.2 +AAa3 +'QA54 +A.95.5
$ _ $
MC~En,~s =100 * -__ 2 * ~ P
A useful monochrome gain index. (MGI) measurement includes the ICP in the
first
ICf group, i.e., the ICP including the color black (K) in combination with an
unprinted
substrate. This MGI is called the monochrome black gain index (MKGI). Another
useful
MCiI measurement includes the ICPs in the second ICP group, i.e., the ICPs
including the
color of a substrate in combination with each of the colors C, M, Y, R, G, and
B. This MGI
1$ is called the monochrome color gain index (MCGI). MKGI and MCGI are
illustrated below.
Using the general equation for the gain index (GI), the equation for MKGI is
of the
form:
E4d - D$d
MKGI =100* - G d
2 *n rp2
wherein: E4d = mean area of the dots in cell E4;
D$d = mean area of the dots in cell D$;
rp = reference radius of a perfect dot (e.g., 0.0$ inch); and
G~,~ = percent gain due to the printer driver.
Using the general equation for the gain index (GI), the equation for MCGI is
of the
form:
CA 02356677 2001-06-22
WO 00/39749 PCT/US99/30881 '
-22-
M~CGI =I00* ~~E~d +E2d +E3d +E6d +E7~ +E~d~-~ASd +BSd +CSd +FSd +GSd +HSd~ - G
6*2*~rp2
wherein: E 1 d, E2d, ... E8d = mean area of the dots in cells E 1, E2, ... E8,
respectively;
ASd, BS~, ... H5~= mean area of the dots in cells AS, B5, ... H5,
respectively;
r/, = reference radius of a perfect dot (e.g., 0.05 inch); and
Gpd= percent gain due to the printer driver.
A useful duochrome gain index (DGI) measurement includes the ICPs in the third
ICP
group, i.e., the ICPs including the color black (K) in combination with each
of the colors C,
M, 'Y, R, G, and B. This is referred to as the duochrome black gain index
(DKGI). Another
useful DGI measurement includes the ICPs in the fourth ICP group, i.e., the
ICPs including
combinations of each of the colors C, M, Y, R, G, and B. This is called the
duochrome color
gain index (DCGI). DKGI and DCGI are illustrated below.
Using the general equation for the gain index (GI), the equation for DKGI is
of the
I S form:
I~DId +D2d +...+D8d~-~A4d +B4d +...+H4d~I
DKGI =100 * - - G
6*2*nrp2 pd
wherein: D I d, D2~, ... D8d == mean area of the dots in cells D 1, D2, ...
D8,
respectively;
A4d, B4d, ... H4d= mean area of the dots in cells A4, B4, ... H4,
respectively;
r~, = reference radius of a perfect dot (e.g., 0.05 inch); and
Gpd = percent gain due to the printer driver.
Using the general equation for the gain index (GI), the equation for DCGI is
of the
form:
CA 02356677 2001-06-22
'WO 00/39749 PCT/US99/30881 '
-23-
I~BId +Cld + . . . + H7d~-~A2d + A3d + . . . +GBd~I
DCGI =100 * - G d
15 * 2 *~ rp2
wherein: B 1 d, Cl d, ... H7d = mean area of the dots in cells B 1, C 1, ...
H7,
respectively;
A2d, A3d, ... G8d = mean area of the dots in cells A2, A3, ... G8,
respectively;
r~ = reference radius of a perfect dot( e.g., 0.05 inch); and
Cipd = percent gain due to the printer driver.
The raggedness index (RI) enables a user to determine the extent to which the
edge of
a printed character deviates from its ideal shape. With respect to the test
pattern, RI evaluates
uneven wicking which occurs around the circumference of a printed dot on an
unprinted
substrate. In addition, RI evaluates uneven bleed which occurs around the
circumference a
printed dot on a printed background.
To determine RI, circularity (defined below) of a perfect dot is used. The
perfect dot
has a radius of, e.g., 0.05 inch, and a circumference of 2~r, or approximately
.314 in2. A
1 S printed dot is often not perfect since its edge will have irregularities
causing the
circumference of the dot to be greater than .314 in'-. It is noted that the
term "circumference"
refers herein to the actual length of the outer boundary of the dot. As the
irregularities in the
boundary increase, the circumference increases (assuming that the area remains
approximately the same or increases).
The RI is calculated by first determining the ratio of the mean circularity of
the dots in
a cell and the circularity of a perfect dot. One ( 1 ) is subtracted from the
ratio to offset the
circularity of a perfect circle to zero (0). 'The result is multiplied by one-
hundred (100) to
convert the unitless index to a percent. The percent is multiplied by ten
percent ( 10%) to
nornlalize the RI to match the numeric magnitudes encountered in the gain
indices. The
equation for the raggedness index (RI) has the general form:
CA 02356677 2001-06-22
WO 00/39749 PCT/US99/30881 '
-xa-
Cd
ra
RI = 100* n -1 *0.1
~~P
wherein: Cd = circularity of a dot;
CP = circularity of a perfect dot; and
n = total number of dots.
Circularity of a dot is determined by dividing the square of the circumference
(c) of
the dot by the area (A) of the dot. The equation for circularity (Cx) has the
general form:
C ~_ CX
x Ax
wherein x identifies a particular dot being analyzed.
The circularity of a perfect dot (Cp) is readily calculated to be 4~, or
approximately
12.:57. The circularity and area of a printed dot is determined utilizing
standard software
functions defined within the image analysis application program 68.
The RI can be determined for a cell or group of cells having printed dots on
an
unprinted background. A raggedness index determined in this way is referred to
herein as a
monochrome raggedness index (MRI). Alternatively, the raggedness index can be
determined for a cell or group of cells having printed dots on a printed
background. A
raggedness index determined in this way is referred to herein as a duochrome
raggedness
index (DRI). Similar to MGI and DGI, the term "chrome" is intended to indicate
those colors
generated by the application of ink, i.e., C, M, Y, K, R, G, and B, but not
the color of the
substrate.
Referring to FIG. 3, an example of the application of the general equation for
monochrome raggedness index (MRI) is given below for the ICP E l and AS from
the second
ICP group. The monochrome raggedness index for ICP E1 and AS (MRIE~/A5) is as
follows:
CA 02356677 2001-06-22
'WO 00/39749 PCT/US99/30881 '
-25-
~EIIAS - 10~* CEO + CAS -1 *0.1
2 *4n
wherein: CEO = mean circularity of the dots in cell E I; and
CAS = mean circularity of the dots in cell A5.
A useful MRI measurement includes the ICP in the first ICP group, i.e., the
ICP
including the color black (K) in combination with an unprinted substrate. This
MRI is called
monochrome black raggedness index (MKRI). Another useful MRI measurement
includes
the PCPs in the second ICP group, i.e., the ICPs including the color of a
substrate in
combination with each of the colors C, M, Y, R, G, and B. This MRI is called
monochrome
color raggedness index (MCRI). MKRI and MCRI are illustrated below.
Using the general equation for the raggedness index (RI), the equation for
MKRI is of
the :form:
MKRI = lOO*CCCE4 I -IJ *0.1
4 /~
wherein: C.'E4 = mean circularity of the black dots in cell E4.
Using the general equation for the raggedness index (RI), the equation for
MCRI is of
the Form:
MCRI = 100 * CEO + CEZ + CE3 + CE6 + C~E7 + CE8 -1 * ~.1
6*4~
wherein: C.'E~, CEO, ... CEg = mean circularity of the dots in cells E1, E2,
... E8,
respectively.
A useful duochrome raggedness index (DRI) measurement includes the ICPs in the
third ICP group, i.e., the ICPs including the color black (K) in combination
with each of the
colors C, M, Y, R, G, and B. This is called duochrome black raggedness index
(DKRI).
CA 02356677 2001-06-22
'WO 00/39749 PCT/US99/30881 '
-26-
Another useful duochrome raggedness index (DRI) measurement includes the ICPs
in the
fourth ICP group, i.e., the ICPs including combinations of each of the colors
C, M. Y, R, G,
and B. This is called duochrome color raggedness index (DCRI). DKRI and DCRI
are
illustrated below.
Using the general equation for the raggedness index (RI), the equation for
DKRI is of
the foam:
C~~+C,~4+Cp2+...+CHa
DKRI =100 * - I * 0.1
I 2 * 4~
wherein: Cps, CA4, CD2~ ... CN4 = mean circularity of the dots in cells D1,
A4,
D2, ... H4, respectively.
Using the general equation for the raggedness index {RI), the equation for
DCRI is of
the form:
+C,g2 +CCI +...+CG8
DCRI = 100* -1 *0.1
30*4n
wherein: Cgl, CA2, CCn ~~~ CGg = mean circularity of the dots in cells B1, A2,
C1, ... G8, respectively.
The non-uniformity index (NUI) provides a comparison of the non-uniformity of
an
ICF' with the non-uniformity of its related solids inverse pair (SIP). The
term "solids inverse
pair" refers to an inverse pair consisting of two of the diagonal cells which
have dots that are
the same color as the background. As noted above, the diagonal cells are cells
Al, B2, C3,
D4, E5, F6, G7, and H8. An ICP and SIP are "related" when they each include
the same
color-pair. For example, ICP B 1 (C dots on M background) and A2 (M dots on C
background) are related to SIP A 1 (C dots on C background) and B2 (M dots on
M
background). There are twenty-eight (28) possible NUIs in the test pattern
illustrated in FIG.
3.
The NUI compares an ICP and its related SIP by taking the ratio of: the value
con-esponding to the non-uniformity of the ICP {NUd); and the value
corresponding to the
non-uniformity of the ICP's related SIP (NUs). The value corresponding to the
non-
uniformity of each pair (1CP and SIP) is determined by taking the difference
between the
CA 02356677 2001-06-22
WO 00/39749 PCT/US99/30881 -
-27-
mean gray-scale values in each pair's histogram. The ratio is then subtracted
from one (1)
and the result multiplied by I00 to convert it to a percentage.
The equation for the non-uniformity index (NUI) has the general form:
NUI =100 1- NUd
NUS
wherein: NUd = non-uniformity of the ICP; and
NUS = non-uniformity of the related SIP.
Referring to FIGS. 8(a) and 8(b), an example is provided illustrating the
derivation of
the NUI for the ICP in the first ICP group, i.e., cells E4 and D5, and its
related SIP, i.e., D4
and. E5. The result is identified as NUI,~s
Initially, the histograms of each inverse pair are generated. Color band
selection 100
ma:y be used prior to this step to select the color band to be used to compare
the pairs.
Thereafter, the mean gray-scale values of each color represented in each
histogram is
determined. For the example, the mean gray-scale values are 190 arid 60 for
the ICP (FIG.
8(b)) and 200 and 50 for the related SIP (FIG. 8(a)). The calculation of
NUI,,US is as follows:
Il 90 - 60~
NUI~;~s. = 100 1- = 13.3%
200 - 50~
Those skilled in the art will recognize that the mean gray values for the ICP
will tend
to approach each other due to wicking. An extreme case occurs when the bi-
nodal humps of
the ICP histograms completely merge (appear as a single hump), resulting in an
NUd equal to
zero (0) and. therefore, an NUI equal to 100%.
The weighted sum (WS) is the sum of the above defined print defect indices,
after
weights have been applied to each, subtracted from one-hundred ( 100).
Weightings can be
based on determinations made through print testing or the preference of the
user. For
example, it may be decided that dot growth as measured by monochrome black
gain index
(MKGI) and monochrome color gain index (MCGI) should be more heavily weighted,
CA 02356677 2001-06-22
WO 00/39749 PCT/US99/30881
-28-
therefore more closely monitored, than the other parameters. A weighted sum
(WS) may
them have the form:
WS = 100 - ((0.2 * MKG~ + (0.2 * MCG~ + (0. I * DKGI) + (0.1 * DCG~ +
(0.1 * MKR~ + (0. I * MCR~ + (0.1 * DKR~ + (0.1 * DCR~)
Various combinations of the print indices may be useful in generating a WS so
to
evaluate a particular printer. In addition, various weightings may be applied
to emphasize
printing properties of the substrate that are of interest to the user. Unlike
the print defect
indices described above, the WS is equal to 100% when print quality is
perfect.
It is clear from the foregoing disclosure that the present system and method
for print
analysis provides an advancement in the art of image analysis. The system and
method
provides a test pattern having unique features that substantially reduce
aliasing and the affects
of the moire effect during scanning. The test pattern also enables testing of
multi-
dirr~ensional growth of printed characters due to wicking and bleed. In
addition, the system
and method provides custom software functions that work cooperatively with the
test pattern
1 S for analyzing printing properties of a substrate. Further, custom software
functions are
provided that operate to enhance the accuracy of the print defect analysis
results by ensuring
the colors being analyzed are accurately distinguished.
As discussed above with respect to the embodiment of the test pattern
illustrated in
FIG. 3, it is foreseeable that one or more ICPs may be printed along a
leading, trailing, or side
edge of a printed sheet of paper (or web) during printing operations utilizing
an in-line
printing press. Utilizing ICPs during in-line printing operations would
provide a manager of
suclh operations with valuable information regarding the printing process
and/or the printed
substrate. Because of certain unique characteristics of in-line printing,
however, the test
pattern illustrated in FIG. 3, and the method of analysis therefor, should be
modified. The
unique characteristics of the in-line printing process are described below.
Unlike PC-type printers, in-line printing presses, by definition, print each
colored ink
in a consecutive fashion. For example, in a four-color printing press, the f
rst printing station
may be set up to print yellow (Y) ink, the second printing station may be set
up to print
magenta (M) ink, the third printing station may be set up to print cyan (C)
ink, and the fourth
printing station may be set up to print black (K) ink. As a sheet of paper is
fed into the
CA 02356677 2001-06-22
WO 00/39749 PCT/US99/3088I -
-29-
printing press, it is initially fed to the first printing station where yellow
(Y) ink is printed
onto the sheet of paper. Thereafter, the sheet of paper is fed to the second
printing station
where magenta (M) ink is printed onto the sheet of paper. The sheet of paper
is then fed to
the third printing station where cyan (C) ink is printed onto the sheet of
paper. And finally,
the sheet of paper is fed to the fourth printing station where black (K) ink
is printed onto the
sheet of paper.
It should be readily apparent to those skilled in the art that printing ink
starts to dry
imrnediately after it is applied to a sheet of paper. Therefore, as a sheet of
paper is passed
from the first printing station to the second printing station, the yellow (Y)
ink is substantially
driE;d when the magenta (M) ink is printed. Also, when the sheet of paper is
passed to the
third printing station, both the yellow (Y;) and the magenta (M) inks are
substantially dried
when the cyan (C) ink is printed. And finally, when the sheet of paper is
passed to the fourth
printing station, the yellow (Y), magenta (M), and the cyan (C) inks are
substantially dried
when the black (K) ink is printed. In contrast, PC-type printers apply
different colored
printing inks more nearly simultaneously as the printing head traverses the
sheet of paper on
which it is printing.
From the above, one skilled in the art should appreciate that during printing
with an
in-line printing press, the extent to which different colored inks are able to
react with each
other is limited, as at least one of any two printing inks that are intended
to contact each other
is partially dry at the time they come into contact. In contrast, during
printing operations with
a PC-type printer, printing inks that are intended to contact each other
remain sufficiently wet
at the time they come into contact with each other so that they are able to
react with each
other to a significant extent.
Also unlike PC-type printers, an operator of an in-line printing press must
register the
images produced by each printing station with each other, i.e., the images
must be aligned
laterally and longitudinally. For example, in a two-color printing press,
wherein the first
printing station is set up to print a first image of a first color and the
second printing station is
set up to print a second image of a second color, the cylinder carrying the
second image will
necessarily have to be adjusted to the first image to align the second image
with the first.
Mechanisms on in-line printing presses for registering images are satisfactory
to produce an
acceptable printed image, however, they are typically not sufficiently
adjustable to generate
CA 02356677 2001-06-22
w0 00/39749 PCT/US99/30881
-30-
the test pattern illustrated in FIG. 3. For example, registration mechanisms
of in-line printing
presses typically will not adequately align a pattern of a test pattern with a
background
(including unprinted areas for the pattern to be printed in) of the test
pattern. The alignment
accuracy that registration mechanisms will provide between images in an in-
line printing
press is generally in the range of ~.015 inch. In contrast, PC-type printers
produce pixels to
generate a pattern and a background of a test pattern. The alignment accuracy
provided
between pixels in a PC-type printer is generally in the range of ~.002 inch.
Because of the characteristics of in-line printing presses as described above,
an
alternate embodiment test pattern may be used with in-line printing presses as
described
herein below. Those skilled in the art will appreciate the similarities and
differences that the
alternate embodiment test pattern has with the test pattern illustrated in
FIG. 3.
Referring to FIG. 9, a sheet of paper 200 is shown to include an image area
202 and
an alternate embodiment test pattern 204. The sheet of paper 200 is shown as
being delivered
from a printing press 220 having a first printing station 222 and a second
printing station 224.
The test pattern 204 includes an ICP similar to the ICPs in the test pattern
illustrated in FIG.
3, however, certain distinctions exist as described below. It is notable that
the test pattern
204 may include one or more ICPs. Furthermore, the test pattern 204 may be
positioned in
practically any location, or oriented in practically any orientation on the
sheet of paper 200
and still provide the benefits disclosed herein.
Generally, the test pattern 204 includes at least one ICP having a first cell
206 and a
second cell 208. The first cell 206 includes a background of a first color 210
and a pattern of
a second color 212. The second cell 208 includes a background of the second
color 214 and a
pattE:rn of the first color 216. Although the background of the first color
210 and the
background of the second color 214 are shown as having square shapes, they may
have other
shapes without departing from the scope of the invention. In addition,
although the pattern of
the first color 216 and the pattern of the second color 212 are shown as dot
groups containing
five (5) dots in each group, other patterns may be substituted without
departing from the
scope of the invention.
A distinction between the test pattern illustrated in FIG. 3 and the alternate
embodiment test pattern 204 is that the backgrounds (i.e., backgrounds 210 and
214) of the
alternate embodiment test pattern 204 do not include unprinted areas wherein
the patterns
CA 02356677 2001-06-22
WO 00/39749 PCT/US99/30881 -
-31-
(i.e., patterns 2I2 and 216, respectively) are printed. Another distinction
between the test
pattern illustrated in FIG. 3 and the alternate embodiment test pattern 204 is
the way in which
the alternate embodiment test pattern 204 is generated.
For implementation with in-line printing press operations, the first cell 206
and
second cell 208 are generated as follows. As the sheet of paper 200 passes
through the first
printing station 222 of the printing press 220, the background 210 of the
first cell 206 and the
pattern 216 of the second cell 208 are printed with the first color.
Thereafter, as the sheet of
paper 200 passes through the second printing station 224 of the printing
press, the
background 214 of the second cell 208 and the pattern 212 of the first cell
206 are printed
with the second color. From the above, it is understood that the background
214 of the
second cell 208 is printed over the pattern 216 of the of the second cell 208,
and the pattern
212 of the first cell 206 is printed over the background 210 of the first cell
206. The degree
to v~rhich a printed-over ink will show through will depend on several factors
including, for
example, the density of each ink, whether the printed areas are solid or
toned, and the degree
to v~rhich the printed-over ink has dried.
After the test pattern 204 has been printed on the sheet of paper 200, the
sheet of
paper 200 is scanned into scanner 4U and the test pattern 204 is analyzed by
personal
corr~puter 20. It is notable that the analyses provided above for the test
pattern illustrated in
FIG. 3 are not directly applicable to test pattern 204 because the second
color is printed over
the :first color, however, modifications to such analyses similar to those
described are
foreseeable and are considered within the scope of the present invention.
While the system and method disclosed herein has been described with respect
to
various specific embodiments, those skilled in the art will readily
appreciated that various
modifications. changes, and enhancements may be made thereto without departing
from the
spiriit and scope of the invention as defined by the appended claims.