Note: Descriptions are shown in the official language in which they were submitted.
CA 02361195 2001-07-17
WO 00/45153 PCT/US00/02313
OPTICAL COHERENCE MICROSCOPE AND METHODS OF USE FOR RAPID IN ~1~0 THREE-
DIMENSIONAL
VISUALIZATION OF BIOLOGICAL FUNCTION
Back4round of the Invention
Field of the Invention
The present invention relates to an optical coherence microscope IOCMI for
study of problems in
developmental biology and biotechnology. More particularly, the invention is
used for imaging cells located up to four
millimeters or more below the surface of living tissue.
Description of the Related Art
Optical coherence microscop~r IOCM) is a technique developed recently to image
objects embedded in an
opaque medium (e.g., flesh) up to a depth of 1 to 2 mm. It has been applied
successfully on a prototype basis in
ophthalmology (Swanson efraL, 1993) and dermatology (Schmitt et al., 1995,1'-
fo.~image tissue structures and
interfaces. Moreover, OCM has been used to measure the optical properties of
tissue' arid thereby provide information
on the physiological 'state of tissue. OCM has recenxly become a subject of
interest for the study of developmental
biology.
Understanding of developmental mechanisms has come from studies bf gene
expression patterns, tissue
geometry, andlor cell morphology, all performed on fixed tissue. From these
"snap-shot" views,.researchers must infer
the dynamics of the underlying cellular and molecular events. Recently,
biological imaging technologies have been
introduced that permit the non-destructive analysis of cell migration,
differentiation, and neuronal interconnection
during embryonic development. For example, fluorescent or absorbing compounds
can be used to label cells which are
then followed with a conventional light microscope equipped with a video
camera or with a confocal microscope. The
confocal microscope adds significant depth resolution, offering the
possibility of obtaining a three-dimensional image
by combining optical sections through the depth of an embryo. The image
formation rate of the confocal microscope is
sufficiently fast to follow the dynamic behaviors of cells as they migrate or
of retinal cell axons as they extend,
actively sense, and retract projections toward cells in the tectum (0'Rourke
et al., 19941. However, light scattering in
embryonic tissue reduces the signal-to-noise ratio of a confocal microscope,
limiting the depth of the specimen that can
be explored to about 200 Nm (Schmitt et al., 1994b1. A second imaging
technology is magnetic resonance imaging
(MRIh recently extended to the microscopic domain so that it can now resolve a
12 Nm cube in living embryos (Jacobs
and Fraser, 19941. Although an MRI microscope is indifferent to optical
opacity, it is both expensive and slow,
requiring nearly an hour to generate a high-resolution image.
It is worth noting that other recently developed imaging techniques also
experience image degradation with
depth into tissue. For example, green fluorescence protein (GFP) has been
modified and expressed in the plant
Arabidopsis thaliana, yielding beautiful images of developing roots. However,
the images are obtained with a confocal
microscope and are limited to depths less than 100 Nm in this preparation.
Development of the primary meristem in the
seed embryo occurs several hundred micrometers into the tissue, too deep for
confocal microscopy. Similar limitations
apply to 2-photon microscopy (Potter et al., 1996) and fluorescence resonance
energy transfer (Helm and Tsien, 1996).
CA 02361195 2001-07-17
WO 00/45153 PCT/US00/02313
Optical Coherence Microscopy. An optical coherence microscope uses the
principles of confocal microscopy,
with an additional coherence gate that excludes back-scattered light from out-
of-focus planes, resulting in a signal-to-
noise ratio that is enhanced by 6 orders of magnitude (1 zatt et al.,
1994a,b). A resolution of 10 Nm has been achieved
in both the lateral and depth directions (Huang et al., 1991 b). Optical fiber
and solid state sourcesldetectors are
typically used, so the instrument is inherently rugged. OCM overcomes the
depth limitation of confocal microscopy and
is currently faster than MRI. And at an estimated cost of under S10,000 the
instrument is two orders of magnitude
less expensive than the MRI microscope.
The coherence gate in OCM is achieved by superposing a Michelson
interferometer on the confocal
microscope. Back-scattered light from the specimen interferes coherently with
light returning from an added reference
arm only when the two optical paths are equal. The amplitude of interference
fringes (their "visibility") becomes the
signal; this signal is appreciable only for light back-scattered from a narrow
range of depths in the specimen. The depth
range over which interference occurs is related to the coherence length of the
source. For example, the depth range,
which is also the depth resolution, is roughly 10 Nm when the spectral width
of the source is 30 nm (7~ - 830 nm,
Swanson et al., 1992). At a particular depth, a lateral image (optical
section) can be formed by translating the beam;
the spot size of the focused beam (easily less than l0,um) determines the
lateral resolution.
History of Reflectometry. When optical fibers were introduced into the
communications industry in the
1970s, the need immediately arose for a method of testing and locating flaws
in fiber cables. The first reflectometers
(Barnoski and Jensen, 1976), which operated in the time domain, simply
measured the round trip time of flight to a
reflecting fiber flaw. Typical pulse widths were a few nanoseconds, so spatial
resolution was about one meter.
In the 1980s there appeared low-coherence reflectometers which operate in the
frequency domain IDanielson
and Whittenburg, 1987; Takada et al., 1987; Youngquist et al., 1987). In this
technique a spectrally broad (30 nm)
light source operating in the near infrared (800 to 1300 nm) is employed in a
Michelson interferometer, one leg of
which is the fiber under test. The light source has a coherence time of 70
femtoseconds, a considerable improvement
over the timedomain pulse widths. As the reference path length is varied, the
interferometer output is monitored for
interference fringes that occur when light is reflected or back-scattered from
a point a distance along the tested fiber
equal to the reference path length. The spatial resolution along the tested
fiber is one-half the coherence length
because the fiber is traversed twice in that leg of the interferometer.
(Actually the geometrical spatial resolution is
even smaller by a factor of n, where n is the refractive index of the fiber.)
For a spectral width of 30 nm, the
geometrical spatial resolution along a fiber is 7 Nm.
Shortly thereafter ophthalmologists adapted this low-coherence reflectometer
to measure the length of the
eye (Fercher et al., 1988; Hitzenberger, 1991 ). Finally lateral scans were
added, and both lateral and depth data were
interpreted in terms of images of the sample, usually 2-D images with one
lateral and one depth dimension (Huang et
al., 1991 a,bl. The image presumably represents the spatial variation of the
optical properties of the sample, primarily
the scattering coefficient.
2.
CA 02361195 2001-07-17
WO 00/45153 PCT/US00/02313
Polarization Effects. Interference occurs at the output of the OCM only
between the same polarization
components of the electric fields returning from the reference mirror and the
sample, respectively. Birefringence
effects in the optical fibers or in the sample may alter the relative
magnitude and phase of the two polarization
components emitted by the source and hence reduce the amplitude of the
interference fringes at the photodetector. To
eliminate problems in the fibers, some workers have used polarization-
preserving fibers and linearly polarized light to
eliminate polarization-dispersion effects that lead to different optical path
lengths for different polarization states
(Clivaz et al., 19921. Kobayashi et al. (1991) constructed a polarization-
insensitive reflectometer by separating the two
polarization states at the output of the interferometer and measuring their
interference fringes with two independent
detectors. The sum of the detector outputs is independent of birefringence
effects in the fibers or the sample. On the
other hand, Wang et al. (1994) devised a simple, inexpensive means of
circumventing birefringence effects. They
judiciously twist the reference fiber, introducing stress birefringence, until
the polarization states of the reference and
sample fields are matched and the amplitude of the interference fringes is
maximized. Rather than compensate for and
eliminate birefringence effects, Hee et al. (1992) have constructed a low-
coherence reflectometer to exploit
polarization changes in the sample. With this device they were able to measure
the birefringence properties of a calf
coronary artery.
Summary of the Invention
The present invention provides a high resolution optical coherence microscope
system for visualizing
structures below a surface of a biological sample. The system includes a light
source emitting light in a wavelength of
between 700 and 1500 nm, the light being directed along a sample path and a
reference path. The length of at least
one of the paths is a modulated path having a selected amplitude of modulation
that is equal to or less than about 3
fringes of the wavelength. The modulation may occur at a frequency of at least
about 50 kHz, 100 kHz, 300 kHz or at
a higher frequency. The light directed along the sample path may scan the
biological sample, the scan resulting in an
image of a portion of the biological sample; the portion may be between about
100 Nm and about 4000 Nm below the
surface of the sample.
The image may include one or more layers. Each layer may be derived from
multiple voxels all corresponding
to substantially the same depth below the surface of the sample. The image may
include at least about 50 distinct
layers, each of the layers derived from a distinct group of voxels, with all
voxels for each distinct layer corresponding
to substantially the same distinct depth below the surface of the sample. The
image likewise may include blended
voxels of several layers, such that the image may be a three-dimensional
rendering of the portion of the biological
sample. The OCM system of the invention further may include a coherence volume
about a plane at which the length
of the sample is equal to the length of the reference path, such that the
coherence volume exists below the surface of
the biological sample.
The light from the sample path may enter the sample and taper to a beam waist
diameter of not more than
20 Nm within the sample. The beam waist is coincident with the coherence
volume, such that resolution of structures
within the sample is a distance less than or equal to the diameter of the beam
waist.
3-
CA 02361195 2001-07-17
WO 00/45153 PCT/US00/02313
The invention further provides a method of visualizing a structure beneath a
surface of a biological sample,
employing the OCM system described herein. The OCM system also allows a method
of analyzing a biological function
based on visualization of in vivo changes in structures beneath a surface of a
biological sample. The function to be
analyzed may include, for example, gene regulation, development, messenger
response, and stress.
The invention also provides a method of visualizing a structure beneath a
surface of a biological sample. The
method may include the steps of: providing light having a wavelength between
700 and 1500 nm; dividing the light
into a sample light path and a reference light path; modulating the length of
at least one of the light paths at an
amplitude no greater than about 3 fringes of the wavelength; directing light
from the sample path into the biological
sample, such that the light tapers to a beam waist at a selected depth below
the surface of the sample, and such that
the beam waist is coincident with a coherence volume about a plane of equal
path length of the sample path and the
reference path; and detecting an image at the selected depth below the surface
of the sample to visualize the
structure.
In accordance with this method, the directing step may be repeated at least
100 times, and after each
directing step, the method may include the additional step of translocating
the sample light path to a different position
in the biological sample. The image thus visualized may indicate a difference
between a mutant biological sample and
a non-mutant biological sample. The image may include a pattern of light
scatter, wherein the pattern correlates with
a characteristic of the biological sample, such as, for example, gene
activity, differentiation, cell elongation, cell
dormancy, stress response, and pathogen response.
Brief Description of the Drawings
Figure 1 presents the optical schematic of a fiber-optic optical coherence
microscope (OCM).
Figure 2 is an image of a Ronchi ruling visualized through 1.2 mm of a highly
scattering solution of
polystyrene latex spheres.
Figure 3 is a typical plots of OCM fringe amplitude versus depth, averaged
over horizontal slices in a plant
preparation.
Figure 4 is a typical plots of OCM fringe amplitude versus depth, averaged
over horizontal slices in a frog
preparation.
Figure 5 illustrates that relationship between noise in the reference beam
versus reference beam power.
Figure 6 shows the impedance of mounted and unmounted piezos as a function of
the driving voltage
frequency.
Figure 7 shows the displacement of the piezo per volt applied at each of the
resonance frequencies.
Figure 8 illustrates the phase dependence of the output fringe signal.
Figure 9 shows the experimental values for the powers of the interferometer
output signal in the first two
harmonics as a function of the piezo driving voltage.
Figure 10 is an optical schematic of a modified OCM.
-4-
CA 02361195 2001-07-17
WO 00/45153 PCT/US00/02313
Detailed Description of the Preferred Embodiment
The present invention discloses an optical coherence microscope capable of
addressing fundamental problems
in developmental biology. Results for two exemplary developmental systems, the
frog Xennpus laevis and the plant
Arabidopsis thaliana, are presented herein. The invention is likewise suitable
for application to numerous other taxa
including, for example, Drosophila, zebrafish, and virtually any
agriculturally or scientifically important plant. The
present invention is also broadly applicable to other biological systems
wherein the events, structures, cells, andlor
processes to be visualized are not accessible to light microscopy. The
invention is particularly suitable for
developmental biology studies of structures and events within 4mm, preferably
within 3 mm, more preferably within
2mm, and most preferably within 1 mm, of a tissue surface. Likewise, the
invention contemplates use of the disclosed
OCM for other purposes, such as, for example, diagnostics and functional
genomic analysis. Following the methods
disclosed herein, data for a three-dimensional image formed by stacking
successive lateral images from different
depths can be acquired in less than a minute. Accordingly, the present
invention is particularly well suited for high
throughput functional genomic analysis, each OCM having the capability of
tracking development and other gene-
regulated events in many plants per day. In this aspect of the invention, 25,
50, 100, 250, 500, or more plants may
be screened per day, depending on the nature of the screening.
Developmental Bioloay - Xenopus laevis. The resolution of the OCM makes it
ideally suited for following
development within amphibian embryos, where single cell size is typically
greater than 10 Nm and critical
developmental events take place within the first few hundred micrometers. More
conventional microscopy (confocal
microscopy, video microscopy) is not suitable far following much of the
embryonic development because of the highly
scattering nature of the frog embryo cytoplasm and the optical aberrations
inherent in confocal imaging deep into
tissues (Schmitt et al., 1994b). Recently, using an MRI microscope, Jacobs and
Fraser (1994) were able to fallow
events within the interior of a frog embryo during gastrulation and
neurulation. Surprisingly, they observed that the
deeper cells (mesoderm) and the surface cells (ectoderm) extended at different
rates. Previous analyses performed on
explanted fragments of embryonic tissue had suggested that the ectodermal and
mesodermal tissues extended the
embryonic axis roughly in concert (Kelley, 1986). It is desirable to examine
the exact relationships between these
tissues as it is largely believed that signals flowing from the mesoderm to
the ectoderm play a primary role in the
establishment and patterning of the embryonic nervous system.
Developmental Biolo4y - Arabidoosis thaliana. The plant body is predominantly
formed post-embryonically
through the activity of specialized tissues called meristems (Steeves and
Sussex, 1989). Current understanding of the
molecular mechanisms governing the function and formation of meristems is very
limited. Recently however, advances
in the understanding of meristem formation have been made through the genetic
analysis of the small crucifer
Arabidopsis thaliana (Mayer et al., 1991; Barton and Poethig, 1993). In
Arabidopsis two meristems, the primary root
and shoot apical meristems, are formed embryonically, while the secondary
(lateral) root and shoot meristems appear
post-embryonically. Molecular and genetic approaches have been used in order
to identify genes required for the
-5-
CA 02361195 2001-07-17
WO 00/45153 PCT/US00/02313
formation of the root meristems (Williams and Sussex, 1995; Laskowski et al.,
19951. As a result it is now possible to
assign stages to developing lateral root meristems based on their
morphological characteristics.
The shoot apical meristem of Arabidopsis ties below the surface, and an embryo
of Arabidopsis lies within a
layer of pigmented cells. As a result, until now the development in the embryo
of the primary root and shoot apical
meristems could be visualized only by fixing and sectioning or dissection of
the embryo from the maternal tissue. These
procedures obviously prevent continuous observation of development within the
same meristem.
Post-embryonically, the shoot apical meristem farms the vast portion of
tissues and organs in a plant (e.g.
leaves). Leaves are directly initiated on the flanks of the shoot apical
meristem through an asymmetrical expansion of
the meristem, leading to a bulge, which after further unidirectional expansion
becomes clearly delimited as a leaf
primordium ISteeves and Sussex, 19891. Surgical experiments have demonstrated
that previously initiated leaf
primordia have an inhibitory effect on the positioning of the subsequent
primordium, causing it to form on the point
farthest from the two previously initiated leaves (Snow and Snow, 19621.
Whether this inhibitory effect is due to
chemical or physical factors is still unclear (Smith and Hake, 1992; Hernandez
and Green, 1993; Green, 1994 1.
Traditional approaches to study phyllotaxy (the pattern of leaf initiation)
have required some sort of dissection to
remove overlying tissues in order to see the shoot apical meristem. Use of OCM
to follow non-invasively the pattern of
leaf initiation in Arabidopsis avoids altering the biochemical and physical
environment of the plant. It is possible to
view processes in the apical meristem, shoot apex, and other deeply buried
tissues and organs. For example, OCM
permits detection of organ initiation, dorsoventrality, and other processes
deeply buried in 1 to 2 millimeters of tissue
at a resolution of at least 10 ,um. These dimensions fall within the optimal
ranges of OCM and are not suited for
analysis by other techniques. As one example, OCM permits observation of
altered patterns of phyllotaxy arising from
genetic mutations or exogenous application of hormones. Furthermore, a high
amount of backscattered light detected
in cells and tissues by OCM correlates strongly with cells and tissues known
to be active in transcription and
differentiation. Hence OCM provides a tool to follow any active process,
natural or induced in vivo. The present
invention thus expressly contemplates uses of OCM embodiments of the invention
in various approaches to following
active biological processes including, for example, functional genomic
analysis, developmental studies, tracking
responses to biological signals such as hormones and pathogen elicitors; and
the like.
Optical Coherence Microscope. The microscope of the invention is capable of
imaging cells located below the
surface of living tissue, even though light scattering in the specimen would
render it opaque to a conventional or
confocal light microscope. Depth penetration is achieved by use of a near
infrared superluminescent diode light source
with a coherence length of 20 Nm together with a coherence gate based on a
Michelson interferometer. This
combination excludes light back-scattered from out-of-focus planes, giving a
depth resolution of 10 Nm. Lateral
resolution of 10 Nm or better is achieved by focusing the illuminating beam
down to a small spot. Two-dimensional
lateral scanning of the beam spot produces an optical section at a fixed depth
in the sample. A three-dimensional image
is obtained by stacking successive optical sections at different depths. Such
three-dimensional scans typically take
less than a minute.
-6-
CA 02361195 2001-07-17
WO 00/45153 PCT/US00/02313
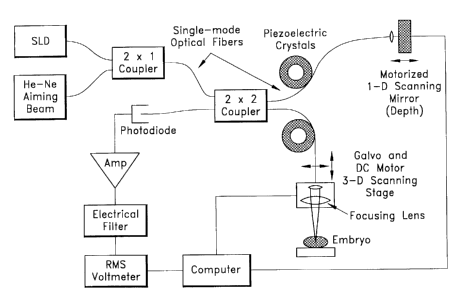
Figure 1 presents the optical schematic of a fiber-optic OCM. The
superluminescent diode (SLD) is a laser
diode with end facets that have been anti-reflection coated so that no lacing
occurs, and hence the full spectral
breadth of the transition appears in the output. The center wavelength lies in
the near infrared (e.g., 850 nm) where
the absorption coefficient of biological tissue is near its minimum. Assuming
a Gaussian spectral profile, a 30 nm full-
y width-at-half-maximum (FWHM) spectral width of the SLD yields a final depth
resolution (FWHM of the Gaussian
visibility function) of 11 Nm I n , where the refractive index, n, of tissue
is close to 1.40 (Bolin et al., 1989). The
helium-neon laser beam (633 nm) serves simply to visualize the focused spot,
and both beams are coupled into single-
mode optical fibers. The two fibers are combined in a fused region called a "2
x 1 coupler".
Each source beam is split and sent along the two paths of the Michelson
interferometer by the 2 x 2 coupler,
a similar fused region of two fibers that mixes their spatial modes. The
sample path fiber is terminated with an
aspheric collimating lens, and the beam is then focused by a doublet lens to a
spot diameter of 9 Nm. The sample
fiberlfocusing lens assembly is mounted on a 3-D scanning stage consisting of
a 1-D translation stage powered by a
DC motor and a pair of galvo-scanners in an x-y mount. The closed-loop galvo-
scanners raster-scan the horizontal plane
while the closed-loop DC motor steps along the depth dimension, so the waist
of the focused beam explores a sample
volume and an OCM image is formed. The reference path fiber is also terminated
with an aspheric collimating lens and
is led to a reference mirror (retroreflector) that is mounted on another
translation stage driven by a closed-loop DC
motor. As the sample fiberlfocusing lens assembly is stepped along the depth
dimension, the reference mirror is
translated to keep the beam waist coincident with the coherence volume
(position of equal path lengths in the
interferometer). This last point is important because the Rayleigh range of
the focused beam is roughly 60,um, so the
beam rapidly expands and the lateral resolution quickly degrades as the
coherence volume deviates from the beam
waist.
In one embodiment, the instrument may also include matching piezoelectric
cylinders around which are
wrapped the reference path fiber and the sample path fiber. In response to an
applied voltage the circumference of
each cylinder changes slightly, resulting in a change in the optical path
length of the fibers. If the piezoelectric
cylinders are driven (180° out of phase) by a triangular voltage signal
with a frequency of, for example, 8.3 kHz, the
resulting changes in the fiber lengths modulate the optical path length
difference between the two arms of the
interferometer. If the amplitude of the piezo-driving voltage is chosen so
that the optical path length variation is t 1.5
~,, the interference pattern at the interferometer output will be modulated at
100 kHz, a frequency that is easily
isolated by an electrical bandpass filter to increase the signal-to-noise
ratio. Alternative embodiments may employ a
piezoelectric stack with a mirror attached thereto as a way of achieving high
frequency length changes in a light path.
That embodiment is described in more detail in Example 1 below.
Scannin4 Technigues. Two different general methods can be used to scan a
sample and create an OCM
image. First, one can perform a 2-D lateral scan at a fixed depth, then
increment the depth, then perform another
lateral scan, etc. A 3-D image of a sample volume is then constructed by
successively stacking 2-D optical sections
that are parallel to the surface of the sample. In contrast, most researchers
(see, for example, Huang et al., 1991 a)
.7.
CA 02361195 2001-07-17
WO 00/45153 PCT/US00/02313
perform a longitudinal (depth) scan at a fixed transverse point, then
translate the beam laterally in a single direction
and repeat the longitudinal scan, etc. Typically a 2-D optical section is then
formed which is perpendicular to the
sample surface, having one depth dimension and one lateral dimension. Each
longitudinal scan is accomplished by
translating the reference mirror at speeds as high as 160 mmls (Hee et al.,
19941. The light reflected from the moving
reference mirror is then Doppler shifted by as much as 380 kHz, and the
electrical bandpass filter can be set at that
frequency. In this case there is no need for the modulation of the
interference pattern provided by the piezoelectric
crystals included in Figure 1. However, with this Doppler-shift technique it
is difficult to keep the beam waist
coincident with the coherence volume, resulting in degraded lateral
resolution. For the imaging of embryos, it is
preferable to scan in both lateral directions to create an optical section at
a given depth.
Focusin4 the Beam. The lateral resolution of an OCM image is determined by the
size of the focused beam.
Thus, for good resolution, it is beneficial to use a focused spot less than 10
Nm in diameter. In ane embodiment of the
OCM (see Figure 1), the sample fiber is terminated with an aspheric
collimating lens (f = 6.2 mm, OZ Optics) so that
the emerging beam has a Ilez diameter of 1.4 mm and a divergence half-angle of
0.4 mrad. The subsequent focusing
doublet lens (f = 10 mm, Melles Griot, O6LA1001) is designed to minimize
spherical aberration at 830 nm and yields a
nearly diffraction-limited spot size with a Ilez diameter of 8 Nm.
A selected focusing arrangement can be tested by imaging a Ronchi ruling
through 1.2 mm of a highly
scattering solution of polystyrene latex spheres. The Ronchi ruling consists
of 10 Nm wide stripes of chrome deposited
on a glass cover slip. The chrome stripes are separated by 10 Nm stripes of
clear glass. The highly scattering solution
serves as a tissue phantom and consists of 0.523 Nm diameter polystyrene latex
spheres. The solution has a
scattering coefficient N5, of 401cm and a reduced scattering coefficient NS =
(l-glu, of 101cm where the asymmetry
parameter g equals the mean cosine of the scattering angle. The sphere
solution represents nearly 5 optical depths and
appears opaque to the unaided eye or through a conventional microscope. From a
detailed analysis of images like
Figure 2, the IIeZ diameter of the beam waist was determined to be 8.8 ~ 0.2
Nm, just slightly larger than the
diffraction-limited spot size of 8 Nm.
Image Acuuisition Time. In designing and constructing an OCM for imaging in
developmental biology and
biotechnology, a critical factor is the time needed to acquire an image.
Certainly this time should be short compared to
the mean time between cell divisions, and it would be helpful if the
acquisition time were short enough to eliminate
gross motion of the embryo. The fundamental physical phenomenon that places a
minimum on the acquisition time is
photon noise. For example, to obtain 3% precision in the collected signal at
each voxel in a 3-D image of an embryo,
assuming Poisson statistics, there must be about 10' photons in the collected
signal for an average voxel. Thus, to
image a 500 Nm cube at a resolution of 1 O,um in each direction, and a scan
step of 5 Nm in each direction, then data
must be collected from 100 x 100 x 100 = 106 voxels. The total number of
photons required is therefore 106 x 10' -
109 photons.
The collected signal is proportional to the amplitude of the interference
fringes at the output of the
interferometer. The interference term is proportional to the electric field
back-scattered from a voxel, so the collected
.g.
CA 02361195 2001-07-17
WO 00/45153 PCT/US00/02313
signal is proportional to the square-root of the back-scattered power hzatt et
al., 1994a1. If Pp is the power incident
upon the interferometer, and PIz) is the power returning from a voxel at depth
z, then:
signal ~c Pp sqrtl P(zIIPo~ (1 )
Interpretation of OCM Ima4es. Although several OCM images of living biological
tissue have been reported in
the literature (Swanson et al., 1993; Hee et al., 1994; Schmitt et al.,
1994c,d, Bouma et al., 19951, a great deal of
work remains to be done in identifying the precise optical characteristics of
the sample that give rise to features in the
OCM image. Schmitt et al. (1993, 1994a) have shown that in weakly scattering
media the power returning from a
sample volume at depth z in an OCM instrument is given by
P(z) = Pe exPl-2Nrz)~Nna~,rl~on I 2 (21
where Po is the power incident upon the interferometer, N, = Nf + N, is the
total attenuation coefficient equal to the
sum of the scattering and absorption coefficients of the medium (units of
11m), frback is the back-scattering
coefficient (11m1, and l~on is the coherence length of the source. In equation
(2), Po exp(-,u~Z) is the power reaching a
depth z in the sample without being scattered or absorbed, Nne~~ l~on I 2 is
the fraction of that power that is back-
scattered and can coherently interfere at the output of the interferometer,
and expl-N,z) is the fraction of the back-
scattered light that reaches the surface of the medium without being scattered
or absorbed. As pointed out by Schmitt
et al. (1993), OCM data can be used in conjunction with equations (1) and (2)
to deduce values for Nr and,ub,~ in
tissue. Indeed, Clivaz et al. (1992) have used OCM to measure the scattering
properties, refractive index, and
thickness of arterial walls.
Schmitt et al. (1994a1 used Monte Carlo simulations to show that the single-
scattering model of equation (2)
is valid in a medium up to 4 or 5 optical depths (4 or 5 IN,1. Using OCM,
Schmitt et al. (1993) measured N~ to be about
5lmm (and ,un,~k to be about 1.51mm) in the dermis of the human finger and
forearm. At greater than 4 to 5 optical
depths, multiple scattering begins to become important, and resolution may be
degraded. On the other hand, Izatt et al.
(1994a) show that OCM has its greatest advantage over confocal microscopy
between 5 and 15 optical depths.
Schmitt et al. (1994c) studied the walls of freshly excised rat coronary
arteries with OCM. Using focused
beam spots with diameters ranging from 8 to 17 Nm, they measured higher total
attenuation coefficients with larger
beam spots. They concluded that the increase in measured Nr was a result of
degradation of spatial coherence across
the beam with increasing beam diameter. They speculated that this degradation
was due to spatial fluctuations in the
refractive index in the artery walls, and suggested a theoretical framework
based on the mutual coherence function of
the beam that might begin to describe quantitatively the observed loss in
spatial coherence.
A thorough interpretation of OCM images of biological tissue requires an
elucidation of the origin of
scattering and absorption in tissue. For example, one can imagine two types of
scattering from a cluster of cells: (1)
.g.
CA 02361195 2001-07-17
WO 00/45153 PCT/US00/02313
scattering from cell organelles which should lead to scattering over all
scattering angles, perhaps slightly weighted
toward forward angles, and (2) Fresnel reflections from refractive index
mismatches such as might occur at the
extracellularlintracellular interface. The latter scattering should be highly
directional and is referred to as the
"specular" reflection. Of course both types (1) and (2) arise from
inhomogeneities in the refractive index, but the
angular dependence is quite distinct. Moreover there is a phase change of
180° in type (2) scattering when the
reflection is from a medium with a higher refractive index.
Calibration of the OCM. It is desirable to devise numerous calibration
procedures for the OCM. One important
calibration procedure is to use the OCM to examine tissue phantoms with
carefully constructed optical properties and
physical dimensions. For example, the longitudinal scan of an OCM can be
tested by examining phantoms consisting of
homogeneous layers of highly scattering solutions with depths defined
precisely by microscope cover slips. The
solutions can be made of polystyrene latex spheres or Intralipid, a fat
emulsion used far intravenous feeding in
hospitals. The spheres are available in precise diameters; Mie theory can be
used to calculate the scattering coefficient
of sphere solutions as well as the asymmetry parameter g , the mean cosine of
the scattering angle. Intralipid contains
a wide continuum of particle sizes, but its optical properties have been
studied exhaustively because it is less
expensive than the latex spheres (Driver et al., 1989; Flock et al., 1987,
1992; van Staveren et al., 1991). Values for
,u, for solutions of spheres and Intralipid can be measured with a
spectrophotometer using a successive dilution
technique.
Lateral and depth resolution can be checked by placing a resolution target or
a microscope calibration reticle
at an interface between layers in a tissue phantom. (See the image of a Ronchi
ruling in Figure 2.) Slopes, intercepts,
and discontinuities in data from a longitudinal scan can be used to deduce N~
and ,uba~k for the various layers in a
phantom (Schmitt et al., 1993). Longitudinal scans of a solution of
polystyrene spheres (used also in Figure 2) showed
that measured fringe visibility falls off exponentially with depth as
predicted by equation (2), and a value forN~ of 38.4
~ 0.2 Icm. A series of spectrophotometer measurements yielded Nr of 40.0 ~ 0.1
Icm. The discrepancy is probably
due to the small contribution of multiply-scattered photons.
Ima4es from the OCM. Image acquisition may be directed by a computer system
running visualization
software such as, for example, LabView (from National Instruments). As an
example, an image may consist of
500,000 voxels and cover a volume of 1 mm x 1 mm x 1 mm. Of course. the
invention may be applied to images of any
number of voxels, whether fewer than 500,000 voxels or more than many millions
of voxels. Desired voxel number will
be selected based on the volume to be imaged and the resolution desired.
Horizontal slices of images may be viewed
during data acquisition, and after collection a 3-D image can be viewed
quickly as a time series of horizontal slices
displayed on a computer monitor. More extensive examination of a 3-D image may
be accomplished by transferring the
image to a Unix workstation running an advanced software package such as, for
example, AVS 5.0 (Advanced
Visualization Systems). A particularly useful way to extract information from
an image is to rotate a volume rendering
of the image, noting alignment of structural features. In a volume-rendered
image, the contribution of a voxel at the
rear of the image volume is "blended" with contributions from all voxels along
the line projecting forward to the final
-10-
CA 02361195 2001-07-17
WO 00/45153 PCT/US00/02313
pixel in the 2-D image. Several of the Figures included herewith are simply
volume-rendered images viewed from a
single perspective, then printed on a color laser printer. The information
content of these laser printer images is
significantly less than the rotating volume-rendered images on the computer
monitor.
Optical Prouerties of Frog and Plant Tissue. From the images collected of frog
and plant tissue, average
values have been deduced for the total attenuation coefficient N,o"~ 9 ~5 + Na
where NS and Ns are the scattering and
absorption coefficients. As the 850 nm beam enters the sample, the incident
power is attenuated with depth due to
scattering and absorption. Figures 3 and 4 are typical plots of OCM fringe
amplitude versus depth, averaged over
horizontal slices in plant and frog preparations, respectively. Fringe
amplitude is proportional to the square-root of
power backscattered from the sample, so it should decay exponentially with
depth according to expl-N,o,a~ ' depthl.
Fitted values for N,o"~ are 15 and 101mm for plant and frog tissue,
corresponding to optical depths (11e attenuation
lengths) of 70,um and 100Nm, respectively.
Desi4n of the Modified OCM. The modified OCM is faster than the original
instrument because the x-y scans
are performed by galvo-scanning mirrors instead of DC motor translators. In
addition, a piezo-mounted reference mirror
produces output fringes at 125 kHz instead of the 2 kHz frequency achieved by
wrapping optical fiber around a piezo-
cylinder.
Other modifications to the OCM are contemplated by the invention. For example,
a lower response time for
the electrical filters that selectively pass the first two harmonics of the
fringe frequency can be achieved by widening
the bandpass of these filters. In addition, the rms integrated circuit that
may be used to measure the amplitude of the
fringe signal has an inherently low dynamic range. Digital signal processing
(DSP) is therefore a desirable alternative to
analog circuits. A DSP solution can permit modifications to the filter
characteristics in software, with the response
time to be determined by the integer number of fringe periods that are
sampled. The dynamic range thus can be
improved over the analog rms chip because multiplications are performed
digitally.
In addition, photodetector noise at 100 kHz is 25 pWlsqrtlHz), a factor of 8
greater than the manufacturer's
specification (New Focus, Model 18011. By substituting a similar silicon
photodiodelamplifier hybrid from Advanced
Photonix (Model SD 100-41-21-23 1) a noise level of 1 pWlsqrt(Hz) was
achieved. The amplifier in the Advanced
Photonix photodetector has a bandwidth of 400 kHz compared with 125 MHz for
the New Focus detector. Also, the
Advanced Photonix photodiode operates with a reverse bias of 15 Molts, while
the New Focus diode has no bias. This
reduction in photodetector noise reduced overall noise levels to the rage of
fundamental photon noise. Figure 5
illustrates that the typical OCM interferometer output of 25 NW is accompanied
by photon noise that is primarily
Bose-Einstein. This ultimately means that the OCM achieves its maximum signal-
to-noise ratio when the reference
beam is cut to 3 NW.
The low amplitude path length modulations of the invention are important in
achieving good axial resolution
of the image, consistent with the coherence length of the light source.
Desirable amplitudes in path length are most
meaningfully expressed as a function of the fringe of the wavelength of the
light source being used, where one fringe is
defined as'/~ 7~. An amplitude of about 3 fringes is preferred, an amplitude
of about 2 fringes is mare preferred, and an
CA 02361195 2001-07-17
WO 00/45153 PCT/US00/02313
amplitude of about 1 fringe or less is most preferred. For example, with a
wavelength of 850 nm, 3 fringes - 1275
nm, 2 fringes - 850 nm, and 1 fringe - 425 nm.
EXAMPLES
Example I - Modifications to the OCM system
A. Obtaining high-frequency modulation of path length by attaching a
lightweight reference mirror to a
piezoelectric stack.
1. Fast phase modulation. Fast phase modulation was achieved in the Michelson
interferometer of the
OCM system by attaching a lightweight reference mirror to a piezoelectric
stack and driving the stack at a resonance
frequency of about 125 kHz. The electrical behavior of the piezo stack and the
mechanical properties of the piezo-
mirror arrangement were examined. A displacement amplitude at resonance of
about 400 nm was achieved using a
standard function generator. Slow drifts in the pathlength difference of the
two interferometer arms caused variations
in the measured rms intensity of the AC-coupled output fringe signal. By
driving the piezo stack at an optimal
amplitude (a displacement of 0.42 ~" or slightly less than 1 fringe) and
summing the powers in the first two harmonics
of the pieza-driving frequency, drift-insensitive measurements of the output
fringe signal were achieved.
Piezoelectric crystals are used in a variety of forms for phase modulation in
interferometry. The mirror in the
reference arm of a Michelson interferometer is often attached to a piezo stack
that is driven at frequencies up to 10
kHz, well below its resonance frequency. With driving amplitudes of some ten
to a hundred volts, pathlength
modulations of the order of a few Nm can be achieved. In fiber optic
interferometers, the fiber can be wound in a large
number of turns around a hollow piezoelectric cylinder. Driving the cylinder
up to frequencies of a few kHz will cause it
to expand and contract radially, stretching and relaxing the fiber accordingly
and thus providing the modulation of the
optical path length. However, this method typically requires tens of meters of
fiber, making the interferometer
sensitive to thermal fluctuations that result in phase wander of the output
fringe signal. Other problems with this
approach may include static polarization mismatch and dynamic birefringence
modulation, which requires a Faraday
rotator for compensation. Fibers coated with piezoelectric films have also
been used. When a voltage is applied to the
piezo jacket, the fiber is squeezed radially and thus increases in length. In
this way, fast phase modulations can be
achieved, but the modulation amplitude is typically small. In order to produce
a change in optical path length of 1 Nm
at 100 kHz, a fiber coated over a length of 20 cm would require more than 100
V of driving amplitude.
In order to minimize the time required to collect an OCM image, it was
desirable to develop a method of
phase modulation with a frequency greater than 100 kHz and a displacement
amplitude of the order of 1 ,um. This
Example describes the use of a piezoelectric stack that is driven at a
resonance frequency of 125 kHz to produce a
displacement amplitude of 400 nm with a peak-to-peak driving voltage of only
6.7 V.
2. Tests of the electrical behavior of the piezoelectric stacks. Piezoelectric
stacks manufactured by
NEC Corporation of Japan (available from Thorlabs Inc., Newton, NJ, type
AE0203-D04) were tested for possible use
in the Michelson interferometer of the OCM of the invention. The dimensions of
these piezos are 2.5 mm x 5 mm x 5
12-
CA 02361195 2001-07-17
WO 00/45153 PCT/US00/02313
mm, and the manufacturer's specifications indicate a displacement of about 3
Nm at 100 V DC. Since the impedance
of the piezo decreases initially with increasing frequency (Z - llwC where C -
100 nFl, the larger currents necessary
to maintain this applied voltage might lead to overheating of the stack at
higher frequencies. In any case, a high power
function generator would be necessary for operation at higher frequencies.
Driving the piezos at their resonance
frequency, however, proved to be a method for circumventing these problems.
The electrical behavior of the unmounted piezo was tested by measuring its
impedance as a function of
frequency (see Figure 61. At frequencies well below resonance, the piezo
behaves like a capacitor, with the impedance
inversely proportional to the frequency and the voltage lagging the current by
approximately 90 degrees. At 255 kHz
the unmounted piezo experiences a minimum in impedance, and voltage and
current are in phase. This frequency is
commonly referred to as the electrical resonance frequency of the piezo. At
330 kHz a maximum in impedance occurs,
and again voltage and current are in phase -- the electrical antiresonance
frequency of the piezo. Between resonance
and antiresonance the impedance increases with frequency, while the voltage
leads the current by about 90 degrees.
At frequencies higher than the antiresonance, the piezo again shows a
capacitor-like behavior.
Several unmounted piezos of the same model were tested, and their electrical
characteristics were found to
be consistent within a few percent. These measurements were repeated for a
different brand of piezo stack with
slightly larger dimensions (3.5 mm x 3.5 mm x 9 mm, from Piezomechanik,
Munich, Germanyl. The same type of
behavior was observed, with the impedance minimum and maximum occurring at 153
kHz and at 191 kHz,
respectively, hence at lower frequencies than for the smaller NEC piezos.
In order to use the piezo stack for phase modulation, a small, lightweight
mirror (1.5 mm x 1.5 mm, x 0.1
mm, from Edmund Scientific Co., Barrington, NJ) was attached to its face with
cyanoacrylate ("super glue"1. The piezo
stack with the attached mirror was either glued directly onto a standard
adjustable mirror mount ar glued onto a 25
mm diameter aluminum disk of 5 mm thickness, which was then held by a mirror
mount. Although gluing the
lightweight mirror to the piezo did not alter its electrical behavior,
attaching the stack to the aluminum disk or the
mirror mount significantly changed the piezo's electrical resonance
characteristics. Instead of the single electrical anti-
resonance of the unmounted piezo, several anti-resonances at frequencies both
lower and higher than the original one
appeared. Figure 6 also shows the impedance of the mounted piezo as a function
of the driving voltage frequency. This
piezo had been glued to an aluminum disk with an epoxy intended for fiber
optic connectors (F 120, from Thorlabs Inc.,
Newton, NJI.
3. Mechanical behavior of the piezo-mirror in a Michelson interferometer. The
mechanical behavior of
the piezo-mirror was tested in one arm of a Michelson interferometer with a
helium-neon laser (633 nm) as a light
source. In the measurements with the mounted piezo, it was observed that the
frequencies of maximum piezo
displacement are those of maximum impedance. The mechanical resonance of the
piezo is thus coincident with its
electrical anti-resonance. In the following, those frequencies are referred to
as resonances for which the piezo
experiences a maximum in displacement. Figure 7 shows the displacement of the
piezo per volt applied at each of the
resonance frequencies. For a particular resonance frequency, the piezo
displacement was observed to increase linearly
13-
CA 02361195 2001-07-17
WO 00/45153 PCT/US00/02313
with increasing driving voltage amplitude. However, the displacement per volt
varies for the different resonances of the
same piezo and decreases at higher frequencies. Although the displacement per
volt is higher at the 56 kHz resonance
by almost a factor of three, the piezo in the Michelson interferometer was
instead driven at the 125 kHz resonance
because of its higher frequency (see Section 5).
Both the positions of the resonances and the corresponding displacement
amplitudes were dependent on the
details of mounting the piezo in a way that could be understood at least
qualitatively. Attaching the stack with super
glue resulted in lower resonance frequencies and larger displacement
amplitudes than in the case where the softer
epoxy was used. This result is interpreted to mean that the very thin layer of
super glue between the piezo and the
mounting substrate forces the piezo to expand in the free direction only. This
results in a larger displacement of the
mirror than when a thicker layer of the more elastic epoxy is used, presumably
because the epoxy can be squeezed by
the expanding piezo. Also, if the piezo mounted with super glue expands
primarily in the free direction, its center of
mass translates, in contrast with the piezo in epoxy, which may expand and
contract about its center of mass. The
piezo mounted with super glue then has a greater effective mass as it
resonates, yielding lower resonance frequencies.
Similarly, the disk on which the piezo is mounted can play an important role
in determining the positions of
the resonance frequencies. The difference between epoxy-glued NEC piezos on 5-
and 10-mm thick aluminum disks,
both of 25 mm diameter, was examined. They exhibited essentially the same
resonance frequencies between 100 and
360 kHz, but the lowest resonance, which also has the largest displacement
amplitude, was shifted from 56.7 kHz for
the thinner to 85.6 kHz for the thicker aluminum disk. Plate theory predicts
that the resonance frequency of the lowest
(drumhead) mode for a 25-mm diameter, 5-mm thick aluminum disk should be
around 80 kHz and a factor of two higher
for the 10-mm. thick disk. The formula used is valid under the assumptions
that the disk is held rigidly at its periphery
and that the thickness of the disk is small compared to its diameter. Neither
of these assumptions is well fulfilled in
the present case. Further investigation using a finite element analysis
software package (SAP 2000 Nonlinear 116.15)
revealed that the resonance frequencies are very sensitive to the precise
mounting conditions, with the observed
frequencies roughly consistent with the three-point mounting technique
employed in these tests. Measurements with
two three-point mirror mounts of different masses yielded the same mechanical
resonances and piezo amplitudes.
These measurements and calculations support the conclusion that the lowest
frequency resonance for the stack-
epoxy-disk system is probably a fundamental vibration of the disk, while the
higher frequency resonances can be
attributed to the "piezo-in-epoxy" part of the system.
The results for resonance frequencies and displacement amplitudes for the same
brand of piezo and the same
mounting technique for the piezo did not differ by more than a few percent.
Operating the piezo-mirror system in the
OCM Michelson interferometer for hours at a time over the course of one year
has not caused a shift in the resonance
frequency or a change in the piezo displacement. Even after hours of
continuous operation, the stack does not heat up
noticeably, and the system maintains a high degree of stability. With a
driving voltage of 6.7 V peak-to-peak, the
described NEC piezo with superglue-mounted mirror, epoxy-mounted onto a 5 mm
thick aluminum. disk, provides a
-14-
CA 02361195 2001-07-17
WO 00/45153 PCT/US00/02313
displacement of around 400 nm at a resonance frequency of about 125 kHz,
making it ideally suited for phase
modulation in the OCM of the invention.
4. Calculations determining the optimum modulation amplitude. The
superluminescent diode (SLD)
light source in the tested OCM has a wavelength of 850 nm. Therefore, a piezo
displacement of 400 nm produces a
total pathlength difference between sample and reference arms in the OCM of
less than one wavelength (7~), i.e.,
modulation is over less than one fringe. For such small pathlength
modulations, the interferometer output fringe signal
will take on distinctly different shapes depending on the initial phase
relation between the sample an d reference
beams.
Figure 8 illustrates this point for a modulation of one-half fringe (piezo
displacement of 0.25 ~,). Graph (a) in
Figure 8 shows the piezo displacement which is simply of the form do sinwt,
where the peak-to-peak displacement 2-Oo
is taken to be 0.25 ~,. Theoretically, the interference term in the
corresponding interferometer output intensity is given
by:
lo~r = /ocos(a sin wt + ~)
where a is related to the piezo displacement amplitude by a = 4~do17~, and to
is equal to 2 sqrt(/re,/~",~~), where In, and
/,~",ph are the intensities returned from the reference and sample paths.
Graph (b) in Figure 8 plots /o~, for an initial
phase difference between the sample and reference beams of ~ = 0; Graph (c) is
a similar plot for ~ - ~c12. The two
signals are clearly different in shape and have different Fourier components,
including different DC components. In
Graph (b) the strongest component is the one at 2c~, the second harmonic of
the modulation frequency. In Graph (c) the
signal's dominant Fourier component is the one at w, the fundamental of the
driving frequency. By inspection of the
graphs, it also becomes clear that the rms values for the AC-coupled signals
are different. (The interferometer output
must be AC coupled in the OCM to eliminate the huge DC component /,e,)
Therefore random phase drifts between the
sample and reference beams will lead to drifts in the rms value of the AC
coupled interferometer output.
Calculating the Fourier components of the signal (1), the power P,, in the
fundamental frequency cu and the
power Pz in the second harmonic 2w can be expressed as:
P, = 2 /oz J,z(a) sinz ~ (2)
Pz - 2 /oz Jzz(a) cost ~ 13)
Thus the sum of the powers in the first two harmonics P, + Pz is independent
of ~ only for those piezo amplitudes for
which J,zla) - Jzzlal. The lowest value of a for which this occurs is a ~
2.63, leading to a piezo displacement 2-Do
of 0.4197 . At this particular modulation amplitude, the sum P, + Pz is
independent of drifts in the pathlength
difference between the two arms and is therefore a useful measure of the AC-
coupled interferometer output fringe
intensity.
Figure 9 shows the experimental values for the powers of the interferometer
output signal in the first two
harmonics as a function of the piezo driving voltage. For each setting of the
driving voltage, the powers at 122 kHz and
at 244 kHz were observed with a spectrum analyzer as they varied with the
drifting phase, and their maximum values
-15-
CA 02361195 2001-07-17
WO 00/45153 PCT/US00/02313
were plotted. The solid and dashed lines indicate the best fits to the
equations P, - k,J,z(r,x) and Pz - kz.lzz/rzx),
where k,, kz, r,, and rz are fitting parameters. As expected, the fitted
values of k, and kz were the same to within 19'0,
and the values of r,x and rzx at a piezo voltage of x - 5.95 Volts peak-to-
peak were within 19'0 of 2.63. At this point
the sum of powers P, + Pz was observed to be independent of phase drift.
5. Discussion. A high fringe frequency has been achieved by driving a piezo at
this same frequency and
using a piezo resonance to obtain a modulation amplitude of roughly one
fringe. It is also possible to achieve high fringe
frequencies by driving a piezo at low frequencies but with large displacement
amplitudes. By wrapping 100 m of fiber
around a piezo tube, Cruz et al. reached fringe frequencies of 1 GHz with a
peak-to-peak pathlength difference of 14
mm. In this case, phase drift ceases to be a problem because of the long train
of fringes before the phase break
associated with piezo reversal. However, the large interferometer path
differences inherent in this approach are
incompatible with the operation of the OCM of the invention.
The OCM of the invention collects three-dimensional images by performing a
series of fast two-dimensional
scans in planes normal to the incident beam and at regular depth intervals in
the sample. These two-dimensional "en
face" scans are performed at depths determined by the interferometer's equal
path length position in the sample.
Because the typical depth interval for the OCM is about 5 Nm, modulation in
the path length difference must be limited
to about 1 Nm during one of the en face scans. Larger modulations would
degrade the depth resolution of the OCM.
Hence a piezo stack driven at its resonance frequency has provided both a high
fringe frequency for fast OCM image
acquisition and a small modulation amplitude for good depth resolution.
6. Conclusion. A piezoelectric stack, when glued to an aluminum disk, displays
a number of mechanical
resonances between 50 and 350 kHz. The piezo is driven at its 125 kHz
resonance for fast phase modulation in a
Michelson interferometer. With a driving voltage amplitude of 6 V peak-to-
peak, a piezo displacement of about 360 nm
(0.42 ~,) is achieved. The long-term performance of the piezo under these
conditions is reliable; in particular, no heating
or other damage to the stack has been observed. The measured rms value of the
AC-coupled interferometer output
experiences large variations due to phase wander between the reference and
sample arms of the interferometer.
However, for a piezo displacement of 0.42 7~, the sum of the powers of the
first two harmonics of the driving
frequency provides a measure of the interferometer output that is independent
of phase drifts.
B. Modifications to the basic OCM design to enhance speed of image capture.
A modified OCM was constructed that is capable of collecting a million-voxel
image in less than a minute. An
optical schematic of the instrument appears as Figure 10. The key changes in
design from the original OCM involve the
introduction of galvo-scanning mirrors for the x-y scans and the use of a
piezo-mounted mirror for the production of
interferometer fringes.
1. Galvo-Scanning Mirrors. A pair of orthogonal galvoscanners (Model 6800-XY,
Cambridge Technology Inc.)
deflects the collimated beam emerging from the sample fiber and varies its
angle of incidence upon the focusing lens,
thereby scanning the focused waist of the beam across the x-y plane in the
sample. The galvoscanners can be operated
at up to 1 kHz. The beam spends about 20 microseconds on a voxel, so a linear
scan along the x-axis of 100 voxels
-16-
CA 02361195 2001-07-17
WO 00/45153 PCT/US00/02313
takes 2 milliseconds. The fast x-axis galvo is operated at slightly less than
500 Hz. A million-voxel image could
therefore be taken in 20 seconds, though overhead in processing each x-y scan
and moving the DC motor actuators
along the z-axis increases the collection time to 40 to 60 seconds. The
galvoscanners were calibrated by imaging a
Ronchi ruling with a period of 20,um.
2. Generatin4 Fast Interferometer Fringe. The brightness of a voxel in an OCM
image is proportional to the
amplitude of the OCM interferometer fringes. At each voxel, the amplitude of
the fringes must be determined. The
modified OCM spends just 20 microseconds on a vaxel, so the frequency of the
fringes must be at least 50 kHz. To
achieve this frequency, a small reference mirror (l.5mm x l.5mm x 0.1 mm,
Edmund Scientific Co.) was glued to a
piezoelectric stack (AE0203-D04, Thorlabs) with a resonant frequency of 250
kHz. When the mirror and stack were
epoxied to an aluminum disk (diameter = 25mm, thickness = 5mm), the resonant
frequency split into a number of
resonances, a strong one being at 120 kHz. At this resonance, a driving
voltage of 6 volts peak-to-peak is sufficient to
displace the mirror by 0.42 x 850 nm a 357 nm (peak-to-peakl. This
modification is reviewed in more detail in
Example IA, above.
The mirrorlpiezoelectric stack forms the rear end of the retroreflector in the
reference arm of the OCM
interferometer. As the mirror is oscillated piezoelectrically at 120 kHz, the
path length difference in the interferometer
varies and 120 kHz fringes appear at the output. The fringes are isolated with
a narrow bandwidth electrical filter, and
the output is then sent to an rms circuit. A commercially available integrated
circuit is the AD63 7 (Analog Devices)
that measures the amplitude of the fringes to better than 10% in approximately
two periods of the fringe signal. Twa
periods at 120 kHz amount to 17 microseconds, so the beam spends 20
microseconds on each voxel.
3. Elimination of interferometer phase noise. Like all Michelson
interferometers, the path length difference
between the sample and reference arms of the OCM drifts slowly by roughly a
half-wavelength lone fringe) due to air
currents, temperature effects, etc. This phase drift causes the fringe signal
to shift power from the fundamental
piezoelectric driving frequency (120 kHz) to higher harmonics and to a DC
offset. As a result, the output of the rms
circuit may vary by 30 to 50% even when the scattering power of the voxel
remains constant. This problem is solved
by constructing the electrical filter to pass the fundamental and first
harmonic frequencies. In addition, using a
sinusoidal driving voltage for the piezo stack, the amplitude of motion of the
reference mirror is adjusted to 0.42 x 850
nm ~ 357 nm (peak-to-peakl. At this amplitude the output of the rms circuit is
independent of the phase drift in the
OCM interferometer. This is a useful result for reducing noise in an OCM
image.
4. Elimination of birefringence drift. The design of the modified OCM has
another notable advantage over
that of the original OCM. In the original OCM, about 10m of optical fiber was
wrapped under tension around a
piezoelectric cylinder. A driving voltage was applied to the cylinder,
stretching and contracting the fiber, and causing
the optical path length of the fiber to oscillate. A fiberlcylinder system was
inserted into each of the sample and
reference arms of the OCM interferometer. These two piezoelectric cylinders
were driven 180° out of phase to produce
fringes at the output of the OCM interferometer. The stretching of these long
lengths of fiber led to noticeable stress
birefringence, and "paddles" were incorporated to twist the fiber
systematically until the optical path lengths for the
-17-
CA 02361195 2001-07-17
WO 00/45153 PCT/US00/02313
two polarization states of the beam were equal. The setting of the paddles was
subject to drift, leading to distorted
visibility curves of the interferometer fringes.
In the modified OCM, the lengths of the optical fiber in the sample and
reference arms are just 1 meter. No
stretching of the fiber occurs, and no distortion of the Gaussian visibility
curve over time has been noted.
Example II - Software for Viewing 3-D OCM Images
Three-dimensional OCM images can be generated by adapting available
visualization software, such as, for
example, AVS (Advanced Visual Systemsl Version 5.0 to display 3-D OCM images
on Unix workstations. For greater
convenience VISUALIZATION EXPRESS, also by AVS does not require a Unix
workstation. VISUALIZATION EXPRESS
is written in OpenGL, which allows graphics applications to be ported to many
softwarelhardware platforms. This
software was adapted to create a custom graphical user interface called
"Intuitive Network" within Visualization
Express and achieved increased flexibility and power. The following is a brief
description of the fundamental principles
of this image-display software package.
Principles of Volume-Rendering. During image acquisition, the OCM assigns a
single number to each of the
roughly one million voxels scanned in the sample volume. To first
approximation, this number is a measure of the light
scattering power of the associated voxel. To visualize one of these 3-D data
volumes, all voxels must be projected onto
a 2-D computer screen for viewing. The process of projecting voxels, including
assigning the relative weights of voxels
deep within the volume versus near the surface of the volume, is called volume
rendering.
The basic algorithm for volume rendering is ray tracing. Every pixel in the 2-
D image to be generated on the
computer screen determines a ray that is drawn from the pixel on the 2-D
screen through the 3-D data volume. A
"parallel projection" is employed, in which projected rays are parallel to
each other. All voxels in the volume along a ray
contribute to the value of the corresponding pixel on the 2-D computer screen.
Because a ray does not always go
through the centers of voxels that it intersects, there are different ways to
compute (or "blend"1 the contributions of
voxels along the ray. For example, one may consider alt voxels in the vicinity
of the ray and calculate the sum of their
voxel contents weighted inversely by their distances to the ray.
Alternatively, far simplicity and therefore reduced
computational cost, one may use only those voxels penetrated by the ray and
sum their voxel contents (unweightedl.
Another feature involved in the blending of voxels along a ray is the
"opacity" factor. The content of each
voxel is multiplied by the opacity factor as the sum is farmed along a given
ray. If the opacity factor for all voxels is
zero, no voxel contributes to a pixel, and the pixel is black. If the opacity
factor for all voxels is one, the voxel contents
are summed along the ray and the resulting pixel may contain a large number,
perhaps a number representing
saturation. Small values for the opacity factor tend to avoid saturation and
allow voxels deep in the image volume to
contribute meaningfully to the corresponding pixel. That is, small values of
the opacity factor tend to impart a more
"transparent" appearance to the image volume.
Use of False Color. The OCM of the invention assigns a raw number (grey level)
to a voxel based upon its
measured light scattering power. AVS VISUALIZATION EXPRESS uses false color to
help distinguish different grey
18-
CA 02361195 2001-07-17
WO 00/45153 PCT/US00/02313
levels in the raw voxel contents. Two different ways were used for
implementing false color in the volume-rendering
algorithms available in AIIS Express. The simpler way, named "SFP", is to
apply the ray-tracing algorithm for volume
rendering (described above) to the raw greyscale contents of voxels. The
resulting 2-D greyscale pixels are then color
coded, e.g., weak pixels are assigned the color blue and strong pixels are
colored red. However, in this method a
particular region of the 3-D volume may change color drastically as the volume
is viewed from different vantage points.
For example, two green voxels can be superposed along a particular line of
sight to yield a red pixel.
More preferred is a second method of implementing false color in AUS Express.
In the volume-rendering
method named "DC", the raw contents of voxels are color coded, i.e., values
for red, green, and blue are assigned to
each voxel based upon the voxel's raw grey level. Then the ray tracing
algorithm for volume rendering is executed
separately for all three colors to generate a colored 2-D image on the
computer screen. This DC method does indeed
superpose two green voxels to yield a strong green pixel. In this way, a
region of the image volume with a particular
light- scattering strength will retain its color, at least approximately, as
the volume is rotated on the screen.
The software allows anatomical, morphological and histological aspects of
plants, frogs, and other
organisms to be examined. Examples of AIIS software settings are as follows:
Ray Tracing Algorithm: Direct Composite
Interpolation: trilinear
Control Points
Control Point 1 position: 2
Control Point 2 position 23
Range 1 settings:
Transparency Left = 1.0
Hue = 0
Saturation - 0
Value = 0
Transparency Right = 1.0
Hue - 0.66
Saturation = 1.0
Value g 1.0
Range 2 settings:
Transparency Left = 0.91
Hue a 0.66
Saturation = 1.0
Value = 1.0
Transparency Right = 0.95
Hue = 0
-19-
CA 02361195 2001-07-17
WO 00/45153 PCT/US00/02313
Saturation - 1.0
Value - 1.0
Range 3 settings:
Transparency Left - 0.69
Hue - 0
Saturation a 1.0
Value - 1.0
Transparency Right = 1.0
Hue-0
Saturation - 1.0
Value = 1.0
Example III - Developmental biology of the plant Arabidnpsis thaiiana
A. To study meristem formation in the developing embryo, plants were grown in
four-inch pots in soil in a
growth chamber under 16-hour day lengths, to accelerate the transition to
reproductive growth. During flower
formation, Arabidapsis internodes elongate extensively. Thus a single silique,
with its developing embryos inside, was
easily placed between two glass microscope slides without disturbing the rest
of the plant or removing the silique from
the plant. The silique was mounted shortly after fertilization to follow the
development of the embryos over the course
of the few days (from a globular embryo to a fully expanded embryo). The OCM
images allowed precise observation of
development of a single embryo over time. The pattern of development in wild-
type embryos was compared with those
of mutant embryos to gain better insights into the altered embryogenic
patterns.
B. The OCM was also used to study the temporal changes in the shoot apical
meristem and shoot apex
during successive leaf initiations. For these observations, the plants were
grown in four~inch pots in soil under an 8-
hour day length to inhibit the transition from vegetative to reproductive
development. These growth conditions
permitted observation of meristem activity over many consecutive leaf
initiation events. As humidity variations
appeared to have significant effects on plant growth rates, it is preferable
to maintain the plants in a humidity-
controlled growth chamber. In addition to allowing precise regulation of the
environment in which the plants grow,
such a chamber allows growth of populations of plants under long-day
conditions (for studies on embryo formation)
and short day conditions (for studies on phyllotaxy) at the same time.
In this procedure, the volume and shape of the shoot apical meristem and shoot
apex over the course of
several days was observed. The meristem and shoot apex were examined from
above to ensure that each leaf, no
matter where it initiated, was imaged with equal fidelity. By this approach,
insights are gained into the changes in the
shoot apex and shoot apical meristem as it undergoes developmental changes,
such as forming successive leaves, and
the processes of mutants may be characterized in comparison to wild-type
plants.
20-
CA 02361195 2001-07-17
WO 00/45153 PCT/US00/02313
C. Studies of Plant Ima4es. An image of a plant shoot (Arabidopsis thalianal
was obtained using the OCM of
the invention. The volume of the image is 600Nm x 600,um x 400Nm (width x
width x depth) with a voxel size of
(10/rm)'. In a top view straight down along the beam and along the shoot axis,
the petioles of the cotyledons and
leaves 1 and 2 were visible growing out from the center of the plant shoot.
The shoot apical meristem was evident
when the image was cropped as a highly scattering region at the base of the
leaves. The gl 1 (glabrous) mutant of
Arabidopsis thaiiana was used to avoid high light scatter from trichomes.
A rotated image of the leaf and meristem region was visualized, having a
volume of (200,um x 200,um x
120Nm) (width x width x depth) with a voxel size of (2,um13. As a side view,
with the beam incident from the top of
the figure, the leaves were seen growing out from the center of the shoot. The
meristem and shoot apex were evident
at the base of the leaves.
Several images in a series were taken for each of ten Arabidopsis seedlings
during days 5 through 12 of
development when leaf primordia were formed and a spiral pattern of leaves
emerged. In these images it was possible
to identify the shoot apical meristem andlor associated leaf primordia,
supporting the conclusion that OCM can follow
non-invasively the morphological development of a single plant. The images may
indicate that the regions of highest
light scattering correspond to areas of highest cellular activity. Leaf
primordia and the presumed shoot apical meristem
scatter highly, and are sites of rapid cell division. Accordingly, high
cellular activity may serve as an intrinsic probe for
OCM.
In an OCM image of a 5-day-old Arabidopsis plant, the "opacity" parameter (see
Example III on the image-
rendering software) was adjusted so that opacity was high. With this setting,
weakly scattering tissues (blue)
surrounding strongly scattering tissues (redlyellow) hid the strongly
scattering regions from view. The overall effect
was that the "outside" of the plant was visible, as in a scanning electron
micrograph. By cropping or slicing into the
image plane of the strongly scattering tissue, the redlyellow was exposed.
In another OCM image of the same 5-day-old plant, the opacity parameter was
adjusted low so that voxels
deep in the tissue could be seen. Using these procedures, it was possible to
unambiguously identify many of the larger
( > 30 Nm) organs at the shoot apex. Identifying the smaller leaf primordia
was more difficult. To unambiguously
identify the smaller organs, frequent observations were made, e.g., every hour
or two, to observe their increase in size
during development. All images were acquired with the original OCM which
requires 3 hours for a million-voxel image.
Therefore a single image averages over significant growth, and this averaging
is probably a factor in the resolution of
the image. The modified OCM has an image acquisition time of 5 minutes or less
for similar images. Use of the
modified OCM would produced a series of images more closely spaced in time,
and allowed identification of leaf
primordia as they emerged from the meristem.
In a side-by-side comparison of an OCM image of a living plant with a
histological section of a different plant,
the OCM image included leaves and a small, strongly scattering region that was
consistent with a leaf primordium. The
histological section of a comparable plant supported this interpretation. The
OCM image was cropped from the top and
was an "outside" image (high opacityl, so that the meristem below was not
visible. In following the development of an
-21-
CA 02361195 2001-07-17
WO 00/45153 PCT/US00/02313
individual plant, it is helpful to detect an emerging leaf primordium as early
as possible. While the resolution of the
histolegical slide was clearly superior, only the OCM images were able to
follow the subsequent development of the
emerging leaf primordium.
In direct comparison of OCM and traditional sections, plants were imaged with
OCM and fixed for traditional
analysis. The OCM image showed leaf primordia and cotyledon petioles. The
amount of light scatter was proportional
to the color. A simple spectrum was set up such that red was the highest
amount of light scatter, orange-yellow was
less, green less, blue-black least. Cells and tissues that were active (e.g.,
transcription and differentiation) produced
the greatest amount of light scatter.
In optical sections and traditional plastic sections deeper in a plant, an OCM
image of deeply buried tissue
was visualized. The leaf primordia were seen and a recently formed stipule was
also seen. Stipules, which are known
to be very active transcriptionally, produced a large amount of backscattered
light in OCM, and hence appeared as red
on the OCM image.
In OCM and traditional section of developing organs and the apical meristem,
one leaf primordium was seen
as just adopting a dorsoventral symmetry whereas a less mature leaf primordium
was seen as not being dorsoventral,
still retaining centric features. Thus, OCM can detect these differences. The
more advanced leaf primordium appeared
as a red, rectangular-shape and the less advanced leaf primordium appeared as
a red, round-shape. The meristem,
detectable in a plastic section in a different focal plane also appeared as a
red rectangular shaped object. Thus. OCM
can follow and predict developmental changes taking place deep within tissues
in vivo in a non-destructive manner.
A comparison was conducted of OCM and scanning electron micrography of an
Arabidopsis mutant,
shootmeristemless. The shootmeristemiess mutant is known to lack a shoot
apical meristem (Barton and Poethig,
1993). In wildtype plants, the apical meristem appeared as a red, highly light
scattering structure. As predicted, in the
shootmeristemiess mutant there was no such structure. Instead a gap indicating
a lack of a shoot apical meristem
was detected.
Thus, the OCM can be used, not only to visualize structures in a biological
sample, but also to visualize
developmental stages, processes, and events, to contrast mutants with non-
mutants or to grade mutant or allelic
series, and the like. The effect of a variety of factors on light scattering
can also be used to characterize biological
samples with respect to such factors, including, for example, gene activity,
differentiation, cell elongation, cell
dormancy, stress response, pathogen response, and the like. Uses of light
scattering comparisons employing the OCM
of the invention will be evident to those engaged in such comparisons, for
correlating light scattering or other OCM
image characteristics with a variety of conditions, structures, and events of
interest.
Example IV - Developmental biology of the frog Xenopus laevis
A. Xenopus embryos are mounted in a small, triangular well cut in a layer in
the bottom of a petri dish
coated with silicone rubber. A 100 Nm thick sheet of gelled agarose is placed
over the top of the embryo and secured
in place with thin cactus spines stuck into the silicone rubber. This method
of stabilizing the embryo keeps the embryo
-22-
CA 02361195 2001-07-17
WO 00/45153 PCT/US00/02313
in a defined position and orientation, without the danger of distorting the
cell movements under study. During
gastrulation, a set of three-dimensional images through the thickness of the
animal pole of the embryo is collected.
These three-dimensional data sets are processed and rendered into a time-lapse
movie. As the resolution of the OCM is
smaller than the single cells, these images are adequate to follow the tissue
movements of gastrulation. Alternatively,
two-dimensional images may be collected, in the plane bisecting the embryo
along its midline. This offers rapid frame
rates, and therefore better details on the cell movements within this reduced
field of view.
B. Additionally, the OCM system is used to examine the morphological
patterning of the mesoderm after it
involutes. This process is critical for the resulting structures, such as the
notochord and the somites, as well as for the
nervous system. Interactions between the notochord and the spinal card affect
the dorsoventral patterning of the
nervous system, and interactions with the somites result in segmentation of
the sensory nervous system and the
ventral roots of the motoneuron axons formed by the spinal cord. The
experimental arrangement described above is
used to stabilize the embryos, and the OCM is employed to collect images
needed for 2- and 3-dimensional time-lapse
movies.
C. Studies of Fro4 Embryo Ima4es. An image was taken of a frog embryo that was
lightly fixed 129'0
paraformaldehyde overnight at 4°C in stage 41 of developmentl. The head
region that was imaged was (l.6mm x
l.6mm x l.3mm) (width x width x depth). The voxel size was (20 Nml3. In the
figure the embryo (tadpole) was on its
right side and was viewed along a body axis from tail to head, so that the
ventral-dorsal axis pointed left to right. The
beam was incident from the top of the image. The bulge of the left eye was
clearly evident at the top of the image.
Red and yellow areas denoted highly scattering regions, and blue and black
denoted more transparent regions.
Another image of the same frog embryo was taken, but at slightly higher
magnification. The volume imaged
was (600,um x 600Nm x 420Nm) (width x width x depth), and the voxel size was
(6,um13. The beam was still incident
upon the embryo's left side from the top of the image. The view was again
along the body axis, but looking toward the
tail, so the dorsal side was on the left and the ventral side was on the
right. The 600Nm long segment that was
imaged was further down the body from the head. The 420Nm depth was oriented
top-bottom in the figure, and the
600Nm dorsal-ventral width lay left-right. The 3-D image was been carefully
rotated so that the view was straight
down the axis of the spinal cord--a rotation of just one degree about the beam
axis (top-bottom axis) would obscure the
structure that was obvious at the selected viewing angle.
23-
i. __.___
))none
-10 0.~.~001, - - -'..'-' - - -... - pG~~US00/0~3'I 3: -. -. - -"~ PC~'.~t~
°~',
~., w~.~aa...,zt~aau':..'::~w .L.,Fc°,.,acs.~r~ s*_._ _;.,... . _._ .
.,..~.s~...~s~....~-
CA 02361195 2001-07-17
R~FERfHCES CITED
Barnoski. M.K, and 8.M. Jenaen, "Fiber wavepuides: a novel technique for
imastigating attenuation
characteristics," Appl. Opt 15: 2112 X1976).
Burton, M.K and R.S. Pos~ig, "Fatmation of the shoot apical me~~stem in
Ara~dopsls thsGana: an analysis of
development in the wild type and in the shoot meristavoless mutant.°
Development 119: 823-831
(1993). -
BoGn, F.P., L.E Preuss, R.C. Taylor, and R,J. Ferance, "Refractive lode: of
some mammalian tissues using a
fiber optic Cladding method," App/. 0pf. 28: 2297-2302 (1888).
Bouma, B., G.J. Teamey, S.A. Soppart, and M.R. Hea. °High~re:afution
optical eoherence tomographic imaging
using a mode-locked Tf:AkO~ laser source," Opx Lets 20: 7486-1488 )1995).
Cfivaz. 7C., F. Marquis-Wei6le, R.P. Salattre, R.P. Novek, and H.H. 6ilgen,
'High-resolution reflectometry in
biological tissues," Opt Lett.17: 4~6 (1992).
Denielson, B.L, and C.D. Whittenburg, 'Guided wave nfleetometry with
micrometer resolution; Appl Opt
26: 2836-2842 (1987).
Driver, L, J.W. Feather, P.>t. lGng, and JJ3. Dawson, "Thn optical properties
of aqueous suspensions of
Intralipid, a fat emulsion,° Phys. Mad BiaL 34;1927_1830 (1988).
Fercher, A.F.. K. Mengedaht, and W. Werner, "Eye-length measurernerrt by
interferomatry with partially
coherent light." Opt. tert. 13:186~188 (1988).
Frock. S.T., B.C. Wilson, and M.S, Patteraon, 'Total attenuation coefficients
and scattering phase functions
of tissues and phantom materials at 633 nm," Med. Phys.14: 835.84111987).
Flock. S.T., 5.t_ Jacquas, B.C. Wllson, W.M. Stet, and M.J.C. van Gemert,
'Optical properties of lntraGpid: a
phantom medium for light propagation studies," Lasers SrrrB Meo'. 12 510-519
(1992).
Green, P.B., "Connecting genes and hormone action to form, pattern and
organogenesis: biophysical
transductions; JournalofExperimerrtalBotarry45:1775-1788(1894).
Hee, M.R., D. Huang, EA. Swanson, and J.G. Fujrcnoto, "Polarizatiomsensitive
low-coherence reflectometer
for biref~~ngence characterization and ranging," J. Opt. Soe. Amen B 9:
903.908 ti 992).
Hee, M.R., J.A. Izatt, D. Huang, E.A. -Swansan, C.P. Lin, J.S. Schuman, C.
Puliaf'rco, and J.G. Fujimoto,
°Micron-resolution optical coherence tomography of the human eye,"
p.235-238, in Advances in
Dpticsllmaging andPhoton Migration, edited by R.R. Alfano (Opt Soc. Amer.,
Washington,1994).
Helm, R, and R.Y. Tsien, 'Engineering green fluorescem protein for improved
brightness, longer wavelengths
and fluorescence resonance energy transfer," CotrentB'rola~qy 6:178 (1998).
Hernandez, LF. and P.B. Green, ?ransductions for the expression of structural
pattern: analysis fi
sunflower; Plant CeilS:1725.1738 (1993).
Hitzenberger, C.K., "Optical measurement of the axial eye length by Laser
Doppler interferometry," Invest.
Ophthaimol. ~s Sci. 32 616-624 (1997).
24 yMfN~~D ~SHEE~
-~~- -. ~JUUO
1~'3 fl~ 2(30 :w - - - --- - - ,F'~~IUSQOhD23~~3 ~PCT2
~.u._~~.~.~aj~~s.F.n~.;,;s...'.sas~~.,:~i~.»..~b.._.;. ~~":it:u:- ~ ."°
CA 02361195 2001-07-17
Huang. D., EA. Swanson, CJ'. Lira, J.S. Schumen, W.6. Stinaon, W. Chang. M.R.
Hee, T. Flotte. K. Gregory,
C.A. Pul(afrto, and J.6. funmoto, "Dptical coherence tomography," Science 254:
1178~11 B1
(1991 a).
Nueng, D., J. Wang, C.P. lira. C.A. Pufiaafito, and J.G. Fujimoto,
"Miaon~resohrtion ranging of cornea anterior
chamber by optical reflectometty." lasers Sure. pled.11: 419.425 (1991 b).
I=att, J.A., M.R. Nee, O.M. Owen, E.A. Swanaon, and J.6. Wjmurto, "Optical
coherence rniaoscapy in
scattering media." Opt, lent 19: 590-fi9Z (1994a).
Itatt, J.A., M.R. Hee, G. Teamay, G.M. Owen, E Swanson, and J.G. Fuj)mato,
'Optical coherence
microscopy; p.249-252, in Advances in Optical !meg~p and Photon Migration,
edited by R.R.
Atfano (Opt. 5oc. AmEt , Washington,1994b).
Jacobs, R.E., and S.E. Frssar, "Magnetic resonance microscopy of embryonic
rail Gneages and mavertmnts,"
Seance 263: 681-684 (1994).
t~
Keller. R.E., 'The cellular basis of amphibian gasuntation," in Der~Nbpmsntal
Binlagy. A comprehensive
synthesis: Yolrrme 2. The ceNrdar baair of morphapeossis, edited by.L. Browder
(Pleetum Press, New
York,1986).
Kobayashi, M., H. Hanafusa, K. Tekada, and J. Node, "Pular~ationindopendent
interFerocnattic optical-limo-
domain refiectometer," l.EE.E J. Lrghtsvave ferhnol 9: 623-828 (1991).
Laskawski, M.J., M.E. Williams, H.C. Nusbaum, and l.M. Sussex, 'Formation of
lateral root rr~ cisterns is a
two-stage process; DaveJopment 121: 33033310 (1995).
Mayer. U., R.A. Tortes Rue, T. Berleth, S. Misers, and G. Jargens, "Mutations
effecting body organisation in
the Arabfdopsis embryo,' Nature 353: 402~407 (1991).
D'Rourke, N.A., H.T. Cfme, and S.E Fraser, "Rapid remodeling of retinal arbors
in dte tectum with and
without blockade of synaptic transmission," Neuron 12 921-934 (1994).
Potter, S.M., C: M. Warty. P.A. 6arrhy, and 5.E Fraser, 'Intravital imaging of
6FP usurg two-photon laser-
scanning microscopy; Gene (1996, in press).
Schmitt, J.M., A. Knuttel, and R.F. Banner. "Measurement of optical properties
of biological tisanes by low~
coherenrs; reftectometry,"App/. Opt. 32 6D32~604.2 (19931.
Schmitt, J.M.. A_ Knuttel, and R,F. Bonnet, "Low coherence interferometry for
imaging microstructures within
optically turbid tissues," p.253-25B, in lidvantes in Opticellrrraging and
Photon M'~gration, edited by
ft.R. Atfano (Opt. Soc. Amer., Washington,1984a).
Schmitt, J.M., A. Knuttei, and M. Yadlowsky. 'Confocal microscopy in turbid
media," J. Opf. Soc. Am. A 11:
2226-2235 (1894b).
Schrnitt. J.M.,. A. Knuttei, M. Yadlowsky, and M.A. Eckhaus, 'Optical-
coherence tornographp of a dense
tissue: statistics of attenuation and backacattering; Phys Med B'ro~ 39:1705-
1720 (1994c).
3 5 Schmitt, J.M., M. Yadiowsky, end R.F. Bonnet, "Subsurface imaging of
frying skin wig optical coherence
microscopy," Dermatology 191: 93 (1995).
ZS ~~ENL1~~ '~~"~~
'1~~04.~00'~; PCT1USOD/D231 ~ =PhT~2L ~ ~~
.~,ax::.....','.ia.-~::~- eas. e.......w...:y.:z_..ax.,.::~.....at.~._:.,
s:,~.rr.<...~.::' '
- CA 02361195 2001-07-17
Smith. L.G. and S. Hake, °The initiation and determination of leaves,"
Plant CeI/4:1017-1027 (1992).
Snow, M. end R. Snow. "A theory of the regulation of phyUotaxis based on
Lrrpa~ns albus," PhrZ Frrsn~ tL
Sor. load. Sor. B 244: 488-b14 (19621.
van Staveren, H.J., C.J.M. Moss. J. van Marie. S.A. Prahi, am! M.J.C. van
Gemect, "Light scattering in
fntrat'~pid~1D% in the wavelength range of 4001100 mn,"~,vpl. Opx
30:4507.4.514 (19911.
Steeves. T.A, and LM. Sussex. Pattsms br Pert Dave~Pment, 2nd Edition
(Cambridge U. Press. New York,
19891.
Swansan, i:.A., D. Huang, M.R. Nee, J.G. Fuj~moto, C.P. Lu>< and C.A.
Puliafrto, "High~spaed optical coherence
domain reflectometry," Opt Latt 17:151 ~153 (19921.
5wanson, E.A., J.A. lzatt. M.R. Hee, D. Huang, C.P. Lin, J.S. Schumen, C.A.
PuGafrto, and J.G. Fu~imoto, 'In
rirro retinal imaging by optical coherence tomography." Opt Lea"r~ 1 8:1864-
1866119931.
Takada. K., I. Yokohama, K. Chida, end J. Node, "New measurement system far
fault location in optical
waveguide devices based on an interfarometric tech~que," Appl. OpL 26:1603-
1806119871.
Wang, X.J., s.E. Milner, J.S. Nelson, R.P. Ohond, W.lf. Sorin. and S.A.
Neurton, 'Characterization of human
scalp hairs by optical low coherence reflectometty," Opticsletters 20: 624
(1995).
Wlfiams, M.E. and 1.M. Sussex, "Developmental regulation of ribosome! protein
! 16 genes in Arrbidopsis
thsb'ana," PMnr J. 8: 65~76 h 5951.
Youngquist, R.C., S. Carr. O.EN. Oavies, 'Optical cohenarce~domain
reflectometry: a new optical evaluation
technique." Opt Lei 12:158-16D (19871.
~.~~1L'~a ~a~=;~.
~ ~:~.~,~,a E_ r i
26