Note: Descriptions are shown in the official language in which they were submitted.
CA 02363566 2001-08-27
WO 00/52463 PCT/US00/05364
METHOD OF DIAGNOSING AND MONITORING
MALIGNANT BREAST CARCINOMAS
Background of the Invention.
This inventi!~n relates generally to the use of salivary biomarkers to
diagnose
breast cancer and. more particularly, to diagnostically differentiate between
women with
carcinoma of the breast, women with benign tumors, and healthy controls.
Breast cancer is the second leading cause of death among women in the United
States. Approximately 1 woman in every 10 will develop breast cancer in her
lifetime.
Recent statistics estimate that 44,000 women will die of breast cancer, while
150,000
new female cases of breast cancer will be diagnosed in the next year.
It has been shown that screening for breast cancer can reduce breast cancer
mortality. Among women aged 50 and older, studies have demonstrated a 20% to
40%
reduction in breast cancer mortality for women screened by mammography and
clinical
breast examination. However, among women between 40 to 49 years of age, the
mortality rate is reduced only 13% to 23%. These results suggest that further
methods of
screening could potentially reduce the mortality in the younger age group of
women.
While physical examination and mammography are useful screening procedures
for the early detection of breast cancer, they can produce a substantial
percentage of false
positive and false negative results especially in women with dense parenchyma)
breast
tissue. For example, the probability of having a false negative mammographic
examination is 20% to 25% among women between 40 to 49 years of age and 10%
among women 50 to 69 years of age. Consequently, screening will result in a
number of
negative biopsy results yielding a high percentage of false positives. There
is also a
demonstrated lack of sensitivity in detecting cancerous lesions in younger
women
yielding a significant percentage of false negatives.
There has also been a clear need for added modalities of screening to help
diagnose cancer in younger women. Increased technology in the field of
mammography
has allowed more reliable detection of small lesions of the breast; while,
researchers in
the field of breast cancer continue to seek additional adjunct diagnostic
procedures to
further enhance cancer screening and, thereby, to reduce mortality rates.
CA 02363566 2001-08-27
WO 00/52463 PCT/US00/05364
During the past three decades, cancer researchers have made extensive use of
immunohistochemistry to detect expression of specific biomarkers that may be
used as
adjunct diagnostic procedures in the diagnosis of certain tumors. (Grizzle WE.
Biomarkers-The New Frontier in the Pathology of Invasive and Preinvasive
Neoplasias.
Biotechnic and Histochemistry, 72(2):59-61, 1997;
Grizzle WE, Myers RB, Manne U. The Use of Biomarker Expression to Characterize
Neoplastic Processes. Biotechnic and Histochemistry, 72(2):96-104, 1997.)
Tumor
markers such as c-erbB-2 (erb) and Cathespin-D (CD) have been assayed in
tissue and
shown to correlate with aggressive lesions. The majority of the investigations
performed
have used these markers in tissues and serum.
With respect to specific cancer antigens in saliva, Chien found that saliva
contained CA 125, a glycoprotein complex that is a recognized or accepted
tumor marker
for epithelial ovarian cancer. (Chien DX, Schwartz PE, CA 125 Assays for
Detecting
Malignant Ovarian Tumors. Obstetrics and Gynecology, 75(4):701-704, 1990.) In
comparing salivary CA 125 concentrations among healthy controls, women with
benign
lesions, and those with ovarian cancer, Chien found a significantly elevated
CA 125
concentration among the ovarian cancer group as compared to the nonmalignant
controls.
Boyle detected and identified tumor-specific mutations using radio-labeled
oligonucleotide in preoperative salivary samples of individuals suffering from
head and
neck squamous cell carcinoma. These findings were demonstrative in 71% of the
patients studied. ( Boyle JO, Mao L, Brennan JA, Koch WM, Eisele DW, Saunders
JR,
Sidransky D. Gene Mutations in Saliva as Molecular Markers for Head and Neck
Squamous Cell Carcinomas. Am J Surgery, 168(5):429-32, 1994.)
Summary of the Invention.
However, such antigens are not diagnostic for breast cancer, and the
aforementioned tumor biomarkers (e.g., CA 125, erb and CD) have not been
tested for
their presence in saliva. While the diagnostic methods of the prior art have
generally
progressed, such innovations have not been extended to all areas of diagnosis.
There is a
need for a method to more fully utilize recent technological advances and
apply them to
the detection and treatment of breast carcinomas.
2
CA 02363566 2001-08-27
WO 00/52463 PCT/US00/05364
Accordingly, it is an object of the present invention to use saliva as a
diagnostic
medium and/or as part of a non-invasive protocol for the detection and
differential
diagnosis of breast carcinomas, thereby overcoming various deficiencies and
shortcomings of the prior art. including those outlined above.
It can be another object of the present invention to identify one or more
biomarkers present in saliva, as having diagnostic value and/or as can be used
in post-
treatment monitoring or therapy. Likewise. it can be another object to provide
one or
more biomarkers as part of a diagnostic panel for the initial detection,
follow-up
screening for detection, reoccurrence of breast cancer in women. response to
chemotherapy and/or surgical treatment of the disease state.
It can also be an object of the present invention to determine one or more
appropriate concentration cut-off values for biomarkers diagnostic for the
initial
detection, follow-up screening for detection, recurrence of breast cancer in
women,
chemotherapeutic response and/or surgical treatment of the disease state.
It can be another object of the present invention to provide a method of using
serum and salivary cut-off concentrations for diagnostic biomarkers to compare
detection
rates and/or sensitivities. Likewise, it can also be an object of the present
invention to
provide a method of using receiver operator curves and related analyses to
determine cut-
off concentrations for a variety of salivary biomarkers having diagnostic
value in the
detection and/or treatment of breast carcinomas.
It can also be an object of the present invention to use saliva as a medium to
determine nodal status of a patient diagnosed with a breast carcinoma.
Likewise, it can
be a further object of this invention to identify one or more biomarkers
present in saliva
in the determination of nodal status.
It can also be an object of the present invention to use saliva to determine
the
receptor status of a biomarker present therein, as part of a differential
diagnosis of breast
carcinoma. Likewise, the present invention can also include a method of using
receptor
status of a biomarker present in saliva as an indication of tumor
aggressiveness.
It would be understood by those skilled in the art that one or more aspects of
this
invention can meet certain objectives, while one or more other aspects can
meet certain
CA 02363566 2001-08-27
WO 00/52463 PCT/US00/05364
other objectives. Each objective may not apply equally, in all instances, to
every aspect
of the present invention. As such, these objectives- -in light of the prior
art regarding
diagnosis of breast cancer- -can be viewed in the alternative with respect to
any one
aspect of the present invention.
Other objects, features, benefits and advantages of the present invention will
be
apparent from this summary and the following inventive examples, and will be
readily
apparent to those skilled in the art having knowledge of the nature and
detection of
cancer biomarkers and their use in the diagnosis of corresponding disease
states. Such
objects, features, benefits and advantages will be apparent from the above as
taken in
conjuncnon with the accompanying examples. tables. data and all reasonable
inferences
to be drawn therefrom.
In part. the present invention is a method of using a salivary biomarker to
differentially diagnose and/or detect reoccurrence of breast carcinoma. The
method
includes ( I ) using a human saliva specimen to provide a salivary biomarker
for that
individual and diagnostic for carcinoma of the breast, (2) comparing the
individual
biomarker with a biomarker reference, and (3) differentially identifying the
diagnosis for
the individual as indicated by the biomarker comparison. The biomarker
reference can
be made up of a panel of constituents and can be developed using malignant
tumor,
benign tumor and control group populations. Each referenced biomarker
constituent can
have associated with it a range of values comparable to a corresponding
individual
biomarker.
In preferred embodiments, the individual biomarker is one constituent of a
biomarker panel, and the reference panel includes one or more biomarkers
identified as
having diagnostic value. Such biomarkers can include cancer antigen 15-3,
tumor
suppressor oncogene protein 53 and oncogene c-erbB-2. In highly preferred
embodiments of the inventive method. the presence of oncogene c-erbB-2 and/or
an
increased expression of protein identifies an individual as having a malignant
carcinoma.
Each individual biomarker constituent can be associated with a concentration
value, for comparison with a corresponding reference constituent. In one
embodiment of
the present invention, the concentration of cancer antigen 15-3 for an
individual having a
CA 02363566 2001-08-27
WO 00/52463 PCT/US00/05364
malignant breast tumor is at least about 100 percent higher than such a
concentration for
an individual having a benign tumor. Likewise, in a preferred methodology, the
concentration of oncogene protein 53 for an individual having a malignant
breast tumor
is at least about 25 percent lower than an individual having a benign tumor.
Such
differential identifications can be used alone or in conjunction with one or
more primary
diagnostic methods for the testing and detection of breast carcinomas.
In part, the present invention is a host-operative method of monitoring tumor
~_>rowth. The method includes ( 1 ) providing an individual post-operative to
the removal
of a malignant tumor. (21 using a saliva specimen from that individual to
develop a
post-operative biomarker panel. (3) comparing the post-operative biomarker
panel with a
pre-operative biomarker reference panel for the individual, and (4)
determining the
presence of malignancy by monitoring at least one constituent of the
respective
biomarker panels.
Typically. and in preferred embodiments of this method. post-operative
chemotherapy is administered to the individual. The chemotherapy can include
but is
not limited to a therapeutic regimen of cyclophosphamide, methotrexate and
fluorouracil.
In preferred embodiments, both biomarker panels include a c-erbB-2
constituent, the
post-operative detection of which indicates tumor reoccurrence. Alternatively,
both
biomarker panels can include tumor suppressor oncogene protein 53 as a
constituent, the
post-operative absence of which indicates tumor inhibition.
In part, the present invention is a method of using the concentration of an
endogenously encoded protein to diagnose carcinoma of the breast. The method
includes
( 1) using a saliva specimen from an individual to provide a protein biomarker
diagnostic
for carcinoma of the breast, (2) comparing the individual protein biomarker
with a
reference protein, and (3) determining an elevated concentration of the
individual
protein biomarker over the referenced protein to diagnose the individual. In
preferred
embodiments, the biomarker protein is one constituent of a biomarker panel.
Likewise,
the reference protein can be one constituent of a reference panel. Regardless,
any such
protein can be developed as a reference using malignant tumor, benign tumor
and control
CA 02363566 2001-08-27
WO 00/52463 pCT/US00/053b4
group populations. In highly preferred embodiments, the individual protein
biomarker is
cancer antigen 15-3 or, alternatively, an expression of oncogene c-erbB-2.
The biomarkers of the present invention can include any proteinaceous
expression, fragment or bioderivative, or ligand or antibody thereto, encoded
by any
oncogenetic matenal, which has or can be characterized biochemically,
physiologically
or structurally.
For instance. CA 15-3 has been characterized as a mucinous glycoprotein and
shown to be a diagnostic indicator. More specifically, CA15-3 is a carcinoma-
associated
antigen which is identified by two monoclonal antibodies designated Mab D 11-5
and
Vlab DF3. Mab D 11-5 is prepared against an antigen of human milk fat globule
membranes. and Mab DF3 is generated against membrane fraction from human
breast
cancer.
It has also been observed that the c-erbB-2 oncogene (also referred to as
HER-2/neu), which is capable of transforming cells to malignancy, is present
in some
tumors at very high levels [Zhou et al., Cancer Research, 47:6123 ( 1987);
Berger et al.,
Cancer Research, 48:1238 (1988); Kraus et al., The EMBO Journal, 6 (3):605
(1987); and
Slamon et al., Science, 235:177 (1987)]. The expression of the c-erbB-2
oncogene, and
its location in the external membrane of cells appears to be closely
associated with cancer
[Kraus et al., id; Slamon et al., id; Drebin et al., Cell, 41:695 ( 1985); and
Di Fiore et al.,
Science. 237:178 (1987)]: it may. in fact. be the primary event in the
development of
cancer in at least some cases [Muller et al., Cell. 54:105 ( 1988)].
Overexpression of the
c-erbB-2 protein on the surface of normal cells appears to cause them to be
transformed
or otherwise behave as tumor cells.
Evidence of such transformation can be found, of course, proximate to the
disease.
Underlying many facets of diagnostic utility, however, is the discovery that c-
erbB-2
overexpressing cells shed the c-erbB-2 external domain into neighboring
tissues.
Derivatives of e-erbB-2 have been found in the serum of stably transformed
expressing
cells.
A glycoprotein having an approximate molecular weight of 75 kilodaltons (kd)
has
been identified to constitute the external domain of the approximately 185 kd
glycoprotein (gp185) that is c-erbB-2. The term ~'gp75" is precisely defined
by its
6
CA 02363566 2001-08-27
WO 00/52463 PCT/US00/05364
nucleotide and amino acid sequences; the gp75 external domain comprises the
region
from about amino acid number 22 (serine; ser-22) to about amino acid number
653
(serine; ser-653) with.the nucleotide sequence corresponding thereto. The
amino acid
sequence represents the nonglycosylated version of gp75 which would be
expected to
have a molecular weight corresponding thereto.
The gp75 proteins and polypeptides are encoded by the gp75 external domain
DNA sequence (nucleotides encoding from approximately ser-22 to approximately
ser-653) or by fragments of said gp75 DNA sequence. The phrase "gp75 proteins
and
polypeptides" is therefore interpreted to mciude proteins and/or polypeptides
that have
substantially the same amino acid sequences or pornons thereof, and/or
substantially the
same biological activity as the gp75 proteins and polypeptides.
The present invention shows such ~roteinaceous materials, once found
elsewhere,
can also be identified and further charactenzed in saliva. For example and as
discussed
elsewhere herein, it was undertaken to ~ietermme if the oncogene, HER-2/neu,
was
present in Stimulated Whole (SWS), Parotid (P2), submandibular/sublingual (S2)
and/or
Minor (M2) salivary secretions among six healthy, age matched women. Because
of its
relationship with saliva, gingival crevicular fluid (GCF) was also assessed.
HER-2/neu
assays were performed by ELISA. HER-2/neu concentrations were assayed in serum
and
compared to those of saliva. Assays revealed the presence of HER-2/neu in SWS
(40.71 Units/ml), PS (15.71 Units/ml), and S2 (14.08 Units/ml) with only trace
amounts
appearing in M2 and GCF. SWS produced the highest levels of HER-2ineu as
compared
to glandular secretions. Overall and as might ~be expected, the greatest
concentration of
HER-2/neu appeared in serum. However. when HER-2/neu concentrations were
corrected for total protein, the higher concentrations appeared in P2 (72.78
Units/ml)
secretions, with lesser amounts excreted in SWS (34.01 Units/ml) and
S2 (34.95 Units/ml) by comparison.
Such results indicate that the protein, HER-2/neu, is present in saliva and is
conveyed, primarily, by the parotid gland. The results also indicate that HER-
2/neu may
passively diffuse from the serum, to the interstitium, and then be excreted by
saliva into
the oral cavity. A growing body of work relates to saliva constituents and
mechanisms of
salivary secretion (See Glandular Mechanisms of Salivary Secretion, Edited by
Garrett et
CA 02363566 2001-08-27
WO 00/52463 PCT/US00/05364
al., ( 1999) and the references cited therein), demonstrating skill in the art
correlating
serum and salivary proteins.
In accordance with the present invention, proteins -- in addition to the c-
erbB-2
proteins described herein -- distinctly associated with either breast cancer
or other
carcinogenic disease states have been or can be analyzed or characterized in a
manner
similar to that described above for the c-ei:bB-2 oncogene. As would be known
to those
skilled in the art and subsequently made aware of this invention, those other
distinctly
disease associated proteinaceous expressions. whether identified proximate to
the disease
or found serially, are detectable in saliva and can be evaluated as described
herein for use
as salivary biomarkers diagnostic for associated disease states.
The biomarkers and related inventive method can be used for detecting breast
carcinoma and provide for an economical and logistical adjunct diagnostic test
for
mammography. Furthermore, these salivary markers can also, in conjunction with
physician and self breast examination. help to reduce morbidity and mortality
rates for
breast cancer and thereby reduce overall national health care expenditures.
Brief Description of the Drawings.
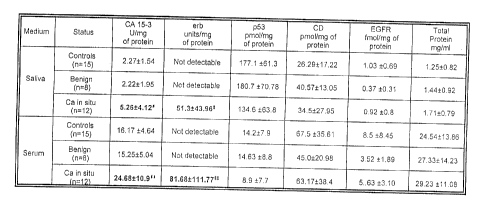
Figure 1 is a compilation of mean values for healthy controls, individuals
having
benign lesions and carcinomas in situ (Ca in Situ), comparing saliva and serum
media:
= erb control (saliva) < erb cancer group (saliva) one way sample test t-test
(mean vs
constant): t-value = 14.31. p>0.0001: ~~ = erb control (serum) < erb cancer
gxoup
(serum) one way sample t-test (mean vs constant) t-value = 10.33, p<0.0001; #
= CA
15-3 control & benign (saliva) < CA 15-3 cancer group (saliva) Anova p<0.05;
and # # _
CA 15-3 control & benign (serum)< CA 15-3 cancer group (serum) Anova p<0.01.
FIGURE 2 is a tabular comparison of salivary and serum concentrations (U/mg
protein) of CA 15-3, by diagnostic status.
FIGURE 3 is a tabular comparison of salivary and serum concentrations (U/mg
protein) of erb, by diagnostic status.
FIGURE 4 is a tabular comparison of salivary and serum concentrations
(finol/mg
protein) of EGFR, by diagnostic status.
8
CA 02363566 2001-08-27
WO 00/52463 PCT/US00/05364
FIGURE 5 is a tabular comparison of salivary and serum total protein
concentrations (mg/ml), by diagnostic status.
FIGURE 6 is a tabular comparison of salivary and serum concentrations (pmol/mg
protein) of p53, by diagnostic status.
FIGURE 7 is a tabular comparison of salivary and serum concentrations (pmol/mg
protein) of CD, by diagnostic status.
FIGURE 8 presents mean and standard error values determined for various serum
and salivary erb characteristics.
FIGURE 9 presents questionnaire data obtained from the indicated groups
studied. showing the utility of the present invention.
FIGURE 10 shows erb values determined by malignant tumor stage.
FIGURE 11 shows a series of cut-off values for erb and CA 15-3 concentrations,
in accordance with the various diagnosnc methods of this invention.
FIGURE 12a shows graphicallv mean values, 95% Confidence Intervals, and cut-
off value ( 110 Units/ml) for salivary c-erbB-~ Units/ml for the control
group, group
diagnosed with benign lesions, and the group diagnosed with carcinoma of the
breast.
FIGURE 12b shows graphically. mean values, 95% Confidence Intervals, and cut-
off value ( 110 Units/ml) for salivary c-erbB-2 Units/mg of protein for the
control group,
group diagnosed with benign lesions, and the group diagnosed with carcinoma of
the
breast.
FIGURE 13a shows, a graphically, mean values, 95% Confidence Intervals, and
cut-off value (2000 Units/ml) for serum c-erbB-2 Units/ml for the control
group, group
diagnosed with benign lesions, and the group diagnosed with carcinoma of the
breast.
FIGURE 13b shows graphically mean values, 95% Confidence Intervals, and cut-
off value (50 Units/ml) for serum c-erbB-2 Units/mg of protein for the control
group,
group diagnosed with benign lesions, and the group diagnosed with carcinoma of
the
breast.
FIGURE 14a shows graphically mean values, 95% Confidence Intervals, and cut-
off value (4.0 Units/ml) for salivary CA 15-3 Units/ml for the control group,
group
diagnosed with benign lesions, and the group diagnosed with carcinoma of the
breast.
9
CA 02363566 2001-08-27
WO 00/52463 PCT/US00/05364
FIGURE 14b shows graphically mean values, 95% Confidence Intervals, and cut-
off value (20 Units/ml) for serum CA 15-3 Units/ml for the control group,
group
diagnosed with benign lesions, and the group diagnosed with carcinoma of the
breast.
FIGURE 15 shows a graphic plot of receiver operating characteristic (ROC)
curves (sensitivity vs. 1-sensitivity) for salivary c-erbB-2 Units/ml (- -),
salivary c-erbB-
? Units/mg of protein (w~). and salivary CA 15-3 Units/ml
(-° -); the percent area under each curve is as follows: c-erbB-2 ~76%,
a cut-off of
about 110 units/ml; c-erbB-2/tp ~77%. a cut-off of about 100 Units/mg protein;
and CA
15-3 ~71%. a cut-off of about 4 Units/ml.
FIGURE 16 shows graphically receiver operating characteristic (ROC) curves
(sensitivity vs 1-sensitivity) for serum c-erbB-2 Units/ml (--), serum c-erbB-
2 Units/mg
of protein (w~), and serum CA 15-3 Units/ml (-~ -); percent area under each
curve is as
follows: c-erbB-2 ~77%, a cut-off of about 2000 Units/ml; c-erbB-2/tp ~76%, a
cut-off
of about 50 Units/mg protein; and CA 1~-3 ~71°,%, a cut-off of about 20
Units/ml.
Examples of the Invention.
The following non-limiting examples and data illustrate various aspects and
features relating to the methods) of the present invention, including the
surprising and
unexpected results obtained thereby.
With respect to the following examples and data, the subject population
consisted
of 21 women from the general population (controls) and the University of
Mississippi
Medical Center (UMMC), Department of Oncology and Surgery Clinics (tumor
patients). Individuals with a breast mass were referred to UMMC from the
surrounding
community for evaluation. Each patient was given a thorough physical
examination and
evaluated for carcinoma of the breast. Saliva and serum specimens were
collected from
each women at the initial visit at the clinic and prior to receiving any
treatment. Final
pathologic diagnostic evaluations later revealed whether the individual had a
benign
tumor, or carcinoma of the breast (in situ). Investigators were initially
blind with respect
to diagnostic outcome of the subjects until a final diagnosis was rendered by
the
pathologist and the patient referred for further treatment. The subjects were
racially
mixed and ranged in age from 30 to 80 years.
CA 02363566 2001-08-27
WO 00/52463 PCT/US00/05364
False positive results were eliminated. It was initially envisioned that the
present
methodology might provide false positives due to extraneous physiological and
environmental factors such as estrogen levels and smoking, respectively.
However, such
factors have been eliminated as providing false positive results. Race, age,
menopausal
status, medication usage and health status were also eliminated as factors
producing false
positive results.
Assays were determined as indicated using the referenced commercial kits and
associated reagents, procedures and/or techniques. Kits from Triton
Diagnostics are no
longer available. Kits from CIS bio international are particularly useful and
provide
enhanced sensitivity, especially with regard to the erb marker.
ExamQe i
Statistical Analysis. Statistical analysis were performed using the SPSS
statistical
software package. A descriptive analysis was made comparing mean marker values
for
the controls, those with benign tumors, and carcinoma of the breast.
A one-way analysis of variance for unbalanced data, the general linear models
procedure, was used to compare the mean values for the group with breast
carcinoma
with a non cancer groups. The polynomials formulated using the general linear
models
procedure are easy to interpret and are appropriate for all sample sizes
including those
too small to sustain an appropriate multivariate analysis. The Tukey post-hoc
analysis
was used for significant linear models.
Considering that erb was undetected among controls and benign lesions for both
saliva
and serum, a one way sample t-test was performed. Due to the small sample
size, issues
concerning the specificity and sensitivity of the panel of markers were not
addressed, but
will be investigated in subsequent studies.
Example 2
Specimen Collection. Stimulated whole saliva specimens were collected for a
minute period using a cube of paraffin as a stimulant (Navasesh, 1982)1'
Salivary flow
rates were determined gravimetrically. All specimens were collected in the
morning
thereby controlling for any possible effects that circadian rhythm may produce
in marker
concentration. Samples can be frozen for future analysis. Blood was also drawn
at the
11
CA 02363566 2001-08-27
WO 00/52463 p~'.T/US00/05364
time of saliva collection by a phlebotomist. None of the participants
exhibited cancerous
or precancerous lesions in the oral cavity at the time the specimens were
collected.
The frozen saliva samples were thawed and centrifuged at 500-15006 for 20 min
to precipitate cells and mucin in order to extract the bio-marker proteins.
The clear
saliva extract and the serum from the blood specimens were analyzed for total
protein
and the panel of biomarkers.
Example
Total Protein. A colornnetnc assay for measuring total protein concentration,
based on the color change of Coomassie brilliant blue G-250 dye in response to
various
concentrations of proteins, was used (Bio-Rad Kit). Specimens were read on a
spectrophotometer and absorbance measured at j95nm. Total protein
concentration of
the samples was determined from a standard curve constructed with bovine gamma
globulin standards.
Example 4
CA 15-3. CA 15-3 assays were determined by using EIA kits (CIS bio
international). The CA 15-3 assay is a two-site solid phase enzyme
immunoassay. The
molecules of CA 15-3 are "sandwiched" between two monoclonal antibodies, the
first
one attached to the ELSA solid phase and the second one linked to the
horseradish
peroxidase (enzymatic conjugate). After washing. the enzymatic reaction
develops a
color proportional to the amount of CA 15-3 present in the assay. Absorbances
are read
at 490 nm using a spectrophotometer and concentrations are calculated from
standard
curves constructed from known concentrations of the ligand. The CA 15-3 assay
is
designed to assay serum specimens. Saliva supernatants were substituted in
place of the
serum for salivary CA 15-3 determinations. The antibodies used in the test do
not
present cross-reaction with other known tumor markers (CEA, CA 19-9, CA 125)
and the
salivary concentrations are substantially above the lower limit of detection
for the assay.
CA 15-3 concentrations were expressed as units/mg of protein.
Example 5
erb and pantropic p53. erb and pantropic p53 assays were determined using
ELISA kits (Oncogene Research, Co. ). In this study serum and the salivary
supernatant
12
CA 02363566 2001-08-27
WO 00/52463 PCT/US00/05364
were substituted in place of the tissue extracts as assay specimens. A
colormetric
evaluation of the level of binding was performed and the intensity of the
color formed by
the enzymatic reaction is proportional to the target protein present.
Absorbances were
read at 490 nm in a microplate spectrophotometer and ligand concentrations
calculated
from standard curves. erb and p~3 data were expressed as units/mg of protein
and
pmol/mg of protein. respectively. The antibodies used in the test do not
present
cross-reaction with other known tumor markers and the salivary concentrations
are
substantially above the lower limit of detection for the assay.
Example 6
Cathe~sin-D Assay. Salivary and serum CD concentrations were determined
using enzyme immunoassay (EIA) lcit iTnton Diagnostics. Inc.). A monoclonal
antibody
and a rabbit polyclonal antibody both specific for CD were simultaneously
incubated
with both the saliva and serum specimens. During the incubation. the CD
present in the
saliva and serum specimens was bound by zhe two anti-CD antibodies. The
monoclonal
antibody is conjugated to biotin causing the formed antigen-antibody complex
to be
bound onto the streptavidin-coated tube. Unbound materials were removed by
washing
the tubes. In the second incubation. an anti-rabbit antibody conjugated with
horseradish
peroxidase was added to the tube. The conjugate was then bound to the complex.
Unbound complex was removed by a second washing. The tubes were then incubated
with a TMB substrate solution in order to deveion a color. Phosphoric acid was
then
added to stop the enzymatic reaction. The intensity of the color that was
developed was
determined using a spectrophotometer set at 450 nm. Specimen values were
determined
from the curve which resulted by plotting the absorbance values of the
controls against
the known concentrations (pmol/mg of protein).
Example 7
Epidermal Growth Factor Receptor. EGFR assays were determined using EIA
kits (Triton Diagnostics. Inc.). The anti-EGFR conjugate was incubated with
the saliva
and serum specimens. During the incubation the EGFR protein becomes bound by
the
anti-EGFR conjugate. One of the monoclonal antibodies is conjugated to horse
radish
peroxidase. During the second incubation the resulting immune complexes become
13
CA 02363566 2001-08-27
WO 00/52463 PCT/US00/05364
bound onto a coated polystyrene tube by a "linking solution". Unbound
substrates were
then washed by decanting. The tubes were then incubated with a TMB substrate
solution
in order to develop a color. Phosphoric acid was then added to stop the
enzymatic
reaction. The intensity of the color that was developed was determined using a
spectrophotometer set at 450nm. Specimen values were determined from the curve
which resulted by plotting the absorbance values of the controls against the
known
concentrations(frnol/mg of protein).
For all their power. immunoassays are subject to many kinds of interference.
The
investigators performed several test laboratory tests to control for these
problems. With
respect to ligand recovery. the investigators were able to establish the
amount of marker
( ligandl recovered from saliva and serum samples. Five saliva and serum
specimens
with known amounts of marker were serially diluted. The dilutions were assayed
for all
three markers. The data were plotted against the expected values to determine
the
linearity of dilution. The slopes of 'both the dose response curve and the
standard curve
were not significantly different from each other and the intercepts were not
significantly
different from zero. During the assaying of the specimens, the investigators
employed
the use of appropriate positive and negative controls for all marker assays.
When
performing the assays, some test specimens contained primary antibodies
preincubated
with excess ligand to control for false positives. In addition, test specimens
were
preincubated with excess free primary antibody to determine if the signal had
been
eliminated. These extra tests provided additional quality control during the
course of
specimen analyses. When assayed, all specimens were run in triplicate.
The control group consisted of 1 ~ women (age 42.4), the benign tumor group
consisted of 8 women (age 45.3), and the cancer group consisted of 12 women
(age 49.0). The subjects diagnosed with benign lesions consisted of women with
fibroadenomas (n=4), lipomas (n=1), and fibromas (n=3). The women with breast
cancer
were diagnosed with lobular carcinoma (n=1), infiltrating ductal carcinoma
(n=9), and
ductal carcinoma in situ (n=2). All of the subjects with carcinoma of the
breast were
node negative and without evidence of metastases. Five of the cancer subjects
among the
cancer group were edentulous while only two among the non-cancer group were
14
CA 02363566 2001-08-27
WO 00/52463 PCT/US00/05364
edentulous. All other subjects were dentate. The mean values for the three
groups are
shown in FIG. 1 and illustrated graphically in FIGS. 2-7.
.As shown in FIGS. l and 2, the mean values for CA 15-3 among the controls and
benign lesions group were approximately 45%-50% lower than the mean value for
the
cancer group. This was statistically significant at the p<0.05 level for
saliva and p<0.01
level for serum.
Referring to FIGS. l and 3, erb was not detected in the saliva or the serum of
the
controls or benign lesions group. Conversely, the carcinoma group exhibited
the
presence of eib and the t-test showed stgnnicantly higher concentrations
(p<0.001).
Additionally, p53 levels were approximately 25% higher among the controls and
the benyn lesson groups as compared zo zhe cancer croup (FIGS. 1 and 6.) The
invesngators expected higher p53 values among the controls as compared to
those
women with breast cancer in so far as p53 mutation reflects the inability of
the oncogene
to render tumor suppression. As shown m the accompanying figures, saliva and
serum
levels of CD and EGFR did not appear to be as tumor specific as CA 153, erb
and p53
when compared across the three groups of women.
Example 8a
With respect to the presence of the panel of markers in saliva, several
technical
issues were also addressed. One such issue was to determine if cells from the
oral
epithelium may possibly contribute to marker levels found in the saliva. To
address this,
salivary specimens were centrifuged and the supernatant separated from the
pellet. A
sample from the supernatant was placed on a glass slide, stained and
microscopically
examined for the presence of cells. The examination disclosed the absence of
cells in the
supernatant. Next, the pellet was resuspended in phosphate buffered saline.
Both the
supernatant and the resuspended pellet were analyzed for the presence of the
biomarkers.
The results showed biomarker levels in the supernatant, but an absence of
biomarkers in
the resuspended pellet, indicating the biomarkers originate in the saliva and
that there are
no biomarker contributions from the cells.
CA 02363566 2001-08-27
WO 00/52463 PCT/US00/05364
Example 8b
A second experiment was performed using secretory IgA (slgA) as a control
protein to compare individuals with and without carcinoma of the breast. The
predominant immunoglobulin in saliva is slgA. It is derived from salivary
glands with the
parotid gland being the principal producing gland. The antibody is synthesized
as IgA
dimers by immunocvtes present in the major and minor salivary glands. Because
of its
ability to attenuate pathogenic assault. slgA is consider to be the oral
cavity's first line of
defense. This salivary protein has no relationship with carcinoma of the
breast and was
selected as a control protein. Using ELISA methodology, slgAs were detected in
the
saliva from both the cancer and the non-cancer groups. The results of this
test showed no
significant differences among those individuals wzth ( x 11.7 ng/ml) and
without cancer
( x 14.3 ngiml), indicating that the omv proteins which appear to be elevated
are those
markers associated with carcinoma of the breast.
Example 8c
A third experiment was performed to determine the effects of oral health on
the
marker levels. A small number of individuals with periodontal disease was
compared to
healthy controls and several edentulous subjects. The results showed no
significant
difference in marker levels among those with periodontal disease, those who
were orally
healthy and those who were edentulous.
~;xample 8d
A fourth experiment was conducted to determine the effects of the estrous
cycle
on salivary marker levels. Two healthy women with regular menses had saliva
specimens collected daily from the beginning of their menstrual cycle to its
end. The
results showed no major fluctuations of salivary marker concentrations
occurring during
the menstrual cycle. Marker concentrations were relatively consistent over the
30 day
period suggesting minimal individual variability (data not shown).
Example 8e
Another experiment was conducted to determine the origin of the salivary gland
constituents. Parotid, submandibular. sublingual and minor gland secretions
were
collected. The results of this experiment indicate that these markers are
primarily
16
CA 02363566 2001-08-27
WO 00/52463 PCT/US00/05364
secreted by the parotid gland. Parotid gland secretions were found to be many
times
higher than the submandibular, and sublingual concentrations. Minor gland
contributions were barely detectable. Additionally, marker concentrations
appear to be
flow rate independent.
As shown above, detectable levels of the breast tumor markers CA 15-3, erb,
EGFR, CD, and p53 were present m the saliva and serum of women with malignant
breast lesions. These markers are also detectable m the saliva and serum of
women with
benign breast lesions and completely healthy ~ndimduals. The results also
indicate lower
levels of CA 15-3, erb, in noncancer Individuals as compared to those with
breast
carcinoma (Figures 1). The reverse was true with respect to p~3.
Several potential confounding factors were also considered and resolved.
Accordingly, it was determined that: 11 the cells from the oral epithelium did
not
contribute to the marker levels, 2) using slgA as a control protein, the only
proteins
which are elevated are those markers associated with carcinoma of the breast,
3) the
presence of periodontal disease has no effect on marker levels. 4) the estrous
cycle had
no effect on salivary marker levels, 5) the markers are secreted primarily
from the parotid
gland and 6) are flow rate independent.
A similar study consisted of three groups of women: Group I was a control
group.
This group consisted of healthy, asvmptomatic individuals from the University
of
Mississippi Medical Center (UMMC1. riealth status for the control group was
determined
by questionnaire.
Group Ih the benign tumor group, and Group III, the malignant tumor group,
consisted of consecutive individuals from the surrounding community with a
breast mass
that were referred by a physician to UMMC Division of Oncology for evaluation.
Each
patient received a thorough physical examination and was evaluated for
carcinoma of the
breast. Saliva and serum specimens were collected from each women at the
initial clinic
appointment and prior to receiving any treatment. Final diagnostic evaluations
obtained
from pathology reports determined whether the individual would be classified
to Group II,
the benign tumor group, or to Group III, the group diagnosed with carcinoma of
the
17
CA 02363566 2001-08-27
WO 00/52463 PCT/US00/05364
breast. Staging and nodal status were assessed according to the criteria set
forth by the
.American Joint Committee on Cancer.
All participants were administered a brief questionnaire at the time of
signing the
IRB approved consent form. This data was collected by interview and included
information concerning their age, race, tobacco usage, pharmacological and
medical
histories, and menopausal status.
Similar to the procedures and~or examples discussed above. stimulated whole
saliva specimens were collected for a ~ minute period using a cube of gum base
as a
stimulant following standardized collection procedures. Upon collection. the
specimens
were aliquoted and frozen for analysis. Salivary flow rates were determined
~avimetrically. All specimens were collected in the morning thereby
controlling for any
possible effects that circadian rhythm may produce in marker concentration.
Blood was
also drawn at the time of saliva collection by a phlebotomist.
The frozen specimens were thawed and the saliva and the serum from the blood
specimens were analyzed for total protein and the c-erbB-2 concentrations.
The specimens were also assayed for CA 15-3. The effectiveness of CA 15-3 as a
diagnostic marker is documented in the literature and was used as a reference
marker or
"diagnostic gold standard" by which to compare the efficacy of the c-erbB-2
marker.
Samples of saliva were assayed for protein using the bicinchoninic acid method
(Pierce Chemical. Co.) which is a highly sensitive and selective detection
reagent for the
cuprous ion. This method measures protein concentrations from 0.5-20 mgiml. In
this
assay, bicinchoninic acid serves as a chelating agent for Cut' forming a color
complex in
the presence of protein. Aliquots of saliva ( 100 ~.L) were placed in
microtiter plates and
the Pierce BCS protein assay reagent added to the wells. Samples were
incubated for
30 minutes at 37°C and the optical density read at 562 rim in a
microplate
spectrophotometer. The final concentration of each substance was derived from
a
standard curve and data was expressed as mg/mL.
Serum and salivary extracellular domain c-erbB-2 antigen levels were assayed
using ELISA kits from Oncogene Research Products. Whole saliva was substituted
in
place of serum as assay specimens. The basic assay involves a colormetric
evaluation of
18
CA 02363566 2001-08-27
WO 00/52463 PCT/US00/05364
the level of binding which was performed and the intensity of the color formed
by the
enzymatic reaction being proportional to the target protein present. The
absorbance was
read at 490 nm in a microplate spectrophotometer and the ligand concentration
calculated
from a standard curve. c-erbB-2 data were expressed and reported as both
Units/ml and
Units/mg of protein so that these findings ~,ould be compared to previous
results in the
literature.
CA 15-3 assays were determined by using EIA kits from CIS Bio International.
The CA 15-3 assay is a two-site solid phase enzyme immunoassay. The molecules
of
CA 15-3 are "sandwiched" between two monoclonal antibodies. The first one is
attached
to the ELISA solid phase and the second one linked to the horseradish
peroxidase
1 enzymatic conjugate). After washing. i~~ie enzymatic reaction develops a
color
proporrional to the amount of CA 15-3 present in the assay. Absorbance is read
at
490 nm (horseradish peroxidase) using a spectrophotometer and the
concentration is
calculated from a standard curve constructed from known concentrations of the
ligand.
The CA 15-3 assay is designed to assay serum specimens. Whole saliva was
substituted
in place of the serum for salivary CA 15-3 determinations. CA 15-3
concentrations were
expressed as Units/ml.
Statistical analyses were again performed using the SPSSTM statistical
software
package. These data were analyzed from four different perspectives. Initially,
the saliva
and serum marker concentrations were summarized for each group and descriptive
analyses were conducted for the demographic and supplemental data obtained
from the
questionnaire. The focus was on race, medical status, tobacco use, medication
usage, and
menopausal status with respect to c-erbB-2 concentrations. The data were
summarized
by tumor type, staging, and nodal status. Due to the small number of women in
the
cancer group, the number of sub-categories for primary tumor (T) and nodal
status (N)
were collapsed. The primary tumor categories were dichotomized to T 1 and
greater than
T 1, while nodal status was reduced to node negative and node positive,
respectively.
A one-way analysis of variance (ANOVA) was used to compare the mean marker
values for the three groups, focusing on the breast cancer in contrast to the
non-cancer
groups. The Dunnett's test was used to adjust for multiple comparisons.
19
CA 02363566 2001-08-27
WO 00/52463 PCT/US00/05364
Possible associations among the salivary and serum c-erbB-2 levels as well as
those between c-erbB-2 and CA 15-3 concentrations in saliva and serum were
investigated by Pearson's correlation coefficient. As the distribution of some
of these
concentrations were skewed, the data were transformed using the square root of
each
value.
Example 9
Receiver operating characteristic (ROC) analyses were conducted to investigate
the
appropriate cut-off values for each biomarker. Separately for each marker
their
concentrations were recoded into dichotomous variables using the mean of the
control and
the cancer group as the initial cut-off value. Incremental ranges of cut-off
values in a
posW ve (> r l and negative (< z ) direction about the mean were assessed for
each marker.
Breast cancer was dichotomized mto posW ve aria negative. Two-by-two tables
were used
to compute the sensitivity and specificity values of each biomarker for
detecting disease
for each cut-off value. ROC curves (sensitivity vs 1-specificity) were
constructed for
c-erbB-2 and CA 15-3 concentrations in both saliva and serum. The optimum cut-
off
value for each marker was determined by using the cut-off value that produced
the largest
percentage of area under its ROC curve. See, Wilcosky TC. Chapter 3, Criteria
for
selecting and evaluating markers. In: Hulka BS, Wilcosky TC, Griffith JD, eds:
Biological
Markers in Epidemiolo~y, New York. Oxford University Press, 1990, pp. 36-42:
and
SPSS for Windows, release 9Ø Chicago: SPSS, 1999.
Example 10
Demographic and supplemental data obtained from the questionnaire were
conducted for the three groups of women are summarized in Figures 8 and 9.
Frequency
comparisons by race, tobacco use, medication use and menopausal status were
conducted.
There were significant differences in race, tobacco use, and menopausal status
among the
three groups. More African-Americans experienced carcinoma of the breast and
benign
tumor lesions than Caucasians. Likewise. significantly more tobacco users
experienced
carcinoma of the breast and benign tumor lesions than non-users. With respect
to
menopausal status, perimenopausal women experienced carcinoma of the breast
and
benign tumor lesions than the pre and postmenopausal women. Mean c-erbB-2
values
CA 02363566 2001-08-27
WO 00/52463 PCT/US00/05364
were compared for each group according to health status (e.~., control.
benign, cancer).
There were no significant reportable effects on c-erbB-2 concentration
attributable to
these variables within each group of women (health status). Age comparisons
yielded no
significant group differences for c-erbB-2 values and was not linearly related
to c-erbB-2
values when regression modeling was employed.
Further analyses showed that the women with breast cancer produced detectable
salivary levels of c-erbB-2 that were significantly higher than those produced
by the
benign tumor and the control groups. The means. standard error of the means,
and the
95% confidence intervals for the salivary marker concentrations across the
three groups
are shown in Figures 8. 12-14. As shown in Figure 8. the mean c-erbB-2 values
for the
;:ontrol and benmn tumor groups were approximately 50%-57% lower than the mean
value for the cancer group. A strong parallel response in the corresponding
serum
c-erbB-2 levels was evidenced in these women, with an associated range of 55%
to 64%,
although the concentrations in serum were roughly 15 times higher than those
in saliva
before correcting for total protein.
The majority of the benign tumors were fibroadenoma or fibrocystic tumors.
There was little difference between salivary c-erbB-2 concentrations found in
fibroadenoma and fibrocystic tumors among women who had these benign tumors.
Two
women presented with fluid filled cysts and two with benign calcifications.
Both the
serum and saliva c-erbB-2 values for the fluid filled cysts were statistically
lower than
those for the fibroadenoma and fibrocystic groups. Again the responses in
serum were
similar to those in saliva for these two groups of benign tumors, although the
rank
ordering of the observed average concentrations reversed between the
fibroadenoma and
fibrocystic groups.
The vast majority of tumors in the cancer group were infiltrating ductal
carcinomas
(n=19). One woman had an infiltrating lobular carcinoma, three had a ductal
carcinoma,
and seven had miscellaneous breast malignancies. The mean salivary and serum c-
erbB-2
concentrations for these groups were all substantially higher than those
observed for the
benign tumors.
21
CA 02363566 2001-08-27
WO 00/52463 PCT/US00/05364
With respect to the staging of the cancer tumors, there was one Stage 0
(TONOMO)
patient, six were Stage I (T1NOM0), eight Stage IIA (T2NOM0), three Stage IIB.
The IIB
group was composed of one T2N1M0 and two T3NOM0. There were two Stage IIIA
composed of one T3NOM0 and one T3N2M0, three Stage IIIB composed of one T3N3M0
and two T4N 1 M0. Seven patients were not staged at the time the data of this
example
was made available.
Seven subjects with carcinoma of the breast were node positive and 16 were
node
neganve. All individuals diagnosed with cancer were without evidence of
distant
metastases. The sub-categories for primary tumor were collapsed into T 1 and
greater than
T l and node positive and node negative groups (Figure 10). These analyses
showed no
differences with respect to tumor size for c-erbB-2 saliva and serum
concentrations. but
there was an elevated c-erbB-2 concentranon difference between node positive
and node
negative individuals regardless of diagnostic medium (Figure 10).
Example i 1
The second level of analyses compared group means for the women with
carcinoma of the breast, women with benign lesions, and the healthy control
group. A
one-way ANOVA for unbalanced data was performed across the three categories of
women for salivary c-erbB-2 and was found to be significant at the F=13.83;
p<0.0001 level. The Dunnett's C post-hoc analysis exhibited a significant
difference
between the cancer group and the benign tumor and control groups at the
p<0.001 level.
A similar result was demonstrated for serum c-erbB-2 across the three groups
of
women. The overall ANOVA was significant at the F=19.95; p<0.0001 level with
the
post-hoc analyses significant at the p<0.001 level (cancer > both non-cancer
groups).
With respect to CA 1~-3, the overall ANOVA was significant at the F=5.94;
p<0.04 level with the post-hoc analyses significant at the p<0.05 level
(cancer >
non-healthy control group). Similarly, the results for serum c-erbB-2 across
the three
groups of women were significant at the F=20.96; p<0.0001 level with the post-
hoc
analyses significant at the p<0.001 level (cancer >healthy control group).
Data for the salivary and serum c-erbB-2 levels corrected for total protein
concentrations exhibited the same results as the non-corrected data. The
overall ANOVA
22
CA 02363566 2001-08-27
WO 00/52463 PCT/US00/05364
for salivary c-erbB-2 was significant at the F=13.80; p<0.0001 level with the
post-hoc
analyses significant at the p<0.001 level (cancer > both non-cancer groupsl.
The results
for serum c-erbB-2 across the three gxoups of women were significant at the
F=14.45;
p<0.0001 level with the post-hoc analyses significant at the p<0.001 level
(cancer >both
non-cancer groups).
Example 12
The third level of analyses. correlations coefficients. revealed a significant
moderate association between serum and salivary c-erbB-2 at the r=0.51;
p<0.0001 level.
There was a si~,mificant. moderate association between serum c-erbB-2 and
serum
CA 15-3 concentrations at the r=0.40; p<0.001 level. With respect to serum c-
erbB-2
concentrations corrected by total protein and their association with CA 15-3.
the results
exhibited a significant, moderate associanon i=x.36; p<0.001 level. A slight
relationship
was found between salivary c-erbB-2 concentranons corrected by total protein
and serum
c-erbB-2 concentrations corrected by total protein at the r=0.39; p<0.001
level.
Lxample 13
The comparison of receiver operator curves (fourth level analyses) suggested a
cut-off value of 110 Units/ml for salivary and 2000 Units/ml for serum c-erbB-
2
concentrations (Figures 1 l, 12a and 13a). A comparison of receiver operating
characteristic curves was also performed on salivary and serum c-erbB-2
concentrations
corrected by total protein. These values were 100 Units/ml and 50 Units/ml for
salivary
and serum c-erbB-2 concentrations (Figures 1 l and 12b and 13b). Salivary CA
15-3
determinations yielded a 4.0 Units/ml cut-off value (Figures 1 l and 14a). The
cut-off
value for serum CA 15-3 was 20 Units/ml (Figures 11 and 14b), compared to
literature
values ranging from 15-40 Units/ml.
Using the aforementioned cut-off values, salivary and serum c-erbB-2
concentrations were able to detect 87% and 94% of the subjects with cancer,
respectively
(Figure 11). The salivary and serum c-erbB-2 concentrations corrected by total
protein
detected 77% and 84% of the subjects. This compares to 62% and 75% for the
salivary
and serum CA 15-3 marker. CA 15-3 levels were able to detect 65% of the
malignant
lesions (Figures 11, 15 and 16).
23
CA 02363566 2001-08-27
WO 00/52463 PCT/US00/05364
Example 14
Prior studies involving the c-erbB-2 oncoprotein vary in the types of
populations
studied with respect to staging, tumor type, nodal involvement, and the
presence of
metastases. Additionally, a variety of analytical techniques have been used to
study the
c-erbB-2 oncoprotein in both tissue and serum. With respect to serum, most
studies have
used enzyme-based immunoassays. These techniques have varied with respect to
the
sensmvity of the assays and the use of either monoclonal or polyclonal
antibodies. Some
kits used in the literature have since been discontinued and are no longer
available to
researchers. The findings herein are compared with studies using similar,
sample sizes,
staging, and assay technology.
The results of the preceding examples suggest elevated salivary c-erbB-2 and
serum c-erbB-2 levels among women mth carcinoma of the breast (Figures 8 and
12-14).
With respect to elevated serum c-erbB-2 levels among breast cancer patients,
the findings
of this study agree with others found in the literature particularly those
evaluating
non-metastatic cancer. There is only one report an the literature concerning
elevated
salivary c-erbB-2 concentrations among women with breast cancer and that was a
preliminary study performed by the authors of this investigation. This earlier
study used
EIA (Triton, Co.) assay for determining salivary and serum c-erbB-2
concentrations. The
results of that study also revealed significantly higher salivary c-erbB-2
concentrations
among women with carcinoma of the breast. The assay employed in this study,
when
compared to the assay of the first study using the same identical specimens,
appears to be
five times more sensitive than the original assay.
Example 15
Benign and malignant tumor comparisons yielded potentially useful information.
Subjects with fibroadenomas and fibrocystic lesions produced similar salivary
and serum
c-erbB-2 concentrations (Figure 9). F or serum, this fording compares with
results
obtained by Breuer ( 1998). Subjects diagnosed with infiltrating ductal
carcinoma
dominated the cancer population in this study. Consequently, comparisons among
the
various types of malignant breast lesions were not made.
24
CA 02363566 2001-08-27
WO 00/52463 PCT/US00/05364
Example 16
Further analyses of the primary tumor data revealed no substantial salivary or
serum c-erbB-2 concentration differences for groups T 1 and greater than T 1
(Figure 10).
This observation does agree with the findings of Watanabe ( 1994) and Kynast
(1993).
The finding also suggests that c-erbB-2 receptor status may be more indicative
of tumor
aggressiveness than tumor volume.
Example 17
With respect to nodal status. node positive patients c-erbB-2 levels were
found to
be elevated when compared to the node negative subjects (Figure 9).
Example ? 8
The data shows an association i r=0.51: p>0.00011 between soluble salivary
concentrations of c-erbB-2 and serum levels or c-erbB-2. The unexplained
variability
may be attributed to the "pooling" of the various types of individuals across
the three
groups of women and the fact the invesngators do not discern the exact
mechanism by
which the c-erbB-2 protein migrates from the tumor site and enters the oral
cavity
(diffusion, leakage, active transport). The process by which c-erbB-2 protein
becomes
solubized is also not fully understood and may account for a portion of the
unexplained
variability. Further investigation, currently underway, is exploring this line
of inquiry.
The association between salivary and serum c-erbB-2 concentrations that were
corrected
by total protein concentrations was r=0.39; p<0.001.
Example 19
A relationship between serum c-erbB-2 concentrations and serum CA 15-3 levels
was found (z=0.40, p>0.001). This correlation was in agreement with the
results reported
by Krainer (i=0.396; p>0.002). When the serum c-erbB-2 concentrations were
corrected
by total protein concentrations, the association between serum c-erbB-2
concentrations
and serum CA 15-3 levels was i=0.36, D>0.001.
Additionally, the data of previous examples also suggest that salivary c-erbB-
2 and
serum c-erbB-2 levels may be equivalent to salivary CA 15-3 and serum CA 15-3
levels
as diagnostic markers (Figures 11, 15 and 16). The salivary and serum c-erbB-2
concentrations were able to detect 87% and 94% of the subjects with cancer,
respectively.
CA 02363566 2001-08-27
WO 00/52463 PCT/US00/05364
The salivary and serum c-erbB-2 concentrations corrected by total protein
detected 77%
and 84%, respectively, of the subjects. This compares to 62% and 75% for the
salivary
and serum CA 15-3 marker. CA 15-3 levels were able to detect 75% of the
malignant
lesions at a 20 Units/ml cut-off value. The manufacturer recommended a 15
Units/ml cut-
off value and indeed the sensitivity did increase to 97%; however, when this
adjustment
was made a sharp decline in specificity (35%) resulted as predicted by Stenman
(1991).
Conversely, when the cut-off value was increased to 40 Units/ml, the ability
of the assay
to detect cancer decreased to less than 30%. This is in agreement with the
findings of
Safi ( 1991 ) and Stenman ( 1991 ). Serum c-erbB-2 levels, whether corrected
for total
protein or not, retained a margin of specificity at the 60% level for
sensitivities over 90%.
Example 20
Information from the health questionnaire concerning age, race. tobacco usage,
presence of systemic disorders, use of prescription medications, and
menopausal status
was also analyzed. These analyses confirttied the results from prior reports
published by
the investigators that these variables have no effect on salivary and serum c-
erbB-2
concentrations. Additionally, the findings for age (Watanabe, 1994), tobacco
usage
(Breuer, 1998), and menopausal status (Breuer, 1998) are supported by other
studies;
however, our study disagrees with Breuer ( 1998) which observed age related
influences
on marker concentrations. Breuer ( 1998) reported that among postmenopausal
women,
age was significantly related to c-ertiB-2 levels.
As a diagnostic medium. saliva has several biochemical advantages. Saliva is a
clear, colorless liquid while serum may become milky when Iipemic, red when
blood
cells are hemolyzed due trauma and icteric in the presence of liver disease.
These color
fluctuations in normal and disease altered serum can affect colorimetric
assays such as
ELISA, make it difficult to produce a consistent blank and interfere with the
true values
of the serum assay when compared to the consistent clarity of the assay
standards. Since
serum possesses more proteins than saliva assaying trace amounts of other
factors (i.e.,
oncogenes, etc.), may result in a greater risk of non-specific interference
and a greater
chance for hydrostatic (and other) interactions between the factors and the
abundant
serum proteins.
26
CA 02363566 2001-08-27
WO 00/52463 PCT/US00/05364
From a logistical perspective, the collection of saliva is safe (i.e., no
needle
punctures), non-invasive and relatively simple, and may be collected
repeatedly without
discomfort to the patient.
The diagnostic benefits arising from the present invention could include the
overall management of breast cancer in women. The diagnosis of breast cancer
at an
earlier stage allows a woman more choice in selection of various treatment
options. A
saliva based test would be useful in the postoperative management of cancer
patients.
Following tumor removal, an expected decrease in marker concentration should
follow
and eventually plateau to within a normal level indicating that the patient is
free of
disease. In contrast, a persistently high level of salivary markers may be
indicative of
tumor recurrence or persistence. Saliva could also be a cost effective method
for
monitoring the effectiveness of chemotherapy. Individuals should experience
decreases
in marker concentrations if the treatment regimen is effective.
While the principals of this invention have been described in connection with
specific embodiments, it should be understood clearly that these descriptions,
along with
the chosen tables and data therein, are made only by way of example and are
not
intended to limit the scope of this invention, in any manner. For example, and
without
limitation, the methodology described herein can be extended to the diagnosis
and
monitoring of gall bladder, colon. rectal, pancreatic and oral cancers. Other
advantages
and features of this invention will become apparent from the following claims,
with the
scope thereof determined by a reasonable equivalents, as understood by those
skilled in
the art.
27