Note: Descriptions are shown in the official language in which they were submitted.
CA 02366510 2008-03-07
EARLY DETECTION OF INFLAMMATION AND
INFECTION USING INFRARED THERMOGRAPHY
1. FIELD OF THE INVENTION
The invention relates to the use of infrared thermography imaging in animals
for the
early detection of inflammation. The invention further relates to the use of
infrared
thermography in animals for the early detection of infection.
2. BACKGROUND OF THE INVENTION
Inflammation plays a fundamental role in host defenses and the progression of
immune-mediated diseases. The inflammatory response is initiated in response
to tissue
injury (e.g., trauma, ischemia, and foreign particles) and infection by a
complex cascade of
events, including chemical mediators (e.g., cytokines and prostaglandins) and
inflammatory
cells (e.g., leukocytes). The inflammatory response is characterized by
increased blood flow,
increased capillary permeability, and the influx of phagocytic cells. These
events result in
swelling, redness, warmth (altered heat patterns), and pus formation at the
site of injury.
A delicate well-balanced interplay between the humoral and cellular immune
elements
in the inflammatory response enables the elimination of harmful agents and the
initiation of
the repair of damaged tissue. When this delicately balanced interplay is
disrupted, the
inflammatory response may result in considerable damage to normal tissue and
may be more
harmful than the original insult that initiated the reaction. In these cases
of uncontrolled
inflammatory responses, clinical intervention is needed to prevent tissue
damage and organ
dysfunction. Diseases such as Rheumatoid Arthritis, Osteoarthritis, Crohn's
disease, psoriasis, or inflammatory bowel disease, are characterized by
chronic inflammation.
Early detection and localization of inflammation is a critical step in the
implementation of appropriate treatment of a subject. However, non-invasive
techniques for
the detection of inflammation remain elusive. A variety of techniques
including computed
tomography (CT), magnetic resonance imaging (MRI), ultrasonography, and
scintigraphic
imaging are used to attempt to image secondary effects or markers of
inflammation.
However, CT, MRI, and ultrasonography rely on anatomical changes that result
from
inflammation, which occur late in the inflammatory response (van der Laken,
C.J., et al.,
1998, European Journal of Nuclear Medicine 25: 535-546). Therefore, these
techniques are
1
CA 02366510 2001-09-21
WO 00/57163 PCT/CAOO/00303
not useful for detecting the earlv phase in the development of inflammation.
Scintigraphic
inlaging is a non-invasive method of scanning the entire body using
radiopharmaceuticals
(e.g., radiolabeled receptor-specific small proteins and peptides), which
specifically bind to
receptors abundant in the area of inflammation. The use of
radiopharmaceuticals for imaging
inflammation is limiting because it requires: (i) that the radiopharmaceutical
specifically
interacts with its receptor; (ii) that the radiopharmaceutical has a high
affinity for its receptor;
(iii) that the radiopharmaceutical specitically localizes to the site of
inflamnlation, which is
dependent on the receptor expression in the inflammatory response; (iv) that
the receptor is
accessible to the radiopharmaceutical; (v) that the radiopharmaceutical has
high and early
uptake; (vi) that the radiopharmaceutical is rapidly cleared; (vii) that the
radiopharmaceutical
does not accumulate in non-targeted tissues and result in high background; and
(viii) that the
radiopharmaceutical is not toxic (van der Laken, C.J., et al., 1998, European
Journal of
Nuclear Medicine 25: 535-546). The induction of a biological response by a
radiopharmaceutical is a major drawback of usint, scintigraphic imaging. In
addition to these
technologies, inflammation may also be detected by feeling or visual
observance of the site of
injury or pain. However, this method is only useful for detecting the late
stages in the
development of inflammation.
The inability to diagnose and image inflammation in vivo continues to be a
major
obstacle to the successful treatment of inflammatory disorders. Currently, the
only viable
method for diagnosing inflammatory disorders, such as fibrosis, is by biopsy.
This method is
invasive and often results in an amount of healthy tissue being removed along
with the tissue
suspected of being affected by inflammation. Therefore, a great need exists
for an accurate,
non-invasive, rapid, and inexpensive method for detecting inflammation.
2.1. INFECTIOUS DISEASES
Viral and bacterial infections typically result in the development of local or
systemic
inflammation and catabolism of tissues at the site of infection. The
inflammatory response to
an infection whether acute or chronic is often tissue or organ centered and as
such is
characterized by increased blood flow and white blood cell activity (i.e.,
phagocytic cell
activity) in affected areas. The appearance of localized swelling,
discoloration and tissue
debris are often apparent and significant tissue damage can result.
Early detection of viral and bacterial infections is important not only for
the
implementation of appropriate treatment of a subject but also for the
prevention of the spread
of the infections. A variety of methods are available for the detection and
clinical diagnosis
of viral and bacterial infections, including inlmunologic methods, which
detect the presence
of viral or microbial antigens or antibodies specific to a virus or microbe. A
variety of
-~-
SUBSTITUTE SHEET (RULE 26)
CA 02366510 2001-09-21
WO 00/57163 PCT/CA00/00303
immunological assays are available for detecting viral or microbial antigens
or antibodies
specific to a virus or microbe, including ELISAs (enzyme linked inlmunosorbent
assays),
solid-state radioimmunoassays, and inimunofluorescent assays. However,
immunological
assays for detecting viral or bacterial infections require a laboratory and
someone with
technical expertise to perform the assays. Further, the biological samples
required to
perform immunological assays are not easily obtained from an animal.
Additionally, the
immunological assays are too costly for individual or sporadic infections and
are generally
not performed until clinical symptoms have manifested. Therefore, a need
exists for a
simple, rapid, non-invasive and inexpensive diagnostic technique for the early
detection of
viral and microbial infections.
2.2 MASTITIS
Mastitis is an inflammation of the mammary gland normally caused by a
bacterial or
mycotic pathogen. The disease is of great concern in the dairy industry, where
significant
economic loss can occur due to the requirement to not use the affected milk
for human
consumption and due to the shortened milking life of the affected animals. The
etiology of the
disease is well described in the literature pertaining to this topic, e.g.,
see, Siegmund et al.,
1973, The Merk Veterinary Manual4' ed., Merck and Comp. Rathway, N.J.; Blood
et al.,
1983, Veterinary Medicine 6' ed., Bailliere Tindall, London.
The successful treatment of mastitis is possible using a variety of animal
management,
milking hygiene and antibiotic agents. However, given the expense and labour
for the
treatment of mastitis, treatment is usually not initiated until the condition
is diagnosed
clinically.
Numerous mastitis tests have also been proposed, including most recently the
use of
electrical conductivity of the milk (Notsuki et al., 1983, Proceedings of the
World
Conference on Animal Production Vo12., 891-892; Datta et al., 1984,
Transactions of the
American Society of Agriculture Engineers 27:1204-1210; Batra, T.R. and
McAllister, A.J.,
1984, Canadian J. Anim. Sci. 64:305-312; Maatje, K. and Rossing, W., 1991,
Mastitis
Newsletter 16:6-7; Lake et al., 1991, J. Dairy Sci. 59:11-19; Biagetti, D.R.,
1992, Rivista-
di-Ingegneria Agraria 23:200-207; Nielsen et al., 1992, J of Dairy Sci. 75:
606-614; Tongel
et al., 1994, Proceedings 3rd International Dairy Housing Conference, Orlando,
Florida, 257-
262). In addition to electrical conductivity, the use of milk components have
been suggested
as good indicators of mastitis, including such elements as sodium, chloride,
potassium,
lactose and bovine serum albunlin (BSA) (Fernando et al., 1985, J. Dairy Sci.
68: 449-456),
milk temperature (Datta et al., 1984, Transactions of the Anlerican Society of
Agriculture
Engineers 27:1204-1210; Rossing et al., 1984, Proceedings of the National
Conference
-3-
SUBSTTTUTE SHEET (RULE 26)
CA 02366510 2008-03-07
American Society of Agricultural Engineers, Chicago, 606-613; Jarman et al.,
1986, J. Dairy
Sci. 69:(suppl 1.) 178), milk pH (Mijnen et al., 1983, Netherlands Milk and
Dairy Journal
37:65-77), milk anti-trypsin (Mattila et al., 1985, J. Dairy Sci. 68:114-122)
as well as general
milking information such as volume or yield (Nielsen et al., 1994, Veterinary
Research
25:285-289). Numerous patents have been issued describing the methods of
mastitis
detection, particularly for the use of electrodes or a variety of electrical
conductivity tests for
milk (U.S. Patent No. 3,989,009; U.S. Patent No. 3,968,774; U.S. Patent No.
4,156,179; U.S.
Patent No. 5,302,903; U.S. Patent No. 5,416,417).
All of these aforementioned procedures can be useful. However, none are
particularly
effective at early detection (e.g., within the first few hours) of mastitis
onset and, as described
by Batra and McAllister (1984), these aforementioned procedures often have an
unacceptably
high percentage of false negatives (i.e., failure to identify an infected
cow). For example,
electrical conductivity is reported to have a 29.4% false negative value and
is also shown to
be unreliable unless selective milk samples are used (Noksuki et al., 1983,
Proceedings of the
World Conference on Animal Production Vol 2., 891-892).
Mastitis is currently detected predominantly by the use of inflammatory tests
such as
the "Wisconsin Mastitis Test" or CMT, which as described by Siegmund (1973,
page 817) is
a rather time consuming laboratory type diagnostic method which will indicate
the relative
leukocyte or somatic cell count in the milk of cows suspected of having
mastitis.
Unfortunately, these types of tests are not particularly effective in
detecting the earliest onset
or subclinical cases of mastitis. Furthermore, the need to capture the animal
and collect milk
samples complicates the use of this method. These factors are important in
that the earlier the
mastitis condition can be detected, the earlier treatments can begin and the
higher the
likelihood of successful treatment in a shorter period of time.
As mentioned previously, these tests have in common the requirement of
collecting
and analyzing milk samples from animals suspected of having mastitis. Clinical
diagnosis of
the infected animal is also routinely conducted. However, clinical signs of
mastitis usually do
not occur until the animal has progressed well into the disease state.
Furthermore, some
diagnostic tools, such as rectal temperature, while usually efficacious, are
often not as
sensitive as would be desired or are simply impractical. Again, it should be
noted that the
earlier a diagnosis can be performed, the earlier treatment can be initiated,
which results in a
lower treatment cost and a more successful outcome. Therefore, there remains a
need for an
accurate, inexpensive, non-invasive, rapid method for predicting early
mastitis onset in dairy
animals.
4
CA 02366510 2001-09-21
WO 00/57163 PCT/CAOO/00303
2.3. BOVINE VIRAL DIARRHEA
Bovine virus diarrhea (BVD) virus is a pestivirus that is characterized by
erosions
and hemorrhages of the alinientary tract (Siegmund, O.H., 1973, The Merck
Veterinary
Manual. Merck and Co. Inc. Rathway. NJ: and Blood et al., 1983, Veterinary
Medicine.
Baillere. Tindall, London). Type land type 2 strains as well as subgroups of
BVD virus
have been identified. Animals infected with BVD virus typically exhibit
anorectic
conditions, rumen stasis, temperature elevations and diarrhea between days 4
and 10
postinfection. Type 2 BVD virus is associated with higher levels of
gastrointestinal tract
hemorrhage, morbidity and mortality than type 1BVD virus.
BVD is readily transmitted by oral contact and is present in the bovine
populations of
most countries. BVD is a significant problem in North American cattle
populations, causing
high morbidity and mortality especially in veal, dairy and beef populations
(Cortese et al.,
1998, J. Am. Vet. Med. Association 213: 1312-1319). Further, the ability to
obtain a reliable
vaccine has remained elusive (Cortese et al., 1998, supra).
BVD is currently detected and diagnosed by immunological assays such as serum
neutralization assays and serum immuno-diffusion assays. A clinical scoring
test is also
frequently used to describe or rank the severity of the disease progression
and symptoms
(see, e.g., Blood et al., 1983, supra: and Cortese et al., 1998, supra). The
immunological
assays are laborious, time consuming and expensive, and require the collection
of a
biological sample. Thus, there remains a need for an inexpensive, non-
invasive, accurate and
rapid method for the detection of an infectious disease such as BVD.
2.4. INFRARED THERMOGRAPHY
Infrared thermography is a non-invasive technique that enables temperatures to
be
monitored and recorded. Unsuccessful attempts have been made to use infrared
thermography
in human medicine as a diagnostic aid for a variety of conditions, such as
tumor detection and
cardiovascular disease (Clark, J.A. and Cena, K., 1972, J. of Mammalogy
54:1003-1007).
Infrared thermography has been attempted in veterinary medicine to detect and
diagnosis a
variety of conditions, such as podotrochlosis in horses (Turner,T.A., 1983,
Am. J. Vet. Res.
44:535-539) and clinical damage in an udder (Tsykalo, A.L. et al., 1982, USSR
(7):49-50) .
The early infrared thermography detection systems were bulky, complex, and
required
frequent recharging with liquid nitrogen. Furthermore, the spatial resolution
was poor, the
exposure time was long, and the minimum resolvable temperature difference was
large for the
infrared thermography systems. Reliable detection of inflammation was not
achieved. In
addition, manv physicians and veterinarians were not adequately trained to
interpret the data
from the infrared imagery and there was a high false positive rate. Thus. the
infrared
-5-
SUBSTtTUTE SHEET (RULE 26)
CA 02366510 2001-09-21
WO 00/57163 PCT/CAOO/00303
thermography was branded as a failure and has not been explored much by the
medical or
veterinary communities for the past three decades.
3. SUMMARY OF THE INVENTION
The present invention provides a method using infrared thermography for the
detection of inflammation in animals. The invention also provides a method
using infrared
thermography for the diagnosis of diseases or disorders that induce
inflammation such as
inflammatory disorders, allergies, and viral or bacterial infection. The
invention further
provides a method using infrared thermography for the detection of an
infection in an animal.
In particular, the present invention provides for the detection of an
infection in an animal by
measuring temperature changes resulting from the animal's immune response to
the infection
using infrared thermography. The catabolism of tissue and the inflammatory
response
induced in response to an infection in an animal both generate temperature
changes which can
be measured using infrared thermography.
The present invention is based, in part, on the surprising discovery that
temperature
differences less than 1 C are clinically significant. This discovery was made
possible by
employing induction models of mastitis and BVD that allowed the Applicants to
evaluate
inflammation or infection resulting from known etiologies and to compare the
infrared
characteristics obtained using an infrared camera with outcomes obtained with
other
diagnostic procedures. Accordingly, Applicants' discovered that temperature
differences
less than 1 C indicate early or subclinical inflammation or infection, and
that temperature
differences greater than 1 C indicate later stages of development of
inflammation or clinical
infection.
4. DESCRIPTION OF THE FIGURES
Figure 1 is a graph of rectal temperature and udder infrared thermography
values for
milking dairy cows having mastitis induced in the left distal quadrant (n=20).
Data for both
the left and right distal quarters of the udder are shown.
Figure 2 is a graph of Nagase (N-acetyl-beta-D-glucosaminidase) and udder
infrared
thermography values for milking dairy cows having mastitis induced in the left
distal quadrant
(n=20). Data for both the left and right distal quarters of the udder are
shown.
Figure 3 is a graph of BSA (Bovine Serum Albumin) and udder infrared
thermography
values for milking dairy cows having mastitis induced in the left distal
quadrant (n=20). Data
for both the left and right distal quarters of the udder are shown.
-6-
SUBSTtTUTE SHEET (RULE 26)
CA 02366510 2001-09-21
WO 00/57163 PCT/CAOO/00303
Figure 4 is a graph of somatic cell count and udder infrared thermography
values for
milking dairy cows having mastitis induced in the left distal quadrant (n=20).
Data for both
the left and right distal quarters of the udder are shown.
Figure 5 is a graph of image area (pixels) for the left and right distal
quarters of the
udder in milking dairy cows having mastitis induced in the left distal
quadrant (n=20).
Figure 6 is a graph is of rectal temperature and udder infrared thermography
values
for a nlilking dairy cow (n=l) having mastitis induced in the left distal
quarter. Data for both
the left and right distal quarters of the udder are shown.
Figure 7 is a graph of NAGase and udder infrared thermography values for the
animal
of Figure 6. Data for both the left and right distal quarters of the udder are
shown.
Figure 8 is a graph of BSA and udder infrared thermography values for the
animal of
Figures 6 and 7. Data for both the left and right distal quarters of the udder
are shown.
Figure 9 is a graph of total temperature values (mean udder temperature x
image area)
for milking dairy cows having mastitis induced in the left distal quadrant
(n=20). Data for
both the left and right distal quarters of the udder are shown.
5. DETAILED DESCRIPTION OF THE INVENTION
The present invention relates to the use of infrared thermography for the
early or
subclinical detection of inflammation in animals. The present invention also
relates to the use
of infrared thermography in the diagnosis of diseases or disorders that induce
inflammation
and/or induce the catabolism of tissues. The present invention provides
methods for
detecting inflammation of an anatomical structure of an animal, preferably a
mammal and
more preferably a non-human animal. The present invention further provides
methods for
detecting infection of an anatomical structure of an animal, preferably a
mammal. In one
embodiment, the present invention provides methods for detecting infection of
an anatomical
structure in a non-human animal. In yet another embodiment, the present
invention provides
methods for detecting infection in humans. The term "anatomical structure"
used herein refers
to any defmable area of an animal, preferably a tissue or a joint of an
animal, that radiates
infrared energy and which may or may not be symmetrical.
The invention provides methods for detecting inflammation of all anatomical
structures of animals, except the joints. The present invention also provides
methods for
detecting inflammation of the joints of all mammals, except humans. The
invention also
provides methods for detecting inflammation or infection in all non-human
mammals,
including but not limited to pigs, horses, cows (e.K.. Bos tauracs and Bos
ii2dicaes), dogs and
cats. The present invention also provides methods for detecting local or
systemic infection in
7-
SUBSTRUTE SHEET (RULE 26)
CA 02366510 2001-09-21
WO 00/57163 PCT/CAOO/00303
animals, preferably a mammals. Further, the present invention also provides
methods for
detecting acute or chronic infection in animals, preferably a mammals.
The invention provides a method for detecting inflammation of an anatomical
structure
of an aninlal, comprising the following steps: (i) obtaining an infrared
thermographic image
of an anatomical structure of an animal; (ii) determining the mean temperature
of the infrared
thermographic image; and (iii) detecting early or subclinical inflammation of
an anatomical
structure of an aninlal if there is a change in the mean temperature of less
than 1 C of an
anatomical structure relative to the mean temperature of the same anatomical
structure of the
same aninial or a population of animals of the same species obtained from
infrared
thermographic images taken when there was no inflammation of the anatomical
structure. The
term "subclinical" as used herein refers to inflammation of an anatomical
structure of an
animal that has not manifested itself clinically.
The invention also provides a method for detecting inflammation of an
anatomical
structure of an aninlal, comprising the following steps: (i) obtaining an
infrared
thermographic inlage of an anatomical structure of an animal; (ii) determining
the mean
temperature of the infrared thermographic image; and (iii) detecting late
stage development of
inflammation of an anatomical structure of an animal if there is a change in
the mean
temperature of greater than 1 C of an anatomical structure relative to the
mean temperature of
the same anatomical structure of the same animal or a population of animals of
the same
species obtained from infrared thermographic images taken when there was no
inflammation
of the anatomical structure.
The invention also provides a method for detecting inflammation of an
anatomical
structure of an animal, comprising the following steps: (i) obtaining an
infrared
thermographic image of an anatomical structure of an animal after an event;
(ii) comparing the
infrared thermographic image obtained to infrared thermographic images of the
same
anatomical structure of the same animal or a population of animals of the same
species prior
to the event; and (iii) detecting inflammation of the anatomical structure of
the animal if there
is a relative difference in the temperature of the anatomical structure of the
animal. The term
`'event" as used herein refers to any activity that may result in
inflamnlation of an anatomical
structure of an animal, including surgery.
The present invention provides a method for detecting inflammation of an
anatomical
structure of an animal, comprising the following steps: (i) obtaining an
infrared
thermographic image of an anatomical structure of an animal; (ii) obtaining an
infrared
thermographic image of the symmetrical anatomical structure of the animal;
(iii) determining
the total temperature of the infrared thermographic images for the symmetrical
anatomical
structures; and (iv) detecting inflammation of an anatomical structure if the
total temperature
-8-
SUBSTiTUTE SHEET (RULE 26)
CA 02366510 2001-09-21
WO 00/57163 PCT/CAOO/00303
of the symmetrical anatomical structures differ by greater than a
predetermined amount. The
term "symmetrical anatomical structure" as used herein refers to an anatomical
structure that
has synlmetry to another anatomical structure of an aninlal (e.g., one leg
compared to another
leg of an animal).
The invention also provides a method for detecting inflammation of an
anatomical
structure of an animal, comprising the following steps: (i) obtaining an
infrared
thermographic image of the anatomical structure of an aninlal; (ii) obtaining
an infrared
thermographic image of the symmetrical anatomical structure of the animal;
(iii) comparing
the infrared thermographic image obtained to an infrared thermographic image
of the
symmetrical anatomical structure of the animal; and (iv) detecting
inflammation of the
anatomical structure of the animal if there is a relative difference in the
temperature between
the anatomical structure and the symmetrical anatomical structure of the
animal.
The present invention also provides a method for detecting when a clinical
treatment
for treating inflammation of an anatomical structure of an aninlal was
successful, comprising
the following steps: (i) obtaining an infrared thermographic image of the
anatomical structure
of the animal; (ii) determining the mean temperature of the infrared
thermographic image; and
(iii) detecting the successful treatment of inflammation of the anatomical
structure by
comparing the mean temperature of the anatomical structure with the mean
temperature of the
same anatomical structure obtained from the same animal or a population of
animals of the
species when healthy.
The present invention also provides a method for detecting an infection in
animal
comprising the following steps: (i) obtaining an infrared thermographic inlage
of the
anatomical structure or a portion thereof of the animal; and (ii) detecting
early or subclinical
infection of said animal if there is a change in the mean temperature of less
than 1 C relative
to the mean temperature of the same anatomical structure in the same animal
pre-infection or
relative to the mean temperature of the same anatomical structure in a
population of
uninfected animals of the same species, background and class. In preferred
embodiments of
the present invention, the anatomical structure of an animal imaged to detect
infection is the
eye or the nose (i. e., a sinus).
The present invention also provides a method for detecting an infection in an
animal
comprising the following steps: (i) obtaining an infrared thermographic image
of the
anatomical structure or a portion thereof of the aninlal; and (ii) detecting
clinical infection of
said animal if there is a change in the mean temperature of greater than 1 C
relative to the
mean temperature of the same anatomical structure in the same aninial pre-
infection or
relative to the mean temperature of the same anatomical structure in a
population of
uninfected aninlals of the same species, background and class.
-9-
SUBSTITUTE SHEET (RULE 26)
CA 02366510 2001-09-21
WO 00/57163 PCT/CAOO/00303
The present invention also provides a method for detecting when a clinical
treatment
for treating an infection in an animal was successful, comprising the
following steps: (i)
obtaining an infrared thermographic image of the anatomical structure of the
animal; and (ii)
detecting the successful treatment of the infection by comparing the mean
temperature of the
anatomical structure of the aninlal to the mean temperature of the same
anatomical structure of
the same animal preinfection or a population of uninfected aninials of the
same species.
The present invention provides a method for detecting a local infection of an
anatomical structure of an animal, comprising the following steps: (i)
obtaining an infrared
thermographic image of an anatomical structure of an animal; (ii) obtaining an
infrared
thermographic image of the symmetrical anatomical structure of the aninial;
(iii) determining
the total temperature of the infrared thermographic images for the symmetrical
anatomical
structures; and (iv) detecting a local infection of an anatomical structure if
the total
temperature of the symmetrical anatomical structures differ by greater than a
predetermined
amount.
The invention also provides a method for detecting a local infection of an
anatomical
structure of an animal, comprising the following steps: (i) obtaining an
infrared
thermographic image of the anatomical structure of an animal; (ii) obtaining
an infrared
thermographic image of the symmetrical anatomical structure of the animal;
(iii) comparing
the infrared thermographic image obtained to an infrared thermographic image
of the
symmetrical anatomical structure of the animal; and (iv) detecting infection
of the anatomical
structure of the animal if there is a relative difference in the temperature
between the
anatomical structure and the symmetrical anatomical structure of the animal.
5.1 INDUCTION MODEL OF MASTITIS
The present invention is based upon the surprising discovery that temperature
differences less than 1 C are clinically significant. This discovery was made
possible, in
part, by employing an induction model of mastitis, which displays a known
etiology, such that
infrared thermal expression could be compared to known outcomes. The use of
the induction
model has many advantages including: (i) the inflammatory agent is known both
in
quantitative and qualitative terms; (ii) the exact time of the onset of
inflammation is known;
and (iii) the exact stage or progression of the inflammation is known.
Furthermore, due to the
unique anatomy of the udder of a cow, the progression of an infected quarter
can be compared
to a non-infected quarter. The udder of a dairy cow is unique in that all four
quarters are
essentially independent in terms of their vascular supply (Sisson, S., The
Anatomy of the
Domestic Aninzal. W.B. Saunders Comp., Philadelphia. 4`' ed. Revised by J.D.
Grossman,
page 618). such that inflammation induced in one quarter of the udder through
the use of a
- 10 -
SUBSTiTUTE SHEET (RULE 26)
CA 02366510 2001-09-21
WO 00/57163 PCT/CAOO/00303
nlastitis induction nlodel does not affect any other quarter of the udder.
Hence, the animal can
act as its own control.
Briefly, in achieving the invention, one quarter of the udder of a test
population of
lactating dairy cattle was infected with Eschei-ichia coli (E. coli) endotoxin
and the time
course of the resulting inflamnlation was followed for several days using a
variety of
analytical tools, including infrared thermography. Over a 72 hour time course,
milk samples
were obtained from the left (induced) and right (non-induced) distal (hind)
quarters of the
udder and analyzed for objective indicators of inflammation by conventional
analytical
procedures. Contemporaneously with the milk samples, infrared thermographic
images of the
cows were obtained, so that the infrared thermal expression of the animal
could be monitored
over the course of the induced inflammation.
It was found that within hours after induction of inflammation, significant
changes in
the thermal expression of the cows could be detected with infrared
thermography. This was
surprising, in that, as discussed previously, conventional thought would
dictate that any
temperature changes occurring in subclinical cases of mastitis would be too
subtle to detect.
Moreover, these changes in thermal expression were observed in all cows in
which
inflammation was induced, indicating that altered thermal expression, as
detected by infrared
thermography, is a reliable indicator of intlamnlation. Significant changes in
infrared thermal
expression included: (i) a temperature increase; (ii) a more rapid rate of
temperature change;
and (iii) swelling of the affected quarter of the udder, resulting in a
reduction in the symmetry
of the thermal expression between the udder quarters with the affected quarter
being both
hotter and larger. In the present invention, one or more of these changes,
detected by infrared
thermography, is used to diagnose inflammation.
In one embodiment of the present invention, mastitis in a mammal is detected
by:
(i) obtaining an infrared thermographic image of a nlammary gland of said
mammal, said
infrared thermographic image providing temperature information about said
mammary gland;
and, (ii) identifying said mammal as having a high probability of having
mastitis if a measure
of said temperature information is greater than a predetermined value by at
least a
predetermined amount. In another embodiment of the present invention, mastitis
in a mammal
having an udder is detected by: (i) obtaining an infrared thermographic image
of one quarter
of the udder of said mammal at time 0, said infrared thermographic image
providing
temperature information about said udder quarter of said mammal; (ii)
obtaining an infrared
thermographic image of the same quarter of the udder of said mammal at a later
tinle, said
infrared thermographic inlage providing temperature information about said
udder of said
mammal; (iii) determining a total temperature for a first inlage, said first
inlage corresponding
to said quarter of the udder of said mammal at tinle 0; (iv) determining a
total temperature for
- 11 -
SUBSTtTUTE SHEET (RULE 26)
CA 02366510 2001-09-21
WO 00/57163 PCT/CAOO/00303
a second image, said second image corresponding to said quarter of the udder
of said
mammal at a later tinie; and (v) identifying said mammal as having a high
probability of
having mastitis if the total temperature for said first image differs from the
total temperature
for said second inlage by greater than a predetermined amount. In yet another
embodiment of
the present invention, mastitis in a mammal having an udder is detected by:
(i) obtaining
images of the two frontal quarters or two rear quarters of the udder of said
mammal; (ii)
determining the total temperature of a first image, said first iniage
corresponding to one
frontal quarter or one rear quarter of the udder of said mammal; (iii)
determining the total
temperature of a second image, said second image corresponding to the other
frontal quarter
or the other rear quarter of the udder of said mammal; and (iv) identifying
said mammal as
having a high probability of having mastitis if the total temperature of said
first image differs
from the total temperature of said second image by greater than a
predetermined amount.
5.2. INDUCTION MODEL OF BVD VIRUS TYPE 2
The present invention is based, in part, on the surprising discovery that mean
temperatures less than 1 C obtained using infrared thermography are indicative
of an
infection. This discovery was made possible by employing an induction model of
a viral
infection displaying a known etiology such that infrared thermographic
expression could be
compared to known outcomes.
Briefly, a population of BVD and infectious respiratory disease (IBR)
seronegative
calves were infected intranasally with BVD type 2 virus (2x10' TCID50 of type
2 strain
24515) and the time course of the resulting infection was followed for
approximately three
weeks. A variety of laboratory tests and clinical scoring procedures were used
including
infrared thermography. In addition, a group of contemporary, uninfected calves
were studied
simultaneously. Biological samples (i.e., blood and saliva samples) and
infrared images
were obtained from infected and uninfected calves about every second day
postinfection.
Statistically significant changes in the mean temperature of anatomical
structures (e.g.,
the eye and nose) of BVD virus infected animals were detected using infrared
thermography
as early as 1 day post-infection and that such changes were often of
magnitudes less than 1 C.
Further, the BVD virus infection was detected using infrared thermography
several days to
one week before it was detected using laboratory tests for objective
measurements of, for
example, acute phase proteins such as haptoglobin, and before it was detected
using
conventional clinical scores.
In one embodiment of the present invention, infection in an animal is detected
by: (i)
obtaining an infrared thermographic image of an anatomical structure of said
animal, said
infrared thermographic image providing temperature information about said
anatomical
- 12-
SU8STITUTE SHEET (RULE 26)
CA 02366510 2001-09-21
WO 00/57163 PCT/CAOO/00303
structure; and (ii) identifying said animal as having a high probability of
having an infection if
a measure of said temperature information is greater than a predetermined
value by at least a
predetermined amount. In another embodiment of the present invention,
infection in an animal
is detected by: (i) obtaining an infrared thermographic image of an anatomical
structure of
said animal, said infrared thermographic image providing temperature
information about said
anatomical structure; (ii) obtaining an infrared thermographic image of the
sanle anatomical
structure of an uninfected animal or a population of uninfected animals, said
infrared
thermographic inlage(s) providing temperature information about said
anatomical structure;
and (ii) identifying the animal in step (i) as having a high probability of
having an infection if
a measure of the temperature information in step (i) is greater than the
temperature
information in step (ii).
5.3. INFRARED THERMOGRAPHIC CAMERA
Capturing reliable infrared data from live animals is a technical and
operational
challenge. Moving conscious animals to designated analytical or assessment
rooms where
equipment, monitors and data collection are fixed permanently, is not always
possible. In
fact, handling and management procedures by themselves can be stressful to
animals resulting
in non-steady state or aberrant temperature profiles. Hence, the animal
technician or camera
operator is often required to move to the animal's environment. Therefore,
utilizing a user
friendly infrared camera that is installed in the animal's environment or that
is portable is an
advantage when capturing infrared data from live animals.
In one embodiment of the invention, the infrared thermographic camera is held
and
operated with one hand, which is a significant advantage when obtaining
infrared
thermographic inzages of an anatomical structure of animals. In a preferred
embodiment, the
portable, hand held camera is light enough to be managed easily. In another
embodiment, the
infrared thermographic camera is installed in the aninial's environment (e.g.,
a barn). In
another preferred embodiment of the invention, the infrared thermographic
camera: (i) is
designed to operate and function optimally within the range of temperatures
normally
anticipated in animals displaying inflammation (25 C to 35 C) without
recalibration; (ii) is
capable of resolving temperature differences of less than 1 C; (iii) has a
lens focal length that
is optimal for use in closer ranges with animals (e.g., I'ocal length = 6
centimeters to infmity);
(iv) has a wavelength range of 5 to 14 m; (v) is encased in a hardened, water
resistant case,
which is compatible for the capture of data in animal environments; (vi) has a
flip out display
for accurate viewing of the image; and (vii) is capable of compact data
storage in the
instrument and/or linkage to peripheral monitors. In the examples described,
the Inframetrics
- 13-
SUBSTITUTE SHEET (RULE 26)
CA 02366510 2001-09-21
WO 00/57163 PCT/CAOO/00303
760 broadband camera (Inframetrics Co. North Billercia, MA) was used to obtain
the
infrared thermographic images.
5.4. PROTOCOL FOR INFRARED THERMOGRAPHIC IMAGING
For predicting the early onset of inflammation, each animal or animals
suspected of
presenting inflammation in a population are scanned from about 1-3 meters
away. For
detection of inflammation due to mastitis, the preferred range is 175 cm.
Infrared
thermographic inlages of all non-human animals are collected preferentially
from the distal
(hind) view showing a clear display of the back two quarters. However, other
images such
as the ventral or lateral view would also have utility.
Environmental factors such as motion, extraneous radiant energy, and ambient
temperature must be controlled when using infrared themiography to detect
inflammation.
Motion, for example, can be controlled by immobilizing the animal (e.g., a cow
can be tied
with a neck chain). Preferably, the animals should be at rest when the
infrared images are
obtained and should not be experiencing the thermal effects resulting from the
digestion of
food when the infrared images are obtained. Infrared thermographic images
should be
obtained under cover and shielded from the sun. Preferably, the ambient
temperature of the
environment should be within the aninlals thermal neutral zone, which is
typically between
C and 30 C. Artifacts such as debris on the surface of the animal, scar
tissue, irregular
20 patterns of hair length, liniment and wraps should be eliminated to avoid
interference with the
infrared thermographic image(s). The animal also should be acclimated to the
site of the
examination for at least ten minutes prior to the examination. In a preferred
embodiment, the
infrared images should be obtained at the same time of day such that circadian
and diurnal
rhythm is taken into account.
5.5. INTERPRETATION OF INFRARED THERMOGRAPHIC IMAGES
The thermal expression of an animal is determined by obtaining infrared
thermographic images. As used herein, the term "infrared thermographic image"
is meant to
include a scan output in the form of either or both a visual image and
corresponding thermal
or temperature data. The output from infrared cameras used for infrared
thermography
typically provides an image comprising a plurality of pixel data points, each
pixel providing
a temperature data point that can be further processed by computer software to
generate, for
example, mean temperature for the image, or for a discrete area of the image,
by averaging the
data points over the number of pixels.
It will be appreciated by those of skill in the art that an infrared
thermographic image,
comprising a plurality of pixels, provides a large number of temperature data
points.
- 14-
SUBST(TUTE SHEET (RULE 26)
CA 02366510 2008-05-30
Therefore, before comparing the temperature information to a predetermined
value,
determining a rate of temperature change, or determining a difference in total
temperature, it
is useful to obtain some measure that is representative of the entirety of the
temperature
information provided by an infrared thermographic image or a part thereof.
Selected
measures for the temperature information derived from each infrared
thermographic image
for the subject animal are determined by statistical techniques known in the
art. Preferred
measures include measures of central tendency, measures of dispersion, and
measures of total
temperature.
The term "measure of central tendency" as used herein is a statistical measure
of a
point near the center of a group of data points; without limitation, the term
includes the mean,
median, and mode. The term "measure of dispersion" as used herein is meant to
include
statistical measures of spread from the measure of central tendency for the
group, and include,
without limitation, variance, standard deviation and coefficient of variation.
Definitions of
these statistical terms may be found in standard statistics texts, such as
Steel and Torrie
(1960) R.G.D. Steel and J.H. Tonie, McGraw Hill Company, Inc., NY, which
definitions are
applied here. As used herein, the term "total temperature" means a measure of
the central
tendency for the temperature information from an infrared thermographic image
x image area
or image volume expressed in pixels (e.g., if the mean temperature = 20 C and
the image is
equal to 200 pixels, then the total temperature = 20 C x 200 pixels = 4000
pixels).
An uncalibrated, digitized thermographic image may consist of, for example,
135 X
256 pixels. In analyzing the thermographic image, the relative radiant surface
temperature
represented by each pixel of the uncalibrated image may be represented by
assigning each
pixel a numerical value in the range from, for instance, 0 to 255. The pixel
values are
mapped to actual Celsius temperature by relating them to the maximum and
minimum
temperature settings of the infrared camera through the following formula:
Actual Temperature = (max temp setting-min temp setting) X nixel value
256
To assist a human operator in viewing the infrared thermographic images on a
computer monitor, pseudo colours can be generated by assigning a specific
colour to all
pixels with temperature values within a certain range.
The entire thermographic image may be processed. In a preferred embodiment,
only
data for a part of the image corresponding to the area of interest of the
animal is analyzed.
Known computer analysis procedures, such as planometry, can be used to
restrict the image
analysis to the selected area of interest of the animal (e.g., a fixed "box"
area can be applied
around the eyes for a group of animals of interest). For each infrared
thermographic image
CA 02366510 2001-09-21
WO 00/57163 PCT/CAOO/00303
obtained for an animal, the image area and the selected image temperature
statistics are
calculated. Selected statistical measures of the temperature information (each
pixel in the
infrared thermographic iniage providing a temperature data point), such as the
mean, median,
mode, standard deviation, variance, and coefficient of variation can be
determined by well-
known statistical techniques such as those described by Steel and Torrie
(1980). Suitable
software for analyzing the thermographic images include Thermogram- image
software
(Inframetrics, Inc,. North Billercia, MA) and Viewscan- Software (Viewscan
Ltd., Concord,
ON.). Mathematical models using such analytical approaches as neural nets can
also utilized
to analvze the thermographic image.
In one embodiment of the present invention, temperature differences between
symmetrical anatomical structures are compared to detect inflammation. For
example, the
lack of symmetry between affected and non-affected quarters of an cow's udder
can be used
to detect mastitis. In a preferred embodiment, the area or volume information
is combined
with the infrared thermographic temperature to better discern the lack of
symmetry between
the affected and the non-affected anatomical structure. The area or volume
represented by
selected portions of the infrared thermographic inlages can be determined by
known
techniques.
In an embodiment of the present invention, inflammation of an anatomical
structure of
an animal is detected if a measure of temperature information for an infrared
thermographic
image of an anatomical structure of the animal differs by at least a
predetermined amount or a
statistically significant amount from a predetermined value. In another
embodiment of the
present invention, infection in an animal can is detected if a measure of
temperature
information of an anatomical structure differs by at least a predetermined
amount or a
statistically significant amount from a predetermined value. The predetermined
value may
represent published conventional temperature data representing animals of the
same species
as the subject animal, which can be adjusted to reflect infrared thermographic
temperature
values. Alternatively, the predetermined value may be an arbitrary value, the
value having
been determined through trial and error to be useful for detecting
inflammation or infection of
an anatomical structure of an animal. Preferably, the predetermined value
represents an
equivalent measure of temperature information for infrared thermographic
images of the
particular anatomical structure obtained for members of a population of the
same species of
aninial being examined when there was no inflammation or infection of the
anatomical
structure. More preferably, the predetermined value represents an equivalent
measure of
temperature information for one or more infrared thermographic images of the
aninlal
obtained at a time when there was no inflammation or infection of the
anatomical structure of
the animal, and more preferably, when the aninlal was healthy.
- 16-
SUBSTITUTE SHEET (RULE 26)
CA 02366510 2001-09-21
WO 00/57163 PCT/CAOO/00303
In a preferred embodiment, a change in the mean temperature of less than 1 C
of an
anatomical structure relative to the mean temperature of the same anatomical
structure of the
same animal or a population of animals of the same species obtained from
infrared
themlographic images taken when there was no inflammation of the anatomical
structure
indicates early or subclinical inflammation. In another preferred embodinient,
a change in the
mean temperature of greater than 1 C of an anatomical structure relative to
the mean
temperature of the same anatomical structure of the same animal or a
population of aninlals of
the same species obtained from infrared thermographic images indicates late
stage
development of inflammation. In another preferred embodiment, inflammation of
an
anatomical structure of an animal is detected if the mean of the temperature
information
obtained from the infrared thermographic image is preferably greater than 0.2
C, more
preferably greater than 0.1 C the mean of the temperature information for
previously obtained
infrared thermographic images of the same animal when there was no
inflammation of the
anatomical structure. In yet another preferred embodiment. inflammation of an
anatomical
structure of an animal is detected if the mean of the temperature information
obtained from the
infrared thermographic inlage is preferably greater than 0.2 C, more
preferably greater than
0.1 C the mean temperature obtained from infrared thermographic images for
the same
anatomical structure of the same species of animal when there was no
inflammation of the
anatomical structure.
In a preferred embodiment, a change in the mean temperature of less than I C
of an
anatomical structure relative to the mean temperature of the same anatomical
structure of the
same animal preinfection indicates early or subclinical infection. In a
preferred embodiment,
a change in the mean temperature of less than 1 C of an anatomical structure
relative to the
mean temperature of the same anatomical structure of one or more uninfected
animals of the
same species indicates early or subclinical infection. In a preferred
embodiment, a change in
the mean temperature greater than 1 C of an anatomical structure relative to
the mean
temperature of the same anatomical structure of the same animal preinfection
indicates
clinical infection. In yet another preferred embodinient, a change in the mean
temperature
greater than 1 C of an anatomical structure relative to the mean temperature
of the same
anatomical structure of one or more uninfected animals of the same species
indicates clinical
infection.
In another embodiment, the rate of change in temperature (not the absolute
value per
se) of an anatomical structure of an animal relative to the rate of change in
temperature of the
same anatomical structure in the animal preinfection indicates infection. In
another
embodiment, the rate of change in temperature (not the absolute value per se)
of an
anatomical structure of an aninlal relative to the rate of change in
temperature of the same
-17-
SUBSTtTUTE SHEET (RULE 26)
CA 02366510 2001-09-21
WO 00/57163 PCT/CAOO/00303
anatomical structure of one or more uninfected animals of the same species
indicates
infection. In another embodinlent, infection of an anatomical structure of an
animal is
detected if the mean of the temperature information obtained from the infrared
thermographic
inlage is preferably greater than 0.2 C, more preferably greater than 0.1 C
the mean of the
temperature information for previously obtained infrared thermographic images
of the same
anatomical structure of the same animal preinfection. In yet another
embodiment, infection of
an anatomical structure of an animal is detected if the mean of the
temperature information
obtained from the infrared thermographic image is preferably greater than 0.2
C, more
preferably greater than 0.1 C the mean temperature obtained from infrared
thermographic
images for the same anatomical structure of one or more uninfected animals of
the same
species.
In another embodiment of the present invention, inflammation or infection of
an
anatomical structure is detected if a measure of temperature information for
an infrared
thermographic image of an anatomical structure of the animal is equivalent to
or greater than
the predetermined value for the anatomical structure of the aninlal.
Preferably, the
predetermined value represents the mean temperature obtained from infrared
thermographic
images of the same anatomical structure in members of the same species of an
animal when
there is inflammation or an infection.
In another embodiment of the present invention, inflammation or infection of
an
anatomical structure of an animal is detected if the change in temperature
obtained by
successive infrared images of the same anatomical structure of the same animal
is greater than
a predetermined rate, preferably greater than a rate of 0.1 C/hour.
Preferably, successive
infrared images of an anatomical structure of an animal are taken every 10, 30
or 60 minutes.
In a further embodiment of the present invention, inflammation of an
anatomical
structure of an animal is detected if the total temperature of a section of an
infrared
thermographic inlage corresponding to one anatomical structure of the animal
differs by more
than a predetermined amount, preferably 10%, from the total temperature of a
section of the
infrared thermographic image corresponding to the symmetrical anatomical
structure of the
aninlal. The total temperature preferably represents the area or volume of the
relevant image
section, which can be represented as a number of pixels, multiplied by the
mean pixel
temperature.
In an embodiment of the present invention, area or volume information alone,
independent from temperature information, can be used to detect inflammation
of an
anatomical structure of an aninial. Inflammation of an anatomical structure of
an aninial is
detected if the area or volume of a section of an infrared thermographic image
corresponding
-18-
SUBSTITUTE SHEET (RULE 26)
CA 02366510 2001-09-21
WO 00/57163 PCT/CAOO/00303
to one anatomical structure of the animal differs by more than a predetermined
amount,
preferably 10%, from the area or volume of a section of the infrared
thermographic image
corresponding to the symmetrical anatomical structure of the animal.
The infrared thermographic temperature information can be normalized or
standardized by compensating the temperature information to account for one or
more of the
following: (i) the state of lactation of the aninlal; (ii) the state of parity
of the animal; (iii) the
circadian temperature variation; (iv) the diurnal temperature variation; (v)
the animal breed;
(vi) the animal housing conditions; or (vii) the geographic location. An
adjustment for the
state of lactation of an animal would be useful for normalization because
animals in early
lactation typically have a higher milk production and hence larger udders. An
adjustment for
the state of parity of an animal would also be useful for normalization
because cows, for
example, typically in their third or fourth parity will have larger udders
than cows in their
first parity. Adjustments to normalize the infrared thermographic data
depending on when an
animal is observed during the day should be performed because an animal's
normal
temperature will fluctuate over a 24 hour period. The temperature change
during the day will
also vary with the time of day a cow is milked, hence, a normalization scale
would be useful.
Adjustments to normalize infrared thermographic data obtained from different
breeds of
animals should be performed because of differences in their anatomical
structures.
Furthermore, adjustments to normalize the infrared thermographic data obtained
from animals
housed differently (e.g., in barns with concrete floors versus in barns with
rubber matts) and
in different geographic locations (e.g., Edmonton versus Orlando) should be
performed.
5.6. INFLAMMATORY DISORDERS AND INFECTIOUS DISEASES
In one embodiment, inflammatory diseases in an animal, preferably a mammal and
most preferably a human are detected using infrared thermography. Examples of
inflammatory diseases include, but are not limited to, systemic lupus
erythematosus,
rheumatoid arthritis, acute respiratory distress syndrome, asthma,
osteoporosis, Crohn's
disease, reactive arthritis, Lyme disease, multiple sclerosis, contact
dermatitis, psoriasis,
graft rejection, graft versus host disease, and sarcoidosis. In another
embodiment, diseases
or disorders that induce an inflammatory response in an animal are detected by
infrared
thermography. Examples of such diseases and disorders include, but are not
limited to,
allergic rhinitis, gastrointestinal allergies, food allergies, eosinophilia,
conjunctivitis, and
glomerular nephritis.
In another embodiment, infectious diseases in an animal, preferably a mammal
and
most preferably a human are detected using infrared thermography. Infectious
diseases
include diseases associated with yeast, fungal, viral and bacterial
infections. Viruses causing
-19-
SUBSTtTUTE SHEET (RULE 26)
CA 02366510 2001-09-21
WO 00/57163 PCT/CAOO/00303
viral infections include, but are limited to. BVD virus. herpes sinlplex virus
(HSV), hepatitis
B virus (HBV), hepatitis C virus (HCV), human T-cell lynlphotrophic virus
(HTLV) type
land II, human immunodeficiency virus (HIV), cytomegalovirus. papilloma virus,
polyoma
viruses, adenoviruses, Epstein-Barr virus, poxviruses, influenza virus,
measles virus, rabies
virus. Sendai virus, poliomyelitis virus, coxsackieviruses, rhinoviruses,
reoviruses, and
rubella virus. Bacterial pathogens causing infections include, but are not
limited to,
Streptococcats pyogenes, Streptococcus pneumoniae, Neisser=ia gonorrhoea,
Neisseria
rnen.ingitidis, Corvnebacteriitm diphtheriae , Clostridiiam botulinaim,
Clostriditisin
peifr=in.gens, Clostridium tetani, Haernophilits inflatenzae, Klebsiella
pneatmoniae,
Klebsiella ozaenae, Klebsiella rhinoscleromotis, Staphylococcaas aureus,
Vibrio cholerae,
Escher=ichia coli, Psetadonzonas aeruginosa, Calnpylobacter (Vibrio) fetats,
Cainpylobacter
jejtani, Aeromonas hydrophila, Bacillars cereats, Edwardsiella tarda, Yersinia
enterocolitica, Yersinia pestis, Yersinia pseaidotuberculosis, Shigella
dysenteriae, Shigella
flexn.eri, Shigel,la sonnei, Salinon.ella typhimztriuin, Ti-eponema
pallidaiin., Ti-eponema
Pertenue, Treponema carateneuin, Borr=elia vincentii, Borrelia btergdorferi,
Leptospira
icterohemorrhagiae, Mycobacteritfm tubercctlosis, Toxoplasina gondii,
Pneuinocystis
carinii, Francisella tularensis, Brucella abortats, Brucella suis, Brucella
melitensis,
Mycoplcrsma spp., Rickettsia prowazeki, Rickettsia tsutstagatrnushi,
Chlamyclia spp., and
Helicobacter pylori.
6. EXAMPLE: DETECTION OF MASTITIS USING
INFRARED THERMOGRAPHY
In order that the invention described herein may be more fully understood, the
following examples are set forth. It should be understood that these examples
are for
illustrative purposes only and are not to be construed as limiting this
invention in any manner.
MATERIAL & METHODS
Twenty mature lactating Holstein cows at 120 days post-partum were housed at
the
Agriculture and Agri-Food Canada Dairy Research Unit at Lennoxville, Quebec,
and were
managed in a manner consistent with and representative of the dairy industry
in North
America, and in compliance with the Canadian Council of Animal Care
Guidelines. The left
distal quarter of the udder of each animal was infused with 10 g of E. coli
endotoxin
(serotype 055:B5, Sigma-Aldrich Co.) in 10 ml of sterile saline.
- 20 -
SUBSTiTUTE SHEET (RULE 26)
CA 02366510 2001-09-21
WO 00/57163 PCT/CAOO/00303
Fifteen of the cows were additionally treated with experimental inflammation
inhibitors. The twenty cows were divided into four treatment groups of five
animals each as
follows: (i) control, no prophylactic treatment; (ii) aminoguanidine
introduced into the
cistern of the infected teat; (iii) arginine methyl ester introduced into the
cistern of the
infected teat; and (iv) dexamethasone introduced into the cistern of the
infected teat. The
treatments were applied in an effort to attenuate the mastitis response.
Milk samples from the control (right distal) and induced (left distal)
quarters of each
animal were collected at 13 hours and 1 hour pre-induction and also at 2, 6,
9, 12, 24, 36, 48,
60 and 72 hours post-induction. The milk samples were analyzed for objective
indicators of
mastitis by conventional analytical procedures as discussed hereinafter.
Infrared
thermographic inlages of both distal quarters were simultaneously taken at
these times and at
0.5, 1, 1.5, 2 and 2.5 hours post-induction. An Inframetrics 760T,"' broadband
camera
(Inframetrics Inc., North Billerica, MA) fitted with a 0.5 X lens was used to
collect the
infrared images. Working indoors, i.mages of the posterior surface of the
udder of each
aninial were obtained from a distance of 2.1m. The Images were recorded on
videotape with
a videocassette recorder. The analog Images were captured and digitized using
a computer
equipped with a Matrox MeteorP,1 video card (Matrox Electronic Systems Ltd.,
Montreal,
Quebec, Canada). The images were saved as bitmap files using Corel DrawTM
(Corel
Corporation, Ontario, Canada). The bitmap images were calibrated and the udder
manually
traced to identifv the left and right halves of the udder. The image area in
number of pixels,
and the minimum, maximum and average temperatures, and the standard deviation
of the
average temperature were recorded and tabulated. Analysis of the data was
performed using
the computer programs ExcelTM (Microsoft Corp., Redmond, Washington, USA) and
SASTM
(SAS Institute Inc., Cary, North Carolina, USA).
The progression of mastitis development was objectively monitored using
conventionally known tests such as the somatic cell count in the milk samples
(Batra, T.R.
and McAllister. A.J., 1984, J. Anini. Sci. 64: 305-312), BSA (Fernando, R.S.
et al., 1985, J.
Dairy Sci. 449-456), body temperature (Maatje, K. and Rossing, W., 1991,
Mastitis
Newsletter 16: 6-7), and presence of the enzyme N-acetyl-beta-D-
glucosaminidase
(NAGase) in the milk samples. NAGase is a lysosomal enzyme secreted in the
mammary
gland during inflammation. The presence of NAGase in milk is an indication of
tissue
damage (Perdigon. G. et al., 1986, J. Dairy Sci. 69: 27-31; Fang, W. et al.,
1995, J. Dairy
Sci. 79: 76-82; Losnedahl, K.J. et al., 1996, Illinois Dairy Report 1-4; Fang,
W. and Pyorala,
S., 1996, J. Dairy Sci. 79:76-82). By simultaneously testing standard
indicators of mastitis
and obtaining infrared thermographic images, it was possible to monitor the
precise change in
infrared characteristics parallel to the standard test results.
-21-
SU STITUTE SHEET (RULE 26)
CA 02366510 2001-09-21
WO 00/57163 PCT/CAOO/00303
RESULTS
The results are presented in tabular form in Tables 1 and 2, and in graphical
form in
Figures 1-9. The treatments with experimental inflammation inhibitors were
largely
ineffective, and did not significantlv change the mastitis response.
Therefore, the data in
Tables 1 and 2, and Figures 1-9, is not presented separately for each of the
anti-inflammation
treatment groups. Figures 6-9 provide least square means of data for the 20
animals tested.
Figures 6-8 show separately the results obtained from one of the 20 animals
tested, the
individual animal (reference no. 5029) showing a false-negative result for
mastitis when
measured by rectal temperature rather than by infrared thermography. The same
infrared
thermographic ("IRT") data is depicted in each of Figures 1-4, plotted along
with data
obtained from various known techniques for detecting mastitis. Figure 9
provides the IRT
data presented in the form of total temperature (mean temperature x image area
or volume).
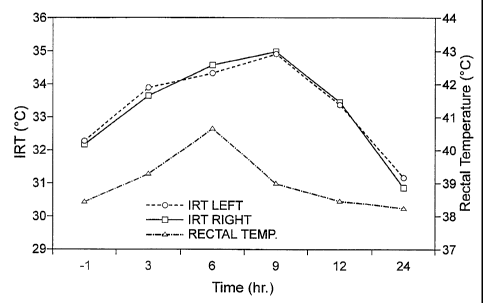
The results are most readil_y understood with reference to the figures. Figure
1 shows
the mean temperature of the infrared thermographic image of the left distal
quarter of the
udder (induced) and the mean temperature of the infrared thermographic image
of the right
distal quarter of the udder (control) plotted over a 24 hour time course,
together with rectal
temperature plotted over the same time frame. Based upon the results depicted
in Figure 1,
the IRT data for the left and right distal quarters of the udder is very
similar, although mastitis
was induced only in the left distal quarter. One possible explanation for this
is that the high
heat transfer capacity through the water found in living cells accounts for
the even
temperature distribution observed between the distal quarters of the udder.
The results from
Figure 1 also indicate that the absolute change in temperature detected by IRT
is greater than
that detected by measurement of rectal temperature, and that the rate of
temperature change
detected by IRT is greater than that detected by measurement of rectal
temperature. The
results in Table 1 indicate that the infrared thermographic image of the udder
detected a
statistically significant temperature difference (p < 0.05) by the 1 hour
point after mastitis
induction, whereas a significant difference in rectal temperature was not
detected until much
later (the 6 hour point after mastitis induction).
Figures 2, 3 and 4 plot the same IRT temperature information as in Figure 1,
together
with various standard measurements used in the detection of mastitis. Figure 2
shows the
NAGase levels in the left and right distal udder quarters over the first 24
hours after
induction of mastitis in the left distal quarter. As expected, the NAGase
level in the left
distal quarter increased sharply, indicative of mastitis, while there was
little change in the
NAGase level in the right distal quarter. As discussed earlier, given the
separate vascular
supplies of the quarters of the udder in cattle, an increase in NAGase level
in the non-induced
quarter would not be expected. Figures 8 and 9 depict similar results,
showing, respectively,
-22-
SUBSTiTUTE SHEET (RULE 26)
CA 02366510 2001-09-21
WO 00/57163 PCT/CAOO/00303
a significant increase in BSA level and somatic cell count in the left distal
udder quarter and
little or no change in the right distal quarter. Figures 7. 8 and 9 indicate
that the mastitis
induction model was indeed successful in inducing mastitis in the treated
udder quarter,
detectable by objective identifiers of mastitis, and that mastitis was also
detected by IRT.
Figures 6, 7 and 8 emphasize the superior results that can be achieved by the
methods
of the invention over other temperature measurement techniques. These figures
provide data
for one of the test animals (animal no. 5029), in which rectal temperature
remained nearly
unchanged over the first 24 hours after induction of mastitis, whereas mean
udder temperature
as measured by IRT, changed significantly (Figure 6). Hence, in an animal in
which
measurement of rectal temperature disclosed a false-negative result, IRT of
the udder
correctly detected induced mastitis. Confirmation of induction of mastitis in
animal no 5029
is documented in Figures 12 and 13 which show, respectively, significantly
increased
NAGase and BSA levels in the left distal quarter (induced) relative to the
right distal quarter
(non-induced).
Figure 5 shows the change in udder quarter area, as represented by number of
pixels
in an IRT image, for left (induced) and right (non-induced) distal udder
quarters for 20
animals over the 24 hour period after mastitis induction. The data in Figure 5
is independent
of temperature, and only refers to the number of pixels in a defined area of
the image. It is
apparent in Figure 5 that the swelling of the left distal quarter of the udder
relative to the right
distal quarter (resulting in a lack of symmetry) as a result of mastitis
induction was readily
detected from the IRT image.
Figure 9 combines IRT image area and mean image temperature as a total
temperature
(mean pixel temperature x number of pixels). In Figure 1, there was a very
close symmetry
between the IRT temperature of the left distal quarter and that of the right
distal quarter,
presumably due to the high heat transfer capacity of living cells. Conversely,
in Figure 9, the
left distal quarter (induced) exhibits a.much higher total temperature than
the right distal
quarter (non-induced). The temperature information remains the same as in
Figure 1, but the
greater area of the portion of the image representative of the left distal
quarter of the udder
relative to the area of the right distal quarter (as a result of swelling in
response to mastitis)
is reflected in the total temperature measurement.
Referring again to Figure 1 and to Table 1, it will be appreciated that the
mean IRT
image temperature at the time - I h(1 hour before induction of mastitis)
reflects the IRT
image temperature of the udder when the animals do not have mastitis, and
therefore acts as a
control IRT temperature for the animals in a healthy state. In the period from
3 hours post-
mduction and 12 hours post-induction, the mean IRT temperature for both the
left and right
hind udder quarters for the 20 aninlals was less than 1 C greater than the
control value of
-23-
SUBSTITUTE SHEET (RULE 26)
CA 02366510 2001-09-21
WO 00/57163 PCT/CAOO/00303
32.19 C. Hence, an IRT udder temperature less than 1 C greater than a control
value for an
animal in a healthy state is indicative of mastitis in a subject mammal.
Figure 1 and Table 1 shows that, during the first 24 hours after induction of
the
mastitis model, mean IRT temperature for both the left and right distal udder
quarters for the
20 animals tested changed at a rate of at least 0. 1 C per hour, whether
increasing or
decreasing. Hence, a rate of change of IRT temperature of at least 0.1 C per
hour is
indicative of mastitis in a subject mammal.
Figure 5 shows that during the first 24 hours after induction of mastitis in
the left
distal quarter of the udder, the area of the portion of the inlage
corresponding to the induced
quarter is at least 10% greater than that of the non-induced (control) right
distal quarter of the
udder. Thus, if the area of a portion of the image corresponding to a first
quarter of the udder
of the animal differs from the area of a portion of the image corresponding to
a second quarter
of the udder of the animal by greater than 10%, this is indicative of mastitis
in the animal.
Similarly, referring to Figure 9 and Table 2, during the first 24 hours after
induction
of mastitis in the left distal quarter of the udder, the total temperature
(mean pixel temperature
x number of pixels) of the portion of the image corresponding to the induced
quarter is at least
10% areater than that of the non-induced (control) right distal quarter of the
udder. Thus, if
the total temperature of a portion of the image corresponding to a first
quarter of the udder of
the animal differs from the total temperature of a portion of the image
corresponding to a
second quarter of the udder of the animal by greater than 10%, this is
indicative of mastitis in
the animal.
7. EXAMPLE: DETECTION OF INFECTION USING
INFRARED THERMOGRAPHY
Fifteen British cross heifers seronegative for BVD and IBR were weaned from
the
main herd following standard Animal Disease Research Institute (ADRI;
Lethbridge, Alberta)
protocol and allocated to one of two treatment groups balanced by weight, body
condition,
age, coat color and hair condition. The two treatment groups consisted of: (1)
five control,
uninfected animals; and (2) ten BVD virus infected aninlals. The calves were
housed in
groups of five in three separate environmentally controlled rooms and the body
weights of the
calves were collected before the study began and after the study ended.
All of the calves were given a balanced alfalfa and barley ration which was
designed
to 1.5 tinles maintenance based on NRC recommendations, and all calves were
given ad
libitum access to fresh water. Further, a rubberized mat bedding was provided
for the
animals to lay upon. The three animal rooms used in the study were all kept at
a constant
- 24 -
SUBSTtTUTE SHEET (RULE 26)
CA 02366510 2001-09-21
WO 00/57163 PCT/CAOO/00303
temperature and humiditv (approxinlately 24 C and 28 % humidity) with
barometric
pressure held constant. Lighting was adjusted to simulate normal daylight and
darkness (12
hours of light and 12 hours of dark). The calves were weaned and placed into
their isolation
rooms for a period of 14 days prior to infection with BVD virus to allow the
animals to
acclimatize to the rooms, people and procedures.
A hand held portable Inframetrics broadband 760 camera was used to collect
infrared
thermographic inlages. Infrared thermographic images were captured for all of
the animals at
a fixed time every day. Lateral eye images consisting of the eye orbital
socket plus
approximately 1 cm around the socket were captured daily. Frontal nose
infrared
thermographic images consisting of approximately 3 cn' located immediately
between and
above the nostrils were obtained daily. Frontal ear infrared thermographic
consisting of an
area approximately 2 cn' in the middle of the inner ear surface were obtained
daily. Left
side (lateral) infrared thermographic inlages representing about 20 %. of the
animal's total
surface area were obtained. While this lateral image does not contain many
thermoregulatory
sites the side is nonetheless, like the dorsal image, representative of an
average surface
infrared temperature. Dorsal infrared thermographic images consisting of a
square area
representing approximately 35000 pixels or probably 15 % of the aninlals
surface area were
also obtained daily.
Aninlals were not captured when imaged but instead a technician walked around
the
animals to obtain the infrared thermographic images. Further, two separate
Inframetrics
cameras were used to obtain the infrared thermographic inlages of the control
aninials and the
BVD virus infected aninials.
In addition to the infrared measurements taken, clinical and physiological
measurements were taken on days 0, 3, 6, 9 and 12 postinfection. The calves
were captured
in a head gate and 10 ml of blood was collected in a vacutainer by venus
puncture. From this
blood sample, measurements of differential blood cell counts, cortisol, IgA
and basic
hematology (CBC) were performed. Also, viral titer and serological assays were
performed.
Further, health clinical scores were monitored on all of the calves daily
using the score
system developed by ADRI (Table 3).
All of the animals were humanely euthanized toward the end of the disease
course.
Necropsy was performed on all aninials using established scoring procedures.
RESULTS
Infrared Thermo~2raphic Images of the Eye of Calves
As evident from the results in Table 4, eye infrared temperatures in aninials
infected
with BVD virus increased throughout the BVD disease course relative to the eye
infrared
-25-
SUBSTITUTE SHEET (RULE 26)
CA 02366510 2001-09-21
WO 00/57163 PCT/CAOO/00303
temperatures for the same aninials preinfection. Statistically significant
increases in the eye
temperature (0.9 C, p<0.01) were observed as early as one day postinfection
and a
maxinlum separation of 2.6 C from controls was obtained. In contrast to the
early changes
detected using infrared thermo-raphy, the presence of virus specific antibody
was not
detectable until5 or 6 days postinfection and statistically significant
changes in clinical
scores were not evident until eight days postinfection (Table 5). Further,
there was no
statistically significant evidence of changes in objective measures of disease
such as
haptoglobin until 10 days postinfection.
In comparison to the control aninlals, the BVD virus infected calves did not
show any
consistent signs in eye temperature increase until 4 days postinfection. The
eye temperatures
for the BVD virus infected aninlals obtained a maximum separation of over 2 C
by day 10
postinfection. The increases in the mean temperatures of the eye of BVD virus
infected
animals proved to be statistically significant and were obtained several days
before
significant differences in clinical scores were observed. Further, when
clinical scores were
high enough to verify the presence of BVD, a Spearman Ranking test indicated
that animals
with the highest clinical scores were also the animals with the highest
infrared eye
temperature (P<0.05). Therefore, the eye temperatures obtained using infrared
thermography
indicate that infrared thermography can be used to detect infection several
days to one week
prior to detection using conventional subjective (clinical scores; Table 5) or
objective
measurements such as haptoglobin (Table 6).
Infrared ThermoLraphic Images of the Nose of Calves
As evident from the results in Table 7, the nose infrared temperatues for the
BVD
virus infected calves began to elevate significantly as early as 4 days
postinfection.
Compared to their control, preinfection temperatures, the BVD virus infected
animals
displayed a change in temperature (i.e., delta T value) of just under 4 C by
9 to 10 days
postinfection. The BVD virus infected animals displayed a delta T value of 4.6
C compared
to uninfected control animals. Similar to the eye temperatures, the delta T
values obtained for
the nose were statistically significant compared to either the animals own
initial preinfection
temperature or to control animals on comparative days. Thus, the nose
temperatures
measured using infrared thermography in the BVD virus infected animals
demonstrate that
temperature changes detected by infrared thermography parallel the changes
seen in the
course of an infectious disease. Further, these results demonstrate that
infrared thermography
can be used to detect infection several days earlier than clinical scores
(Table 5) or objective
biological measurements for infection such as haptoglobin (Table 6).
-26-
SUBSTITUTE SHEET (RULE 26)
CA 02366510 2001-09-21
WO 00/57163 PCT/CAOO/00303
Infrared Thermographic Images of the Ear of Calves
As evident from the results in Table 8. ear temperatures for the BVD infected
animals
started to increase as early as 1 to 2 days postinfection and a maxinlum delta
T value of
approxinlately 4 C for mean temperatures 10 days postinfection. This was one
of the largest
delta T values obtained for any of the anatomical structures measured.
However, consistent
with the fact that ears are known to be involved in more acute
thermoregulation in a
homeothermic animal, the ear temperatures obtained were highly variable. The
variation in
the ear temperatures obtained was the greatest in the BVD virus infected
animals. Despite the
large, statistically significant delta T values obtained when comparing BVD
virus infected
aninlal temperatures to preinfection, baseline temperatures, the delta T
values obtained when
comparing BVD virus infected animal temperatures to control, uninfected animal
temperatures were not high. Further, unlike eye temperatures, the ranking
statistics were not
highly significant for ear temperatures.
Thus, ear temperature measurements using infrared thermography in BVD infected
animals parallel the course of the disease. Further, ear temperature
measurements using
infrared thermography are at least as indicative of illness as clinical
scores. However, the
high degree of variability in ear temperatures suggests that infrared
thermographic images of
this particular anatomical structure would be less reliable for early
detection of an infectious
disease.
Infrared Thermograhic Imaaes of the Left Side of Calves
The data presented in Table 9 indicates that the lateral temperature changes
obtained
using lateral infrared thermographic images are not as sensitive or revealing
as the eye or
nose temperature changes for the detection of infection. Further. the lateral
infrared data was
somewhat variable compared to the eye or nose infrared data obtained.
Nonetheless, as with
the eye infrared data, the lateral images demonstrated that compared to their
own control
temperatures on the day of infection, the BVD virus infected cattle showed a
statistically
significant increase in infrared temperature as early as one day
postinfection. Statistically
significant changes in the mean temperature as determined using infrared
thermography were
detected as much as 5 to 7 days before significant statistical changes in
subjective clinical
scores (Table 5) or objective biological scores such as haptoglobin (Table 6)
were evident.
Statistically significant differences in the mean temperature in BVD virus
infected
cattle compared to the mean temperature in uninfected control animals was
detected at about
8 days postinfection or about the time when the earliest clinical symptoms
were beginning to
appear. Nonetheless, the lateral infrared data demonstrates that infrared
thermography can be
-27-
SUBSTITUTE SHEET (RULE 26)
CA 02366510 2001-09-21
WO 00/57163 PCT/CAOO/00303
used to identify animals with an infectious disease at the very least as early
as the earliest
clinical scores and in many cases, one to several days before the presence of
clinical scores.
Infrared ThermoLyraphic Images of the Dorsal Side of Calves
The results in Table 10 illustrate that the BVD virus infected animals begin
to show
statistically significant increases in dorsal temperatures about 6 to 7 days
postinfection and
reach a delta T value of 1.8 C compared to their own initial preinfection
temperatures.
Compared to uninfected controls, statistically significantly delta T values of
about 1.5 C
were obtained in BVD virus infected animals. Further, as with the other
infrared
1() thermographic images, increases in dorsal temperatures observed in
infected animals
coincided with or preceded by several days the changes detected in clinical
scores (Table 5)
and objective biological assays such as haptoglobin (Table 6).
20
30
28-
SUBS'TITUTE SHEET (RULE 26)
CA 02366510 2001-09-21
WO 00/57163 PCT/CAOO/00303
Table 1: Time course for infrared temperature measured by infrared
thermography,
rectal temperature and milk analysis parameters in cows utilized in a mastitis
induction
model (n=20). Data represent least squares means.
Tinle Rectal Temp Infrared Temp NAGase Somatic Cell BSA
(h) F C ug/ml Counts a/dl
-1 101.2a 32.19a 0.39a 504a 0.329a
0.5 101.3a 32.36ab
1 102.Oa 32.77bc
2 102.Oa 32.97cd
3 102.7a 33.76e 2.39b 2.86b
6 105.3b 34.44f 5.66b 4.17b
9 102.2a 34.94d 5.15b 3.13b
12 96.7b 33.42d 4.58b 2.35b
24 100.9a 30.99 5.64b 2875b 2.76b
36 101.2 33.15 5.59b 2753b 1.50b
48 101.1 31.43 4.72b 1849b 0.87a
60 101.7 33.11 3.46b 1370b 1.03a
72 1O1.1 31.68 2.44a 933a 0.67a
a,b, - means with different letters within columns are significantly different
(P<0.05)
35
-29-
SUBSTiTUTE SHEET (RULE 26)
CA 02366510 2001-09-21
WO 00/57163 PCT/CAOO/00303
Table 2: Time course for mean total temperature values (infrared thermographic
temperatures X udder area in pixels) for left, distal udder quarter (mastitis
induced) and right,
distal udder quarter (non-induced) in lactating dairy cows. Values represent
least squares
means for 20 cows.
Time Total Temperature Values for Left (induced) and Right (non-induced;
control) Udders
(h) Left Right
-1 52755 a 51486 a X
3 77553 b P=0.001 62395 b P=0.002 Y
6 81294 b P=0.001 63998 b P=0.001 Y
9 79250 b P=0.001 66237 b P=0.001 Y
12 66017 b P=0.002 53782 a P=0.50 Y
24 56916 a P=0.23 50630 a P=0.81 Y
36 60989 b P=0.02 54157 a P=0.44 Y
48 59322 b P=0.06 54015 a P=0.47 X
60 61971 b P=0.008 55370 a P=0.26 X
72 56745 a P=0.25 55571 a P=0.24 X
a,b, - means with different letters within columns are signiticantly different
(P<0.05)
X,Y, - means with different letters within rows are significantly different
(P<0.05). Left is
the mastitis induced distal quarter, right is the distal, non-induced quarter
(control).
35
30-
SUHSTITUTE SHEET (RULE 26)
CA 02366510 2001-09-21
WO 00/57163 PCT/CAOO/00303
Table 3: Clinical Scores
Clinical Sign Score
Lethargy 0 = none
1= mild anorexia or listlessness
2 = moderate lethargy, slow to rise, anorectic
3 = recumbent
4 = death
Hemmorhage 0 = none
1= few petechiae on smucous membranes or sclera
2 = moderate or severe petechiation or heatomas > 1
3 = large hematomas > 5 cm
4 = bloody diarrhea or epstaxis
Respiratory Signs 0 = none
1= clear nasal discharge or slight cough, no treatment
required
2 = mucopurulent discharge or severe cough, slight increase
in lung sounds
3 = severe pneumonia
Diarrhea 0 = none
1= mild or slight, < 5~Io dehydrated
2 = moderate, 5 to 10 % dehydrated
3 = severe or profuse, > 10 % dehydrated
-31-
SUBSTiTUTE SHEET (RULE 26)
CA 02366510 2001-09-21
WO 00/57163 PCT/CAOO/00303
Table 4: Eye Infrared Thermographic Values
Day Mean Temperature in BVD Virus Mean Temperature in Control
Infected Calves Calves
0 31.22 ax 32.0 y
1 32.11 bx 30.54 y 2 32.26 b 33.62 y
3 32.40 b 32.64 y
4 32.54 bx 31.90 (0.3)
5 32.66 bx 31.54 y
6 32.89 bx 31.82 y
7 33.31 bx 31.33 y
8 33.51 bx 31.47 y
9 33.38 bx 30.57 y
10 33.79 bx 31.64 y
a,b means with different letters within columns are significantly different
P<0.01 using 2
tailed paired T-test
x,y means with different letters within rows are significantly different
P<0.01 using 2 tailed
unpaired T-test
30
- 32-
SUBSTITUTE SHEET (RULE 26)
CA 02366510 2001-09-21
WO 00/57163 PCT/CAOO/00303
Table 5: Summary of Clinical Scores
Day Mean Clinical Scores in BVD Mean Clinical Scores in Control
Virus Infected Calves Calves
0 0 0
1 0.1 0 2 0.1 0
3 0.1 0
4 0 0
5 0 0
6 0.1 0
7 0.3 0
8 0.9 0.2
9 2.2 0.1
10 2.9 0
11 3.2 0
12 2.7 0
13 1.2 0
35
33-
SUBSTiTUTE SHEET (RULE 26)
CA 02366510 2001-09-21
WO 00/57163 PCT/CAOO/00303
Table 6: Serum Haptoglobin in BVD Infected and Uninfected Calves
Day BVD Values ( g/ml) Control Values ( g/ml)
0 <15 (one aninlal at 567) <15
3 308 (increase due to 2 aninials) <15 7 218 (increase due to 2 animals) <15
803 (all animals increase) <15
20
30
-34-
SUBSTiTUTE SHEET (RULE 26)
CA 02366510 2001-09-21
WO 00/57163 PCT/CAOO/00303
Table 7: Nose Infrared Thermographic Values
Day Mean Temperature in BVD Mean Temperature in
Virus Infected Calves Control Calves
0 29.1 a 28.51
1 29.61 ax 26.89 y
2 29.43 a 29.88
3 29.96 a 28.68
4 31.52 bx 29.9 y.06
5 31.03 bx 28.7 y.05
6 31.48 bx 28.7 .
7 32.48 bx 29.46 y
8 32.9 bx 29.74 y
9 33.14 bx 28.58 y
10 32.77 bx 29.48 y
a,b means with different letters within columns are significantly different
P<0.01 using 2
tailed paired T-test
x,y means with different letters within rows are significantly different
P<0.01 using 2 tailed
unpaired T-test
30
-35-
SUBSTITUTE SHEET (RULE 26)
CA 02366510 2001-09-21
WO 00/57163 PCT/CAOO/00303
Table 8: Ear Infrared Thermographic Values
Day Mean Temperature in BVD Mean Temperature in
Virus Infected Calves Control Calves
0 22.38 a 23.35
1 22.41 a 22.58
2 23.29 a 24.76
3 23.19 a 24.95
4 23.89 b.06 24.90
5 24.1 b.09x 23.13
6 24.6 b.02x 23.14 y.25
7 25.9 b.01 24.56
8 25.4 b.04 23.9
9 23.93 a 22.2
10 26.3 b.04x 22.7 y.07
a,b means with different letters within columns are significantly different
P<0.05 using 2
tailed paired T-test
x.y means with different letters within rows are significantly different
P<0.05 using 2 tailed
unpaired T-test
30
36-
SUBSTITUTE SHEET (RULE 26)
CA 02366510 2001-09-21
WO 00/57163 PCT/CAOO/00303
Table 9: Lateral Infrared Thermographic Values
Day Mean Temperature in BVD Mean Temperature in
Virus Infected Calves Control Calves
0 21.87 ax 23.21 y.05
1 22.61 b 22.2
2 22.6 b.07x 23.95 y
3 22.55 a.1 22.38 y
4 22.89 b 23.16 y
5 22.58 b.07 22.43 v
6 22.71 b 22.62 y
7 23.2 bx 22.07 y.04
8 23.39 bx 22.0 y.03
9 23.1 b.02x 21.66 y
10 23.84 bx 22.11 y
a,b means with different letters within columns are significantly different
P<0.01 using 2
tailed paired T-test
x,y means with different letters within rows are significantly different
P<0.01 using 2 tailed
unpaired T-test
30
-37-
SUBSTITUTE SHEET (RULE 26)
CA 02366510 2001-09-21
WO 00/57163 PCT/CAOO/00303
Table 10: Dorsal Infrared Thermographic Values
Day Mean Temperature in BVD Mean Temperature in
Virus Infected Calves Control Calves
0 22.29 ax 20.62 y
1 22.74 ax 21.26 y
2 23.04 b 23.90
3 22.44 a 22.48
4 23.08 b 22.65
5 22.70 a 22.23
6 22.75 a(0.056) 22.15
7 22.95 bx 21.59 y 15 8 23.54bx 21.96y
9 23.06 bx 21.47 y
10 24.08 bx 22.58 y
a,b means with different letters within columns are significantly different
P<0.05 using 2
tailed paired T-test
x.y means with different letters within rows are significantly different
P<0.05 using 2 tailed
unpaired T-test
30
38-
SUBSTtTUTE SHEET (RULE 26)
CA 02366510 2008-03-07
The present invention is not to be limited in scope by the specific
embodiments
described herein, which are intended as single illustrations of individual
aspects of the
invention. Indeed, various modifications of the invention in addition to those
shown and
described herein will become apparent to those skilled in the art from the
foregoing
description and accompanying drawings. Such modifications are intended to fall
within the
scope of the appended claims.
39