Note: Descriptions are shown in the official language in which they were submitted.
CA 02392555 2002-05-24
WO 01/43216 PCT/CA00/01426
METHOD AND APPARATUS FOR OPERATING A FUEL CELL
Field Of The Invention
The present invention relates to a method and
apparatus for operating a fuel cell that improves
the overall efficiency of the fuel cell system.
In particular, efficiency is improved by
controlling the supply of oxidant so as to reduce
excess oxidant flow..
Background Of The Invention
Electrochemical fuel cells convert reactants,
namely, fuel and oxidant fluid streams, to
20 generate electric power arid reaction products.
Electrochemical fuel cells generally employ an
electrolyte disposed between two electrodes,
namely a cathode and an anode. The electrodes
each comprise an electrocatalyst disposed at the
25 interface between the electrolyte and the
electrodes to induce the desired electrochemical
reactions.
The fuel fluid stream, which is supplied to
the anode, typically comprises hydrogen and may be
30 pure gaseous hydrogen or a dilute hydrogen stream
such as a reformate stream. Alternatively, other
fuels such as methanol or dimethyl ether may be
supplied to the anode where such fuels may be
directly oxidized. The oxidant fluid stream,
35 which is supplied to the cathode, typically
comprises oxygen, and may be pure gaseous oxygen,
or a dilute oxygen stream such as air.
For a fuel cell, reactant stoichiometry is
defined herein as the ratio of the reactant
40 supplied over the reactant theoretically required
CA 02392555 2002-05-24
WO 01/43216 PCT/CA00/01426
- 2 -
to produce the current produced by the fuel cell.
For conventionally operated fuel cells which
typically supply a surplus of oxidant to the
cathode, since the oxidant is preferentially
reduced at the cathode, oxidant stoichiometry is
commonly expressed as the ratio of the oxidant
supplied over the oxidant consumed. However, at
lower stoichiometries, the reduction of oxidant
may not be responsible for all of the current
produced by the fuel cell. Other reactions, such
as, for example, the reduction of protons may also
occur at the cathode and contribute to the current
output (i.e. with the consequence of reduced
output voltage). In this example, while oxidant
may still be the main component being reduced at
the cathode, the amount of oxidant theoretically
required to produce the current output may be
higher than the amount of oxidant actually
supplied. Therefore, when components other than
the oxidant are reduced at the cathode, oxidant
stoichiometries less than one may be sustained.
If the oxidant is a dilute oxidant stream such as
air, only the reactant component, namely oxygen,
is considered in the calculation of stoichiometry
(that is, oxidant stoichiometry is the ratio of
the amount of oxygen supplied over the theoretical
amount of oxygen required to produce the fuel cell
output current).
Hydrogen and oxygen are reactive in the fuel
cell and are particularly reactive with each
other. Accordingly, in solid polymer fuel cells,
an important function of the membrane electrolyte
is to keep the hydrogen supplied to the anode
CA 02392555 2002-05-24
WO 01/43216 PCT/CA00/01426
- 3 -
separated from the oxygen supplied to the cathode.
In addition, the membrane is proton conductive and
functions as an electrolyte.
The overall efficiency of a fuel cell system
is a function of the total power output of the
fuel cells) and the parasitic power consumption.
Total parasitic power consumption is defined
herein as the sum of all power that is consumed by
the fuel cell system in the course of generating
electrical power. The net electrical power output
~5 is the total power output minus the total
parasitic power consumption. Therefore, overall
efficiency may be improved by reducing the
parasitic power consumption.
One source of parasitic power consumption,
2p for example, is the oxidant delivery subsystem
that typically employs a mechanical device such as
a compressor, fan, pump, rotary piston blower, or
an equivalent mechanical device that consumes
power to supply oxidant to the fuel cell. Higher
25 oxidant stoichiometries generally result in higher
parasitic power consumption because more power is
generally required to deliver more oxidant to the
cathode. Conventional fuel cell systems typically
operate with an oxidant stoichiometry greater than
30 two (2.0). Since conventional fuel cell systems
direct at least twice the amount of oxygen to the
cathode than is actually required to satisfy the
electrical power demand, a significant amount of
the parasitic power consumption is for directing
35 surplus oxygen to the cathode. Further, fuel cell
systems commonly employ a dilute oxidant stream.
A dilute oxidant stream is defined herein as a
CA 02392555 2002-05-24
WO 01/43216 PCT/CA00/01426
- 4 -
fluid stream that comprises less than 1000
oxidant. For example, air is a dilute oxidant
stream that typically comprises about 200 oxygen,
in addition to other components such as nitrogen.
Accordingly, when air is employed as the dilute
oxidant stream, parasitic power consumption is
amplified because in addition to the surplus
oxygen, the oxidant delivery subsystem must also
supply a proportionate amount of the other non-
reactive components.
One reason why the parasitic power
consumption associated with high oxidant
stoichiometries is tolerated, is that excess
oxidant is desired at the cathode to avoid oxidant
starvation at the cathode electrocatalyst.
Oxidant starvation is defined herein as the status
when oxidant stoichiometry is less than one.
Oxygen starvation typically results in a
condition, in the absence of oxidant at the
cathode electrocatalyst, favoring the production
of molecular hydrogen from protons and electrons
at the cathode. In severe cases of oxidant
starvation the fuel cell may generate a negative
voltage and this condition is known as cell
reversal. Oxidant stream delivery systems are
typically designed to provide a generous surplus
of oxidant to maintain performance, to reduce the
likelihood of oxidant starvation, and to reduce
the likelihood of hydrogen production at the
cathode, even though this results in the
aforementioned amplified parasitic power
consumption.
In fuel cells, oxidant starvation is most
CA 02392555 2002-05-24
WO 01/43216 PCT/CA00/01426
likely to occur in regions furthest downstream
from the cathode inlet where the oxidant stream
enters the cell, for example, near the cathode
outlet. An oxidant stoichiometry that provides a
surplus of oxidant to the fuel cell provides an
adequate concentration of oxidant to the
electrocatalyst throughout the electrochemically
active area of the cathode, including near the
cathode outlet.
Another reason why conventional fuel cell
15 systems seek to avoid low oxidant stoichiometries
is that the temperature within the fuel cell may
rapidly increase when oxidant stoichiometry is too
low. It is generally desirable to maintain the
temperature of solid polymer fuel cells below
20 100EC. When the temperature increases within the
fuel cell, parasitic power consumption increases
because of the higher load on the cooling system,
offsetting, to some degree, the reduction in
parasitic power consumption associated with
25 operating at a lower oxidant stoichiometry.
Another disadvantage of operating a fuel cell
system with a high oxidant stoichiometry is that
higher oxidant stoichiometries generally require
higher speeds for the mechanical devices used by
30 the oxidant delivery subsystem to supply the
oxidant stream to the cathode. Now that fuel cell
systems are being developed for commercial use,
mechanical considerations over the planned
lifetime of commercial fuel cell systems are a
35 factor. A mechanical disadvantage of conventional
high stoichiometry methods of operation is that
such methods may result in increased wear and more
i
17-1"2-2001 CA 02392555 2002-05-24 CA00014:
6 -
frequent maintenance. If the oxidant is air,
there may be additional operational costs because
supplying a high surplus of oxidant also results
in higher flow rates that may increase air filter
maintenance and/or reduce filter efficiency.
Summary of the Inveati.on
A method of operating a fuel cell system
controls oxidant stoichiometry to reduce parasitic
power consumption to improve overall efficiency,
while avoiding low oxidant stoichiometries that
might cause reduced performance, cell reversal,
hydrogen production at the cathode, and increased
heat generation within the fuel cell. 1'he fuel
cell system comprises a fuel cell power generating
subsystem having at least one fuel cell,, and an
oxidant delivery subsystem that comprises at least
one mechanical device for supplying an oxidant
stream to a cathode of the fuel cell. The fuel
cell also has an anode supplied with a fuel
stream. In a preferred embodiment, the fuel cell
is a solid polymer fuel cell.
The method comprises controlling the
mechanical device, to reduce parasitic power
consumption by reducing the oxidant stoichiometry
until dV/d(OS) is greater than a predetermined
value ("PV"), where dV is the change in cell
voltage and d(OS) is the change in oxidant
stoichiometry (that is, the slope of a plot of
voltage as a function of oxidant stoich:iometry).
Cell voltage is measured in volts and oxidant
stoichiometry is a unit-less ratio.
To practice the invention, the value of
dV/d(OS) need not actually be calculated if a
AMENDED SHEET
CA 02392555 2002-05-24
WO 01/43216 PCT/CA00/01426
dV/d(OS) need not actually be calculated if a
relationship between dV/d(OS) and another
operational characteristic is known. For example,
in preferred embodiments, an operational
characteristic that correlates to dV/d(OS) and/or
oxidant stoichiometry may be monitored. The fuel
cell system is controlled to take action when the
value of the monitored operational characteristic
correlates to when dV/d(OS) is equal to or greater
than PV. For example, in a typical fuel cell
system, during normal operation, current density
is kept constant and when oxidant stoichiometry is
being reduced, a particular cell voltage
correlates to when dV/d(OS) increases to PV. That
is, when cell voltage decreases below a threshold
20 voltage, this is determined when dV/d(OS) is
higher than PV. Accordingly, a fuel cell system
may be operated to reduce parasitic power
consumption by controlling the oxidant delivery
subsystem to maintain voltage output within a
25 predetermined voltage range which typically
corresponds to an oxidant stoichiometry range
between about one and two, wherein PV is selected
so that dV/d(OS) equals PV at the lower limit of
the selected voltage range. The preferred range
30 for oxidant stoichiometry may actually change
according to the instantaneous operating
conditions. For example, when a fuel cell is
operating in an idle or low output condition, a
higher oxidant stoichiometry may be preferred to
35 prevent accumulation of water at the cathode.
Accordingly, the value of PV may be dynamic.
The characteristics of the fuel cell and/or
CA 02392555 2002-05-24
WO 01/43216 PCT/CA00/01426
_ g _
the type of reactants may also influence the
preferred oxidant stoichiometry range. For
example, in a direct methanol fuel cell, higher
stoichiometries are typically employed, but the
reactant supply may still be controlled to prevent
dV/d(OS) from increasing to higher than PV
(although for a direct methanol fuel cell, PV will
correspond to a higher stoichiometry, compared to
a fuel cell which is fed hydrogen gas or reformate
as the fuel stream).
Similarly, when current density is constant
and oxidant stoichiometry is being reduced, a
particular oxidant stoichiometry correlates to
when dV/d(OS) increases to PV. Accordingly,
operational characteristics, such as the oxygen
20 concentration in the cathode exhaust stream, which
correlate to oxidant stoichiometry, may be
monitored to determine when oxidant stoichiometry
is reduced to a value which correlates to when
dV/d(OS) increases to greater than or equal to PV.
25 The oxidant concentration in the oxidant supply
stream is typically known, but if the oxidant
supply stream has a variable oxidant concentration
(for example, if an oxidant enrichment system is
employed), the method may further comprise
30 monitoring and measuring the oxidant concentration
in the oxidant supply stream, in addition to
monitoring and measuring the oxidant concentration
in the oxidant exhaust stream. Alternatively,
oxidant stoichiometry may be determined by
35 monitoring and measuring a different operational
characteristic, such as, for example, current
output for the fuel cell power generating
CA 02392555 2002-05-24
WO 01/43216 PCT/CA00/01426
- 9 -
subsystem, which, in addition to the oxidant
concentration in the oxidant exhaust stream may be
used to calculate oxidant stoichiometry.
The value of dV/d(OS) generally increases as
oxidant stoichiometry and cell voltage both
t0 decrease. In one embodiment, PV corresponds to
when oxidant starvation is beginning to occur or
when oxidant starvation is beginning to cause a
decline in performance. In a more preferable
embodiment, PV corresponds to when further
~g reductions in oxidant stoichiometry will cause a
sharp decline in cell voltage output, for example,
when dV/d(OS) is higher than 0.02 volts.
Preferably, PV is between 0.3 volt and 7.0 volts,
so that the fuel cell system operates mostly when
20 dV/d(OS) is less than PV. The selected value for
PV controls the oxidant stoichiometry so that it
is kept between about one and two during normal
operation and closer to about one or a
predetermined target value, preferably between 1
25 and 1.5, during steady state operation.
In a preferred apparatus for practising the
method, the fuel cell is one of a plurality of
fuel cells arranged in a stack. When the method
is applied to a fuel cell stack, the sensor may
30 monitor the operational characteristic for one or
more individual fuel cells and/or for the stack as
a whole. The sensor may thus be located to
monitor an operational characteristic (for
example, oxidant or hydrogen concentration) within
35 a portion of a reactant passage (for example, an
internal cathode exhaust passage) that is disposed
between the outside end surfaces of the stack end
CA 02392555 2002-05-24
WO 01/43216 PCT/CA00/01426
- 10 -
plates.
The oxidant stoichiometry is preferably
controlled by controlling the oxidant stream mass
flow rate, for example, by controlling the speed
of a mechanical device, such as a compressor, a
fan, a pump, or a blower. Reducing the speed of
the mechanical device generally reduces parasitic
power consumption and reduces oxidant
stoichiometry. However, alternate methods of
controlling oxidant stoichiometry may be employed
which also reduce parasitic power consumption.
For example, if an oxidant enrichment subsystem is
employed, oxidant stoichiometry may be controlled
by increasing or decreasing the concentration of
oxidant in the oxidant stream supplied to the
cathodes) of the fuel cell power generating
subsystem. Another method of controlling oxidant
stoichiometry is adjusting the electrical power
output of the fuel cell, wherein reducing power
output generally increases oxidant stoichiometry.
A preferred method that employs a hydrogen
sensor (the "Hydrogen Sensor Method") comprises:
(a) monitoring a cathode exhaust stream
downstream of the cathode to detect
hydrogen gas concentration; and
(b) decreasing oxidant stoichiometry when
the hydrogen gas concentration is less
than a first threshold concentration.
The Hydrogen Sensor Method may further
comprise increasing the oxidant stoichiometry when
the hydrogen concentration is higher than a second
threshold concentration (for example, 20 ppm of
hydrogen), which correlates to operating
CA 02392555 2002-05-24
WO 01/43216 PCT/CA00/01426
- 11 -
conditions which are indicative of actual or
potential oxidant starvation. The first threshold
concentration may be, for example, the lower
detection limit of the hydrogen sensor that is
used to monitor the cathode exhaust stream. The
Ip second threshold concentration is greater than the
first threshold concentration. V~Ihen the hydrogen
concentration is between the first and second
threshold concentrations, the controller does not
take any action to adjust the oxidant
stoichiometry.
A problem with using the hydrogen
concentration measured in the cathode exhaust
stream to detect oxidant starvation is that
oxidant starvation is not the only possible cause
for hydrogen gas being detected at the cathode.
For example, when the fuel comprises hydrogen,
holes or cracks may form in the membrane or seals
and permit reactants to "cross over" from the
anode side to the cathode side, and vice versa.
If significant reactant crossover is detected, the
conventional response is to shut down the fuel
cell so that it may be repaired or replaced. Fuel
crossover and oxidant starvation may both cause
reduced fuel cell performance, but the detection
of one condition requires a response which is
different from the response required for the other
condition. Oxidant starvation causing hydrogen to
be produced at the cathode generally requires the
oxidant stoichiometry to be increased, whereas
fuel crossover, if significant, may require the
fuel cell to be shut down. Therefore, for
appropriate action to be taken, it is desirable
CA 02392555 2002-05-24
WO 01/43216 PCT/CA00/01426
- 12 -
for the controller to be able to distinguish
between oxidant starvation and fuel crossover when
the fuel comprises hydrogen. The following
embodiments of the Hydrogen Sensor Method provide
procedures for distinguishing between oxidant
starvation and fuel crossover.
The Hydrogen Sensor Method may further
comprise steps for reducing the hydrogen gas
concentration within the cathode exhaust stream
when the hydrogen gas concentration is greater
than a second threshold concentration, wherein the
steps comprise comparing the oxidant stream mass
flow rate to a maximum desired mass flow rate, and
(a) if the oxidant stream mass flow rate is
less than the maximum desired mass flow
20 rate, increasing the oxidant mass flow
rate (that is, if raising the oxidant
mass flow rate results in less hydrogen
being detected at the cathode, then it
is confirmed that oxidant starvation was
25 likely the reason for hydrogen being
detected; if oxidant starvation is not
the source of the hydrogen at the
cathode, the oxidant stream mass flow
rate will quickly increase to the
30 maximum desired mass flow rate and the
controller will determine that fuel
crossover is the likely hydrogen
source); and
(b) if the oxidant mass flow rate is already
35 greater than or equal to the maximum
desired mass flow rate,
ceasing operation of the fuel cell if
i
17-1 L-2001 CA 02392555 2002-05-24 CA00014~
- 13 -
the hydrogen gas concentration is greater
than a third concentration threshold which is
greater than the first and second
concentration thresholds (that is, since the
oxidant stream mass flow rate is already at,
or exceeds, the desired maximum, oxidant
starvation is not the likely source of the
hydrogen in the cathode exhaust stream; since
the hydrogen concentration is above the third
threshold, this indicates that there may be
an excessive amount fuel passing through
leaks between the anode and cathode:l; and
generating a warning signal and
continuing to operate the fuel cell if the
hydrogen gas concentration is less than the
third concentration threshold (that is, the
value of the third threshold is selected so
that the fuel cell system can be safely
operated when the hydrogen concentration in
the cathode exhaust stream is less than the
third threshold).
The Hydrogen Sensor Method may further
comprise continuously monitoring the cathode
exhaust stream for the hydrogen gas concentration
and determining whether the hydrogen gas
concentration is increasing or decreasing, and
when the hydrogen gas concentration is greater
than a second threshold concentration, the method
further comprises:
maintaining a substantially constant
oxidant stoichiometry when the hydrogen
concentration is decreasing; and
increasing the oxidant stoichiometry
AMENDED SHEET
17-1 r 2001 CA 02392555 2002-05-24 CA00014~
- 14 -
when the hydrogen concentration is
increasing.
In addition to monitoring whether hydrogen
concentration is increasing or decreasing, when
the hydrogen gas concentration is greater than a
second threshold concentration, the method may
also comprise additional steps to determine
whether the source of the hydrogen is oxidant
starvation or fuel crossover. For example, the
additional steps may comprise:
measuring fuel cell voltage and
comparing it to a voltage threshold. value
(for a Ballard~ MK V fuel cell, the voltage
threshold value could be, for example, 100
millivolts), and
if the fuel cell voltage exceeds
the voltage threshold value and the
hydrogen gas concentration is
increasing, decreasing the pressure of
the fuel stream (in this case, since
voltage exceeds the threshold value, the
reason for the increasing hydrogen
concentration is probably a leak; to
reduce the effect of the leak, the
2S method preferably comprises controlling
the fuel stream pressure so that it is
less than or equal to the pressure of
the oxidant stream);
if the fuel cell voltage is leas
than the voltage threshold value, the
hydrogen gas concentration is
increasing, and oxidant mass flow rate
is less than a desired maximum, then
AMENDED SHEET
CA 02392555 2002-05-24
WO 01/43216 PCT/CA00/01426
- 15 -
increasing the oxidant stoichiometry (in
this case, since oxidant mass flow rate
is less than the desired maximum, the
cause for the low cell voltage and the
presence of hydrogen gas may be oxidant
starvation, and the controller attempts
to correct this condition by increasing
the oxidant stoichiometry); and
if the fuel cell voltage is less
than the voltage threshold value, the
hydrogen gas concentration is
increasing, and oxidant mass flow rate
is greater than or equal to a desired
maximum, then decreasing the pressure of
the fuel stream (in this case, the low
20 cell voltage may be caused by oxidant
starvation or fuel leaking from the
anode to the cathode; since the oxidant
mass flow rate is already greater than
or equal to the desired maximum, the
25 pressure of the fuel stream is reduced,
thereby reducing fuel cell power output
and oxygen consumption at the cathode,
to counter oxidant starvation and reduce
the effect of any leaks).
30 Further additional steps may be taken to
confirm whether the detected hydrogen~gas
concentration is caused by oxidant starvation or
fuel crossover. For example, the method may also
comprise regulating fluid pressure of the oxidant
35 and fuel streams to increase or decrease a
pressure differential between the oxidant and fuel
streams to help determine whether the hydrogen
CA 02392555 2002-05-24
WO 01/43216 PCT/CA00/01426
- 16 -
measured at the cathode is caused by a leak or by
oxidant starvation. If the change in the pressure
differential has a significant effect on the
measured hydrogen concentration, then it can be
determined that there is a significant problem
with hydrogen crossover.
For any of the above-described methods, the
oxidant stoichiometry is typically adjusted by
controlling the speed of the oxidant compressor or
blower. However, other methods of changing the
oxidant stoichiometry may also be used, such as
adjusting the oxidant concentration in the oxidant
supply stream or changing the electrical power
output of the fuel cell without changing the mass
flow rate of the oxidant supply stream. When the
20 oxidant stream mass flow rate is adjusted, it is
typically changed by a fixed amount or by a fixed
percentage of the instant oxidant stream mass flow
rate. Alternatively, oxidant stoichiometry may be
adjusted by adjusting the oxidant stream mass flow
25 rate by an amount that is dependent upon the
magnitude of the detected hydrogen gas
concentration. For example, the controller may be
programmed to reduce the oxidant stoichiometry by
a larger amount when a large surplus of oxygen is
30 detected compared to when only a small surplus of
oxygen is detected.
The method of controlling the oxidant
delivery subsystem to reduce parasitic power
consumption may comprise calibrating an oxidant
35 delivery subsystem for a fuel cell. For example,
the calibration method may comprise:
(a) operating the fuel cell at a particular
CA 02392555 2002-05-24
WO 01/43216 PCT/CA00/01426
- 17 -
electrical power output;
(b) supplying an oxidant stream to a cathode
of the fuel cell;
(c) adjusting the operating speed of a
mechanical oxidant delivery device;
(d) measuring an operational characteristic
that corresponds to dV/d(oxidant
stoichiometry); and
(e) recording as the desired operating speed
for said particular electrical power
output, said operating speed when said
dV/d(oxidant stoichiometry) is equal to
a predetermined value.
The calibration method may be repeated for a
plurality of electrical power outputs so that the
20 desired operating speed for the mechanical oxidant
delivery device may be determined and recorded in
a look-up table for many different electrical
power demands. The desired operating speed may
then be determined by referring to a look-up table
25 for the operating speed that corresponds to the
instant electrical power demand.
An advantage of the calibration method is
that it may be used throughout the operating life
of the fuel cell to adjust for changes in the fuel
30 cell over time. For example some of the fuel cell
properties may be subject to degradation over time
and that may change the stoichiometry requirements
over the operational lifetime of the fuel cell.
The present method and apparatus also
35 controls the amount of oxidant supplied to a fuel
cell stack and reduces system inefficiencies
caused by the over-supply of oxidant. Preferably,
CA 02392555 2002-05-24
WO 01/43216 PCT/CA00/01426
- 18 -
the method also controls the oxidant delivery
subsystem to increase the oxidant stoichiometry to
avert oxidant starvation conditions. Accordingly,
a method of operating a fuel cell is provided that
detects when the oxidant stoichiometry may be
decreased or increased, and when the flow of
oxidant should be discontinued altogether.
The present method may also be employed to
operate a fuel cell and further reduce parasitic
power consumption by controlling the supply of
fuel to reduce excess fuel flow. The same
principles that apply to the present method for
controlling the oxidant supply apply to a method
for controlling the fuel supply. Fuel cells
typically employ a mechanical device, such as, for
example, a compressor or pump, to supply a fuel
stream to the anodes) of the fuel cell(s).
Therefore, parasitic power consumption may be
reduced by reducing fuel stoichiometry to reduce
the amount of excess fuel supplied to the fuel
cell anodes) and the work performed by the
compressor. A reduction of the fuel stoichiometry
generally causes an increase in dV/d(fuel
stoichiometry). According to the present method,
fuel stoichiometry is kept within a predetermined
range by reducing fuel stoichiometry until
dV/d(fuel stoichiometry) increases above a
predetermined threshold value. The predetermined
range and threshold value depend upon the
particular characteristics and operating
conditions of each particular fuel cell or fuel
cell stack. The predetermined range may be
empirically determined, for example, with
CA 02392555 2002-05-24
WO 01/43216 PCT/CA00/01426
- 19 -
consideration to these factors.
Generally, it is desirable to reduce reactant
stoichiometry until dV/d(reactant stoichiometry)
is greater than about 0.02 volt. More preferably,
the predetermined value for dV/d(reactant
stoichiometry) is between 0.30 and 7.0 volts. The
voltage drop is generally more severe with fuel
starvation, compared to oxidant starvation and
when cell voltage is one of the monitored
characteristics, this effect may be used to help
differentiate between oxidant or fuel starvation.
Brief Description Of The Drawings
The advantages, nature and additional
features of the invention will become more
20 apparent from the following description, together
with the accompanying drawings, in which:
FIG. 1 is a schematic diagram of a fuel cell
system comprising a detector for detecting oxidant
starvation at the cathode and a controller for
25 processing information from the detector and
controlling the oxidant delivery subsystem to
increase or decrease the oxidant stoichiometry;
FIGS. 2a, 2b and 2c are plots of experimental
data that illustrate the effect oxidant
30 stoichiometry has on operational characteristics
such as voltage output, heat produced, and
dV/d(oxidant stoichiometry). FIG. 2a is a plot of
fuel cell voltage output as a function of oxidant
stoichiometry for a solid polymer fuel cell
35 operating at a current density of 500 amps per
square foot (about 540 milliamps per square
centimeter), during normal operation. FIG. 2b is a
CA 02392555 2002-05-24
WO 01/43216 PCT/CA00/01426
- 20 -
plot of fuel cell voltage output and dV/d(oxidant
stoichiometry) as a function of oxidant
stoichiometry for the same fuel cell experiment as
FIG. 2a. FIG. 2c is a plot of dv/d(oxidant
stoichiometry) as a function of oxidant
stoichiometry for a fuel cell stack comprising
four fuel cells;
FIGS. 3a, 3b and 4-12 are logic diagrams
illustrating various preferred embodiments of a
the present method of operating a fuel cell and
controlling the oxidant stoichiometry. In FIGS.
3a, 3b and 4-11, the logic diagrams illustrate a
method of adjusting the oxidant stream mass flow
rate to adjust the oxidant stoichiometry. In
these embodiments, the oxidant stream mass flow
20 rate may also be changed in response to changes in
power output, with the illustrated method being
used to adjust the oxidant stream mass flow rate
and hence oxidant stoichiometry to prevent oxidant
starvation and reduce parasitic power losses
25 associated with supplying excess oxidant. In FIG.
12 the logic diagram illustrates a method of
calibrating a fuel cell system to determine the
desired oxidant stream mass flow rate to produce a
particular power output at a predetermined oxidant
30 stoichiometry.
Detailed Description Of Preferred Embodiments
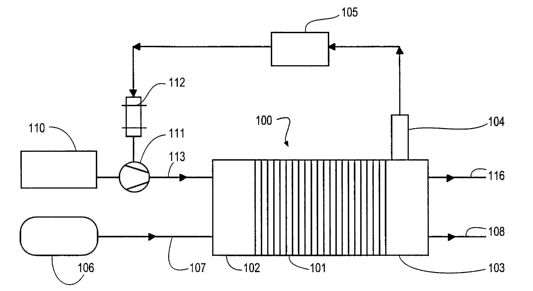
FIG. 1 is a schematic diagram that shows the
fuel cell power generating subsystem, the oxidant
35 delivery subsystem, and the fuel delivery
subsystem of a fuel cell system. The fuel cell
power generating subsystem comprises a fuel cell
CA 02392555 2002-05-24
WO 01/43216 PCT/CA00/01426
- 21 -
g stack 100, comprising a plurality of fuel cells
101 interposed between end plates 102 and 103.
The fuel cell power generating subsystem further
comprises sensor 104. When fuel cell stack 100 is
operating, sensor 104 measures an operational
characteristic that correlates to dV/d(OS). For
example, when fuel cell stack 100 is operating at
a constant current density, sensor 104 may measure
an operational characteristic which relates to
oxidant stoichiometry, cell voltage, or a
15 characteristic which is typically detected when
oxidant starvation is occurring at the fuel cell
cathode.
Sensor 104 outputs a signal to controller 105
which processes the signal to determine when
20 dV/d(OS) is within the desired operating range and
when oxidant stoichiometry should be adjusted so
that dV/d(OS) is restored to the desired operating
range. For example, oxidant stoichiometry may be
increased if the measured operational
25 characteristic indicates an oxidant stoichiometry
and/or the presence of conditions at the cathode
which indicates actual, or a potential for,
oxidant starvation. Preferably, the desired
operating range prevents any oxidant starvation at
30 the cathode that inhibits the fuel cell from
producing the desired power output.
When the operational characteristic monitored
by sensor 104 is the concentration of a gas in the
cathode exhaust stream, sensor 104 may comprise a
35 sensing element that is located within the
interior of the cathode exhaust passage so that it
is exposed to the cathode exhaust stream. The
CA 02392555 2002-05-24
WO 01/43216 PCT/CA00/01426
- 22 -
portion of the cathode exhaust passage where the
sensing element is located may be a manifold or
fluid passage internal to fuel cell stack 100, or
in cathode exhaust passage 116.
In one embodiment, oxidant stoichiometry is
controlled by using sensor 104 to measure an
operational characteristic that correlates to
oxidant stoichiometry. In another embodiment,
sensor 104 detects an operational characteristic
that is indicative of oxidant starvation at the
cathode so that the oxidant stoichiometry may be
controlled to reduce the amount of excess oxidant
supplied to fuel cell stack 100, while preventing
harmful oxidant starvation at the fuel cell
cathodes (that is, in this embodiment controller
20 105 increases oxidant stoichiometry when sensor
104 detects actual or potential oxidant starvation
and may decrease oxidant stoichiometry when
oxidant starvation is not detected). In yet
another embodiment, controller 105 checks for
2g oxidant starvation while maintaining dV/d(OS)
within a predetermined operating range; if oxidant
starvation is detected, oxidant stoichiometry is
increased until oxidant starvation is no longer
detected, even though this may result in
30 temporarily raising dV/d(OS) above the desired
operating range.
The fuel delivery subsystem supplies a fuel
stream from fuel supply 106 to the anodes of fuel
cell stack 100 via fuel supply passage 107. when
35 the fuel stream is a compressed gas, such as
substantially pure hydrogen, fuel supply 106 may
comprise a pressure vessel and a pressure control
CA 02392555 2002-05-24
WO 01/43216 PCT/CA00/01426
- 23 -
valve (not shown) for regulating the pressure of
the fuel stream supplied to fuel cell stack 100.
Alternatively, the fuel may be a liquid fuel such
as methanol and fuel supply 106 may comprise a
fuel tank. Liquid fuel may be supplied directly
to fuel cell stack 100 (that is, a so called
"liquid feed fuel cell"). Alternatively, fuels
such as methanol, natural gas, or other
hydrocarbons may be further processed to produce a
gaseous hydrogen-containing reformate stream, in
which case fuel supply 106 further comprises a
fuel processor. When the fuel storage tank is not
pressurized, the fuel delivery subsystem may
further comprise a compressor or pump for
controlling the pressure and mass flow rate of the
fuel stream supplied to fuel cell stack 100.
After the fuel stream has been directed to the
anodes of fuel cell stack 100 to participate in
the desired electrochemical reactions, a fuel-
depleted fuel exhaust stream is exhausted from
fuel cell stack 100 via fuel exhaust passage 108.
In the preferred embodiment illustrated by
FIG. 1, the oxidant delivery subsystem comprises
oxidant supply 110, mechanical device 111 for
raising the pressure of the oxidant supply stream,
and electric motor 112 coupled to mechanical
device 111 for providing power thereto. Oxidant
supply 110 may comprise a vessel for holding a
supply of oxidant, but more typically, oxidant
supply 110 comprises an air intake for receiving
and filtering air from the surrounding atmosphere.
From oxidant supply 110, the oxidant supply stream
is directed to mechanical device 111, which
CA 02392555 2002-05-24
WO 01/43216 PCT/CA00/01426
- 24 -
raises the pressure of the oxidant stream. The
pressurized oxidant supply stream is directed to
the fuel cell power generating subsystem via
oxidant supply passage 113.
Controller 105 receives an output signal from
l0 sensor 104. The output signal is processed by
controller 105 to determine whether dV/d(OS) is
within the desired operating range. Controller
105 communicates with the oxidant delivery
subsystem to control the output of mechanical
device 111 to maintain dV/d(OS) within a
predetermined desired operating range (which
preferably corresponds to an oxidant stoichiometry
between about one and two).
For example, in the embodiment illustrated in
20 FIG. 1, controller 105 controls electric motor 112
to control the speed of mechanical device 111.
Mechanical device 111 is typically a compressor
such as a rotary piston compressor or a
reciprocating piston compressor. However, other
25 types of mechanical devices may also be employed
such as, for example a pump, a fan, or a blower.
Mechanical device 111 raises the pressure of the
oxidant supply stream to provide sufficient energy
for directing the desired oxidant mass flow rate
30 to the fuel cell cathodes within fuel cell stack
100. After the cathodes, the oxygen-depleted
oxidant stream is ultimately exhausted from fuel
cell stack 100 through cathode exhaust passage
116.
35 In a preferred method, during steady state
operation, controller 105 controls the oxidant
delivery subsystem so that the value of dVu/d(OS)
i
1 T1 x'2001 CA 02392555 2002-05-24
CA00014
- 25 -
corresponds to operating conditions when oxidant
stoichiometry is close to about one. Steady state
operation is defined herein as an operational mode
for the fuel cell system when the power output of
fuel cell stack 100 is substantially constant.
During normal operation, when the power demand is
dynamic, controller 105 may allow dV/d(OS) to vary
within a predetermined desired operating range
that preferably corresponds to when oxidant
stoichiometry is between about one and two.
Normal operation is defined herein to exclude
start-up and shut-down modes when controller 105
may allow a value for dV/d(OS) that corresponds to
higher or lower oxidant stoichiometries,
respectively. According to a preferred method,
parasitic power demands are reduced during normal
operation by reducing the power consumption of the
oxidant delivery subsystem, by keeping oxidant
stoichiometry less than two and preferably close
to about one during steady state operation.
In a first preferred embodiment, sensor 104
measures the voltage output from fuel cell stack
100. During normal operation, at constant current
density, fuel cell voltage output correlates to
oxidant stoichiometry, so if sensor 104 measures
fuel cell voltage output, sensor 104 may be used
to determine oxidant stoichiometry and dV/d(OS).
For example, plot A of FIG. 2a sets forth the
voltage output (left y-axis) as a function of
oxidant stoichiometry (x-axis) for a fuel sell
operating at a constant current density of 500
amps per square foot (about 540 milliamps per
square centimeter). That is, if at least one of
cell voltage output or oxidant stoichiometry is
known, then dV/d(OS) may be determined by
AMENDED SHEET
1712-2001 CA 02392555 2002-05-24
CA00014
- 26
cell voltage output or oxidant stoichiometry is
known, then dV/d(OS) may be determined by
referring to plot A. Plot C of FIG. 2b sets forth
voltage output as a function of oxidant
stoichiometry, and plot D of FIG. 2b sets forth
dV/d(OS) as a function of oxidant stoichiometry.
Plot D of FIG. 2b shows that by selecting a
predetermined threshold value for dv/d(OS),
oxidant stoichiometry may be reduced until it
approaches one, without significant sacrifices to
performance, as long as oxidant stoichiometry is
increased when dV/d(OS) is greater than or equal
to the predetermined threshold value. For example,
for the fuel cell of FIG. 2b, a predetermined
threshold value f or dV/d(OS) could be a value
between 0.02 and 0.3. For a threshold value of
0.3, oxidant stoichiometry could be reduced to
about 1.2 before dV/d(OS) would increase to above
about 0.3; at this point voltage output is still
higher than 0.6 volts so fuel cell performance is
not significantly compromised.
In the example of FIGS. 2a and 2b, the fuel
cell was a Ballard° MK V fuel cell which employed
a solid polymer ion exchange membrane made from
Nafion'~'M 117 (a copolymer of tetrafluoraethylene
and perfluorovinylether sulfonic acid). The
electrodes were made from carbon fiber paper with
a thickness of 0.09 inch (about 2.29 mm) obtained
from Toray Industries Inc. The catalyst layer on
the electrodes was platinum black catalyst mixed
with a tetrafluoroethylene binder. The catalyst
loading on each electrode was 4 mg/cm~.
In the example of FIGS. 2a and 2b, if fuel
AMENDED SHEET
1712-2001 CA 02392555 2002-05-24
CA00014
- 27 -
cell voltage output is monitored, dV/d{OS) itself
need not be monitored, since the relationship
between voltage output and dV/d(OS) may be
determined (see, for example, FIG. 2b).
Accordingly, the oxidant delivery subsystem may be
controlled to maintain voltage output between
about 0.63 volt and about 0.67 volt, then oxidant
stoichiometry will be maintained between about 1.2
and about 1.4. That is, if sensor 104 detects a
voltage output higher than 0.67 volt, controller
105 controls the oxidant delivery subsystem to
reduce the speed of mechanical device 111, thereby
reducing parasitic power consumption, reducing
oxidant stoichiometry, and keeping dV/d(OS) within
the desired predetermined range. If sensor 104
detects a voltage output less than 0.63 volts,
then controller 105 controls the oxidant delivery
subsystem to increase the speed of mechanical
device 111, to lower dV/d(OS) and increase voltage
output and oxidant stoichiometry, thereby
preventing oxidant starvation at the fuel cell
cathodes.
Persona skilled in the art will recognize
that fuel cell stacks, with different features,
such as, for example, the size of the
electrochemically active area, may operate under
the same conditions and produce different voltages
from those shown in FIG. 2a. However, for any
particular fuel cell or fuel cell stack, a similar
relationship between voltage output and oxidant
stoichiometry can be plotted and used during
normal operating conditions to control oxidant
stoichiometry to reduce parasitic power
AMENDED SHEET
CA 02392555 2002-05-24
WO 01/43216 PCT/CA00/01426
- 28 -
consumption and maintain dV/d(OS) within a desired
predetermined range.
FIG. 2a also shows plot B which sets forth,
for the same fuel cell, theoretical heat produced
within the fuel cell (right y-axis)as a function
of oxidant stoichiometry (x-axis). The
theoretical amount of heat produced within the
fuel cell was calculated by calculating the heat
balance for the fuel cell. That is, the
calculation determined the heat produced by
15 considering the total enthalpy of the inlet and
outlet fluid streams and the power produced. Plot
B shows that for this particular fuel cell there
is a substantial increase in the heat produced
therein when the oxidant stoichiometry is between
20 1.2 and 0.9. Because increases in temperature
within a fuel cell may cause increases in
parasitic power consumption by the cooling
subsystem, it is important to also consider this
effect when selecting the desired predetermined
25 range for dV/d(OS). Accordingly, for some fuel
cells the desired range for dV/d(OS) may correlate
to an oxidant stoichiometry range between about
1.2 and 2Ø
FIG. 2c is a plot of the data from four fuel
30 cells that were arranged in a stack, with each
fuel cell operating at a constant current density
of 500 amps per square foot (about 540 milliamps
per square centimeter). Plots E through H each
set forth dV/d(OS) as a function of oxidant
35 stoichiometry for a respective one of the four
fuel cells in the stack. Plot I sets forth the
average dV/d(OS) against oxidant stoichiometry.
CA 02392555 2002-05-24
WO 01/43216 PCT/CA00/01426
- 29 -
FIG. 2c, like FIG. 2b, shows the relationship
between oxidant stoichiometry and dV/d(OS), and
how dV/d(OS) progressively increases as oxidant
stoichiometry is reduced towards one.
FIG. 2c shows that, within a fuel cell stack,
there may be different values for dV/d(OS) for
different fuel cells. In this case, the fuel cell
may be controlled with reference to the average
dV/d(OS). Alternatively, the value of dV/d(OS)
for a selected fuel cell may be monitored to
~5 control the oxidant stoichiometry for an entire
fuel cell stack. The selected fuel cell may be
made more responsive to changes in oxidant
stoichiometry so that oxidant stoichiometry may be
controlled to prevent large fluctuations in fuel
20 cell performance. For example, the selected fuel
cell may be designed so that its voltage output
decreases more rapidly than the voltage output of
the other fuel cells in the stack, so that oxidant
stoichiometry may be increased before there is a
25 significant decrease in the voltage output of the
fuel cell stack.
The logic diagrams of FIGS. 3a, 3b, and 4-12
will be explained with reference to the components
of the fuel cell system shown in FIG. 1.
30 In a preferred embodiment, controller 105 may
be programmed to perform the method shown in the
logic diagram of FIG. 3a. In this method,
controller 105 controls oxidant stoichiometry to
reduce parasitic power consumption in response to
35 signals emitted from sensor 104, by controlling
oxidant stream mass flow rate using motor 112 and
mechanical device 111. The method starts at step
CA 02392555 2002-05-24
WO 01/43216 PCT/CA00/01426
- 30 -
120. In step 122 reactants are supplied to fuel
cell stack 100 and sensor 104 is activated.
During operation of stack 100, at step 124, sensor
104 monitors at least one operational
characteristic that correlates to dV/d(OS). For
example, for a fuel cell operating at a constant
current density, the operational characteristic
measured by sensor 104 may be fuel cell voltage
output or an operational characteristic which
correlates to oxidant stoichiometry, because if
one of these operational characteristics is known,
dV/d(OS) may be determined by referring to a plot
of cell voltage as a function of oxidant
stoichiometry (for example, FIG. 2a). Sensor 104
may measure the voltage output of fuel cell stack
100 or the voltage output of selected individual
fuel cells 101, to determine dV/d(OS) for stack
100 or individual fuel cells 101, respectively.
Alternatively, sensor 104 may measure the
concentration of oxygen in a cathode exhaust
stream to determine oxidant stoichiometry, which
correlates to dV/d(OS). The oxygen concentration
in the oxidant supply stream is known when it is
pure oxygen (that is, 100%), or air (that is,
about 200). If the concentration of oxygen in a
dilute oxidant supply stream is not constant, then
an oxygen sensor may be used to measure the oxygen
concentration upstream of fuel cell stack 100.
Alternatively, if fuel cell current output and
oxygen concentration in the cathode exhaust are
known, controller 105 may calculate oxidant
stoichiometry by determining the amount of oxygen
consumed by the fuel cell to generate the
CA 02392555 2002-05-24
WO 01/43216 PCT/CA00/01426
- 31 -
electrical current.
In another embodiment, when sensor 104
measures hydrogen concentration in the cathode
exhaust stream, the detection of hydrogen above a
threshold amount, (for example, 20 ppm), may
indicate that a significant amount of oxidant
starvation is occurring at a fuel cell cathode.
In this embodiment, the concentration of hydrogen
determines the severity of the oxidant starvation
that correlates to an oxidant stoichiometry for
the fuel cell. Accordingly, sensor 104 outputs a
signal that is representative of the measured
value of any operational characteristic that
itself, or in combination with other factors,
correlates to dV/d(OS). The output signal from
sensor 104 may thus be received and processed by
controller 105 to calculate or infer dV/d(OS) so
that controller 105 may control the oxidant
stoichiometry to reduce parasitic power
consumption.
In steps 126 and 128, controller 105
determines whether the operational characteristic
correlates to a dV/d(OS) that is within the
desired range. At step 126, if the operational
characteristic correlates to a dV/d(OS) that is
lower than a first predetermined value (that is,
the upper limit of the desired oxidant
stoichiometry range), then, at step 132 controller
105 causes the oxidant stoichiometry to be
decreased. At step 128, if the operational
characteristic correlates to a dV/d(OS) that is
greater than a second predetermined value
(that is, the lower limit of the desired
CA 02392555 2002-05-24
WO 01/43216 PCT/CA00/01426
- 32 -
g oxidant stoichiometry range), then, at step 134
controller 105 causes the oxidant stoichiometry to
be increased. If it is determined that the
present oxidant stoichiometry is within the
desired range (that is, the answer is "no" to the
questions posed in both steps 126 and 128), then
no steps are taken to change oxidant
stoichiometry. After steps 128, 132 or 134, it is
determined whether sensor 104 is still activated.
As long as sensor 104 remains activated, the
method repeats by returning to step 124. If
sensor 104 is no longer activated, the process
stops at step 138.
The method of FIG. 3b is substantially the
same as the method of FIG. 3a, with the addition
20 of step 125, which provides for specifically
checking whether or not oxidant starvation is
detected. For the steps that are common to the
methods of both FIG. 3b and FIG. 3a the same
reference numerals are employed.
25 The desired operating range for the oxidant
stoichiometry may have a lower limit that normally
prevents significant oxidant starvation at the
cathodes. However, localized oxidant starvation
may occur, even when oxidant stoichiometry is much
30 higher than one (for example, even when oxidant
stoichiometry is within the desired operating
range). Localized oxidant starvation may occur at
portions of the cathode where the oxidant is
prevented from accessing the catalyst, for example
35 where access is prevented by the accumulation of
water. Localized starvation conditions may result
in reduced performance, lower efficiency, and
CA 02392555 2002-05-24
WO 01/43216 PCT/CA00/01426
- 33 -
undesirable hydrogen production at the cathode.
Localized oxidant starvation is difficult to
detect because fuel cell stack 100, as a whole,
may have a positive voltage within the desired
operating range, while only a portion of the
cathode is oxidant starved. Efficiency may be
improved by counter-acting localized starvation,
for example, by temporarily increasing oxidant
mass flow rate through the cathode to disperse
accumulated water from the cathode.
Localized oxidant starvation may be detected
by monitoring for irregularities that may be
indicators of oxidant starvation, such as, for
example, detecting a threshold hydrogen gas
concentration (for example, greater than 20 ppm)
in the cathode exhaust stream. The actual
threshold hydrogen gas concentration selected for
a particular fuel cell or fuel cell stack will
depend upon the particular characteristics such
as, for example, the number of fuel cells in a
stack, the mass flow rate of oxidant stream, the
type of electrolyte, and so forth. Localized
oxidant starvation may not have a determinative
effect on the voltage output of fuel cell stack
100, but any degree of oxidant starvation may
result in the production of hydrogen at the
cathode. Another method of detecting a
possibility of localized oxidant starvation in
fuel cell stack 100 is monitoring the voltage
output of individual fuel cells 101. If an
individual fuel cell has a lower voltage output
than the other fuel cells in stack 100, this is an
indication that there may be a localized oxidant
CA 02392555 2002-05-24
WO 01/43216 PCT/CA00/01426
- 34 -
starvation problem (for example, caused by the
accumulation of water in the cathode of the fuel
cell with the low voltage output).
According to the method of FIG. 3b, at step
125, if oxidant starvation is detected, then
oxidant stoichiometry is increased at step 134.
At step 125, if oxidant starvation is not
detected, then the process beginning at step 126
is essentially the same as in the process of FIG.
3a.
FIG. 4 illustrates another method of reducing
oxidant stoichiometry to reduce parasitic power
consumption wherein sensor 104 monitors for an
operational characteristic that is indicative of
oxidant starvation at the cathode. The method of
FIG. 4 starts at step 140. At step 142 an oxidant
stream is supplied to a fuel cell cathode, a fuel
stream is supplied to a fuel cell anode and sensor
104 is activated. At step 144 activated sensor
104 monitors for oxidant starvation at the
cathode. Sensor 104 sends a signal to controller
105 that indicates when oxidant starvation is
detected at the cathode. Sensor 104 may detect,
for example, the voltage output of fuel cell stack
100 or selected individual fuel cells within stack
100. Alternatively, sensor 104 may detect the
concentration of oxygen or hydrogen in a cathode
exhaust stream. For example, if no oxygen, or
only a "very low concentration", is detected, this
is a good indication that oxidant starvation may
be occurring at the cathode. The definition of
what constitutes a "very low concentration" of
oxygen depends upon the operating conditions and
CA 02392555 2002-05-24
WO 01/43216 PCT/CA00/01426
- 35 -
the properties of the reactants. For example, if
the inlet oxidant stream comprises about 200
oxygen, then a "very low concentration" may be 5%
oxygen in the cathode exhaust stream (that is,
corresponding to an overall oxidant stoichiometry
of about 1.33). However, if, for example, the
inlet oxidant stream comprises 30% oxygen, then a
"very low concentration" may be 7% (that is,
corresponding to an overall oxidant stoichiometry
of about 1.30). Preferably, the concentration of
oxygen selected as a threshold value corresponds
to a predetermined oxidant stoichiometry, with
consideration given to the oxygen concentration in
the inlet oxidant stream. Similarly, if sensor
104 measures a hydrogen concentration above a
20 threshold amount (for example, above 20 ppm), then
it is likely that oxidant starvation is occurring
at a fuel cell cathode. The values for the
threshold concentrations depend upon the
particular characteristics of the fuel cell
25 system, such as, for example, the oxidant stream
flow rate, the size of the fuel cells and the
number of fuel cells in a stack.
At step 146, controller processes the signal
from sensor 104 and determines whether oxidant
30 starvation, or a likelihood of oxidant starvation,
has been detected. In either case, if such a
condition is detected, then the oxidant
stoichiometry is increased at step 148. If, at
step 146 it is determined that there is no
35 indication of oxidant starvation at the fuel cell
cathodes, then the oxidant stoichiometry is
decreased at step 150.
CA 02392555 2002-05-24
WO 01/43216 PCT/CA00/01426
- 36 -
After either step 148 or 150, controller 105
checks at step 152 whether sensor 104 is still
activated. If sensor 104 is no longer activated,
then the method stops at step 154. As long as
sensor 104 remains activated, the method of
controlling the oxidant stoichiometry repeats by
returning to step 144.
The logic diagrams of FIGS. 5-12 are directed
to examples of methods wherein the operational
characteristic measured by sensor 104 is the
concentration of hydrogen gas in a cathode exhaust
stream. In view of the present disclosure,
persons skilled in the art will understand that,
alternative operational characteristics such as,
for example, fuel cell voltage output or oxidant
20 concentration, may also be used in conjunction
with the methods set out in the logic diagrams of
FIGS. 5-12. That is, sensor 104 may be a sensor
that measures any operational characteristic of
the fuel cell system that may be employed by
25 controller 105 to determine dV/d(OS) and/or the
presence of oxidant starvation at the cathode.
FIG. 5 is a logic diagram for a method
wherein controller 105 determines whether to
increase or decrease oxidant stoichiometry based
30 upon whether the hydrogen gas concentration
measured by sensor 104 exceeds a predetermined
threshold concentration (TC). The method starts
at step 160. At step 162 sensor 104 monitors the
cathode exhaust stream for hydrogen gas. At step
35 164 controller 105 determines whether the hydrogen
gas concentration measured at step 162 exceeds TC.
Minute quantities of hydrogen in the cathode
17-12-2001 CA 02392555 2002-05-24 CA00014a
- 37 -
exhaust stream may not be indicative of a problem.
Accordingly, TC is a threshold hydrogen gas
concentration that is empirically known for a
particular fuel cell to be indicative of oxidant
starvation at the cathodes. For example, for a
Ballard~ MK V fuel cell, controller 105 may be
programmed so that TC is a hydrogen concentration
of 20 ppm. Until sensor 104 detects a hydrogen
concentration greater than or equal to '.rC,
controller 105 reduces oxidant stoichiometry at
step 166, typically by reducing the mass flow rate
of the oxidant supply stream (thereby reducing
parasitic power consumption?.
When sensor 104 detects a hydrogen
concentration greater than TC, this is an
indication that oxidant starvation is occurring
(or is likely to occury and controller :105
proceeds to step 168. At step 168, controller 105
determines whether the oxidant stream mass flow
rate is greater than or equal to a desired
maximum. If the oxidant stream mass flow rate is
not greater than or equal to the desired maximum,
then oxidant stoichiometry is increased at step
170. Normally oxidant stoichiometry is increased
by controlling motor 112 to increase the speed of
mechanical device 111. Alternatively, other
measures may be used instead or in combination
with controlling motor 112 to increase oxidant
stoichiometry. For example, oxidant stoichiometry
may be increased by reducing electrical power
output without a corresponding reduction in
oxidant stream mass flaw rate.
If, however, it is determined at step 168
AMENDED SHEET
CA 02392555 2002-05-24
WO 01/43216 PCT/CA00/01426
- 38 -
that the oxidant stream mass flow rate is in fact
greater than or equal to the desired maximum mass
flow rate, then, controller 105 proceeds to step
172 and determines whether to generate a warning
signal (step 174) while continuing to operate the
fuel cell system, or, shut down (cease operation
of) fuel cell stack 100 at step 176. At step 172,
controller 105 makes its determination by
considering whether the hydrogen gas concentration
is higher or lower than a predetermined
concentration limit (CL). CL is typically a value
much greater than TC. If the hydrogen
concentration is higher than CL, this indicates
that a much higher than normal concentration of
hydrogen is present at the cathode. For example,
if the fuel is hydrogen, a significant amount of
fluid leakage between the anode and cathode may
cause the hydrogen concentration in the cathode
exhaust stream to exceed CL, and such a condition
warrants shutting the fuel cell down so that the
cause of the elevated hydrogen concentration may
be investigated.
If the fuel cell system comprises an array of
fuel cell stacks with each stack monitored in the
manner depicted in FIG. 5, then the array may
continue to produce electrical power, but with one
stack shut down.
As noted above, operational characteristics
other than hydrogen concentration in the cathode
exhaust stream may be employed instead. For
example, with reference to the logic diagram of
FIG. 5, alternate equivalent steps are described
herein for a sensor that measures fuel cell
CA 02392555 2002-05-24
WO 01/43216 PCT/CA00/01426
- 39 -
voltage output. Alternate steps are described
using the same reference numerals, but with a
suffixed "a". According to the alternate method,
after starting the method at step 160a, a fuel
cell voltage output sensor monitors output voltage
at step 162a. At step 164a, controller 105
determines if the output voltage is lower than a
predetermined threshold output voltage (TOV). In
this example, the predetermined TOV preferably
corresponds to a condition when there is a
potential for oxidant starvation at the fuel cell
cathode. If voltage output is lower than TOV, the
oxidant stoichiometry is increased at step 170a,
but not before first checking, at step 168a, that
the oxidant stream mass flow rate is not already
greater than or equal to a desired maximum. If
fuel cell voltage output is not less than TOV,
then controller 105 decreases oxidant
stoichiometry at step 166a. At step 168a, if it
is determined that oxidant stream mass flow rate
is greater than or equal to a desired maximum,
then controller 105 proceeds to step 172a. At
step 172a, if the sensor measures an output
voltage that indicates cell reversal, then
controller 105 shuts down the fuel cell at step
176a. If cell reversal is not detected, then the
fuel cell system may continue to operate, but with
controller 105 generating a warning signal at step
174a.
FIG. 6 is a logic diagram which illustrates a
method wherein controller 105 determines an
appropriate action with reference to a
predetermined desired oxidant stoichiometry for
CA 02392555 2002-05-24
WO 01/43216 PCT/CA00/01426
- 40 -
the instant electrical power output. The method
starts at step 180 with the supply of reactants to
fuel cell stack 100 and activation of sensor 104.
At step 182, sensor 104 monitors the cathode
exhaust stream for hydrogen gas. At step 184, if
sensor 104 measures a hydrogen gas concentration
less than threshold concentration TC, the
controller 105 decreases the oxidant stoichiometry
at step 186. If sensor 104 does not detect a
hydrogen gas concentration less than TC, then, at
step 188, controller 105 refers to a look up table
to determine the desired oxidant mass flow rate
for the instant electrical power output. At step
190, controller 105 determines whether the actual
oxidant mass flow rate is more than a
predetermined amount (for example, Po) higher than
the desired oxidant mass flow rate. If the actual
oxidant mass flow rate is not already greater than
Po higher than the desired oxidant mass flow rate,
then controller 105 increases the oxidant
stoichiometry at step 192. If, however, the
actual oxidant mass flow rate is greater than P%
higher than the desired oxidant mass flow rate,
then, at step 194, controller 105 generates a
warning signal or shuts down the fuel cell. If
controller 105 generates a warning signal, it may
also control the fuel cell system to reduce the
electrical power output or limit the peak power
output. As with the embodiment of FIG. 5, in the
method of FIG. 6, the magnitude of the measured
hydrogen gas concentration may be used to
determine the appropriate action (that is, a
warning signal or shutting down (ceasing operation
CA 02392555 2002-05-24
WO 01/43216 PCT/CA00/01426
- 41 -
g of) fuel cell stack 100).
In the logic diagrams of FIGS. 7-9, the
methods comprise determining whether the hydrogen
gas concentration detected in the cathode exhaust
stream is increasing or decreasing, and using this
information to determine what action is
appropriate in response to the changing hydrogen
gas concentration.
With reference to FIG. 7, the method starts
at step 200, by supplying reactants to fuel cell
stack 100 and activating hydrogen sensor 104. At
step 202 sensor 104 begins monitoring the cathode
exhaust stream for hydrogen gas. Once activated,
sensor 104 measures the hydrogen gas concentration
in the cathode exhaust stream. Sensor 104
measures the instant hydrogen gas concentration
(H) and controller 105 calculates dH/dt where dH
is the change in H and dt is the change in time
(at constant time intervals). By calculating
whether dH/dt is positive, negative, or zero,
controller 105 determines whether H is increasing,
decreasing, or constant, respectively.
Step 204 follows step 202. At step 204,
controller 105 determines whether the instant H is
higher than a predetermined threshold
concentration (TC). If not, then controller
determines that there is no oxidant starvation at
the cathode and there is excess oxygen at the
cathode. Accordingly, at step 206, controller 105
decreases the oxidant stoichiometry, for example,
by reducing the speed of motor 112 to decrease the
oxidant stream mass flow rate supplied to fuel
cell stack 100. Oxidant stoichiometry is thus
CA 02392555 2002-05-24
WO 01/43216 PCT/CA00/01426
- 42 -
advantageously controlled to reduce parasitic
power consumption.
However, if at step 204, controller
determines that the instant H is greater than TC,
controller 105 advances to step 208 to determine
whether dH is negative (that is, whether
hydrogen concentration is decreasing). If
controller 105 determines that dH/dt is negative,
controller 105 preferably returns to step 202
without taking any positive action to counteract
the detection of a hydrogen. gas concentration
greater than TC. However, at step 208, if
controller 105 determines that dH/dt is not
negative (that is, H is greater than TC and
the hydrogen concentration is either constant or
increasing), then, controller 105 advances to step
210 and determines whether the oxidant stream mass
flow rate is greater than or equal to a desired
maximum mass flow rate. If oxidant stream mass
flow rate is not greater than or equal to the
desired mass flow rate, then controller 105
proceeds to step 212 and increases the oxidant
stoichiometry, preferably by a predetermined
increment. Controller 105 then returns to step
202 to determine the effect of the increase in
oxidant stoichiometry and to repeat the method.
At step 210, if controller 105 determines
that the oxidant stream mass flow rate is already
greater than or equal to a desired maximum mass
flow rate, then controller 105 advances to step
214 and generates a warning signal and may
eventually shut down fuel cell stack 100 (step
220). In the embodiment shown in FIG. 7,
CA 02392555 2002-05-24
WO 01/43216 PCT/CA00/01426
- 43 -
controller 105 may initiate additional steps 216
and 218 before proceeding to shut down fuel cell
stack 100. Since the oxidant stream mass flow
rate is already greater than or equal to the
desired maximum, controller 105 proceeds to step
214 to generate a warning signal and then to step
216 to attempt a corrective action other than
increasing the oxidant stream mass flow rate. One
or more leaks within the fuel cell may be the
cause for detecting an excessive amount of
hydrogen gas in the cathode exhaust stream. For
example, hydrogen could be leaking from the anode
fluid passages to the cathode fluid passages, or a
leak in the oxidant delivery subsystem could
prevent a sufficient supply of oxygen from being
20 directed to the cathode.
At step 216, controller 105 reduces the fuel
pressure in fuel cell stack 100. If one or more
leaks between the anode and the cathode are the
cause for detecting hydrogen gas at the cathode,
25 then reducing fuel pressure at the anode may
reduce the rate of transfer of fuel from the
anodes to the cathodes. Fuel pressure may be
adjusted, for example by adjusting a pressure
control valve or reducing the speed of a fuel
30 compressor. Since the fuel stoichiometry may
initially be greater than one, the reduction in
fuel pressure may not have an immediate effect on
electrical power output.
At step 218 controller 105 determines whether
35 electrical power output is in fact less than
electrical power demand. If electrical power
output from fuel cell stack 100 is less than
17-1 c-2001 CA 02392555 2002-05-24 CA00014.
- 44 -
electrical power demand, then controller 105
proceeds to shut down fuel cell stack 100. If,
however, electrical power output continues to
match electrical power demand, then controller 105
returns step 202 and the fuel cell system
continues to operate while the method is repeated.
Meanwhile, the warning signal generated at step
214 alerts the operator that there is a problem
that needs to be investigated to determine why H
is greater than TC.
In FIG. 8, the method starts at step 230 and
advances immediately to step 232 where sensor 104
begins to monitor the cathode exhaust stream to
measure hydrogen gas concentration (H), and
controller 105 calculates dH/dt. At step 234,
controller 105 determines whether H is greater
than threshold concentration (TC) or, at step 238,
whether dH/dt is negative. The logic of steps
232, 234, 236, and 238 is substantially the same
as the logic of corresponding steps shown in FIG.
7 (that is, 202, 204, 206, and 208, respectively).
However, in the method of FIG. 8, if it is
determined at step 238 that dH/dt is not negative,
then controller 105 proceeds to step 240 and
considers whether the fuel cell voltage is less
than a predetermined voltage Vo. For example, in
a preferred embodiment, voltage Vo is assigned a
value between zero and about 200 mV. The selected
value for voltage Vo is preferably greater than
zero because localized oxidant starvation may
produce hydrogen even though the overal:L cell
voltage is still positive. For example, a
hydrogen concentration of about 20 ppm may be
AMENDED SHEET
CA 02392555 2002-05-24
WO 01/43216 PCT/CA00/01426
- 45 -
measured in the cathode exhaust stream when fuel
cell stack 100 has an average cell voltage of
about 100 mV. Accordingly, if controller 105
determines that there is a combination of a
positive dH/dt, and a cell voltage less than Vo,
the cause of these two conditions may be oxidant
starvation. However, if the cell voltage is
greater than Vo, this is an indication that cell
reversal is probably not the cause for detecting
hydrogen gas in the cathode exhaust.
Therefore, if controller 105 determines at
step 240 that cell voltage is not less than Vo,
controller 105 determines that oxidant starvation
is not likely the cause for H being greater than
TC (that is, because oxidant starvation would be
accompanied by a significantly reduced fuel cell
voltage). More likely, the cause of H being
greater than TC is one or more fluid leaks between
the anode and cathode. Accordingly, controller
105 proceeds to step 246 and reduces the fuel
pressure in fuel cell stack 100 to confirm that
fluid leaks are indeed the reason for H being
greater than TC. Steps 248 and 250 are
essentially the same as steps 218 and 220 in the
method of FIG. 7.
In order to better detect localized oxidant
starvation conditions in fuel cell stack 100, the
voltage of the individual fuel cells may be
monitored. Alternatively, a more simplified cell
voltage monitoring system may be employed to
measure the cell voltage of selected fuel cells in
a stack, or the average cell voltage of more than
one fuel cell in a fuel cell stack. Accordingly,
CA 02392555 2002-05-24
WO 01/43216 PCT/CA00/01426
- 46 -
in the embodiments of FIG. 8 and 9, the measured
voltage Vo may be an individual fuel cell voltage,
an average voltage of a plurality of fuel cells,
or the average voltage of all the fuel cells in
fuel cell stack 100.
In the embodiment of FIG. 8, at step 240, if
the fuel cell voltage is less than Vo, controller
105 proceeds to step 242 and checks whether the
oxidant stream mass flow rate is already greater
than or equal to the desired maximum. If yes,
this is an indication that oxidant starvation is
not likely the reason for H being greater than TC,
and controller proceeds to step 246. Steps 246,
248 and 250 are similar to corresponding steps
216, 218, and 220 of FIG. 7. If the oxidant
stream mass flow rate is less than the desired
maximum, at step 244 controller 105 increases the
oxidant stoichiometry, for example, by causing
motor 112 to speed up so mechanical device 111
increases the oxidant stream mass flow rate to
fuel cell stack 100.
The method illustrated by FIG. 9 has steps
260, 262, 264, 266, 268, 270, 272, and 274 in
common with respective steps 230, 232, 234, 236,
238, 240, 242, and 244 of the method shown in FIG.
8. In FIG. 9, steps 276 and 278 are substituted
for steps 246 and 248 in FIG. 8, and additional
steps 280 and 284 are added following step 278.
If at step 270, controller 105 determines that the
fuel cell voltage is not less than Vo, controller
105 may proceed to step 276 to take further action
to confirm that a leak is the likely source of the
hydrogen gas in the cathode exhaust stream. At
fl
17-12-2001 CA 02392555 2002-05-24 CA00014c
- 47 -
step 276, the pressure of the oxidant and fuel
stream are adjusted to regulate the pressure
differential between the oxidant and fuel stream
fluid passages. For example, controller 105 may
cause an increase in the pressure differential
between the oxidant and fuel passages to determine
whether this has a corresponding effect on H
detected by sensor 104. If, at step 278, a
corresponding effect is detected (that i.s, the
adjustment of the pressure differential in step
276 influenced the hydrogen gas concentration in
the cathode exhaust stream), then it is determined
that a leak is the likely source of the hydrogen
gas and controller 105 generates a warning signal
at step 280. Then controller 105 selects whether
to continue operating at a reduce power output
(step 284) or to shut down the fuel cell (step
2B2) If controller 105 selects step 284, it may
further regulate the oxidant and fuel pressures to
balance the reactant pressures so that the
pressure differential is approximately ~.ero to
thereby reduce the amount of hydrogen which is
transferred from the fuel passages to the oxidant
passages. The choice between step 282 and step 284
may be made based on the variance between the
electrical power output and the electrical power
demand. For example, if the electrical power
output is more than a predetermined amount less
than electrical power demand, step 282 is selected
and fuel cell stack 100 is shut down.
Controller 105 may also proceed to step 276
from step 272, if the fuel cell voltage is less
than Vo and the oxidant mass flow rate is greater
AMENDED SHEET
CA 02392555 2002-05-24
WO 01/43216 PCT/CA00/01426
- 48 -
than or equal to a desired maximum.
FIGS. 10 and 11 depict preferred embodiments
of a method of controlling the oxidant
stoichiometry wherein sensor 104 is periodically
activated to detect the presence of hydrogen gas
in the cathode exhaust stream. The delay between
periodic activation of sensor 104 may vary
depending upon several variables. A short delay
may be employed for applications where the
electrical power output is continually changing,
for example where fuel cell stack 100 is supplying
electrical power to a drive motor for a vehicle.
In such applications, the delay may only be long
enough to allow the effects of any corrective
actions to be determined. A short delay is
desired so that sensor 104 is activated with
sufficient frequency to be responsive to changes
in electrical power output. Longer delays may be
employed by applications such as stationary power
plants, which tend to operate to produce a more
constant electrical power output.
With reference to FIG. 10, the control logic
starts by activating controller 105 at step 290.
At step 292, the initial value for the hydrogen
gas concentration (C ) is set to zero. At step
0
294 controller 105 sets counter number "n" to one.
At step 296, controller 105 activates sensor 104
to detect the presence of hydrogen gas in a
cathode exhaust stream. Sensor 104 emits an
output signal that is representative of the
hydrogen gas concentration (Cn). This output
signal is sent to controller 105, which determines
at step 298 whether C is greater than the
n
CA 02392555 2002-05-24
WO 01/43216 PCT/CA00/01426
- 49 -
g threshold concentration TC. If Cn is not greater
than TC, then it is assumed that there are no
problems with leaks or oxidant starvation. To
improve efficiency by reducing parasitic
electrical loads, controller 105 proceeds to step
300 and decreases the oxidant stoichiometry by a
predetermined amount (for example, a fixed
increment or a percentage). Then at step 302,
controller 105 increases the value of n by one
before proceeding to step 304. At step 304
controller 105 waits for a predetermined delay
period to elapse before returning to step 296 to
re-activate sensor 104. Therefore, so long as
there is no oxidant starvation, and no leaks or
other sources of hydrogen gas in the cathode
exhaust, controller 105 will continue to loop
through steps 296, 298, 300, 302 and 304. In this
way, the oxidant stoichiometry is reduced to about
one or until C is greater than TC. Decreasing
n
oxidant stoichiometry in this manner reduces
parasitic power consumption.
At step 298, when Cn is greater than TC,
controller 105 proceeds to step 306 and compares
C to the previously measured hydrogen gas
n
concentration, C~n_1~ . If Cn - C~n_1~ is negative,
this indicates that the hydrogen gas concentration
has decreased and controller 105 returns to step
296 via steps 302 and 304. As long as the
hydrogen gas concentration is decreasing,
controller 105 does not actively take any
corrective action. At step 302, counter number n
is increased by one. Step 304 is the delay step.
However, if at step 306, controller 105
CA 02392555 2002-05-24
WO 01/43216 PCT/CA00/01426
- 50 -
g determines that Cn - C~n_1~ is positive, this
indicates that the hydrogen gas concentration has
increased from the previous measurement. This
prompts controller 105 to take corrective action
by proceeding to step 308. At step 308,
controller 105 determines from the present oxidant
stream mass flow rate whether or not the oxidant
stream mass flow rate is greater than or equal to
the desired maximum. If not, controller 105
proceeds to step 310 and increases the oxidant
stoichiometry, for example, by causing motor 112
to speed up so mechanical device 111 increases the
mass flow rate of the oxidant stream supplied to
fuel cell stack 100. After step 310, controller
105 eventually loops back to step 296 after
performing intermediate steps 302 (increasing
counter number n by one) and 304 (the delay step).
_This corrective action presumes that the cause of
the increased concentration of hydrogen gas in the
cathode exhaust is oxidant starvation at the
cathode.
However, if oxidant starvation is not the
cause for the increasing hydrogen gas
concentration in the cathode exhaust, the oxidant
stream mass flow rate will soon be increased to
the maximum mass flow rate. Then, at step 308,
controller 105 will recognize that oxidant
starvation is not the cause of the problem and
controller 105 will proceed to step 312.
At step 312, controller 105 reduces the
pressure in the fuel stream by a predetermined
amount (for example, a fixed increment or a
percentage). If the source of the hydrogen gas
CA 02392555 2002-05-24
WO 01/43216 PCT/CA00/01426
- 51 -
detected in the cathode exhaust is a leak in fuel
cell stack 100, reducing the pressure in the fuel
stream may have a corresponding effect on the
leakage rate. Since the fuel stoichiometry may
initially be greater than 1.0 (for example, a fuel
stoichiometry of 1.5 or 2.0 is common), decreasing
the fuel mass flow rate may not initially affect
the electrical power output. At step 314,
controller 105 checks whether the electrical power
output is less than the electrical power demand.
If the electrical power output is not less than
the electrical power demand, controller 105 loops
back to step 296 after performing intermediate
steps 302 and 304. However, if the electrical
power output is less than electrical power demand,
20 this indicates that there is a problem with fuel
cell stack 100 that prevents it from performing at
this capacity. In this case, controller 105
proceeds to step 316 where controller 105 either
generates a warning signal or causes fuel cell
25 stack 100 to shut down.
With regard to steps 300, 310, and 312 of
FIG. 10, the respective oxidant stoichiometry or
fuel pressure may be increased and decreased by a
predetermined fixed percentage or a fixed
3p increment. For example, the fixed percentage
change in oxidant stoichiometry or fuel pressure
may be 1 or 2%.
With reference to FIG. 11, steps 320, 322,
324, 326, 328, 332, 334, 336, 340, 342, 344, and
35 346 are substantially the same as steps 290, 292,
294, 296, 298, 302, 304, 306, 308, 312, 314 and
316 of FIG. 10, respectively. However, in the
CA 02392555 2002-05-24
WO 01/43216 PCT/CA00/01426
- 52 -
method of FIG. 11, controller 105 attempts to
maintain an oxidant stoichiometry that is a
desired amount above 1.0 (that is, 1.0 + Y). For
example Y may be, for example, 0.05, 0.10, 0.20,
or even about 0.50 (that is, about 50%).
l0 Preferably Y represents an increase of less than
50% to avoid excessive parasitic power
consumption. In this way, a small surplus oxidant
buffer is provided to reduce the occurrence of
oxidant starvation conditions that might produce
~g hydrogen gas in the cathode exhaust. The oxidant
stoichiometry is still preferably much less than
the oxidant stoichiometries used in conventionally
operated fuel cells so there is still a
substantial reduction in the parasitic electrical
20 load caused by the operation of oxidant stream
mechanical device 111.
In the embodiment of FIG. 11, after step 328,
if controller 105 determines that the hydrogen gas
concentration (C ) is less than threshold
n
25 concentration TC, then controller loops back to
step 326 via steps 330, 332 (increasing counter
number n by one), and 334 (the delay step). At
step 330 controller 105 decreases the oxidant
stoichiometry by a predetermined increment (X),
30 where X may be, for example, about 0.1 or about
0.2. Accordingly, if, for example, X is 0.1 and
oxidant stoichiometry is 1.4, at step 330
controller 105 would adjust oxidant stream mass
flow rate to decrease oxidant stoichiometry to
35 1.3. Thus, while there is an excess of oxidant at
the cathode, oxidant stream mass flow rate is
reduced through the loop comprising steps 326,
CA 02392555 2002-05-24
WO 01/43216 PCT/CA00/01426
- 53 -
328, 330, 332 and 334 until controller 105
determines at step 328 that C is greater than TC,
n
whereupon controller 105 proceeds to step 336.
Step 336 of FIG. 11 performs substantially
the same function as step 306 of FIG. 10. That is,
if the hydrogen gas concentration is decreasing
(that is, Cn-C~n_1~ is negative) , then controller
returns to step 326 via steps 332 and 334.
Controller 105 continues to periodically monitor
C without taking any action to actively increase
n
oxidant stoichiometry. However, if controller 105
determines at step 328 that Cn > TC, and at step
336, that the hydrogen gas concentration is
constant or increasing (that is, Cn - C~n_1~ is not
negative), the controller 105 proceeds to step
20 338.
At step 338, if controller 105 determines
that the previous measurement of the hydrogen gas
concentration was less than TC, controller 105
increases the oxidant stream mass flow rate by (X
25 + Y) at step 348. For example, when TC
corresponds to an oxidant stoichiometry of about
one, in the method of FIG. 11, at step 348 oxidant
stoichiometry is controlled so that it is
approximately 1.0 + Y. That is, in the previous
30 loop, hydrogen concentration C was less than
cn-1)
TC, but decreasing oxidant stoichiometry by X
caused the hydrogen concentration in the next loop
(that is, the present loop) to be higher than TC.
Accordingly, in the previous loop, C~n_1~ was close
35 in value to TC, and since in this example, a
measured hydrogen concentration of about TC
corresponds to an oxidant stoichiometry of about
CA 02392555 2002-05-24
WO 01/43216 PCT/CA00/01426
- 54 -
one, increasing oxidant stoichiometry by (X + Y),
results in an oxidant stoichiometry of about 1.0 +
Y.
If at step 338, controller 105 determines
that the previously measured hydrogen gas
concentration was greater than TC, controller 105
proceeds to step 340 to determine whether the
oxidant stream mass flow rate is already greater
than or equal to a desired maximum. If not,
controller 105 proceeds to step 350 and increases
the oxidant stoichiometry by Z. The value of Z is
preferably greater than (X + Y) so that when Cn is
higher than TC for more than one loop, the oxidant
stoichiometry is increased more rapidly.
However, if at step 340 controller 105
determines that oxidant stream mass flow rate is
already greater than or equal to a desired
maximum, controller 105 proceeds to step 342.
Steps 342, 344 and 346 are substantially the same
as respective steps 312, 314 and 316 in FIG. 10.
FIG. 12 depicts another preferred embodiment
of a method of controlling the supply of oxidant
to a fuel cell. In the method of FIG. 12 the
preferred oxidant stream supply mass flow rate for
a predetermined oxidant stoichiometry is
calibrated for a range of specific electrical
power outputs. During a calibration procedure,
controller 105 determines the desired oxidant
stream mass flow rates (for a particular oxidant
stream composition) for selected electrical power
outputs and stores the desired mass flow rates in
a look-up table. When this method is employed,
the electrical power demand determines the oxidant
CA 02392555 2002-05-24
WO 01/43216 PCT/CA00/01426
- 55 -
stream mass flow rate. That is, a controller
monitors the electrical power demand and sets the
oxidant mass flow rate with reference to a look-up
table, which indicates the desired oxidant stream
mass flow rate for selected electrical power
demands. In this way, the oxidant stoichiometry
is controlled to reduce the amount of excess
oxidant supplied to fuel cell stack 100, thereby
reducing parasitic electrical power consumption.
FIG. 12 depicts a calibration procedure for
determining the oxidant stream mass flow rate for
different selected electrical power outputs. When
fuel cell stack 100 is actually operating, if the
electrical power output is between selected loads
in the look-up table, the desired oxidant stream
20 mass flow rate may be determined by interpolating
between selected electrical loads to determine the
desired oxidant stream mass flow rate.
In an alternative embodiment, the calibration
procedure may be used to calibrate the oxidant
25 supply system directly. For example, in a system
that employs an oxidant compressor, the system is
calibrated to control the speed of the compressor
in response to selected electrical power demands.
In this way, oxidant stream mass flow rate need
30 not be measured and with each calibration, the
calibration process will automatically compensate
for any degradation in compressor performance over
its operational lifetime.
The calibration procedure depicted in FIG. 12
35 may be executed periodically when fuel cell stack
100 is being serviced for regular maintenance.
The procedure begins at step 360, by activating
CA 02392555 2002-05-24
WO 01/43216 PCT/CA00/01426
- 56 -
controller 105. In this embodiment, because
calibration is typically done during maintenance
periods, controller 105 and sensor 104 may be
detachable from the fuel cell system. In this
way, the same equipment may be used to calibrate a
l0 plurality of fuel cell stacks. A coupling may be
provided so that a sensing element may be inserted
into the fuel cell so that the sensing element is
exposed to the cathode exhaust stream.
At step 362 an electrical power output is
15 selected and fuel cell stack 100 is operated to
produce that electrical power output. The
selected electrical power output may be any
electrical power output within the operating range
of fuel cell stack 100. A plurality of electrical
20 power outputs are typically selected during the
calibration procedure so it is convenient to start
with an electrical power output at the low end of
the range; progressively higher electrical power
outputs may be subsequently selected to complete
25 the calibration procedure.
At step 364, controller 105 accesses a look-
up table to determine the previously calibrated
oxidant stream mass flow rate for the selected
electrical power output. Controller 105 then sets
30 the oxidant stream mass flow rate so that it is
initially Io higher than the previously calibrated
oxidant stream mass flow rate for the selected
electrical power output. It is preferable to
calibrate the oxidant stream mass flow rate by
35 starting with a surplus oxidant stream mass flow
rate rather than a shortage of oxidant, since this
precaution avoids initiating the calibration
CA 02392555 2002-05-24
WO 01/43216 PCT/CA00/01426
- 57 -
procedure in an oxidant starvation mode.
At step 366 sensor 104 is activated to detect
the presence of hydrogen gas in the cathode
exhaust stream. If fuel cell stack 100 is
initially supplied with a surplus of oxidant, at
step 368, the hydrogen gas concentration C is
expected to be less than a threshold concentration
TC. If controller 105 determines that C is not
greater than TC, controller 105 continues to
decrease the oxidant stream mass flow rate by
15 looping back to step 366 via step 370. With each
loop through step 370, controller 105 decreases
the oxidant stream mass flow rate by increment A.
For example, the value of increment A may
correspond to stoichiometry reductions, of say
20 0.05 or 0.1 so that oxidant stoichiometry is
reduced by that amount each time step 370 is
performed. Because the selected load is constant
during the calibration procedure, changes in the
oxidant stream mass flow rate result in
25 corresponding changes in the oxidant
stoichiometry. The accuracy of the calibration
procedure may be increased by decreasing the value
of A so that more calibration loops are performed
using smaller incremental reductions in the
30 oxidant stream mass flow rate.
When the oxidant stream mass flow rate is
finally reduced so that hydrogen gas concentration
C is greater than TC, controller 105 proceeds to
step 372 and increases the oxidant stream mass
35 flow rate by increment B. Next, at step 374,
controller 105 resets the look-up table value so
that the desired oxidant stream mass flow rate in
si
17-12-2001 CA 02392555 2002-05-24 CA000142
- 58 -
the look-up table matches the current mass flow
rate for the selected electrical power output.
Finally, controller 105 may choose to stop the
calibration procedure at step 378, or to select a
different electrical power output for oxidant
stream mass flow rate calibration at step 376. If
step 376 is chosen, a different electrical power
output is selected and controller 105 returns to
step 364 where the calibration procedure begins
20 again for the newly selected electrical power
output.
The value of A and B may be the same or B may
be higher than A. When B is higher than A, the
look up table values will be calibrated so that
there will be a surplus of oxidant supplied to the
cathode. The greater the difference between the
values for B and A, the greater will be the
surplus. A surplus supply of oxidant helps to
reduce the likelihood of causing oxidant
starvation conditions that might produce hydrogen
gas in the oxidant stream. When the power output
is expected to be dynamic, a higher oxidant
stoichiometry may be preferred to prevent oxidant
starvation during transitional periods when
electrical power output is changing. The value of
B is preferably selected so that the oxidant
stoichiometry is generally less than two and
preferably between about one and about 1.5.
AMENDED SHEET
CA 02392555 2002-05-24
WO 01/43216 PCT/CA00/01426
- 59 -
in the art without departing from the spirit and
scope of the present disclosure, particularly in
light of the foregoing teachings.