Note: Descriptions are shown in the official language in which they were submitted.
WO 01/40517 CA 02393136 2002-05-30 pCT/[JS00/32492
EVALUATING ANrr PREDICTING CLINICAL OUTCOMES
BY GENE EXPRESSION ANALYSIS
Field of the Invention
The present invention relates to methods for evaluating and predicting
clinical outcomes in patients by measuring levels of gene expression. Methods
are
provided for quantitating gene expression levels, and the measured levels are
compared against reference levels. Deviations from the reference levels can be
correlated with clinical outcomes. For example, the type and extent of a
patient's
response to a therapeutic intervention can be determined, or the prognosis for
a
patient's survival can be estimated. The gene expression levels can be
measured in
essentially any chosen body tissue or fluid. Surprisingly, it has been found
that
measurement of intracellular gene expression levels in blood are indicative of
clinical outcomes.
Background of the Invention
Methods for examining overall gene expression in, for example, disease
states, previously have been described. See, for example, US Patent No.
5,874,219; Zakut et al., Cancer Research, 53:5-8 ( 1993); Mohaupt et al.,
Kidnev International, 46:653-665 ( 1994); Liang and Pardee ( 1992) Science
257,
967-971; Liang et al ( 1993), Nucleic Acids Res. 21, 3269-3275; Bauer et al
( 1993) Nucleic Acids Res. 21, 4272-4280; Stone and Wharton ( 1994), Nucleic
acid Res. 22, 2612-2618 and Wang and Feuerstein (1995) Biotechnigaces 18,
448-452; WO 93/18176 and DE 43 17 414. These methods, however,
generally provide a "snapshot'' of gene expression that is qualitative, rather
than
quantitative. Accordingly, the methods provide an indication only of whether a
gene is being expressed at a detectable level in a particular tissue.
Moreover,
even when applied to samples from patients suffering from a pathological
syndrome, none of these methods provides any correlation with clinical outcome
for the patient. It is apparent, therefore, that new and improved methods for
W~ ~l/40$17 CA 02393136 2002-05-30 pCT/LTS00/32492
-2-
measuring levels of gene expression and correlating those levels with clinical
outcome are greatly to be desired.
Summary of the Invention
There exists a need to determine and predict clinical outcomes in patients It
is therefore an object of the invention to provide methods for evaluating
(e.g.,
determining and/or predicting) clinical outcome for a patient suffering from a
clinical condition or syndrome, comprising the steps of (a) providing a
clinical
specimen obtained or derived from the patient, (b) measuring the levels of
expression of a preselected set of genes in the clinical specimen; and (c)
comparing said levels of expression against a set of reference expression
levels,
where a deviation of the level of expression of one or more of the preselected
set of genes is indicative of clinical outcome for the patient. The phrase
"preselected gene(s)" refers to genes that have been determined to be suitable
in
practice of the invention. Preferably, in accordance with practice of the
invention, such genes are selected where there is a correlation between the
level
of gene expression and the nature and extent of a disease state or other
undesired condition.
In accordance with one aspect of the invention, the clinical specimen is a
sample of blood, tissue, or cerebrospinal fluid. The clinical specimen may be
a
sample of blood, and derived therefrom, such as plasma or serum sample or
fraction.
In accordance with another aspect of the invention, the expression levels
of at least three preselected genes are measured. In one embodiment, the
expression level of at least one proinflammatory cytokine is measured. In
another embodiment, the expression level of at least three preselected
proinflammatory cytokines is measured. In yet another embodiment, the
preselected proinflammatory cytokine genes are selected from the group
consisting of TNF-a,, IL-6, IL-l, IL-8, IP-10 and MIP-la..
In accordance with another aspect of the invention, the clinical condition
or syndrome is an inflammatory disorder. In one embodiment, the
CA 02393136 2002-05-30
WO 01/40517 PCT/US00/32492
-3-
inflammatory disorder is a chronic inflammatory disorder. In another
embodiment, the chronic inflammatory disorder is selected from the group
consisting of chronic hepatitis, hepatitis B and C, chronic obstructive
pulmonary
disease, inflammatory mucosal disease, autoimmune disease, dementia,
cardiovascular disease, and cancer. The inflammatory mucosal disease may be
selected from the group consisting of inflammatory bowel disease, Crohn's
disease,
and colitis. The dementia may be AIDS-related dementia or Alzheimer's disease.
The cancer may be selected from the group consisting of lymphoma, prostate
cancer, and colon cancer. In another embodiment, the clinical condition is
transplant rejection in a patient with an allograft. The allograft may be a
heart,
liver, kidney, or other organ.
In accordance with still another aspect of the invention, the clinical outcome
that is determined is response to a therapeutic intervention. The therapeutic
intervention may be treatment with a drug. The drug may be a stabilized
chlorite
solution. In particular, the stabilized chlorite solution may be WF-10.
In accordance with yet another aspect of the invention, the clinical condition
or syndrome is HIV infection. In one embodiment, the clinical condition or
syndrome is AIDS.
In accordance with a still further aspect of the invention, the indicated
clinical outcome is the probability of patient survival at a predetermined
date.
In one embodiment, the indicated clinical outcome is the probability of
patient
survival after six months.
In accordance with a further aspect of the invention, the levels of gene
expression are measured by a quantitative polymerise chain reaction. The
polymerise chain reaction may be a reverse transcriptase/polymerase chain
reaction. The polymerise chain reaction may be carried out using fluorescent
detection of the amplification products. In one embodiment, the polymerise
chain reaction may be carried out using a LightCycler~ instrument, or using
other appropriate technology.
Other objects, features and advantages of the present invention will become
apparent from the following detailed description. It should be understood,
however, that the detailed description and the specific examples, while
indicating
W~ ~l/4~517 CA 02393136 2002-05-30 pCT/US00/32492
-4-
preferred embodiments of the invention, are given by way of illustration only,
since
various changes and modi fications within the spirit and scope of the
invention will
become apparent to those skilled in the art from this detailed description.
Brief Description of the Figures
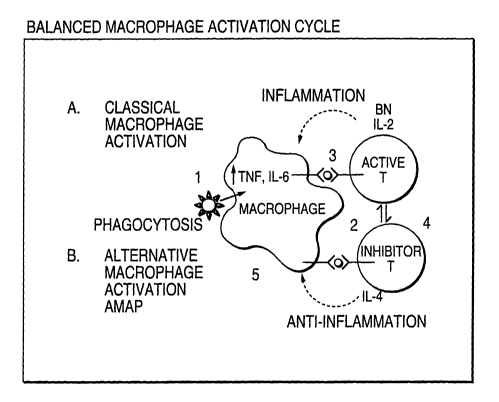
Figure 1 shows a schematic of a macrophage activation cycle wherein
multiple steps occur during various forms of activation and recycling of
macrophage function so as to achieve Balanced Macrophage Activation.
Figure 2 shows the changes in gene expression of proinflammatory
cytokines in a patient (#14) after treatment with WF10. The levels are
reduced,
indicating a good prognosis and good response to treatment.
Figure 3 shows the changes in gene expression of proinfla~nmatory
cytokines in a patient (#15) after treatment with WF10. The levels are low to
begin
with, and are unchanged with treatment, indicating that therapy is unnecessary
and
that the patient has a good prognosis.
Figure 4 summarizes characteristics of the patients studied in Example 2.
Patients were being enrolled in a prospective Phase 11 study evaluating the
potential of WF10 for treatment of HCV disease. Baseline blood specimens
were available from these patients with paired liver biopsies for the study.
All
patient histories and specimens were obtained in accordance with standard
Committee on Human Research approved protocols. The acutely infected
patient was not being evaluated for treatment by WF10 but presented to one of
the study's referring physicians. That patient's specimens were evaluated with
the same human subjects approval criteria. The 8 patients with chronic HCV
infection had baseline demographic and laboratory data obtained. The patients
were not selected by any criteria except that those patients had blood drawn
before enrollment in the WF10 clinical trial and had a liver biopsy performed
within 2 weeks of the blood draw. Laboratory values of HCV gene expression
levels and liver function tests were also obtained within this same 2-week
window of time. Liver biopsies were obtained from the patients evaluated by an
independent pathologist, who scored the inflammation grade base on standard 4-
point grading system. Only at the end of the gene expression evaluation were
WO 01/40517 CA 02393136 2002-05-30 pCT/US00/32492
-5-
all data regarding the liver biopsy, laboratory values, and gene expression
values pooled for ultirr:ate data analysis. Only Patient 4 in this study had
been
treated previously wits interferon and Ribivarin and had not received any
treatment in the 3-month period prior to entry into the study.
Figure 5 shows immune activation gene expression in PBMC from
patients with acute and chronic HCV infection.
Figure 6A shows the actual baseline gene expression values and GES for
the patients whose data are summarized in Figure 5.
Figure 6B shows the actual induced gene expression values and GES for
the patients whose data are summarized in Figure 7.
Figure 7 shows induced gene expression in PBMCs obtained from acute
versus chronic HCV infected patients.
Figure 8 shows the multigene expression score in unstimulated PBMC of
patients with HCV disease.
Figure 9 shows the scoring system used in MGES value calculations.
Figure 10 shows multigene expression score in stimulated PBMC of
patients with HCV disease.
Detailed Description of the Invention
The present invention provides methods of determining clinical outcomes in
patients by measuring levels of expression of a preselected set of genes. The
gene
expression levels are compared to reference standards and deviations from
those
standards are indicative of clinical outcomes. The gene expression levels can
be
measured in essentially any clinical specimen, including tissue or fluid, such
as
cerebrospinal fluid. Surprisingly, however, the inventors have discovered that
gene
expression levels measured in blood samples are indicative of clinical
outcomes.
This is surprising because the blood has typically been considered to be a
quiescent
organ of the body, and that measurement of gene expression levels in the blood
has
been thought to be an exercise of little or no value. In particular,
measurement of
intracellular gene expression levels in blood cells can be used. Of course,
use of
WO 01/40517 CA 02393136 2002-05-30 pCT/US00/32492
-6-
blood makes obtaining and analyzing clinical samples simple, convenient, and
minimally invasive.
Measurement of gene expression levels
The gene expression levels used in the methods of the invention can be
measured by any method now known or that is devised in the future that can
provide quantitative information regarding the levels to be measured. The
methods
preferably are highly sensitive and provide reproducible results. In one
embodiment, methods based upon nucleic acid amplification technologies are
used.
In particular, methods based upon the polymerase chain reaction ("PCR") and
related amplification technologies, such as NASBA and other isothermal
amplification technologies, may be used. More particularly, so called "RT-PCR"
methods using reverse transcription of mRNA followed by amplification of the
resulting cDNA are contemplated.
Methods for carrying out quantitative PCR are known in the art. See, for
example, US patents 5,210,015 and 5,487,972 and EP 512334B1 which are
hereby incorporated by reference in their entirety. Commercial instruments for
carrying out quantitative PCR and RT-PCR are available from PE Applied
Biosystems, 850 Lincoln Centre Drive, Foster City, CA 94404, from Roche
Molecular Systems, Inc., 1145 Atlantic Avenue, Alameda, CA 94501, and from
Roche Molecular Biochemicals, Indianapolis, IN. In a particular embodiment,
the
LightCycler instrument from Roche Molecular Biochemicals is used. This
instrument can be used following the manufacturer's instructions as described
below. Primer sets for amplification of any known gene can be designed using
methods that are well known in the art, for example, using gene sequences from
public databases such as GENBANK and using primer design software such as
OLIGO. Primer sets for many genes also are commercially available, for example
from PE Applied Biosystems, Roche Molecular Biochemicals, Roche Diagnostics,
and Search-LC (Heidelberg, Germany).
WO 01/40517 CA 02393136 2002-05-30 pCT/US00/32492
Samples for measuring gene expression levels
Any conveniently available tissue sample from a patient can be used for
measurement of gene expression levels. In particular embodiments, the sample
can be blood, cerebrospinal fluid, and cellular tissue derived from biopsy or
from exfoliation such as from the cheek wall. In one embodiment, the sample
is peripheral blood mononuclear cells, which are readily and easily available
via
minimally invasive methods. Methods for preparing the sample for gene
expression analysis are well known in the art, and can be carried out using
commercially available kits.
Determining clinical outcomes
The gene expression levels obtained preferably are compared and
normalized against reference genes in the same sample. Typically,
"housekeeping" genes such as actin, are used for this normalization. Other
"housekeeping" genes are well known in the art, such as HPRT, CPB, and
G6PD.
For determining clinical outcomes, the gene expression levels obtained
from the clinical sample (from the "test patient") are compared to levels in
reference samples. The reference samples typically are obtained from healthy
individuals who are disease free, or who are not suffering from the same
pathological condition or syndrome as the test patient. Preferably, expression
levels of the genes of interest are determined from a number of healthy
individuals, and an average or mean is obtained. In a particular embodiment,
the reference levels may be determined from individuals of the same sex and
age as the test patient. In another embodiment, the reference levels may be
obtained from tabulated data, where those data are compiled from healthy
patients of appropriate sex and age.
The relative levels of gene expression that can be predictive (a type of
indication) of clinical outcome can be higher or lower levels of expression.
For
example, it is shown below that increased levels of expression of
proinflammatory cytokines, such as TNF-a., IL-6, IL-1, IL-8, IP-10 and MIP-
W~ ~l/4~517 CA 02393136 2002-05-30 pCT/LTS00/32492
_g_
la. are reflective of a po.:or clinical o;atcome (for example, reduced
expectation
for long-term survival) for patients infected with HIV. When the patient is
treated with an anti-HIV comF>ound, the relative levels of the proinflammatory
cytokines can be measured again. If the levels of the cytokines is reduced,
this
indicates that the patient is responding well to the treatment. In this case,
the
clinical outcome may be that the patient can cease anti-H1V therapy, or reduce
the dose of the anti-H1V compound. A lack of response can indicate that the
patient will not respond to therapy, and therefore has a poor prognosis, or
that
the dose of anti-HIV compound must be increased, or additional therapeutic
interventions must be used. A lack of response also may indicate that the
progression of the disease has not been halted or slowed by therapy.
Although the present invention specifically contemplates that the levels
of proinflammatory cytokine expression can be measured and used to predict
clinical outcome, the skilled artisan will recognize that the invention is not
so
limited. Thus, methods for identifying changes in gene expression are well
known in the art, as described supra. Even though these methods are not
sufficiently quantitative for use in the present invention, they can be used
to
predict those genes whose expression is changed in a disease state.
Quantitative
measurements, such as quantitative RT-PCR can then be used to measure the
changes in gene expression. Those changes can be tracked in patients and
correlated with clinical outcomes by methods that are well known in the art.
Thus, for any given disease, a predictive method for determining clinical
outcome can be developed. The discussion below describes the gene expression
levels in macrophage activation, and describes how those levels, and their
change upon treatment with a particular drug (WF10) provide information
regarding clinical outcomes in patients suffering from chronic inflammatory
disease, such as chronic hepatitis, hepatitis B and C, chronic obstructive
pulmonary
disease, inflammatory mucosal disease, autoimmune disease, dementia,
cardiovascular disease, and cancer. The inflammatory mucosal disease may be
selected from, for example, inflammatory bowel disease, Crohn's disease, and
colitis. The dementia may be, for example, AIDS-related dementia or
Alzheimer's
disease. The cancer may be" for example, lymphoma, prostate cancer, or colon
WO 01/40517 CA 02393136 2002-05-30 pCT~S00/32492
-9-
cancer. Example 2 below also demonstrates that the methods of the invention
can
be used to predict clini gal outcome in patients suffering from hepatitis C.
The
methods of the invention mas also be used to detect or predict clinical
outcome of
transplant rejection in patients receiving allografts, such as heart, liver,
kidney, or
other organs. Thus, measurement of altered, particularly increased,
inflammatory
cytokine gene expression is indicative of rejection of the allograft.
Particular gene
expression levels that can be measured to detect allograft rejection include
IP10,
TNFa., 8-IFN, and other macrophage inflammation genes.
Activation of macrophages
WF10 is a stabilized chlorite matrix approved for clinical use in a
systemic form (WF10) and in a more dilute topical form (Oxoferrin) See
Kuhne, Die envunschte Sauerstoffaktivierung, dokumentiert ant Beispiel der
Wundheilung: der Weg zur Oxoferin-Therapie. In: Elsmer E.F., Bors W.,
Wilmanns W. (eds.): Reaktive Sauerstoffspezies in der Medizin. Springer
Verlag, Berlin 1986, pp. 5-15. WF10 has been approved in Thailand for
systemic administration to patients with post-radiation syndrome and for
supportive care in patients being treated for cancer. These indications have
been studied extensively and reviewed. See Raffanti et al., Infection 26:201-
206 ( 1998). Oxoferrin is used topically to enhance healing of chronic wounds
such as diabetic ulcers. Hinz et al., Lancet 1: 825-828 (1986). The major
target cells in the body for WF10 reactivity are the macrophage and dendritic-
cell populations. They will be referred to simply as macrophages as both cell
populations are derived from common precursor cells. The in vitro and clinical
effects of WF10 are best understood in the context of the newly proposed
balanced-macrophage activation theory. Figure 1 shows a schematic of a
macrophage activation cycle wherein multiple steps occur during various forms
of activation and recycling of macrophage function so as to achieve Balanced
Macrophage Activation. Each step in the macrophage activation cycle is
numbered (1-5) and is described sequentially.
WO ~l/4~$17 CA 02393136 2002-05-30 pCT/US00/32492
-10-
1. The first thing that occurs in a macrophage activation program is
phagocytosis of foreign material. Macrophages engulf pathogenic organisms
such as bacteria, fungi and viruses. This is one of the oldest and most
important functions of macrophages and is how the macrophage derived its
name. "Macro" meaning big, and "phage" meaning eater, thereby conferring
on the macrophage the term "Big Eater." Upon successful phagocytosis of a
foreign substance, the macrophage processes this material through a
proteolytic
pathway, cutting individual proteins into small peptides that then are
involved in
the second step of macrophage activation.
2. Antigen presentation: After foreign materials have been cut
into peptides, macrophages present antigen to T lymphocytes utilizing the
major
histocompatibility antigens class 1 (HLA) and class 2 (DR) and initiate
expansion of a normal immune response. T cell activation predominantly
occurs through this antigen-presenting-cell function. Standard cytotoxic T
cells
specific for virus infected cells, cancers or fungi are developed that
ultimately
lead to successful immunologic clearance of those foreign processes. This is
represented in Figure 1 as an active immune response. Upon successful
activation of an active immune response, T cells express various activation
antigens such as CD38 and secrete factors such as interleukin-2 (IL-2). IL2
allows T cells to proliferate and gamma-interferon (y-IFN) to cause further
macrophage activation and step 3.
3. Classical macrophage activation: A product of T cell
activation, gamma-interferon induces full inflammatory changes and classical
macrophage activation. This activation causes upregulation of inflammatory
cytokines such as ILI, IL6, and tumor necrosis factor (TNF). The macrophage
in this state is extremely inflammatory and causes secondary effects such as
fevers, and when chronically stimulated, weight loss and further non-specific
activation of immunologic responses.
4. TH1 to TH2 (Active to Inhibitor T) shift: During the initiation
of a cellular response which ultimately leads to production of cytotoxic T
cells
and T cells producing IL2 (TH1 cell), a second major class of T cell, the TH2
WO 01/40517 CA 02393136 2002-05-30 pCT~S00/32492
-11-
cell, is induced which is involved in both B cell activation as well as
providing
signals for the balanced macrophage activation. Cytokines produced by the
TH2 cells include IL4, ILS, IL6, and IL10. These factors cause B cell
activation, B cell proliferation, hypergammaglobulinemia, up-regulation of IgE
and allergic reactions and eosinophilia. A net result of excess IL10
production
is shutting off of step 2 in the response shown in Figure 1. The TH1 and TH2
cell activation process occur virtually simultaneously in vitro (and likely in
vivo), however classical immunologic responsiveness as measured by T cell
proliferation in vitro predominantly measures the THl-like response. The TH2
response has as a key feature, the production of IL4, which is known to
activate
the alternative macrophage activation pathway (AMAP). (Step 5)
5. AMAP: The Alternative Macrophage Activation Pathway
(reviewed in ref. 4) has the following features:
a. the production of angiogenic factors
b. inhibition of T cell responses
c. associated down-regulation of inflammatory-mediator production
characteristic of classically-activated macrophages described in step 3.
The Alternative Macrophage Activation Pathway recently has been
confirmed as a distinct pathway with the cloning and molecular studies of
AMAC-1 (Alternative Macrophage Activation Chemokine-1) (Kodelja et al,
Journal of Immunology 160:1411-1418 (1998)), also known as macrophage
inflammatory protein 4 (MIP-4). Only in macrophages induced to undergo
Alternative Macrophage Activation Pathway has the gene AMAC-1/MIP-4 been
detected. A secondary byproduct of Alternative Macrophage Activation
Pathway is the appearance of phagocytosis in macrophages that have been
induced to undergo Alternative Macrophage Activation Pathway induction.
This byproduct potentially signals the complete recycling of the Balanced
Macrophage Activation pathway.
This scheme, wherein macrophage involvement in immunologic
responses goes from steps 1 through 5, is proposed as a cycle in the balanced
macrophage activation theory. Because of its cyclic nature, normal
W~ 01/40$17 CA 02393136 2002-05-30 pCT/US00/32492
-12-
immunologic processes de not overemphasize any particular step in the pathway
but remain generally in balance.
Diseases involving Balanced Macrophage Activation disruption
Balanced Macrophage Activation is disrupted by a variety of pathologic
processes and Balanced Macrophage Activation imbalance is responsible for
many manifestations of chronic disease. Examples of these imbalances are as
follows:
Chronic viral infections: Steps 2 and 3 in Figure 1 are continually
stimulated when a foreign virus cannot be cleared by a successful immune
response that would re-establish Balanced Macrophage Activation. This
immunologic overstimulation would predictably lead to pathologic sequelae such
as cirrhosis and hepatoma in chronic hepatitis B & C infections and profound
immune dysregulation in H1V disease. After long periods of time wherein steps
2 and 3 are overemphasized, there would be a predicted shortage of cells to
accomplish steps 5 and 1. There also would be an initial overdrive of the TH I
cell population with the appearance of highly activated T cells. An
overactivation of step 3 would clinically appear as chronic fever with
associated
weight loss. Patients with chronic viral infections such as those with HIV
also
have been observed to have a dramatic TH 1 to TH2 shift as described in step 4
for Figure 1. The Balanced Macrophage Activation theory predicts that this
shift is compensatory in nature with the T cells attempting to regulate
Balanced
Macrophage Activation through production of IL4, the cytokine that normally
induces step 5. The conditions suffered by patients with chronic viral
diseases
would then be byproducts of a chronic inflammatory state. These would include
overproduction of inflammatory mediators and inflammatory cytokines that
cause secondary immunopathogenic changes. Such changes are observed in
H1V disease where excessive inflammatory states drive development of
dementia, kidney disease, lymphoma, and wasting syndromes that are secondary
to hyperactivity of the macrophage inflammation compartment. A secondary
byproduct of chronic viral disease would be the exhaustion of cells in steps 5
and 1 as noted above. This result would decrease the rate of wound healing and
CA 02393136 2002-05-30
WO 01/40517 PCT/US00/32492
-13-
decrease associated al:giogenesis and phagocytosis. Fewer cells capable of
phagocytosing materia: would allow new infectious organisms such as bacteria
and fungus to be poorl:r cleared by individuals with chronic viral diseases.
Autoimmune disease: Autoimmune diseases are similar to chronic viral
diseases in that there is an overstimulation of immunoreactive lymphocytes
with
associated inflammation. Autoimmune disease has for many years been thought
of as a chronic viral-like disease, however no virus has to date been isolated
as
an initiator of these types of diseases. These diseases include systemic lupus
(SLE), post-radiation syndrome, and a variety of autoimmune kidney diseases,
etc. Features of some autoimmune diseases are the presence of
hypergammaglobulinemia, elevated IgE and eosinophilia as described above in
Figure 1 step 4. This result may occur as the by-products of a compensatory
TH1 to TH2 shift when the body attempts to reestablish Balanced Macrophage
Activation .
Aller is reactions: The most serious allergic reaction is asthma wherein
overstimulation of step 2 with environmental antigens in the lung leads to
inappropriate local macrophage inflammatory changes and T cell activation in
lung tissues. These lung tissues are harmed by inflammatory mediators
produced in step 3. Normally lung macrophages constitutively have the
Alternative Macrophage Activation Pathway induced) (as shown in step 5) and
they therefore are less susceptible to steps 2 and 3 as shown in Figure 1.
However, in patients with allergies these reactions (steps 2 & 3) are allowed
to
occur. Asthmatic patients also have a TH 1 to TH2 shift with associated
eosinophilia. This reaction is predicted by the Balanced Macrophage Activation
theory to be compensatory when it attempts to shift lung macrophages from
steps 2 & 3 through 4 into step 5.
Immune deficiency associated bacterial and fun al infections: If steps 2
and 3 from Figure 1 are increased, over time there will be fewer cells in
steps 5
and 1 capable of phagocytosis and reinitiation of immune responses. The
decreased number of cells capable of phagocytosing bacteria and fungus makes
patient survival in the presence of immunodeficiency quite problematic.
Antibiotic therapy directed against bacteria and fungus works inefficiently in
W~ 01/40517 CA 02393136 2002-05-30 pCT~S00/32492
-14-
vivo unless the invading organisms have been phagocytosed by macrophages or
granulocytes. The most commonly used antifungal drug, amphotericin B, does
not work at all unless fungus has been engulfed by a phagocytic cell. Patients
with advanced HIV disease are susceptible to invasive fungal infections mostly
because of inefficient phagocytosis. A parallel disease process is induced in
patients with organ transplants who receive cyclosporin A and Prednisone for
treatment of graft rejection. These patients are immunosuppressed and if they
develop invasive bacterial or fungal infections will have their macrophages
shifted toward steps 2 and 3 and similarly cannot recycle and achieve Balanced
Macrophage Activation, which would allow phagocytosis and reinitiation of
immunologic responsiveness.
Chronic wounds: The best example of this class of disease is observed
in patients with diabetes or those who are bedridden. Chronic diabetic and
pressure ulcers develop and macrophages within those wounds exhibit changes
consistent with step 3 in Figure 1. Goerdt et al., Immunity 10:137-142 (1999).
Wounds will not heal if step 3 cannot be shifted through step 5 wherein
angiogenic factors are produced to allow blood vessel growth and healing.
Similarly if macrophages within a chronic wound have been shifted from step 1
to 3, phagocytic cells will not be present to allow clearance of dead and
dying
material within wounds so as to speed the healing process.
Cancer: A variety of cancers are outgrowths of chronic inflammation.
Examples include lymphoma, which represents outgrowths of antigen-
overdriven lymphocytes, and prostate cancer, which evolves from chronic
prostatitis. In both cases steps 2 & 3 provide chronic growth stimuli.
In vitro studies of WF10 activity on immune function:
WF10 completely blocked antigen activation of T cell responsiveness at
levels easily achievable in vivo. McGrath et al., Transplantation Proceedings,
30: 4200-4204.(1998). This inhibition of T cell activation only occurred when
T cells and macrophages were placed together with the foreign antigen, and
occurred instantly or even when added at day 6 of a 7-day T cell activation
WO 01/40517 CA 02393136 2002-05-30 pCT~S00/32492
-15-
assay. These data suggest that WF10 is extremely potent at inhibiting
processes
fundamental to normal T cell activation as shown in step 2 for Figure 1.
WF10 caused downregulation of inflammatory cytokine production by
inflammatory macrophages as described in step 3 for Figure 1. McGrath et al.
Abstract #2046, Keystone Symposia on Molecular and Cellular Biology, Park
City, UT, March 13-19, 1998. Studies are currently underway to test whether
WF10 causes upregulation of AMAC-l, thereby converting step 3 to 5 and
completion of the BMA cycle in vitro.
The use of WF10 to achieve BMA in vivo:
WF10 and Oxoferrin have been used extensively for many years to treat
chronic disease in humans. Oxoferrin was approved for topical use in chronic
wounds in the late 1980's. To date Oxoferrin has been successful in inducing
rapid healing of chronic wounds including diabetic and pressure ulcers.
Oxoferrin is thought to work through achieving Balanced Macrophage
Activation with associated upregulation of angiogenic factors and macrophage
phagocytosis. WF10 was approved in Thailand for systemic use in 1997 for
treatment of post-radiation syndrome (PRS). Post-radiation syndrome occurs as
a late complication in organs that have received X-ray therapy. Up to 15 % of
patients who have had lower abdominal irradiation for cervical or prostate
cancer develop PRS associated bleeding from the bladder and rectum 6 months
to 10 years after that radiation. Histologic analysis shows that the bleeding
is
caused by a local autoimmune process within the small arteries (endarteritis).
This leads to death of tissues within the radiation field and causes bleeding,
for
example, into the bladder or rectum. Patients sometimes respond temporarily
to steroids. However, in studies performed in Thailand there was nearly a
100% complete response rate to systemic administration of WF10 in women
with hemorrhagic cystitis secondary to post-radiation syndrome. Unlike steroid
treatment, which is associated with some symptomatic relief, WF10
administration to date has been curative for patients with post-radiation
syndrome.
WD 01/40$17 CA 02393136 2002-05-30 pCT/LTS00/32492
-16-
Advanced clinical studies of WF10 currently are underway in the United
States for treatment of p~ tients with HIV disease. Patients who received two
cycles of WF10 showed chronic immunologic changes consistent with induction
of Balanced Macrophage Activation. Herndier et al, Abstract #22417,
12°'
World AIDS Conference, Geneva, June 28-July 3, 1998. Patients with H1V
disease, a chronic viral infection, typically show inappropriate elevated T
cell
activation and decreased rates of macrophage phagocytosis in end-stage
disease.
In Phase II studies conducted at San Francisco General Hospital, WF10
administration was associated with dramatic down-regulation of all
inappropriately elevated immunologic activation markers with up-regulation of
macrophage phagocytosis in patients who had low baseline levels of
phagocytosis at the initiation of study. These results were consistent with
induction of Balanced Macrophage Activation and will lead to further in vitro
studies to test components of the Balanced Macrophage Activation theory.
In conclusion, it appears that diseases affecting Balanced Macrophage
Activation are common and that many of the side effects of chronic disease
occur because of toxic side effects mediated by macrophages accumulating in
any one of the steps described above. Currently, WF10 is the only new drug in
clinical development that may affect Balanced Macrophage Activation and might
be expected to change the clinical outcome of the diseases in sections A
through
F described above.
The use of an aqueous solution containing a stabilized chlorite solution for
treating wounds and infections is known in the art. United States Patent Nos.
4,507,285 and 4,725,437, the disclosures of which are incorporated by
reference
herein in their entirety, and EP 0 200 157, the disclosure of which also is
incorporated by reference herein iri its entirety, describe the use of a
stabilized
chlorite solution in stimulating the wound healing response in humans, as well
as in
treating infections caused by parasites, fungi, bacteria, viruses and/or
mycoplasma.
Kuhne et al., European Patent No. 200,156, the disclosure of which is
incorporated
by reference herein in its entirety, describes the use of a stabilized
chlorite solution
in conjunction with radiation therapy to aid in repairing damaged irradiated
tissue
and reducing side effects.
WO 01/40517 CA 02393136 2002-05-30 pCT/US00/32492
-17-
A preferred ewbodiment of the treatment of this invention entails
administration to a mammal in need thereof, an aqueous solution of a product
that
has been termed "tetracl~loro~.lecaoxygen anion complex," commonly abbreviated
as
"TCDO." This substance can be prepared using the procedures described in
Example 1 of U.S. Patent No. 4,507,285 ("the '285 patent"), and is a water
clear
liquid, miscible with alcohols, and has a melting point of -3°C. The
Raman
spectrum shows bands of 403, 802 (chlorite) and 1562 cm-' (activated oxygen).
The
skilled artisan will recognize that any chemically stabilized chlorite
solution can be
used in the methods of the present invention, and that the scope of the
invention is
not limited to use of the product described in the '285 patent.
The present invention, thus generally described, will be understood more
readily by reference to the following examples, which are provided by way of
illustration and are not intended to be limiting of the present invention. In
the
examples, "WFIO" denotes an aqueous stabilized chlorite solution.
Example 1
METHODS
Sample preparation
Mononuclear cells (MNC) were isolated on a HistopaqueTM 1077
density gradient using Leuco Sep tubes 0227290, Greiner Labortechnik,
Frikenhausen, Germany) and 2x10⁶ cells were resuspended in RPMI 1640 with
10% FCS. Cultures were stimulated either with a mitogenic anti-CD2 mixture
(A1CD2M1, AICD2M2 final concentration I pg/ml each and 11F1 300ng/ml),
anti-CD3 (OKT-3, 100 ng/ml) or 10 ng/ml PMA and 0.5 p,g/ml ionomycin.
Unstimulated and stimulated cultures were incubated in the presence or absence
of WF10 at a final concentration of 1:300 for 3 hrs at 37°C in 7% C02.
Cells
were harvested, resuspended in 200 p1 PBS and 400 p1 of High-Pure lysis
solution was added. Resulting lysates were stored at -70°C. After
thawing at
37°C for 10 minutes, RNA was extracted using a total RNA isolation kit
and
RNA was eluted from the spin column in a volume of 50 ~l. An aliquot of 8.2
~l RNA was reverse transcribed using AMV-RT and oligo-(dT) as primer
WO 01/40517 CA 02393136 2002-05-30 pCT~S00/32492
-18-
(cDNA synthesis kit). As a control, a reaction was performed without reverse
transcriptase (no-RT control). After termination of cDNA synthesis the
reaction mix was diluted to a final volume of 500 p1 and stored at -
20°C until
PCR analysis.
LightCycler~ PCR
Target sequences were amplified using LightCycler~ Primer Sets
(Search-LC, Heidelberg, Germany) with the LightCycler FastStart DNA Sybr
Green 1 Kit (Roche Diagnostics, Indianapolis, IN) according to the
manufacturer's protocol. Input was normalized by the average expression of
the four housekeeping genes p-actin, HPRT, G6PDH and Cyclophilin B.
Overview of Study Design
Eighteen H1V-infected adults with CD4+ counts greater than 50
cells/mm~ treated with approved anti-H1V medications are enrolled in an open
label, single center study. Participants are involved in the primary phase of
the
study for approximately 12 weeks. Patients are stratified into two cohorts of
nine patients: nine patients have CD4+ counts > 300 cells/mm~ and nine
patients have CD4+ counts >5O and <300 cells/mm~. Only patients with a
viral load of < 20,000 copies/mL are enrolled in the study. Enrollment is
limited to nine patients with plasma NIV RNA below the limit of assay
delectability.
After screening evaluations are completed, eligible patients attend study
visits on Days l, 2, and 4. From Days 8 through 12, patients receive one cycle
of WF10 0.5 mL per kg/bw diluted into 250 - 500 mL normal saline
administered by intravenous infusion. Patients then attend study visits on
Days
15, 17, 19, 22, 24, and 26.
From Days 29 through 33, patients receive a second cycle of WF10 0.5
mL per kg/bw diluted into 250 - 500 mL normal saline administered by
intravenous infusion. Patients then attend study visits on Days 36, 38, 40,
and
WD 01/40$17 CA 02393136 2002-05-30 pCT/US00/32492
-19-
47 (final visit). Patients have a 48-hour window in which to return for the
final
visit on Day 47.
Immune function, measured on days 1, 8, 11, 15, 22, 29, 31, 40 and
47, is defined as the measurement of phagocytic index using fluorescein-
labeled
E. coli, T cell activation with phytohemagglutinin, lymphocyte immune
phenotyping (detecting CD3, CD4, CDB, CD14, CD20, CD28, CD38, CD56,
CD69), DR, TNF and monocyte quantitation.
The health status of all patients is followed up by monthly telephone
calls for one year after Day 47.
RESULTS
Clinical Trial
Of the patients who completed the 47 day study, seven had initial CD4
counts < 300/~l, and those patients showed the most dramatic immunologic
parameter response to two 5 day cycles of i.v. WF10. CD4 and CD8 counts
increased significantly and the CD8 cell increase was completely reflected by
an
increase in the CD8/38 negative subset. There was an overall dramatic in
median CD38 expression with no associated change in HIV viral load during the
course of this trial. Other measures of immunologic activation were similarly
decreased with an observed significant drop in CD14/DR, CD20/DR and
CD4/38 mean levels of cell associated fluorescence.
Gene Expression Analysis of WF10 Trial PBMC
PBMC associated inflammatory gene expression was evaluated on frozen
and subsequently extracted cell preparations using Lightcycler based
technology. Figure 2 shows relative levels of a series of proinflammatory
genes(to internal housekeeping genes, actin, G6PD, CPB, HPRT) in a
patient(#14) who had a 50% decrease in the CD8/38+ cell subset compared to
a patient(#15) who had no change of CD8/38 during the 47 days of the trial.
The gene expression levels in patient 15 are shown in Figure 3. There was an
overall highly significant correlation between decrease in CD8/38 level and
the
W~ ~l/4~517 CA 02393136 2002-05-30 pCT/US00/32492
-20-
change in expression of macrophage proinflammatory genes such as those
shown in figure 2.
In Vitro Effects of WFIO on PBMC and CDI4 Cell Gene Expression
WF10 was tested in vitro on PBMC's exposed to anti-CD2, anti-CD3
and PMA/ionomycin to determine effects of the drug on T cell activation.
WF10 was used at a final concentration of 1:300, a dose easily achieved during
the clinical trial and PBMC's were harvested three hours and affinity purified
CD14 cells 18 hours later for RNA extraction and RT-PCR. WF10 effects on
11 normal blood donor PBMC's were expressed as LC-Index which represents
up to a 5 fold change from baseline un(WF10) treated but stimulated specimens.
A consistent down regulation of induced lymphostimulatory cytokines IL-2 and
IL-17 was observed, with a consistent pattern of IL-1(3, 1L-8, MIP-la and
thioredoxin (TRX) upregulation. Because the upregulations appeared to be
macrophage inflammatory mediators, purified CD14 cells were exposed to
1:300 WF10 for 18 hours and evaluated for increased gene expression. Three
of the seven CD14 preparations had an approximate decrease in the 4
housekeeping gene levels of 90%. Three CD14 specimens also had dramatic
upregulation of the 4 apoptosis genes evaluated and parallel PI uptake studies
confirmed CD14 cell apoptosis occurring in those cultures. The gene
expression levels of PBMC's used for the macrophage studies before they were
treated with WF10 also were determined. It was observed that those specimens
that became apoptotic had significantly higher levels of pretreatment
inflammatory gene expression than those that did not undergo apoptosis.
WFIO Treatment In Vitro Leads to AwlAC-I Upregulation
Apoptotic cells are the most potent stimulus for macrophages to under
alternative (anti-inflammatory) activation and phagocytosis. Alternative
activation has been associated with induction by the Th2 cytokine IL-4 and
causes a complete block in inflammatory gene expression and antigen induced T
cell activaton. Purified macrophages were exposed to a 1:200 dilution of WF10
and AMAC-1 (specific for the alternative pathway, AMAP) gene expressioin
WO 01/40517 CA 02393136 2002-05-30 pCT/US00/32492
-21-
was assessed up to 21 da ys later. VVF10 dramatically augmented the AMAC-1
expression induced by m..icrophage treatment with IL-4.
These data suggvat that WF10 administration changes expression of
macrophage proinflammatory gene expression in a pattern that parallels changes
in CD8/38 levels in vivo. In vitro, WF10 caused dramatic changes in a wide
variety of immunologically active genes leading to apoptosis in CD14 cells in
a
subset of preactivated patient specimens and consistent down regulation of
lymphostimulatory genes in PBMCs. It is apparent that WF10 regulates
inappropriate inflammation associated with chronic inflammatory diseases such
as H1V disease through overactivation induced CD14 cell death with
compensatory induction of the alternative(anti-inflammatory) pathway of
macrophage activation.
In conclusion, the studies described above demonstrate that
1) WF10 administration to H1V+ patients ( <300 CD4 cells/~l) was
associated with significant:
a) Increase in CD4, CDB, CD8/38- cell numbers
b) Decrease in CD20/DR, CD14/DR, CD4/38 mean
fluorescence/cell
c) Decreased PHA activation
2) Lightcycler system RT-PCR of PBMC's showed drug-associated
down regulation of macrophage inflammatory gene expression (TNF-a., etc.).
3) In vitro studies of WF10 effects on normal PBMC (3h) and CD14
( 18h) cells showed:
a) Activated PBMC's: Down regulation of
lymphostimulatory cytokines IL-2 and IL-17. Upregulation of
macrophage inflammatory genes as well as the anti-apoptotic
(antioxidant) gene thioredoxin (TRX)
b) Cultured CD14 cells: Upregulation of apoptotic genes
(BAX, BCL-Xl, CD95, CD95L) in specimens containing
elevated pre-treatment levels of inflammatory genes with
associated apoptotic cell (CD14) death.
W~ 01/40517 CA 02393136 2002-05-30 pCT/US00/32492
-22-
4) WF10 caused late upregulation of the alternative macrophage
activation gene AMAC-1 in isolated CD14 cells.
5) Without being bound by any theory, the inventors believe that
WF10 induction of macrophage cell death in specimens containing elevated
inflammatory gene expression leads to compensatory AMAP induction in
macrophages in response to the acute apoptosis of inflammatory macrophages.
Accordingly, WF10 causes downregulation of inflammation through acute
upregulation of inflammatory gene expression, cell death through apoptosis,
downregulation of lymphostimulatory genes and compensatory macrophage
differentiation change to the AMAP, anti-inflammatory pathway.
These observations show that WF10 caused reversal of pathologic
inflammation (associated with HIV disease progression) in vivo which over time
would be expected to show a long teen clinical benefit. The change in
immunologic state was documented through use of the quantitative gene
expression technique. This test would be utilized in the long term care of
treated
patients to rapidly identify the return of a pathologic state requiring
further
WF10 therapy.
Example 2
Summary
Peripheral blood mononuclear cells were obtained from the 9 patients
described in Figure 4, as well as from 20 normal blood donors. Gene
expression was assessed for baseline as well as PMA/ionomycin stimulated cells
as described above. Quantitative evaluation was based on use of 2 housekeeping
genes ((3-Actin, CPB) to serve as controls for overall cellular gene
expression.
"Test" gene expression was subsequently normalized to a standard
"housekeeping gene" control level. Thirteen genes associated with macrophage
and T cell activation were selected for evaluation in this study because of
their
function in primary immunologic responses and chronic inflammation. The
genes were IL-l, IL-2, IL-4, IL-8, IL-10, IP10, MCSF, TNFa., y-IFN, MIP-
la,, MIP-2a,, MRP-14, and TGF-(3. Normal values for housekeeping genes as
WO 01/40517 CA 02393136 2002-05-30 pCT~S00/32492
-23-
well as inflammatory genes were established by evaluating gene expression
patterns from 20 normal blood donors (see Figure 5).
Baseline gene expression was assessed in the patient with acute HCV
infection. The quantitative analysis is shown in Figure 5 as a gene expression
score (GES) wherein the quantitative value obtained for each gene was given a
score based on its ratio to the mean normal expressed gene level determined in
the 20 normal blood donors. The highest level of gene expression observed in
the acutely infected patient was the IP-10 gene, known to be induced
specifically by y-interferon. Associated with this elevation of 1P-10 was the
expected elevation of y-interferon as well as elevation of the majority of
macrophage inflammatory genes assessed (for example, GM-CSF and TNF-a).
Genes expressed at baseline/normal values included IL-2, IL-4, IL-8, and IL-
10. Notably, this gene expression pattern was observed in unstimulated cells
isolated from patient blood and not liver or lymph node.
The average gene expression values from blood of the 8 chronically
infected patients showed a pattern of gene expression similar to the acute
infection specimen consistent with an ongoing immunologic response. The
actual GES values varied widely from patient to patient with chronic HCV
infection, however. The average values for each gene are shown in Figure 5.
The actual gene expression values and GES are shown in Figure 6A (baseline)
and Figure 6B (PMA induced). This ongoing response detected in the blood, if
present within the liver, could lead to progressive inflammatory damage
consistent with that observed in progressive HCV liver disease.
Earlier studies using liver biopsy analysis predicted that T cell
hyperactivation would be observed in patients with HCV disease. See Burgio et
al., Hepatology 27:1600-6 (1998); McGuinness et al. Gut 46:260-9 (2000). To
test this prediction, peripheral blood monouclear cells from acute and chronic
HCV disease patients was stimulated with PMA and ionomycin. The gene
expression pattern observed in the patient with acute HCV infection (shown in
Figure 7) was unexpected. Thus the IL-2 and IL-10 gene expression induced in
the acutely infected patient was dramatically lower than control values
(outside
W~ ~l/4~517 CA 02393136 2002-05-30 pCT~S00/32492
-24-
of normal range of GES) s zggesting a substantial inhibition of T cell
activation
associated with acute HCV infection. This inhibition of T cell activation and
inhibited y-interferon production was coupled with persistent elevation in
macrophage inflammatory cytokine as well as chemokine genes, such as IP-10,
that normally are induced by y-interferon. This observation suggests that the
IP-10 values observed in Figure 5 along with an elevation of y-interferon gene
expression may not have been the product of T cells as the inducibility of
this
gene is dramatically inhibited. The only other source of interferon gene
expression in blood cells other than T cells would theoretically be the
natural
killer cell population that also is known to be active in initiating immune
responses in virally infected patients. Like the inhibition of T cell
activation
observed in acute HCV infection, the average GES of the 8 patients with
chronic HCV infection showed a pattern of inhibited T cell activation and
chronic macrophage activation.
The data shown in Figures 6B and 7 contrast with prior reported
experiments in patients with HCV liver disease that showed elevation of IL-2
levels and hyperactivity of T cells at the protein level. See Martin et al.,
Cytokine 11:267-73 ( 1999). To determine whether the observed gene
expression patterns would correlate with degree of liver inflammation
pathology, the corresponding liver biopsies were read and given inflammatory
grade scores using standard assessment criteria. Figure 8 shows the
correlation
between liver inflammation score and a scoring system based on utilizing GES
values from inflammatory genes as determined in the current study. (Figure 9)
A high degree of correlation was found between the MGES (multiple gene
expression score) and the degree of liver inflammation.
The degree of histologic liver inflammation was shown to be associated
with the induced gene expression analysis. (Figure 10) In early stage I
disease,
the strongest inhibition of induced gene expression was observed. During
progression of liver inflammation that degree of inhibition gradually
reverses,
and by stage III inflammation the degree of gene activation was elevated,
WO 01/40517 CA 02393136 2002-05-30 pCT/US00/32492
-25-
consistent with prior reports. Induction of IL-10 expression was persistently
low even in late stage patients (Figure 6B).
To test the relationship between the MGES evaluations and the current
standard of care measurements (i.e., the ALT blood measurement and HCV
quantitative viral load measurement), the ALT values and HCV viral loads for
each of the patients shown in Figure 4 were correlated with degree of liver
inflammation similar to the studies shown in Figures 8 and 10. Neither the
ALT measurement (r':24) nor the viral load quantitation (r':.15) showed
correlations with liver biopsy inflammation score, in marked contrast to MGES
(r'':0.94 and 0.78 for Figures 8 and 10 respectively).
These data demonstrate a new testing system for evaluation of patients
with HCV disease. The high degree of correlation of blood based gene
expression patterns with liver inflammation allows staging of patients with
HCV
infection. In particular, the use of rapid RT-PCR methods provides a clinical
parameter for assessing the degree of liver inflammation in situ that is
faster,
less dangerous and less expensive than prior methods.
Materials and methods
Immune activation gene expression in PBMC from patients with
acute and chronic HCV infection.
Blood specimens were obtained from 1 patient with acute infection and
the 8 patients described in Figure 4. After Ficoll Hypaque separation the
PBMCs were placed at 37° in RPMI 1640 with 10% fetal calf serum for
3 hours
prior to washing and RNA extraction. The same procedure was performed on
blood obtained from 20 normal blood bank donors seen in the Heidelberg,
Germany, University Blood Bank. cDNA was synthesized and LightCycler
based PCR performed as described above. In each specimen, 4 internal
housekeeping genes were included in the RT-PCR analysis; these included the
(3-actin, HPRT, CPB, and G6PD genes. These 4 genes were utilized to
standardize the amount of RNA contained in each specimen and all gene
expression scores (GES) were determined utilizing RNA copy numbers based on
the internal standardized housekeeping gene copy number normalized data.
CA 02393136 2002-05-30
WO 01/40517 PCT/US00/32492
-26-
Based on the standardized copy number of housekeeping genes, a calculated
copy number was derived for each of the genes shown in Figure 6.
Thirteen genes were evaluated utilizing PCR primers (Search-LC,
Heidelberg, Germany). The mean gene expression value obtained for 20
normal blood donors was established as a gene expression score of 1 for each
of
the 13 genes evaluated. Data shown in Figure 5 represent the deduced copy
number of the acute (A) and mean of the 8 chronic (C) HCV infected patient
blood specimens. Below each value shown graphically in Figure 5 is the GES
range of the 20 normal blood donors from the absolute lowest to the highest of
the 20 values. The data plotted in Figure 5 represent a single determination
of
gene expression from all patients, with 1 representing an acute infection (A)
and
8 patients combined representing the mean value from chronically infected
patients. The gene expression values obtained from the chronically infected
patients were widely variable and values are shown in Figure 6.
Induced gene expression in PBMCs obtained from acute versus
chronic HCV infected patients.
Blood was obtained as described above from patients with acute and
chronic HCV infection as well as 20 normal blood donors. PBMCs were
isolated, and placed into culture at 37° with PMA and ionamycin as
previously
described to induce acute T cell activation. After 3 hours of incubation the
cells
were harvested, RNA extracted, and LightCycler-based PCR performed as
described above. The GES shown in Figure 7 was calculated based on
normalization of gene expression based on housekeeping gene expression. The
data shown in Figure 7 represent a GES for the acute and mean of the 8
patients
with chronic HCV infection compared to the mean of the GES calculated from
the 20 normal blood donor specimens. Also shown below Figure 7 is the range
from the lowest to the highest values for each of the genes evaluated for the
20
normal blood donor patients. The data shown in Figure 7 are broken into 2
categories: genes representing T cell activation as compared to genes
representing macrophage activation. The acute infection (A) is compared in
Figure 10 to the mean value of the 8 patients with chronic HCV infection. The
VVD 01/40517 CA 02393136 2002-05-30 pCT~S00/32492
-27-
values for the chronically infected patients were highly variable and are
shown
in Figure 6B.
Multigene expression score in unstimulated PBMC of patients with
HCV disease.
The gene expression values shown in Figure 6 with the deduced GES
values were stratified based on the liver inflammation score obtained
independently from a pathologist uninvolved in the gene expression evaluation.
A multiple gene expression score (MGES) was determined utilizing gene
expression values from the following genes from the patients shown in Figure 4
(TNFa,, IP10, MIP-2a., interferon-y, and MRP14). The GES of each patient's
expressed gene involved in the MGES calculation is shown in Figure 9. The
MGES calculated scores for each patient were then plotted based on a liver
inflammation score determined by independent pathologic evaluation and this
data was plotted and are shown in Figure 8. The 20 normal patients were also
given MGES scores represented in the figure as normal range which showed
MGES from 0 to 2 with a mean of 1. Patient with acute HCV infection is
shown with an MGES score of 10. The statistical relationship between the
MGES score and liver inflammation score is shown as an r'- value.
Multigene expression score in unstimulated PBMC of patients with
HCV disease.
Similar to the MGES procedure utilized for data shown in Figure 8, an
MGES was determined based on the induced GES scores as shown in Figure 9.
MGES determinations were based on the calculated GES evaluated for each
individual gene being then converted into an MGES score combination,
including all 3 genes. The normal range is shown and designated normal range
with the mean of 1 with the range from -3 to 0. Acute HCV infection is shown
with a calculated MGES of -2.5. The statistical relationship between the
MGES score and liver inflammation score is shown as an r' value.
While the invention has been described in detail with reference to the
examples and particularly preferred embodiments, those skilled in the art will
WO 01/40517 CA 02393136 2002-05-30 pCT/US00/32492
-2g-
appreciate that various modifications can be made to the invention without
departing from the spirit and scope thereof. All documents referred to above
are incorporated by reference.