Note: Descriptions are shown in the official language in which they were submitted.
CA 02398154 2002-07-24
WO 01/55749 PCT/USO1/02047
BED BOUNDARY DETECTION AND
INVASION PROFILING WITH UNCOMPENSATED
ELECTROMAGNETIC WAVE RESISTIVITY SENSORS
CROSS-REFERENCE TO RELATED APPLICATIONS
Not Applicable.
STATEMENT REGARDING FEDERALLY SPONSORED
RESEARCH OR DEVELOPMENT
Not Applicable.
BACKGROUND OF THE INVENTION
In drilling a borehole in the earth, such as for the recovery of hydrocarbons
or for other
applications, it is conventional practice to connect a drill bit on the lower
end of an assembly of
drill pipe sections which are connected end-to-end so as to form a "drill
string." Figure 1
includes a drilling installation having a drilling rig 10 at the surface 12 of
a well, supporting a
drill string 14. The drill string includes a bottom hole assembly 26 (commonly
referred to as
a "BHA") coupled to the lower end of the drill string 14. The BHA includes the
drill bit 32,
which rotates to drill the borehole. As the drill bit 32 operates, drilling
fluid or mud is
pumped from a mud pit 34 at the surface into the drill pipe 24 and to the
drill bit 32. After
flowing through the drill bit 32, the drilling mud rises back to the surface,
where it is
collected and returned to the mud pit 34 for filtering.
Modern drilling operations demand a great quantity of information relating to
the
parameters and conditions encountered downhole to permit the driller to change
the direction of
drilling to find or stay in formations that include sufficient quantities of
hydrocarbons. Such
information typically includes characteristics of the earth formations
traversed by the wellbore,
in addition to data relating to the size and configuration of the borehole
itself. The collection of
information relating to conditions downhole, which commonly is referred to as
"logging," can be
performed by several methods.
Logging has been known in the industry for many years as a technique for
providing
information regarding the particular earth formation being drilled. In
conventional oil well
wireline logging, a probe or "sonde" is lowered into the borehole after some
or all of the well has
been drilled, and is used to determine certain characteristics of the
formations traversed by the
borehole. The sonde may include one or more sensors to measure parameters
downhole and
typically is constructed as a hermetically sealed steel cylinder for housing
the sensors, which
hangs at the end of a long cable or "wireline." The cable or wireline provides
mechanical
support to the sonde and also provides an electrical connection between the
sensors and
CA 02398154 2002-07-24
WO 01/55749 PCT/USO1/02047
associated instrumentation within the sonde, and electrical equipment located
at the surface of
the well. Normally, the cable supplies operating power to the sonde and is
used as an electrical
conductor to transmit information signals from the sonde to the surface, and
control signals from
the surface to the sonde. In accordance with conventional techniques, various
parameters of the
earth's formations are measured and correlated with the position of the sonde
in the borehole, as
the sonde is pulled uphole.
While wireline logging is useful in assimilating information relating to
formations
downhole, it nonetheless has certain disadvantages. For example, before the
wireline logging
tool can be run in the wellbore, the drillstring and bottomhole assembly first
must be removed or
"tripped" from the borehole, resulting in considerable cost and loss of
drilling time for the driller
(who typically is paying daily fees for the rental of drilling equipment). In
addition, because
wireline tools are unable to collect data during the actual drilling
operation, the drilling service
company must at times make decisions (such as the direction to drill, etc.)
possibly without
sufficient information, or else incur the cost of tripping the drillstring to
run a logging tool to
gather more information relating to conditions downhole. In addition, because
wireline logging
occurs a relatively long period after the wellbore is drilled, the accuracy of
the wireline
measurement can be compromised. As one skilled in the art will understand, the
wellbore
conditions tend to degrade as drilling fluids invade the formation in the
vicinity of the wellbore.
Consequently, a resistivity tool run one or more days after a borehole section
has been drilled
may produce measurements that are influenced by the resistivity of the mud
that has invaded the
formation. In addition, the shape of the borehole may begin to degrade,
reducing the accuracy
of the measurements. Thus, generally, the sooner the formation conditions can
be measured, the
more accurate the reading is likely to be. Moreover, in certain wells, such as
horizontal wells,
running wireline tools can be problematic.
Because of these limitations associated with wireline logging, there is an
emphasis on
developing tools that can collect data during the drilling process itself. By
collecting and
processing data and transmitting it to the surface real-time while drilling
the well, the driller can
more accurately analyze the surrounding formation, and also can make
modifications or
corrections, as necessary, to optimize drilling performance. With a steerable
system the driller
may change the direction in which the drill bit is headed. By detecting the
adjacent bed
boundaries, adjustments can be made to steer the drill bit in an oil bearing
layer or region.
Moreover, the measurement of formation parameters during drilling, and
hopefully before
invasion of the formation, increases the usefulness of the measured data.
Further, making
2
CA 02398154 2002-07-24
WO 01/55749 PCT/USO1/02047
formation and borehole measurements during drilling can save the additional
rig time which
otherwise would be required to run a wireline logging tool.
Designs for measuring conditions downhole and the movement and the location of
the
drilling assembly, contemporaneously with the drilling of the well, have come
to be known as
"measurement-while-drilling" techniques, or "MWD." Similar techniques,
concentrating more
on the measurement of formation parameters of the type associated with
wireline tools,
commonly have been referred to as "logging while drilling" techniques, or
"LWD." While
distinctions between MWD and LWD may exist, the terms MWD and LWD often are
used
interchangeably. For the purposes of this disclosure, the term LWD will be
used generically
with the understanding that the term encompasses systems that collect
formation parameter
information either alone or in combination with the collection of information
relating to the
position of the drilling assembly.
The measurement of formation properties during drilling of the well by LWD
systems
thus improves the timeliness of measurement data and, consequently, increases
the efficiency
of drilling operations. Typically, LWD measurements are used to provide
information
regarding the particular formation through which the borehole crosses.
Currently, resistivity
tools are logging sensors or tools that commonly are used as part of either a
wireline or an
LWD system. For a formation to contain hydrocarbons, the rock comprising the
formation
must have certain well known physical characteristics. One characteristic is
that the formation
has a certain measurable resistivity (the inverse of conductivity). This
resistivity can be
determined by sending an electromagnetic wave signal of a particular frequency
that travels
through the formation. As will be apparent to one skilled in the art, a wave
traveling from point
A to point B through a formation is attenuated and its phase is shifted
proportional to the
conductivity of the formation. Analysis of this attenuation and phase shift
provides the
resistivity of the formation surrounding the resistivity tool, which then can
be used in
combination with other measurements to determine whether the formation will
produce
hydrocarbons.
Ordinarily, a well is drilled vertically for at least a portion of its final
depth. The layers,
strata, or "beds" that make up the earth's crust are generally substantially
horizontal. Therefore,
during vertical drilling, the well is substantially perpendicular to the
geological formations
through which it passes. A sudden measured change in resistivity by a
resistivity tool generally
indicates the presence of a bed boundary between layers. For example, in a so-
called "shaley"
formation with no hydrocarbons, the shaley formation has a very low
resistivity. In contrast, a
bed of oil-saturated sandstone is likely to have a much higher resistivity.
3
CA 02398154 2002-07-24
WO 01/55749 PCT/USO1/02047
Figure 2 shows a conventional resistivity tool 220 as part of a bottomhole
assembly. A
well bore 200 is drilled through formation 205, and contains a drill string
210. Attached to drill
string 210 is drill bit 215. The resistivity tool includes a transmitting loop
antenna TX that
transmits electromagnetic signals into the formation. The resistivity tool
also includes a pair of
loop antennas, Rl and R2, positioned predetermined distances from the
transmitter. Transmitter
TX generates an electromagnetic (EM) wave 255 at a selected frequency that is
received at
receivers Rl and R2 after traveling through the formation 205. First and
second signals at the
receivers result. The amplitude ratio and the phase difference of the EM wave
can then be
measured and a resistivity measurement derived for a particular depth. Thus,
the tool indicates
the presence of a bed boundary by the rapid change in value of the resistivity
measurements.
Figure 3 shows a depth-resistivity log as measured for a sample wellbore by a
conventional resistivity tool, such as shown in Figure 2. Along the x-axis,
resistivity
measurements range between 0.2 and 200 ohms. Along the y-axis, a depth reading
ranges from
about 1010 feet to 1040 feet. Between an "A" depth of about 1018 feet and a
"B" depth of about
1023 feet, the measured resistivity rises substantially, indicating the
presence of a bed boundary
somewhere between these depths. However, although the resistivity tool that
made these
measurements indicates a bed boundary somewhere between depth "A" and depth
"B", the exact
depth for the bed boundary is unclear. The best guess for this bed boundary
depth is called the
"inflection point."
The lack of resolution regarding the depth of bed boundaries is particularly
troublesome
when drilling through a series of relatively thin beds. Figure 4 is a depth-
resistivity graph as
measured for a sample wellbore having numerous adjacent thin beds of varying
resistivities.
Along the x-axis, resistivity measurements range between 0.2 and 200 ohms.
Along the y-axis,
a depth reading ranges from about 1005 feet to about 1035 feet. Between a
depth of about 1018
feet and 1032 feet there are numerous thin beds of varying resistivities.
However, because the
vertical resolution of the conventional resistivity tool is so poor, it is
extremely difficult to
establish with any accuracy the exact depth of each bed boundary. Further,
even if a bed
boundary depth may be determined, it is unclear whether the tool is entering a
lower or higher
resistivity bed layer.
Another problem with the conventional resistivity tool is an inability to
measure
resistivities deep into the formation surrounding the borehole. Generally
speaking, it is desirable
for the resistivity tool to measure at multiple depths into the formation
around the borehole
between the transmitter and receiver pair. This is referred to as the radial
resolution of the tool.
Referring to Figure 5, the first and closest diameter of investigation
relative to the resistivity
4
CA 02398154 2002-07-24
WO 01/55749 PCT/USO1/02047
tool is the area within the wellbore through which drilling mud flows back to
the surface. If the
resistivity of this area is measured inside the wellbore (around the tool
itself), a resistivity value
will be obtained that generally approximates the resistivity of the drilling
mud, R",. This
diameter of investigation can be referred to as D",, to denote that this is
the depth of
investigation that will produce a resistivity reading of the drilling mud. The
next general area
of investigation is the region within the surrounding formation that has been
invaded by the
drilling mud. This diameter of investigation can be referred to as Di, because
a resistivity
measurement in this region will produce a resistivity value of approximately
Rxo, which is the
resistivity of the invaded zone. The third region of investigation for a
resistivity tool, is the
formation which has not been invaded by drilling mud. A resistivity
measurement of this
region will yield the true resistivity value of the formation, Rt. As one
skilled in the art will
understand, the diameters of investigation, D", and Di will vary depending
upon many factors,
including the position of the tool in the wellbore, the characteristics of the
formation and the
drilling mud, the time that has elapsed from when that portion of the wellbore
was drilled, and
the like. While information regarding R", and Rxa are useful for purposes of
evaluation, one of
the goals of the resistivity tool is to measure the true formation
resistivity, Rt. Thus, it is
important to design the resistivity tool to have a sufficient depths of
investigation to measure
this resistivity. Ideally, this tool would also measure the resistivity of R""
Rxa, and Rt at many
varying radial depths.
In an attempt to improve radial resistivity data, it is known to add
transmitters to the
resistivity tool. Figure 6 includes a resistivity tool 600 including first
transmitter Tl at axial
location 610, second transmitter T2 at axial location 620, third transmitter
T3 at axial location
630, fourth transmitter T4 at axial location 640, first receiver Rl at axial
location 650 and second
receiver R2 at axial location 660. First, second, third and fourth
transmitters are each spaced 8"
from one another. First receiver Rl is spaced 8" from the first transmitter
Tl. Second receiver
RZ is 8" from first receiver Rl. A measurement point 655 is halfway between
first receiver Rl
and second receiver R2. Thus, first, second, third, and fourth transmitters
are 12, 20, 28, and 36
inches from measurement point 655, respectively. Figure 7 is a resistivity-
invasion depth graph
showing data curves that might be obtained with the four transmitter
resistivity tool of Figure 6.
These data curves correspond to transmitter-measurement point spacings of 12,
20, 28 and 36
inches. Nevertheless, this amount of data is still does not indicate to the
desired degree the
resistivities of the formation surrounding the borehole.
It would be desirable to develop a resistivity tool or method that can
accurately
determine the exact depth of bed boundaries. Ideally, such a tool or method
could also indicate
5
CA 02398154 2002-07-24
WO 01/55749 PCT/USO1/02047
whether the resistivity tool is entering a higher or lower resistivity layer,
even where numerous
thin beds are adjacent to one another. In addition, it is desirable for such a
resistivity tool to
obtain an increased amount of data with respect to the radial resistivities
surrounding the
borehole.
SU1VIMARY OF THE INVENTION
A preferred embodiment of the invention features a logging while drilling
measurement
tool including first transmitter capable of generation of a signal, a first
receiver, a second
receiver, and a third receiver, the first and second receivers defining a
first measurement location
corresponding to a first phase shift for the signal, and the second and third
receivers defining a
second measurement location corresponding to a second phase shift for the
signal, and a
processor operating on the first and second phase shifts to locate a change in
resistivity near the
second measurement location. Preferably, this operation includes taking a
difference between
the first and second phase shifts. This tool can establish whether the tool is
entering a relatively
high resistivity region or a relatively low resistivity region.
The invention may also be described as a method to determine bed boundaries in
a
multi-layer formation, including measuring a phase shift of a travelling
signal at a first location,
measuring a phase shift of that travelling signal at a second location, and
operating on the first
phase shift and the second phase shift to determine if the first location
corresponds to a different
resistivity than the second location.
Thus, the embodiments of the invention comprise a combination of features and
advantages that enable it to overcome various problems of prior devices. The
various
characteristics described above, as well as other features, will be readily
apparent to those
skilled in the art upon reading the following detailed description of the
preferred embodiments
of the invention, and by referring to the accompanying drawings.
BRIEF DESCRIPTION OF THE DRAWINGS
For a more detailed description of the preferred embodiment of the present
invention,
reference will now be made to the accompanying drawings, wherein:
Figure 1 is a is an illustrative example of a drilling system;
Figure 2 is a diagram of a first prior art resistivity tool;
Figure 3 is an inflection point resistivity-depth log of a first formation
Figure 4 is an inflection point resistivity-depth log of a second formation;
Figure 5 illustrates the significance of resistivity measurements obtained at
different
radial depths of investigation;
6
CA 02398154 2002-07-24
WO 01/55749 PCT/USO1/02047
Figure 6 is a diagram of a second prior art resistivity tool;
Figure 7 is a resistivity-invasion depth graph according to the tool of Figure
6;
Figure 8 is a diagram of a first resistivity tool according to the invention;
Figure 9 is a first ~Qj4 log as compared to the corresponding inflection point
log;
Figure 10 is a second OS64 log as compared to the corresponding inflection
point log;
Figure 11 is a third 064 log as compared to the corresponding inflection point
log;
Figure 12 is a second resistivity tool according to the invention;
Figure 13 is a resistivity-invasion depth graph according to the tool of
Figure 12;
Figure 14 is a flow chart of a method according to the invention.
DETAILED DESCRIPTION OF THE PREFERRED EMBODI1VV1ENT
Figure 8 includes a resistivity tool 800, including at least a first
transmitter Tl at axial
location 810, a first receiver Rl at axial location 820, a second receiver RZ
at axial location 830,
and a third receiver R3 at axial location 840. A first point of measurement
825 exists half-way
between receivers Rl and R2. A second point of measurement 835 exists half way
between
receivers RZ and R3. The resistivity tool 800 may also optionally contain
additional transmitters.
Also included are associated electronics 850 at any appropriate location.
These electronics may
include circuitry to fire transmitter Tl at one or more particular
frequencies, circuitry for
detecting the resulting signal at each receiver, a downhole processor, and
memory for storing
the detected waveforms. The transmitters and receivers may appropriately be
wires or coils
wrapped around the outside of a drill string, as is well known, but may also
be any other
appropriate type or location. Such a resistivity tool is appropriate for
placement downhole
during drilling and is preferably an LWD tool. A direction labeled "downhole"
is also shown to
assist in an understanding of this embodiment.
During operation, the transmitter Tl generates an EM wave at one or more
frequencies
that travels through the surrounding formation and to the receivers Ri, R2,
and R3. The signal
generated by the transmitter Tl, therefore, undergoes attenuation and phase
shift as it travels
from the transmitter Tl through the formation. In particular, the EM signal
will undergo
separate and measurable attenuation and phase shift with respect to the
measurement points
corresponding to each pair of receivers, Rl, RZ, and R2, R3. Thus, the
transmitted signal
undergoes a first attenuation and phase shift corresponding to the first point
of measurement
825, and undergoes a second attenuation and phase shift corresponding to the
second point of
measurement 835. The first phase shift is referred to as ~Q~1. The second
phase shift is referred
to as 062. An associated processor or micro-processor in electronics 850 can
find a phase shift
7
CA 02398154 2002-07-24
WO 01/55749 PCT/USO1/02047
~~3 corresponding to a location half way between measurement points 825 and
835. This
phase shift may be obtained from the equation:
- ~~i + ~~z (1)
2
As known in the prior art, a single phase shift may be used to determine the
resistivity of
the formation at a single location proximate the midpoint of two receivers.
The resistivity of the
formation corresponding to locations 825, 830, and 835 may therefore be
determined by those
artisans of ordinary skill.
Moreover, OQ~1 and 0~2 may be used to accurately determine the bed boundary
location.
If the difference in the phase shifts, ~Q~4, is defined as:
09.X4 = D~a - 0~6i (2)
then the phase change OS6~ has a small value in a homogenous formation, but a
large value at a
bed boundary. An abrupt change in ~~64 therefore corresponds to an exact depth
of a bed
boundary.
Figure 14 is a flow chart of this method. At step 1400, a first phase
difference is
measured for a signal travelling from a transmitter through a formation. At
step 1410, a second
phase difference is measured at a different location for this signal
travelling through the
formation. At step 1420, the value 064 is found by subtracting ~Q~1 from ~Q~2.
It is of course to
be understood that an equally useful value as OQ~ø could be found by
subtracting ~Q~2 from 0~1.
At step 1430, the value of 0~4 is monitored for an abrupt change. When an
abrupt change
occurs, a bed boundary is indicated at step 1450.
If this value of ~56~ is found downhole by an associated processor, for
example, this data
can be transmitted to the surface by suitable devices such as a mud siren or
other appropriate
device. At the surface, the data can be used quickly to stop or change the
direction of drilling.
Alternately, the data may be stored downhole, it may be processed uphole, a
portion of the data
(such as the presence of a bed boundary) may be transmitted uphole while the
remainder is
stored downhole, or it may be otherwise manipulated.
Figure 9 is a graph of ~~6ø for a vertical 10-foot section of the wellbore.
Along the x-
axis is a phase difference range from -15.0 degrees to 15.0 degrees. The y-
axis ranges in depth
from about 1010 feet to about 1045 feet. In Figure 9, the graph of 0~4 is
placed next to the
inflection point log from Figure 3. As contrasted with a conventional
inflection point log such
as Figure 3, the graph of 0~4 contains sharp, well-defined curves
corresponding to the depths of
bed boundaries. Thus, the positive or negative peaks in ~Qj4 at almost exactly
1020, 1025, 1030,
8
CA 02398154 2002-07-24
WO 01/55749 PCT/USO1/02047
and 1035 indicate bed boundaries precisely at those depths. Further, the large
negative phase
change at exactly 1020 feet indicates the entry by receiver R3 of a high
resistivity bed. The large
positive phase change at exactly 1025 feet indicates that the resistivity tool
is leaving the high
resistivity layer and is entering a low resistivity layer. Thus, the tool not
only measures with
precision the depth of the bed boundary, but also whether the tool is entering
or leaving a high
resistivity region such as an oil-saturated sandstone layer.
Figure 10 is a log of OQ~~ measurements of the same thin-layer bed formation
recorded in
Figure 4. Along the x-axis is a phase difference range from -15.0 degrees to
15.0 degrees. The
y-axis ranges in depth from about 1005 feet to about 1035 feet. For comparison
purposes, the
corresponding inflection point log from Figure 4 is located adjacent the log
of 064. With the
conventional inflection point of Figure 4, it is extremely difficult to
determine with any accuracy
the exact depth of a bed boundary. As can be seen from Figure 9, unlike a
conventional
inflection point log, the OQ~~. log clearly indicates the presence of a bed
boundary at almost
exactly 1020 feet, 1021 feet, etc. Further, based upon whether the 0~6ø peaks
are positive or
negative, it is apparent whether the tool is entering a higher or lower
resistivity bed.
The tool also has applicability to deviated or directional wells through
anisotropic
formations. Figure 11 includes a graph of ~~4 values for a wellbore deviated
80° from vertical
(i.e., almost horizontal) through an anisotropic formation. Anisotropic
formations are
formations whose resistivity may change not only vertically, but also
horizontally through a bed
layer. As can be seen, even in an anisotropic formation, this embodiment
indicates the depth of
a change in bed boundaries. It is believed that even better measurements would
occur for a
highly deviated well in an isotropic formation.
In the. event that a tool having three or more receivers (such as that shown
in Figure 8) is
not available, a two receiver resistivity tool may be used instead to
implement a method of the
invention. For example, a OQ~1 may be measured initially. The tool may then be
moved forward
a distance equal to the receiver spacing (i.e., the distance between receivers
Rl and R2). The one
or more transmitters may then be re-fired and a second phase difference, OQ~2,
is measured. A
processor or the like could operate on OQ~1 and 4f62 to derive ~Q~3 and 064 as
explained above
with reference to the preferred embodiment.
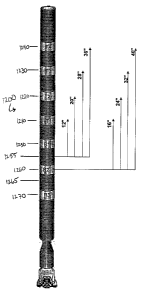
One aspect of the invention also provides a higher radial resolution. Figure
12 shows a
resistivity tool 1200 including a first transmitter Tl at axial location 1210,
a second transmitter
T2 at axial location 1220, a third transmitter T3 at axial location 1230, and
a fourth transmitter
T4 at axial location 1240. Also part of the resistivity tool 1200 are first
receiver Rl at axial
location 1250, second receiver RZ at axial location 1260, and third receiver
R3 at axial location
9
CA 02398154 2002-07-24
WO 01/55749 PCT/USO1/02047
1270. Measurement point 1255 is midway between receivers Rl and R2, while
measurement
point 1265 is midway between receivers R2 and R3. A measurement point
corresponding to
~Q~3 also exists at location 1260. Associated electronics connected to the
tool fire the
transmitters at one or more preselected frequencies. The electronics also
measure amplitude and
phase angle at the receivers, or it may measure the attenuation and phase
shift at the receivers.
A distance of 8" separates each of the transmitters Tl - T4. Receivers Rl, R2,
and R3 are
each separated by 8" as well. A distance of 8" also exists between transmitter
Tl and receiver
Rl. One particular advantage of the embodiment shown is the regular and
incremental increase
of measurement spacing distances. As can be seen, a first measurement distance
between
transmitter Tl and measurement point 1255 exists and is 12". A second
measurement distance,
between transmitter T2 and point 1255 is 20". A third measurement distance,
between
transmitter T3 and point 1255 is 28". A fourth measurement distance between
transmitter T4
and point 1255 is 36". A fifth measurement distance between transmitter Tl and
point 1260 is
16". A sixth measurement distance between transmitter T2 and point 1260 is
24". A seventh
measurement distance between transmitter T3 and point 1260 is 32". An eighth
measurement
distance between transmitter T4 and point 1260 is 40".
Although these exact distances are not crucial to the invention, and it is
within the skill
of the ordinary artisan to change these spacings, it can be appreciated that
the addition of
receiver R3 provides for additional measurement points, and the illustrated
spacings provide
multiple benefits. For example, there now exists transmitter-measurement point
spacings of 12,
20, 28 and 36 inches with respect to the first measurement point, and 20, 28,
36, and 44 inches
with respect to the second measurement point, resulting in duplicate
measurement point spacings
at 20, 28, and 36 inches. There also exists transmitter-measurement point
spacings of 16, 24, 32
and 40 inches with respect to the third measurement point, yielding nine
measurement spacings
total. Figure 13 is a resistivity-invasion depth graph including the radial
response for 12, 20, 28,
and 36 inch spacings as well as the 16, 24, and 32 inch measurement spacings.
Consequently,
Figure 13 includes an increased number of data curves as compared to Figure 7
and the radial
resolution of the tool of Figure 12 is improved with respect to a tool such as
shown in Figure 6.
While preferred embodiments of this invention have been shown and described,
modifications thereof can be made by one skilled in the art without departing
from the spirit or
teaching of this invention. The embodiments described herein are exemplary
only and are not
limiting. Many variations and modifications of the system and apparatus are
possible and are
within the scope of the invention. Accordingly, the scope of protection is not
limited to the
CA 02398154 2002-07-24
WO 01/55749 PCT/USO1/02047
embodiments described herein, but is only limited by the claims that follow,
the scope of which
shall include all equivalents of the subject matter of the claims.
11