Note: Descriptions are shown in the official language in which they were submitted.
CA 02399272 2002-08-02
WO 01/57775 PCT/USO1/01988
-1-
SYSTEM AND METHOD FOR MODELING GENETICa
BIOCHEMICAL. BIOPHYSICAL AND ANATOMICAL
INFORMATION: IN SILICO CELL
This is a continuation-in-part of Application Serial No.
09/295,503, filed April 21, 1999, which claims the benefit of U.S. Provisional
Application No. 60/083,295, filed April 28,1998.
BACKGROUND OF THE INVENTION
1. Field of the Invention:
The present invention relates to a computer-implemented system
of constructing databases and modeling biological processes; and more
particularly to mathematical, informational, and computational processes and
procedures for automatically generating computer-based models that integrate
biological information from the subcellular to the cellular, tissue and organ
level.
Z. Description of the Prior Art:
Cell biologists face a major challenge distilling the vast quantity
of new data that is being generated at heretofore unprecedented rates. At
present, hundreds of biological databases are listed in DBCAT, the
INFOBIOGEN biological database catalog accessible from the World Wide
Web (http:l/www.infobiogen.fr/services/dbcat/) and available publicly
through the National Center for BioTechnology Information (http://www.ncbi
nlm.nih.gov). This information explosion has been driven by the continuous
development of information technology such as the Internet as well as the
development of powerful new technologies for automatically collecting and
storing data such as in gene sequencing and gene expression profiling. These
databases contain genomic, biochemical, chemical and molecular biology data
as well as structural data comprising geometric and anatomical information
from the subcellular to the whole organism level. Some of these data are
organized by data type including, for example, the International Nucleic Acid
Sequence Data Library (a.k.a. GenBank) and NAD for nucleic acid sequences;
CA 02399272 2002-08-02
WO 01/57775 PCT/USO1/01988
-2-
SWISS-PROT for protein sequences; PDB for protein structures and the like.
Other databases are organism specific and include GDB and OMIM for
human; MGD for mouse, PigBASE for pig; ATDB for Arabidopsis; ECDC for
E. Coli, and many others. Still other databases contain information on
particular areas of interest, such as specific databases for individual genes,
databases about specific protein families, and databases of transcription
factors. Biochemical databases contain information regarding coupled
biochemical reactions and feedback signals which take place within the cell.
Additionally, proprietary databases such as the availability of entire genomic
sequences due to improved high throughput gene sequencing, available from
the large data production houses, have been created and are expanding with
technology.
Substantial work is underway to integrate data from these
diverse databases. See e.g., Macauley, et al., A Model System for Studying
the Integration of Molecular Biology Databases, 14 Bioinformatics 575-582
(1998).
Efforts to organize and analyze the vast amount of genomic data
have stimulated the development of a new field of computational science
known as bioinformatics; the science of using computers and software to
store, extract, organize, analyze, interpret and utilize gene sequence data to
identify new genes and gene function- in order to understand the genetic basis
of disease and to further gene-based drug discovery and development. This
approach typically uses a one-dimensional computational analysis to study
explicit information about the genome such as percentage of gene sequence
similarity across species, homology of sequence motifs across species,
expression levels in various tissue types, secondary structure correlations,
etc.
Although the acquisition of genomic, information is clearly essential, there
is
growing recognition that conventional methods are insufficient for correlating
that information with the functional role of genes and gene products. Rather,
in all cells, genetic expression produces self organizing networks controlling
cell functions, including developmental pathways, progression through cell
cycle, metabolism, intracellular signaling, cell excitability and motility,
and
CA 02399272 2002-08-02
WO 01/57775 PCT/USO1/01988
-3-
feedback loops regulating gene expression. At present, bioinformatics is
unable to simulate these complex, highly nonlinear dynamic interactions that
occur between each gene or gene product, and other components of the
a network they are a part of. Thus, bioinformatics researchers do not, at
present, have the necessary tools to obtain a complete representation of
subcellular and cellular processes, as well as the effect of these processes
on
tissues and organs.
One approach to dealing with these complex, highly nonlinear
interactions has focused on computational modeling. There is 'an extensive 40
year history of such modeling that includes simple models with a few state
equations that describe processes within cells to highly complex models of
organ systems that must be implemented on high performance multiprocessor
computers (Rail W., Burke R.E., Holmes W.R., Jack J.J., Redman S.J., Segev
I. (1992) Physiol. Rev. 72(4 Suppl) 5159-86; Rall W. (1967) J. NeuroPhysiol
30(5): 1169-93, Segev I. and Rall W. (1998) Trends Neurosci 21(11): 453-60;
Koch C., Poggio T., and Torre V. (1982) Philos. Traps. Roy. Soc. Lond. B.
298(1090):227-63, Chay T.R. and Rinzel J. (1985) Biophys. J. 47(3): 357-66;
Smolen P., Rinzel J., Sherman A. (1993) Biophys J. 64(6): 1668-80, Shepherd
G.M.et al (1998) Trends Neurosci 21(11): 460-8). This approach provides a
means to link experimental data regarding specific biological processes to
cell
function. The culmination of this 40 year history can be seen in several
efforts such as the nationally funded efforts, The Human Brain Project and the
Virtual Cell Project. The Human Brain Project is a mufti-agency funded
mufti-site effort to organize and utilize diverse data about the brain and
behavior. The Virtual Cell project has developed a framework for organizing,
modeling, simulating, and visualizing cell structure and physiology.
However, these projects lack an overall ability to link to existing genetic,
protein and structural data bases. In addition, these projects have not
defined
procedures for modeling biological systems using information stored in local
or distributed databases. As such, detailed and accurate representations of
the
many different simultaneous subcellular and cellular processes and the effect
CA 02399272 2002-08-02
WO 01/57775 PCT/USO1/01988
-4-
of these processes on cellular systems which occur at any given time are not
presently possible.
What is needed therefore are new computer based tools to
formulate computational models of subcellular and cellular processes, as
S well as the effect of these processes on intercellular systems. Such tools
will provide a means for linking information at the level of the gene to
functional properties of intercellular systems in health and disease, will
further the understanding of disease processes, and aid in drug target
identification and screening.
SUMMARY OF THE INVENTION
In accordance with the present- invention, there is provided a
system and method for integrating genetic, biochemical, biophysical and
anatomical information at the subcellular, cellular, tissue and organ level.
Generally stated, the system comprises: (a) at least one database containing
biological information which is used to generate at least one data structure
having at least one attribute associated therewith; (b) a user interface for
interactively viewing and editing attributes the data structure to create at
least
one hierarchical description of subcellular, cellular, tissue or organ
function;
(c) an equation generation engine operative to generate at least one
mathematical equation from at least one hierarchical description; and (d) a
computational engine operative on at least one mathematical equation to
model dynamic biological behavior.
Advantageously, the system of the present invention can access
and tabulate genetic information contained within proprietary and
nonproprietary databases, combine this with functional information on the
biochemical and biophysical role of gene products and based on this
information; formulate, solve and analyze computational models of genetic,
biochemical and biophysical processes within cells and higher order
biological systems. The system of the invention therefore provides a dynamic
tool for quantitative understanding of biological processes, identifying new
drug targets for therapeutic intervention and predicting the outcome of drug
CA 02399272 2002-08-02
WO 01/57775 PCT/USO1/01988
-5-
screening. This is accomplished by the accurate modeling and simulation of
highly complex nonlinear dynamic interactions that occur between each gene
or gene product.
In another aspect of the invention there is provided a method
modeling biological information that accounts for multiple time frames
inherent in biological processes comprising: (a) at least one database
containing biological information which is used to generate a plurality of
data structures, each having at least one attribute associated therewith; (b)
a
user interface for viewing, editing or linking the plurality of data
structures
to generate at least one hierarchical description of a biological system; (c)
a
correlation engine operative on at least one hierarchical description of a
biological system to generate a simplified system of equations; and (d) a
computational engine operative to solve the simplified system of equations
to create a model of a dynamic biological process. The models created in
accordance with this method integrate biological knowledge across all levels
of analysis ranging from that of the gene to that of the cell, tissue and
organ
to provide a detailed and accurate representation of heterogeneous systems.
This integration provides a mufti-dimensional analysis which simply was not
possible with the one-dimensional genomic computational analysis tools of
the prior art.
In yet another aspect of the present invention there is provided a
method for creating a model of biological information for use with a computer
system, comprising: (a) accessing at least one database containing biological
information; (b) generating a plurality of data structures, each having at
least
one attribute associated therewith; (c) interactively viewing editing or
linking
the plurality of data structures to generate at least one hierarchical
description
of a biological system; and (d) utilizing a at least one computational engine
to mathematically generate at least one model of a biological system
reflective of the multiple time frames inherent in biological processes.
In still another aspect of the invention there is provided a
method for linking models of subcellular and cellular processes to systems
processes comprising: (a) generating at least one hierarchical description of
CA 02399272 2002-08-02
WO 01/57775 PCT/USO1/01988
-6-
subcellular function from at least one database containing biological
information, the hierarchical description generated from a data structure
having at least one attribute associated therewith; (b) generating at least
one
hierarchical description of cellular function by linking a plurality of
attributes
of subcellular function from the hierarchical description of subcellular
function; (c) generating at one least hierarchical description of system
function by linking a plurality of attributes of cellular function from the
hierarchical description of cellular function; and (d) utilizing at least one
computational engine to mathematically generate at least one model of a
biological system reflective of a biological system. Advantageously, this
allows for the creation of highly complex models of biological systems.
BRIEF DESCRIPTION OF THE DRAWINGS
The invention will be more fully understood and further
advantages will become apparent when reference is made to the following.
detailed description and the accompanying drawings in which:
FIG. 1 is a schematic diagram illustrating the overall flow of
operations through the system of the present invention;
FIG. 2 is a Pathway Data Structure depicting the topology of the
pyruvate dehydrogenase reaction in which pyruvate is converted to acetyl
CoA;
FIG. 3 is a block diagram illustrating the flow of information to
produce hierarchical descriptions of subcellular and cellular function in
which EDS defines an elementary structure, BDS defines a binary data
structure, and PDS defines a pathway data structure;
FIG. 4 depicts a Binary Data Structure;
FIG. 5 illustrates a Binary Data Structure modeling a
biophysical process;
FIG. 6 illustrates a Binary Data Structure representing a gene
regulatory network;
FIG. 7 is a schematic diagram illustrating the flow of
information used to generate structural, finite-element cell models;
CA 02399272 2002-08-02
WO 01/57775 PCT/USO1/01988
FIG. 8 illustrates a biochemical reaction network;
FIG. 9a illustrates a naive (quiescent) signal transduction
pathway for P 13 kinase in Tcells;
FIG. 9b illustrates activation of a signal transduction pathway
for P 13 kinase in Tcells;
FIG. 9c illustrates inhibition of a signal transduction pathway
for P13 kinase in Tcells;
FIG. 10 sets forth a model of Tcell differentiation in
rheumatoid arthritis;
FIG. 11 sets forth a model of inhibition of Tcell differentiation
in rheumatoid arthritis as a result of TNF-a therapy;
FIG. 12a sets forth a model of Tcell differentiation from TO to
Thl;
FIG. 12b sets forth a model of Tcell differentiation from TO to
Th2;
FIG. 13 provides an example of a descriptive report generated
by the system of the invention in response to a specific modeling query;
FIG. 14 provides an illustrative graphical model output for the
dynamic change in concentrations or levels in a T-cell that is characteristic
of the behavior of that cell, and is characteristic of the signaling within
the
T-cell.
FIG. 15 illustrates the various reaction pathways involved
during the activation of Tcells;
DESCRIPTION OF THE PREFERRED EMBODIMENTS
The present invention provides a multidimensional
computational tool capable of integrating biological knowledge across all
levels of analysis ranging from that of the gene to that of the cell, tissue
and
organ. This is accomplished by a system and method which incorporates at
least one database that stores biological information, an interface which
displays, links, organizes and modifies that information, and computational
RECTIFIED SHEET (RULE 91)
CA 02399272 2002-08-02
WO 01/57775 PCT/USO1/01988
_g_
engines which operate on the information contained in the database to
automatically formulate, solve and analyze computational models of
biochemical reaction networks, biophysical mechanisms, and in general
dynamic processes at the subcellular, cellular, tissue, and organ level.
More specifically, the present invention is an interactive
computer-implemented system for mathematically modeling biological
information from the subcellular to the cellular, tissue, and organ level
comprising: (a) at least one database containing biological information
which is used to generate a plurality of data structures having at least one
attribute associated therewith; (b) a user interface for interactively viewing
and linking together attributes the plurality of data structures to create at
least one hierarchical description of subcellular, cellular, tissue or organ
function; (c) an equation generation engine operative to generate at least
one mathematical equation from at least one hierarchical description; and
(d) a computational engine operative on at least one mathematical equation
to model dynamic biological behavior.
The system of the present invention uses computer-implemented
tools to link genetic and molecular information to the topological and kinetic
properties of biochemical and biophysical processes within cells, tissues and
organs, to provide functional information on the biochemical and
physiological role of gene products, and the effect thereof on biological
systems. This information is coupled to computational engines that can
automatically formulate, interconnect, solve and analyze properties of
computational models of genetic, biochemical and biophysical processes
within biological systems. In this way, it is possible to address the
functional role played by. each molecularlgenetic component from which a
model is composed, to identify optimal points of therapeutic intervention
within these models and to "numerically screen" lead compounds for
functional effects on these models.
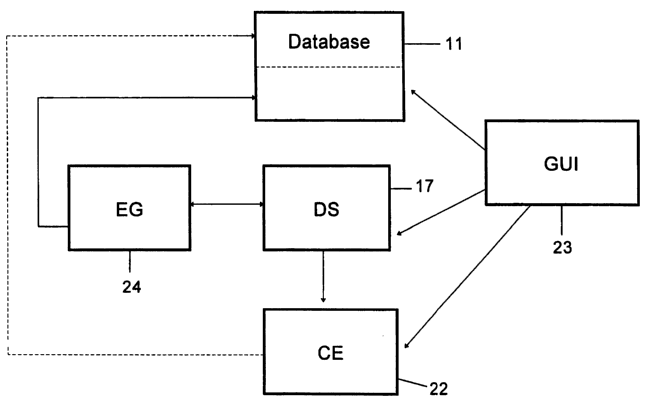
Referring now to the drawings, there is shown in Fig. ' 1 a
schematic diagram illustrating the overall flow of operations of the system of
the present invention. Generally stated, the system includes database 1 l,
data
CA 02399272 2002-08-02
WO 01/57775 PCT/USO1/01988
-9-
structure 17, graphical user interface 23 for interactive contact with the
information generated by the system, equation generation engine 24 and a
computational engine 22.
Databases
Database 11 encompasses both internal and external databases.
External refers to databases designed to store and organize biological
information, but which were not designed explicitly to be coupled with the
subcellular, cellular, tissue and organ modeling, simulation, and analysis
tools
described herein. Internal refers to databases with a specific structure (to
be
described in subsequent sections) which are designed explicitly to support the
formulation, simulation, and analysis of subcellular, cellular and systems
models. Internal and external databases include those containing gene and
protein sequences, biochemical and biophysical processes, descriptions of
cellular, tissue and organ physical structure, experimentally validated models
'of biochemical and physiological processes, or models previously generated
by the system. Advantageously, database 11 may contain one or any number
of the foregoing databases.
Any means for accessing and searching external and internal
databases may be used in the present invention. Typically these would
include: commercial database front-ends with SQL queries, web-based
solutions such as Perl scripts and Java-based tools for accessing remote
databases, as well as cxoss-platform software tools . available, for example,
from Genomica Corp. (Boulder, CO), Pangea Systems, Inc. (Oakland. CA)
and NetGenics Inc. (Cleveland, OH).
Internal databases include those that have been generated from
the data extracted from the external databases as well as data added by users
via the graphical user interface. Such data may include experimental data
including, for example, new descriptions of biochemical and physiological
processes, or it may be data generated as a result of computer modeling by the
system. Data generated and stored by the internal databases are manipulated
using commercially available object-relational or relational database
CA 02399272 2002-08-02
WO 01/57775 PCT/USO1/01988
- 10-
management systems such as Oracle Corp. (Redwood City, CA), Sybase, Inc.
(Emeryville, CA), or Informix (Memo Park, CA), or using markup languages
such as SGML or XML, all of which are well known to the skilled artisan.
Most importantly, the internal databases store information on the (a)
topology; (b) kinetics; and (c) interconnectivity between various genetic and
biochemical reaction networks (BRN'S) within cells. These are generically
referred to as internal biochemical databases herein.
In the context of the present invention, topology refers to the
pattern of interactions within a specific genetic or biochemical reaction
network; kinetics refers to the reaction rate constants that, in conjunction
with
the laws of mass action, determine the dynamic behavior of such reaction
network processes; and interconnectivity refers to the specific points of
coupling between different genetic and biochemical reaction networks within
the cell which results in cellular behavior. Thus, the internal biochemical
databases store the interconnection topology, including the rate constants
associated therewith, for each BRN. By way of example, the BRN for the
pyruvate dehydrogenase reaction in which pyruvate is converted to acetyl-
CoA is illustrated in FIG. 2. Information on this BRN which is stored in the
internal biochemical databases includes each of the intermediates involved in
the reaction, the enzymes involved in determining the rate at which the
intermediates are formed (along with lists of co-factors influencing the
reaction rate such as pH, temperature, and the like) and the reaction pathways
connecting these intermediates. These databases also include qualitative data
such as cell-cell, cell-molecule, molecule-molecule interactions, cell growth
rates, binding constants, concentration effects of cells and molecules on cell-
cell, cell-molecule, and molecule-molecule interactions and the like.
Advantageously, more than one BRN may be linked together to provide a
more complex representation of subcellular, cellular and system behavior.
The internal biochemical databases store genetic and
biochemical reaction network data in a way that makes possible the
hierarchical construction of mathematical and computational models of these
networks from their underlying components. Equation generation engine 24
CA 02399272 2002-08-02
WO 01/57775 PCT/USO1/01988
-11-
transforms each genetic and biochemical entity within the internal
biochemical database into a group of symbolic equations and numerical
subroutines associated therewith which are stored as attributes of these
entities. As discussed in more detail later, use of these attributes allows
.the
user to simulate and view functional behavior of this entity (based on the
genetic/biochemical properties of interest) by way of graphical user interface
23, and computational engine 22. In this way, the system makes it possible to
link genetic and molecular information to functional information regarding
subcellular, cellular and system processes. Preferably, each of these
attributes
associated with the genetic and biochemical entities also includes time delays
in process through implicit time constants that are functions of kinetic
rates.
This allows a model to incorporate multiple time frames to account for
disease progression in cellular and system models. The biochemical reaction
networks (BRNs) can be compartmentalized, i.e., a set of BRNs can be
gathered into different compartments each of which can have different
attributes such as surface area, internal volume, geometry among others. This
can create representations of different cells that have specific reactions and
molecules that interact by crossing the compartment boundary. When a
reaction carries a molecule from inside a compartment (cell) to its outside,
and that molecule is then taken into another compartment (cell), the cells are
communicating with each other and is one aspect of a tissue model. A
molecule can sit on one compartment boundary and attach to another molecule
sitting on another compartment and this represents cell-cell contact and is
another aspect of a tissue model. This process can be built up by including
all
the cell types and their quantitative numbers and thus build a complete
tissue.
In the same hierarchical way, the tissue compartments can then be used to
create whole organs.
A number of databases are presently available or are currently
being developed, see e.g., Popel et al., The Microcirculatio~ Physiome
Project, 26 Annals of Biomedical Ehgineeri~g 911-913 (1998). These
databases can be created and organized by known software tools which help
users build and organize databases such as, for example. those available from
CA 02399272 2002-08-02
WO 01/57775 PCT/USO1/01988
-12-
Oracle Corp. (Redwood City, CA). Software tools for designing and viewing,
interactive graphical representations via graphical user interface 23 of these
databases are also well known and readily available.
The internal databases will also represent and store information
regarding biophysical processes within cells, tissues and organs. These
internal biophysical databases contain information on the physical properties
of biological processes required to formulate mathematical and computational
models of these processes; for example, ion channels and currents, membrane
transport systems such as pumps and exchangers, membrane receptors and
signal transduction pathways for a given cellular process. Once formulated,
each physical property stores as attributes a group of symbolic equations and
numerical subroutines associated therewith which allow the user to simulate
and view cell function (based on the biophysical properties of interest) via
graphical user interface 23, equation generation engine 24 and computational
engine 22. As above, these attributes may also include time delay in
processes, enabling the incorporation of multiple time frames.
Internal databases also comprise internal structural databases
which contain information on the physical structure and spatial relationship
between various organelles within a given cell, as well as the relationships
between cells in tissues and organs. Typically, this information is in the
form
of three-dimensional image data obtained from different modalities (e.g.
electron micrograph serial sections, confocal serial sections, two-photon
laser
scanning serial sections, magnetic resonance images, position emission
tomography images and the like. Optionally, the three-dimensional image
data may be further transformed into structural fnite-element models
describing cell, tissue and organ shape and spatial placement of organelles
and/or cells therewithin via an optional computational modeling engine which
will be discussed in greater detail below. Structural models generated from
the three-dimensional data are also stored in the structural databases. The
structural databases thus contain information on anatomical subcellular,
cellular, tissue and organ structure and spatial relationships which, in
conjunction with the molecular, biochemical and biophysical databases,
CA 02399272 2002-08-02
WO 01/57775 PCT/USO1/01988
-13-
provides the data necessary to produce a complete model of subcellular,
cellular, tissue and organ function. As with other databases, the structural
databases may be publicly available or it may consist of a novel or
proprietary
database.
By way of example, the precise geometry of and the spatial
relationship between cardiac T-tubules and their associated L-type calcium
("Ca") channels and ryanodine-sensitive Ca release channels in the
sarcoplasmic reticulum membrane provides information on the properties of
calcium-induced calcium release, and therefore mechanical force generation in
cardiac muscle cells. Likewise, information about the physical location of
Ca-channels and Ca-modulated potassium channels in auditory hair cells
provides information about the electrical tuning of these cells or knowledge
of
the spatial location of subcellular processes in specific cell organelles,
e.g.
mitochondrial respiration, provides the information necessary for a complete
and accurate model of the entire cell.
External databases used in the present invention may be
accessible through known commercial channels or the Internet. Typically,
these databases contain gene sequence, protein sequence and three
dimensional structural data on each constituent of a biochemical reaction
network within a given cell or larger biological system, but certainly any
type
of data useful to develop models of subcellular, cellular, tissue and organ
function is within the scope of the present invention. External databases such
as those on the Internet are becoming increasingly standardized so that access
to a variety of diverse databases is possible in a single application. See
e.g.,
Markowitz et al., Characterizing Heterogeneous Molecular Biology Database
Systems, 2 J. Comput. Biol. 547-556 (1995). Advantageously, the system of
the present invention accesses and utilizes data from the external databases
during model creation. Alternatively, the system may transfer the information
from these databases into another database (not identified) in the system for
later use.
The information in internal database 11 is organized into and
stored as at least one data structure which is used to construct at least one
CA 02399272 2002-08-02
WO 01/57775 PCT/USO1/01988
- 14-
model of subcellular, cellular, or systems processes. Preferably, the data
structure comprises either a group of hierarchical description of subcellular,
cellular and system function 17. Alternatively, the data structure comprises
anatomical data structures describing the physical organization and structure
of biological cells, tissues and organs.
Data Structures
Data structure refers to a group of interdependent data generated
from information obtained from literature, experiments, expert information
and internal information. Typically, data structures are constructed by means
of the graphical user interface and the information available in the database
11. They may also be retrieved from previously defined data structures
residing in database 11, or generated from biological inputs (e.g.,
experimental data) into the system. Graphical user interfaces and databases
can in turn be developed using software tools such as those available from
Microsoft (Redmond, WA) or Oracle Corporation (Redwood City, CA).
Referring to FIG. 3, data structure 17 comprises elementary data
structure 16, binary data structure 19 and pathway data structure 2 with the
binary 19 and pathway 20 data structure formed from the lower level data
structures. The lowest level data structure is the elementary data structure
("EDS") 17. Each EDS 17 may comprise either a protein i.e., an entity coded
by a gene, or a variable. As used herein, a variable refers to anything other
than a gene, which defines interdependencies in cell processes as for example,
elements or ions important to cell function such as K+, Na+, Ca+, H+, organic
or inorganic compounds such as ATP, ADP, P;, or any abstracted quantity
describing the state of a biochemical or biophysical process, and which
relates
to organ, tissue, cellular, subcellular, molecular, or genetic function.
.EDS's
may also comprise state variables, a set of parameters which allow the
calculation of the behavior of the system at a point in time.
In accordance with the present invention, each EDS is associated
with an extensive set of attributes. For example, attributes associated with a
protein might describe the organism in which the protein is found, the
specific
CA 02399272 2002-08-02
WO 01/57775 PCT/USO1/01988
-15-
cell in which the protein is found, the specific gene coding for the protein,
the
sequence of the gene coding for the gene and so forth. The attributes
describing each EDS are defined and hierarchically arranged by means of the
graphical user interface 23.
These hierarchical description attributes thus comprise a
grouping of pointers to specific portions in database 11 in which specific
information associated with each attribute is found. By way of example, the
attributes associated with a given protein could be arranged as Organism:
Cell:Gene:State:Sequence:Structure:Location:Model. In this instance, the
attribute "Organism" is a pointer to the appropriate gene database in which a
gene which codes for the protein exists. The attribute "Cell" points to the
specific cell type within that database in which the gene is expressed. The
attribute "Gene" is a pointer to the specific gene in the database. The
attribute "State" identifies the state of the Organism:Cell:Gene triplet and
may
be anything that might effect expression of the protein such as an age-related
parameter, the presence of a particular disease in the organism, a particular
time in the progression of a disease, or the like. Therefore, the attribute
"State" is a pointer identifying which particular subset of the
Organism:Cell:Gene database to search. The attribute "Sequence" is a pointer
to sequence data in the structure of the gene coding for the protein. The
attribute "Structure" is a pointer to the three-dimensional structure of the
protein coded by that gene, if known. The attribute "Model" is a pointer to a
database in which functional models of the protein coded by that gene are
stored. Although reference has been made to protein-related attributes, any
information regarding biological entities is within the scope of the present
invention.
Binary data structure ("BDS") 19 is formed as a composition of
more than one EDS. As more specifically illustrated in FIG. 4, BDS 19
comprises separate EDS's with arcs denoting the transitions between these
EDS'S. In this example, EDS 1 represents the elementary data structure
corresponding to state 1 of the binary relationship, EDS 2 represents an
elementary data structure corresponding to state 2, and EDS 3 and EDS 4 are
CA 02399272 2002-08-02
WO 01/57775 PCT/USO1/01988
- 16-
elementary data structures determining the forward and backward transition
rates, respectively, of the reaction between state 1 and state 2. This binary
representation is also known as a state transition diagram. Thus BDS's are the
first level data structures at which information on the topology and kinetics
of
biological reaction networks are represented. BDS's are generated from
knowledge of biophysical and biochemical pathways within intra and
intercellular systems. They may be derived from interrogation of existing
biological databases, or may be generated using graphical user interface 23
from proprietary experimental data.
The binary relationship illustrated in FIG. 4 has many analogues
in biological systems. For example, the binary relationship rnay represent
transitions between two intermediates within the complex biochemical
network shown in FIG 2. In this instance, EDS 1 could represent pyruvate (a
variable), EDS 2 could represent Acetyl-CoA (a variable), EDS 3 could
represent the catalytic enzyme pyruvate dehydrogenase (a protein), and EDS 4
could represent the substrate NAD (a variable). Alternatively, the binary data
structure could represent a simple two-state closed-open model of a cardiac
ion channel, thus modeling a biophysical process as shown in FIG. 5. In this
instance, EDS 1 corresponds the closed state of an ion channel (a variable),
EDS 2 corresponds to the open state of the ion channel (a variable), and EDS
3 and 4 would be identical and equal to membrane potential V (variables).
The functional dependence of the transition rate constants K 12 and K21 on
quantities such as temperature, pH, membrane potential, and in general
variables andlor proteins as defined previously, on membrane potential may or
may not be specified, but the fact that a dependence exists would be. As
another example, a binary representation of a gene regulatory network is
shown in FIG. 6. Here, EDS I represents an RNA polymerase (protein), EDS 2
represents a closed RNA polymerase complex (variable), and EDS 3
represents a promoter (protein).
~ BDS 19 is also associated with a number of attribute lists. For
example, the BDS in FIG. 4 may be represented by the list
Input:0utput:Frate:Brate wherein the attribute "Input" is associated with EDS
CA 02399272 2002-08-02
WO 01/57775 PCT/USO1/01988
- 17-
l, the attribute "Output" is assoc,_'ated with EDS 2, the attr,_'bute "Frate"
is
associated with EDS 3 and describes the forward transition rate, and the
attribute "Brate" is associated with EDS 4 and describes the backward
transition rate. As with the EDS'S, a graphical user interface 23, or an
interface into existing biological databases 11, would be used to generate the
linked attribute lists.
BDS 19 retains the attributes of each EDS which it comprises.
The linked attribute lists defining BSD 19 would incorporate multiple
attributes reflective of the group of attributes associated with each EDS.
Therefore, a BSD may have distinct attributes of the Organism:Cell:
Gene:State:Sequence:Structure:Location:Model attribute list discussed
previously, but would not contain the single "Gene", "Sequence" or
"Structure" attribute each is associated with a single EDS.
. Pathway data structure ("PDS") 20 represents the highest level
of data structure and is generated as the composition of snore than one BDS.
An example of a PDS is the pyruvate dehydrogenase reaction depicted in FIG.
2. As illustrated in FIGS. 9a, 9b and 9c, another example of a PDS would be
detailed information pertaining to protein expression in three phases of a
cell's existence: naive (quiescent), activated, and inhibited (for the naive
or
activated state). As another example, a PDS may comprise information
regarding T-cell differentiation as is shown in FIG. 10. Thus, PDS 20
represents a more complex state transition diagram which retains the
attributes of the EDS's and BDS's present in the pathway.
PDS 20 is also associated with a number of attribute lists.
Because PDS 20 retains the attributes of its constituents, the attribute Iist
Organism:Cell:-Gene:State:-Sequence:Structure:Location:Model described
above may be applied to PDS 20. The modeling tools used to organize the
databases and generate the EDS'S, BDS's and their associated data may be
used to generate the PDS'S.
In accordance with the present invention, any biochemical
reaction and physiological process can be arranged into an EDS, BDS and
PDS and its associated attribute list. Typically, the data associated with the
CA 02399272 2002-08-02
WO 01/57775 PCT/USO1/01988
- 18-
data structures is generated by a user either prior to or at the time of model
construction, or may comprise an attribute list from database 11 which is
edited by the user. Advantageously, models are configured so that a user can
interact with graphical user interface 23 to retrieve, view and edit any of
the
data associated with or generated by the data structures and their associated
attribute lists to thereby create revised data structures and attribute lists.
The
structure of the attribute lists also permit a user to analyze multiple data
structures to determine common and unique properties. With this
information, a user can link attributes from more than one data structure to
analyze common information or create detailed models of subcellular and
cellular processes as well as of complex biological systems (e.g., organs).
Data structure 17 may also comprise at least one anatomical data
structure describing the physical organization and structure of biological
cells, tissues and organs. These data structures may be in the form of sets of
three-dimensional image data from structural database as previously
discussed.
Like the other data structures, the three-dimensional image data
and the structural finite element cell models have specific attributes.
Typically, these attributes are in the form Organsim:CelI:Organelle:
Modality:lmageFormat, wherein the attributes "Organism" and "Cell" are as
discussed above. "Organelle" is a pointer to that part of the anatomical
database defining structure, "Modality" defines the type of anatomical data
(such as a model derived from the three-dimensional image data or the three-
dimensional image data itself), and "ImageFormat" defines the structure of the
anatomical data. Optionally, the attribute "Organ" would be included.
As more specifically illustrated in FIG. 7, three-dimensional
image data from structural database is defined by attribute lists 44. This
three-dimensional image data may be further transformed by geometry
modeling engine 42 into structural finite-element model 43 describing cell,
tissue and organ shape and spatial placement of organelles and/or cells
therewithin. which may be used to create additional list 45. Well known and
readily available geometry modeling engines useful in the construction of
CA 02399272 2002-08-02
WO 01/57775 PCT/USO1/01988
- 19-
these structural models include EnSight (available from CEI, Inc., Researc_h_
Triangle Park, NC) and FIDAP (available from Fluent Inc., Lebanon, NH).
Each of the three-dimensional image data or the finite element models may be
stored in the system for later use or generated as necessary. During the
creation of a subsequent model, a user would have access to any of the three-
dimensional image data from structural database 15, structural finite-element
cell model 43, or attribute list 44 or 45. As such, the anatomical data
structure may be specifically tailored to subsequent model use.
Preferably, the EDS, BDS and PDS's may be updated via a
database interface, such as the i-Base interface proprietary to Physiome
Sciences. Most preferably, a user can use the database interface to pose
specific queries regarding biological processes to the system, analyze
experimental data and hypothesize against known EDS's, BDS's and PDS's.
Computational/Eduation Generation Engines
Generally stated, computational engines transform the data
structures into mathematical models of biochemical, physiological and
structural subcellular, cellular, tissue and organ processes. Advantageously,
the interconnection topology specified in each data structure permits the
computational engine to automatically generate these biological models by
applying the laws of mass action.
Computational engine 22 includes an equation generation engine
for generating symbolic models of biological processes as well as an engine
for generating computational models of dynamic biological behavior based
upon the symbolic models. The equation generation engine 24 automatically
transforms each data structure into at least one system of equations
describing
a specific biologic process. This system of equations is referred to as a
symbolic model. These symbolic models may be stored in the system for later
use in modeling the same biologic process, or alternatively, the models may
be coupled with other symbolic models generated by the system to model
different biologic processes. As discussed in more detail below, any number
of symbolic models may be coupled together to produce models of complex
CA 02399272 2002-08-02
WO 01/57775 PCT/USO1/01988
-20-
subcellular, cellular, tissue or organ process. In this way, complex models
which iink functional behavior to subcellular and cellular, as well as system
processes may be derived. Equation generation engines 24 such as those
which are a part of commercially available software tools such as
Mathematica and Maple are well suited to the practice of the present
invention.
Computational engine 22 generates a computational model
reflective of the biological process defined by the symbolic model. A
computational model refers to a software procedure for numerical simulation
of the behavior of the symbolic model.
As previously noted, computational models are software
procedures for numerical simulation of the behavior of the symbolic model.
Typically, the tools used to generate numerical simulations include those
available from IMSL (International Mathematical and Statistical Library);
NAG (Numerical Algorithm Group); and MATLAB (Mathematical
Laboratory); and Visual Numerics and the like.
Optionally, the symbolic models may also be translated into
computer code such as Fortran and C++ by conventional means readily
available in the prior art. Advantageously, typeset equations expressed in
markup languages such as TeX, LaTeX or HTML can be automatically
derived from the symbolic models, thereby tremendously simplifying the
process of model documentation. Moreover, critical components of
computational models, for example, Jacobian matrices that are used by certain
numerical integration algorithms can be derived in an automated fashion from
the symbolic models.
As previously indicated, equation generation engine ~4
automatically generates symbolic models in the form of coupled systems of
differential equations from the information contained in the data structures.
The models so generated will retain the attributes of every component of the
data structures used to generate the model. For example, the attributes
Organism:Cell:State:Location:ModelType would contain the attributes
"Organism", "Cell", "State", and "Location" as previously discussed, with the
CA 02399272 2002-08-02
WO 01/57775 PCT/USO1/01988
-21
equation that is simpler than the original component model (a lumped model).
Once the form of the reduced model is selected, parameters of the new model
component are adjusted to fit the behavior of the original model component
over the range of interest to the user, using regression techniques available
in
software products such as MATLAB (Mathworks, Nattick, MA), IDL
(Research Systems, Boulder, CO) and PV-WAVE (Visual Numerics, Inc.,
Houston, TX) and in numerical libraries from NAG, Ltd. (Numerical
Algorithm Group), Visual Numerics and the like. These packages can also be
configured to provide statistical goodness-of fit estimates that can be used
to
determine the statistical significance of the resulting simulations. The
fitted
correlation function or lumped model component is then used in the place of
the original when performing computational simulations. When the form of
the simplified model is different than that of the original model, a hybrid
solver must be used. For example, correlation functions often introduce
algebraic constraints to systems of differential equations.
Software systems that simultaneously determine the form of the
simplified model and regress the parameters of the model to the original may
also be used. These systems often make use of pattern recognition and
machine learning algorithms to achieve a high quality approximation with a
simplified model. An example is the HDMR (High-Dimensional Model
Representation) system of Shorter, Ip and Rabitz.
Alternatively, practical differential equation solver packages use
adaptive methods that switch automatically between explicit and implicit time
stepping methods, providing marked speed improvements particularly useful
for models which exhibit stiff behavior at least at one point in a simulation.
Examples of software with adaptive solvers include the ODEPACK family of
solvers from the Lawrence Livermore National Laboratory and .DASSPK
family of solvers by Linda Petzold of the University of Minnesota. These
solvers have the ability to handle mixed continuous-discrete time and
differential-algebraic systems. They also can take advantage of the natural
sparsely of the system of equations, providing even larger performance gains.
CA 02399272 2002-08-02
WO 01/57775 PCT/USO1/01988
-22
When the model consists of a system of partial differential
equations (PDE), or coupled differential algebraic systems, parallel
algorithms are useful to solve the problems. These multiple-processor codes
use industry standard libraries to control algorithm and data flow. Examples
of these libraries are the Message Passing Interface (MPI) and the Parallel
Virtual Machine (PVM). Both allow a single simulation application to run on
heterogeneous machines, and allow each process to work on different tasks.
In this way, a heterogeneous problem can run simultaneously on a network
consisting of one or more personal computers, workstations and
supercomputers.
Thus, in one embodiment of the present invention the symbolic
and computational models define the time rate of change of the concentration
of reaction intermediates, or of other state variables that effect
subcellular,
cellular or higher order processes. Consider, for example, the biochemical
pathway shown in FIG. 8. Let A, B, C, and D represent elementary data
structures defining the pathway wherein "i" or "j" are generic representations
for the various states such as A, B, C, or D (K;~, KAB or K~A or ... ), and
K;~
represents the transition rate between states i and j that are defined by the
various Frate and Brate pointers. Applying the laws of mass action will yield
the following system of ordinary differential equations describing the
dynamics of this system.
dA/dt = -A(KA$ + KAY) + BKBA + CK~A
dB/dt = AKAB - B(KBA+KB~+KBp) + CK~B + DKDB
dC/dt = AKA + BKB~ - C(K~A+K~B)
dD/dt = BKBD - DK~B
Since these equations are completely defined by knowledge of
the connectivity of the network, and knowledge of the various transition rate
constants, and since these quantities are all stored in the databases, the
equations may be generated automatically on computer. They may also be
CA 02399272 2002-08-02
WO 01/57775 PCT/USO1/01988
-23
integrated in time, or be analyzed using the numerical methods described
herein.
As another illustration, consider the hierarchy of cellular
metabolism which originates from the level of the gene. A qualitative
representation of the actions of genes and their activation or inhibition
would
be represented, through the standard notation for chemical reactions, as:
A+G, ~ (A+G,)~ ' '
Or:
I+G, ~(I+G,)'
Subsequently, the synthesis of a protein can be represented as:
(A + G,)+ + Amino acids ~ P,
20
This representation bypasses the process of transcription involving mRNA
synthesis, since the product of gene activation or inhibition is finally a
protein. For proteins, that are enzymes, an enzymatic reaction is represented
as:
M, + E , + cofactor ~ MZ + E,
The presence or absence. of an inhibitor of the enzyme could also be
represented by:
E, + I ~ (E, + I)'
Where, (E, + I)', is the enzyme-inhibitor complex.
This zero order qualitative model can be used to develop more
complex structured models. For example, the most detailed BRN model
possible is a description of the temporal variance of every species within the
cell. A quantity within a cell, M;, can be involved in several processes that
contribute to its net formation and consumption. These processes can be
transported across an organelle with the cytoplasm, synthesized or consumed
in a chemical reaction and transport across a cell membrane.
The basic mass balance for such a system can be represented by
the following mathematical relationship:
CA 02399272 2002-08-02
WO 01/57775 PCT/USO1/01988
-24
dm; _ ,
- ~S~V~ , Where, s;~ is the stoichiometr is coefficient
di
associated with each flux v~. Each flux v~, is some function of the metabolite
concentrations, i.e., v~,
This material balance under steady state conditions will reduce to the
algebraic relation: ~ sw~ = 0
i
Or, for all intermediates simultaneously at steady state, the individual
balance
equations can be rewritten in matrix form,
S~v=0
Where S is the stoichiometric matrix and v is the vector of metabolic fluxes.
This stoichiometric relationship can also be viewed as a connectivity
relationship that connects the intermediates through the fluxes that they are
involved in. The stoichiometric relationship can be used in identifying the
properties of a network of metabolic reactions. These properties include, the
identification of conserved quantities, and pathways of fundamental
importance in the connectivity of a network.
These models of intracellular reactions would be integrated into
systems models by the following mathematical representation:
d~' =~S~V~, describes the change of metabolites, within a
single cell.
If, x;, is used to represent whole cells, the change of cell
populations can be described as:
~' =r,.f -r;d , where r,.f , is the rate of formation of the cell
dt
species, x;, and r;d , is the rate of death of the cell species. Each rate is
a
complex function of metabolites and cells, i.e.,
r.r = r,.f ~x~ ~ mr )
=ji ~x~~m~)
CA 02399272 2002-08-02
WO 01/57775 PCT/USO1/01988
-25
Since the concentrations of metabolites, that are secreted or removed by
cells,
is influenced, by the concerted action of many cells, these metabolites are
represented by
a
dm; a
S~V~ x; ,
dt
where the influence of the metabolite concentration by the overall cell
population is factored into the equation describing the intracellular
reactions.
Thus a mathematically complete description of a system of cells can be
described as,
dx;
- rr _ r~
at
a
dt - ~ S~V~ a x;
.I
dm;i -
swl x;
dt
Where, m; , represents external metabolite concentrations, and m;', internal
metabolite concentrations.
Advantageously, the macroscopic characteristics of a cell population and a
single cell description are completely described in such a mathematical
formalism.
The models generated by the system may be further transformed
into textual or graphical representations by use of graphical user interface
23.
Optionally, the models may also be analyzed using techniques
from nonlinear systems theory. For example, public domain tools such as
AUTO and XPP, accessible from the Internet can be used to perform analyses
of the parameter dependence and asymptotic behaviors of biological models.
This permits the calculation of qualitative behaviors of complex models as
key model parameters are changed.
CA 02399272 2002-08-02
WO 01/57775 PCT/USO1/01988
-26
Graphical User Interface
Graphical user interface 23 provides a user with input to and
output from information in the system. More specifically, graphical user
interface 23 may be used to ( 1 ) draw genetic and biochemical pathway
diagrams, and to enter functions specifying rate constants in these reaction
pathways, for storage in database 11 or for symbolic and computational
modeling; (2) interconnect EDS, BDS, and PDS data structures in order to
compose hierarchical models of biological systems; (3) construct and
manipulate biophysical and structural models; (4) display and interact with
previously developed genetic, biochemical, biophysical, and structural
models; and (5) control formulation and solution of computational and
symbolic models, and to view simulation output.
Graphical user interface 23 can be customized for a particular
application. Typically, interface elements such as video monitors,
touchscreens, keyboards, a mouse, printers and the like may be used.
Creation of a Model
In accordance with the present invention, a model may be
created to study any type of subcellular, cellular, tissue or organ
information
as, for example, the function of a gene, a specific biological process, the
behavior of a target protein in the presence of a particular drug, or system
functions in response to certain therapies. Based on the problem to be solved,
the user will select the information from the database that will serve as the
building blocks for developing the model. For example, a user may wish to
predict the quantity of certain intermediates in the pyruvate dehydrogenate
reaction in a specific cell type both in health and disease. In this instance,
a
model would be generated based upon the structural elements of the cell
together with the biochemical and biophysical processes and their associated
interconnection topologies.
These models can be displayed on the display monitor. In
general, the user will be presented with a palette of icons that can be
browsed,
where each icon represents some binary or pathway data structure, such as a
CA 02399272 2002-08-02
WO 01/57775 PCT/USO1/01988
-27
biochemical or biophysical mechanism previously defined and stored in the
system. The user would interact with this graphical display by use of a
mouse. The user can add these components to the structural model by
selecting icons and dragging them to the point of insertion in the model.
The user may view information regarding the biochemical/
biophysical mechanism inserted into the model by clicking on the
representation of that mechanism. For example, clicking on the icon for the
pyruvate dehydrogenase reaction will trigger a display of the pathway
illustrated in FIG. 2 on the display monitor. The user can then query the
system for information associated with the intermediates of these reactions.
Clicking one for example, pyruvate dehydrogenase will initiate a pop-up
display of all of.the attributes describing pyruvate dehydrogenase that may be
examined. The user will select from one of these attributes. Advantageously,
the linked attribute list will cause the system to initiate a query and
display of
information to the appropriate database, for example, a display of the gene
sequence of pyruvate dehydrogenase. All of the elements of the attribute list
associated with pyruvate dehydrogenase could be displayed in this manner.
Thus, the simple act of clicking on pyruvate dehydrogenase retrieves for the
user all information on pyruvate dehydrogenase stored in the system and
makes it available to facilitate modeling. This configuration permits a user
to
interact with graphical user interface 23 to retrieve any of the information
associated with or generated by the system. In this way, the user is presented
with a complete representation of specific biological processes.
If desired, the user can invoke an equation generation engine to
generate a symbolic set of coupled differential equations defining the model.
These equations could be saved as part of a documentation of the model
and/or they may be input into translators that would map them into computer
instructions in the desired programming language. This source code can then
be linked with a computational engine to produce executable code for
modeling the cell. Preferably, this executable code may be stored in the
system for future use.
CA 02399272 2002-08-02
WO 01/57775 PCT/USO1/01988
-28
In another example, the user may wish to model intracellular
protein in trafficking which occurs following ligand:receptor interactions
which occur in signaling processes that allow molecules to move from the
plasma membrane, or the cytosol, to the nucleus. For example, in T-cell
signaling, the T-cell receptor binds a ligand (MHC and antigen) to initiate a
signaling cascade that progresses through the cytosol and culminates in both
new protein synthesis and in active inhibition of gene activity. Creation of a
single-cell model in accordance with the present invention will allow a user
to
follow protein signaling events, and in this way, define possible genes) and
gene modulation activity of the protein in question.
Moreover, while the intracellular representation of molecules
(and their functional moieties) are in some cases unique to one cell type
(i.e.,
the expression of the CD4 molecule is restricted to CD4 T-cells), this is not
true for many intracellular molecules. Accordingly, the results of a single
intracellular model may apply to a number of other cells in an organism.
Thus, the protein signaling system described above may have broader
implications in cellular signaling in other cells of the organism. For
instance, a CD4 T-cell secretes IL-4, Il-5 which are cytokines that affect the
performance of the B-cell, which is another component of the immune organ
system. The T-cell also has specific molecules, e.g. CD40 ligand which binds
to a CD-40 receptor on a macrophage. Thus there are processes from a T-cell
that affect other cell types within the organ. The cell models can therefore
be
combined by linking the BRNs in the T-cell that form IL-4 to the BRNs that
IL-4 affects in the B-cells, and by the BRNs that form CD40 ligand to the
BRNs affected by the CD40 ligand-receptor compex in the macrophage.
These linked models' constitute a model of an organ system, which is
applicable to various clinical and pharmaceutical purposes. Drug development
focuses on targeting specific reactions and molecules in a cell. Since the
organ model is built from several cell models that are built from several
BRNs, a single step or a number of single steps can be removed or changed in
the model to mimic the effect of a drug. So one or a few steps in synthesis of
IL-4 in the T-cell can be targeted in the model simulator and its
CA 02399272 2002-08-02
WO 01/57775 PCT/USO1/01988
-29
characteristics can be changed. The overall results on the organ function can
be measured by tracking the effect of these changes on the function of all the
cells and tissue types and the overall organ function. Specifically, the
effect
on the B-cell function and the effect on macrophage function can be tracked.
The ability to respond to an infection can also be tracked, which is a feature
of organ function. In a clinical trial, the changes to Il-4 production can be
changed to look at the organ function change. In clinical diagnosis, in a
disease such as rheumatoid arthritis, a patient's characteristics can be input
into the model and then measured against a normal person's model, to obtain
the specific abnormalities at the cell level for that patient.
Validation of Models
The models generated in accordance with the present invention
are validated against information gleaned from clinical data, expert opinion,
or a combination thereof. Where disagreement between the model and known
data exist, the model is corrected iteratively until a correlation is found.
After
the model is created, the system compares the solution of equations to
experimental data, measuring goodness-of fit of the model. A user can
interactively adjust any of the attributes associated with the model to create
a
new hierarchical description which approximates user selected properties of
the experimental data. In this instance, a system identification engine can be
invoked to adjust the parameters of the equations defining the model to create
a new system of equations, the solution of which approximates user selected
properties of the experimental data. The system identification engine includes
routines for optimally updating the parameters of a model, taking into account
measurement and model uncertainty. Example algorithms include I~alman
Filters and batch least-square filters. The system identification engine can
also include algorithms for estimating the quality of the fit of the model to
the
experimental data. Complete systems for doing system identification are
available as add-on packages to Matlab (Mathworks, Nattick, MA), and
integrated in the Scilab data analysis system (INRIA, France).
CA 02399272 2002-08-02
WO 01/57775 PCT/USO1/01988
-30
Linking Models
Several models may be linked together. For example, a number
of different biochemical or biophysical mechanisms may be inserted into a
single structural model. In this instance, several models would be merged
into a single model by an interface which would effectuate the flow of
information between the respective models. For example, the outputs or
intermediates in a biochemical reaction network describing a PDS such as
described in FIG. 2, may act directly or indirectly to modulate the function
of
another process such as the BDS representing an ion channel model of FIG. 5.
A specific case may be the output variable of adenosine triphosphate (ATP) of
glycolytic biochemical reaction networks and its modulating action of ATP-
sensitive membrane potassium channels.
Single cell models may be integrated with organ models. For
example, intracellular models of cell states for normal and diseased states
can
be generated in order to allow cell types, and mediators of cellular function
to
be modulated and analyzed in a specific disease state. Such information can
be used to identify specific points of disease progression best suited for
therapeutic intervention.
By way of illustration, inherent in an immune cell/organ
integrated model are network regulation dynamics, some of which are
universal (i.e., mass-balance and metabolism) and some of which are unique
to the immune system (i.e., differentiation). Single cell models that could be
generated in this instance include macrophages, dendritic cells, naive T-cells
(CD4, CD8), effect on and memory T-cells, B-cells, plasma cells, mast cells
and basophils. These models could be integrated into an organ model in order
to provide a more complex representation of a biological system.
As another example, a model for therapeutic intervention of
rheumatoid arthritis could be developed based on animal models of arthritis
induced with antigens or infectious agents. In these models, disease severity
correlates with a dominant Thl-type cell response characterized by a higher
ratio of IFN-y to IL-4. It is known that Th2 cytokine therapy (e.g., infusion
of IL-4) may suppress disease symptomatology. It is also known that IL-1,
CA 02399272 2002-08-02
WO 01/57775 PCT/USO1/01988
-31
IL-6 and TNF-« are secreted in very high levels , in arthritic joints and
therapies directed to these mediators may be effective. In this instance, an
intracellular model of the TNF-« could be generated in health and in various
states of disease progression. Against these single cells models, anti-TNF-«
reagents may be screened in order to ascertain suitable points for therapeutic
intervention. FIG. 11 illustrates the information obtained from these
modulators that may be used in the creation of a model of TI~1 cell
differentiation in rheumatoid arthritis.
As still another example, consider asthma, a complex
inflammatory disease with many cell types and cytokines participating in the
generation of late-phase inflammation. Prior to the present invention, an
understanding of which all types are important sources of these cytokines was
limited due to the inability to directly compare the relative contribution of
individual cell populations. It was known, however, that Th2 responses which
contribute to airway eosinophia, mucus production and IgE synthesis are key
features of asthma. Intracellular modulation of transcription factor GATA-3,
which regulates the expression of cytokines IL-4, IL-5 and IL-13, which are
secreted by Th2 cells, but not Thl cells, at various stages of disease
progression could be studied in order to develop GATA-3 as a potential
therapeutic target in the treatment of asthma. The information obtained from
these models can be incorporated into a multicellular model of Thl/Th2 cells
to ascertain the effect of cytokine expression on skewing Thl/Th2 balance
towards a Th2-type cell and the rate of GATA=3 in this system. As is
illustrated in FIGS. 12a and 12b, a much greater level of cytokine production
is present in T-cell differention to Th2-tpye cells rather than to Thl-type
cells.
CA 02399272 2002-08-02
WO 01/57775 PCT/USO1/01988
-32
Display of Model Results
Output data from each simulation, as well as the .underlying
data, may be displayed on the graphical user interface. Output data may
include gene data (i.e., recruitment, activator and expression), in expression
data (i.e., activator and expression), protein modulation data (i.e.,
phosphorylation, glycosylation, association, etc...) cell turnover rates
(i.e.,
recruitment, proliferation, differentiation, death), protein accumulation,
calcium fluxes, cell trafficking rates, uniquely defined parameters of
clinical
relevance to track pathophysiology and the like. FIG. 13 provides an
example of a descriptive report generated in response to a specific modeling
query. FIG. 14 provides an illustrative graphical model output for the
dynamic change in concentrations or levels in a T-cell that is characteristic
of
the behavior of that cell, and is characteristic of the signaling within the T-
cell. A user can modify the data from each simulation as well as the
underlying information which the data represents. The user may also
customize the physical appearance of the graphics or textual appearance of the
output data. By way of illustration, the user can double-click on a
compartment of the model, and would be presented with a list of variables
used. The user could select a variable and display that variable on a graph
drawn in a separate window. Optionally, the user could modify the
underlying variable and generate a new model. Alternatively, the user could
select "global" variables, that is, those state variables defined everywhere
within a model and display the global variable using a color coding scheme
over the entire model domain.
Model Uses
The model can be used to store and search all existing biological
information (i.e., genetic, biochemical, biophysical and anatomical) on a
given biological process at the subcellular, cellular or multicellular level.
As
such, the model may be used to integrate knowledge across all biological
systems.
CA 02399272 2002-08-02
WO 01/57775 PCT/USO1/01988
-33
The model thus provides a means for collecting and synthesizing
biological information into a format by which function within a biological
system may be analyzed. For example, the function of a particular gene could
be ascertained by invoking the model to determine the sequence of the gene of
interest and identify homologous genes and BRN's in which the homologous
gene participates. Based on the BRN'S, the dynamic behavior of the
homologous genes could be modeled, providing quantitative insight into the
possible functional role of the gene of interest. Thus, the model could
provide not only homology searches based on linear sequence analysis, but
also functional search capabilities based on the similarity of the BRN's in
which a gene participates.
In addition, the model may be used in drug discovery, as for
example, to analyze the behavior of molecular targets in the presence of a
particular drug. Computational models of drug/gene action would be
generated and incorporated into models of physiological function in
accordance with the present invention. These mufti-dimensional models could
then be used to screen candidate compounds.
Computer S~rstem
The present invention may be implemented on any computer
architecture in any configuration such as mufti-tiered or clustered services
or
a client-server paradigm. Certainly, the type of computer system will depend
on the complexity of the models) and the choice of an appropriate system is
readily available to a skilled artisan. Typically, the components of such a
computer system would include a central processing unit, RAM, ROM, I/O
Adapter, data storage space, a graphical user interface having a keyboard,
mouse and speakers attached thereto as well as an operating system and
software capable of providing Internet connectivity.
The following examples are presented to provide a more
complete understanding of the invention. The specific techniques, conditions,
materials, proportions and reported data set forth to illustrate the
principles
CA 02399272 2002-08-02
WO 01/57775 PCT/USO1/01988
-34
and practice of the invention are exemplary and should not be construed as
limiting the scope of the invention.
Example 1
This is an example of a "CelIML" description of the basic
FitzHugh-Nagumo model generated in accordance with the present invention.
(CelIML is a subset of XML that is used to describe a cell model or a series
of
cell models.) For purposes of this model it is treated as an ion current. This
model contains two differential equations:
du/(dt = (u - u~3/1 - v) / a and dv/dt = eu * (u + b - gv)
Where b, g, and a are treated as constants.
<CELLMODEL>
<VEPBOSENAME>Simple Example of a cell model with a single FitzHugh-
Nagumo element</VERBOSENAME>
<NAME>FitzHugh-Nagumo Cell</NAME>
A <DRAW> tag is used by the program to describe how the object is
represented visually in the cell model.-->
<Draw>
<DRAWSIZE>8000,8000</DRAWSIZE>
<POSITION> 1000,1000</POSITION>
<BACKCOLOR>65280</BACKCOLOR>
<EDGECOLOR>255</EDGECOLOR>
<DRAW>
The ENVIRONMENT tag is used to define all of the components (chemical
species, variables, etc.) within the scope of an element.-->
CA 02399272 2002-08-02
WO 01/57775 PCT/USO1/01988
-35
<ENVIRONMENT>
CONSTANT tags are used to contain information about the value of
parameters used in this model.
<CONSTANT>
<NAME>b<NAME>
<VALUE> 1.0</VALUE>
<CONSTANT>
<CONSTANT>
<NAME>e</NAME>
<VALUE>0.04<VALUE>
</CONSTANT>
<CONSTANT>
<NAME>g</NAME>
<VALUE>0.5</VALUE>
</CONSTANT>
VARIABLE tags are similar to CONSTANT tags except that the values can
change during the execution of the model. The values given here represent
the initial value for the variable.
<VARIABLE>
<NAME>t</NAME>
<VALUE>0.0</VALUE>
<VARIABLE>
<VARIABLE>
CA 02399272 2002-08-02
WO 01/57775 PCT/USO1/01988
-36
<NAME>u<NAME>
<VALUE>0.0</VALUE>
</VARIABLE>
<VARIABLE>
<NAME>v</NAME>
<VALUE>0.0</VALUE>
</VARIABLE>
</ENVIRONMENT>
IONCURRENT is use to contain the actual model.
<IONC URRENT>
<NAME>Ifn</NAME>
<VERBOSENAME>FitzHugh Nagumo Current<IVERBOSENAME>
<DRAW>
<DRAWSIZE> 1000,1000</DRAWSIZE>
<POSITION>6000,6000</pOSITION>
<BACKCOLOR>32639</BACKCOLOR>
<EDGECOLOR>8323199</EDGECOLOR>
<DRAW>
The equation for du/dt. The <DERIVATIVE> tag is used to indicate that this
needs to be processed as a differential equation.
<DERIVATIVE>
<reln>
<eq/>
<applY>
CA 02399272 2002-08-02
WO 01/57775 PCT/USO1/01988
-37
<diff/>
<ci>u</ci>
<bvar>
<ci>t</ci>
</bvar>
</applv>
</applY>
<divide/>
<mfence>
<apply>
<minus/>
<aPPIY>
<minus/>
<ci>u</ci>
<apply>
<divide/>
<apPlY>
<power/>
<ci>u</ci>
<cn>3 </cn>
</applY>
<cn>3 </cn>
</applY>
</apply>
<ci>v</ci>
</applY>
</mfence>
<ci>e</ci>
</apply>
</reln>
</DERIVATIVE>
CA 02399272 2002-08-02
WO 01/57775 PCT/USO1/01988
-38
The equation for dv/dt.
<DERIVATIVE>
<reln>
<eq/>
<apply>
<diff/>
<ci>v</ci>
<bvar>
<ci>t</ci>
</bvar>
</apply>
<applY>
<times/>
<ci>e</ci>
<mfence>
<apPlY>
<minus/>
<apply>
<plus/>
<ci>u<lci>
<ci>b</ci>
</applv>
<apply>
<times/>
<ci>g</ci>
<ci>v</ci>
</applY>
</applv>
</mfence>
CA 02399272 2002-08-02
WO 01/57775 PCT/USO1/01988
-39
</applY>
</reln>
</DERIVATIVE>
</IONCURRENT>
</CELLMODEL>
Example 2
This example describes the CelIML tags used by the present
invention to represent a cell model.
CelIML uses MathML to model the actual equations that it
references.
The tags in CelIML are designed to be hierarchical in nature;
that is a given tag is generally used to describe the properties of its
parent.
For example, a <SIZE> tag can be used to indicate the size of a
<CELLMODEL>. When the CelIML code is read by the present invention, a
series of "objects" (i.e. Class objects in C++ or Java parlance) is created
that
has close to a one-to-one correspondence with the original source code.
CeIIML tags are broken down into several distinct classes, based
on their purpose:
~ Basic Elements are tags that are used to describe a general
property such as the name of an object or its size. These are
the lowest level elements and can be used by several different
kinds of tags.
~ General Cell Model Elements are used to represent the
general properties of a cell and the biochemical processes that
are being modeled.
~ Specific Cell Model Elements are similar to "General Cell
Model Elements" except that they are used to represent a
higher level of abstraction.
CA 02399272 2002-08-02
WO 01/57775 PCT/USO1/01988
-40
~ Druivi~zg Elements are used to supply information on how a
Cell Model is to be displayed visually, and how it interacts
with the GUI.
The contents of each CelIML document will obey a set of grammar rules
defined in the CelIML Document Type Definition (DTD).
TYPE TAG DESCRIPTION SUB-TAG
Basic NAME The short name of an ---
object
ElementsVERBOSENAME A longer name for the ---
object
VALUE Tag used to store a ---
single
numeric value
CONSTANT Used to define a fixed NAME
parameter VALUE
UNITS
VARIABLE Used to represent a NAME VAULE
single state
variable. This containsUNITS
both a
value at the current HISTORY
point in time,
and at the initial condition.
UNITS The units for a VALUE ---
(e.g.,
[mm], [g/mol], etc.)
EQUATION Used to contain a singleRELN
MathML equation (MathML code)
POSITION The physical position ---
of an
object in its parent
object. Can
be used to define 3D
(x,y,z),
2D (x,y) or I D (x)
position.
SIZE The physical size of ---
an object.
Can lie 3D, 2D, or ID.
DBLINK Database Linkage. Used ---
to
hold a pointer to information
on an element in a database.
General MODEL The highest level object,CELLMODEL
Cell consisting of one or
more
Model CELLMODELS.
ElementsCELLMODEL A single unit in a model.PATHWAY
This
tag may contain informationREACTION
about its location relativeCOMPONENT
to
other CELLMODELS. IONCURRENT
REFERENCE
PATHWAY Tag that describes a REACTION
set of
reactions, for example
where:
Reactant t- -~ Product
in
CA 02399272 2002-08-02
WO 01/57775 PCT/USO1/01988
-41
TYPE TAG DESCRIPTION SUB-TAG
multiple steps. (PDS)
REACTION Describes a single elementaryCOMPONENT
reaction. KF
Reactants E- -~ ProductsKR
with
Forward and Reverse
kinetics.
(BDS)
ENVIRONMENT Encapsulates all of COMPONENT
the
components and propertiesCONSTANT
of a
CelIModel.
COMPONENT Representation of a VARIABLE
single
chemical species. This DBLINK
tag can
contain information
on
concentration, formula,
and
structure. (EDS)
HISTORY The value of a "property"---
(e.g.,
COMPONENT, VARIABLE)
as a function of time.
KF Forward Reaction kineticsCOMPONENT
for
single REACTION. EQUATION
KR Reverse Reaction kineticsCOMPONENT
for
single REACTION. EQUATION
INTEGRATE Used to store information---
about the type of integration
to
be run. Contains starting
and
stopping time, time
step, and
type of integrator to
be used.
PROTOCOL Description of a time VARIABLE
based
protocol applied to
a Cell
Model.
REFERENCE A bibliographic tag ---
used to
describe where this
model
came from. This will
ultimately contain several
sub-
tags for elements such
as
"<author>", "<volume>",
"<date>", etc.
SpecificIONCURRENT Used to represent an GATE
ion
Cell current. COMPONENT
Model GATE A Hodgking-Huxley type EQUATION
gate
Elements element.
PROTEIN Descriptions of a gene ---
product.
DRUG Description of drug ---
effect on
elementary, binary or
pathway
data structures or protein
or
variable.
CA 02399272 2002-08-02
WO 01/57775 PCT/USO1/01988
-42
TYPE TAG DESCRIPTION SUB-TAG
Drawing DRAW Tag encapsulating informationSIZE
Elements needed to draw an objectppSITION
in a
window. FOR ECOLOR
BACKCOLOR
EDGECOLOR
LOGCOORD Tag containing information---
on
transforming from physical
to
logical coordinate system.
This can also control
the
rendering of a 3D object
on a
2D screen.
FORECOLOR The foreground color ---
of an
object.
BACKCOLOR The background color ---
of an
object.
EDGECOLOR The color of an object's---
edge.
POSITION The position of an element---
in
logical drawing space.
DRAWSIZE The size of an element ---
in
logieai drawing space.
Example 3
Component Description
Class Library The C++ class objects that are used to
create a cell model
and simulation, and describe its mathematics
and
chemistry.
CeIIML DefinitionA definition of the mark-up language used
/ to describe the
DTD models of the present invention.
This involves developing the set of tags
to use with
CelIML and putting together a DTD to formalize
the
syntax and allow models to be validated
by browsers.
Parser The Parser is used to generate "run-time
objects" of the
cell components based on an XML input file
and the
system class library data.
This consists of two components:
(I) The raw XML parser that reads the input
fifes and
generates the hierarchical tag and text
nodes.
(2) The "object constructor" which creates
and initializes
objects based on the XML content.
Class Converter Conversion of XML tags to leaner MathML
class objects.
Computation EnginesSystems that are used to integrate cell
model over time
and evaluate reactions.
CA 02399272 2002-08-02
WO 01/57775 PCT/USO1/01988
-43
Component Description
Component Editor A form-based GUI that is used to create
and initialize the
set of chemical components within an "environment"
of a
cell model.
Reaction Editor A form-based GUI used to graphically create
a chemical
reaction or pathway.
Equation Editor Used to allow mathematical equations to
be entered into
modes in an algebraic format (as opposed
to the native
MathML format).
Database Linkage Used to connect the system of the present
invention.to
external database system containing information
on cell
components.
Visual Editor Allows the user to graphically edit a cell
model using
features such as drag-and-drop and in-lace
activation.
Data Plotting SystemA generic 2D and possible 3D plotting system.
This is a
full-featured system giving complete control
over the
layout, scaling, and visual format of a
plot.
Dynamic Form SystemThis system is used to create a dialog
form from an XML
input file or a system model object. This
allows cell
models to be edited and manipulated in
a very flexible
way.
Object SerializationUsed to read and write (serialize) object-based
cell
models in a binary format. This is required
to enable
releasing proprietary cell models.
Output Engines The output engines are used to take an
object based cell
model and generate text output in several
different
formats. Formats being considered include:
(1) XML output file
(2) Fortran and/or C equations defining
the cell model
behavior
(3) Some form of visual presentation of
the mathematical
equations (HTML/MathML, TeX, rich-text).
Java /Web Model A tool that allows CeIIML models to be
viewed in a
Viewer browser.
Java-based Model A system editor designed to run in a Java
environment.
Editor
User DocumentationUser manual describing the use and operation
of the
system of the present invention.
Online Help SystemOnline version of user manual and integration
of this into
the system of the present invention.
Example 4~
One of the unique aspects of the present invention is the ability
of the system to build models with hidden mathematics. This allows users to
CA 02399272 2002-08-02
WO 01/57775 PCT/USO1/01988
-44
construct complex models of biological systems without in-depth knowledge
of mathematical modeling.
FIG. 15 represents a graphical model of the various reaction
pathways present when T-cells activate. Consider the initial conditions for
the components of the T-cell model set for the below:
Initial Conditions for the Components of the T-Cell Model
STAT6p = 1.0
GATA3 = 1.0
cmaf = 1.0
Y = 1.0
NFIL6 = 1.0
X = 1.0
IL4 = 0.0
ILS = 0.0
IL13 = 0.0
IL6R = 0.0
STATE = 3.0
NFATcP = 5.0
NFATc = 1.0
IL4R = 0.0
Jak3 = 3.0
NFkb = 1.0
ras = 1.0
raf = 1.0
rac = 1.0
p38Jun = 1.0
JunFos = 1.0
TCR = 1.0
LATp = 1.0
PIP2 = 1.0
IP3 = 1.0
DAG = 1.0
PLCg = 1.0
PI3K = 1.0
Gefs = 1.0
SLPvav = 1.0
Ca2 = 2.0
PKC = 1.0
Calcineurin
= 1.0
PI = 5.0
CD28 = 0.0
IKK = 1.0
Z = 5.0
Fos = 1.0
CA 02399272 2002-08-02
WO 01/57775 PCT/USO1/01988
-45
STAT4 = 3.0
STAT4p = 1.0
IFNg = 0.0
The following system of equations represent T-cell activation
for the initial component conditions listed above:
Equations for representing Components
dSTAT6p/dt = k7 * STATE + -k0 * STAT6p
dGATA3/dt = k0 * STAT6p + k26 * Z + -k3 * GATA3
dcmaf/dt = k0 * STAT6p + -k5 * cmaf
dY/dt = k0 * STAT6p + -k2 * Y
dNFIL6/dt = k0 * STAT6p + k6 * IL6R + k19 * LATp + -k4 * NFIL6
dX/dt = k3 * GATA3 + -kl * X
dIL4/dt = k1 * X + k2 * Y + k4 * NFIL6 + k5 * cmaf + k9 * NFATc + k16
JunFos
dILS/dt = k3 * GATA3 + k1 l * NFkb + k12 * NFkb + k16 * JunFos
dIL 13/dt = k3 * GATA3 + k 12 * NFkb + k 16 * JunFos
dIL6R/dt = -k6 * IL6R
dSTAT6/dt = -k7 * STATE
dNFATcPIdt = -k8 * NFATcP
dNFATc/dt = k8 * NFATcP + k28 * raf + -k9 * NFATc
dIL4R/dt = -k10 * IL4R
dJak3/dt = k10 * IL4R
dNFkb/dt = -k 11 * NFkb + -k 12 * NFkb
dras/dt = k25 * Gefs + k30 * DAG + -kl3 * ras
draf/dt = k13 * ras + k27 * PKC + -k28 * raf
drac/dt = k24 * SLPvav + -kl4 * rac
dp38Jun/dt = k14 * rac + k28 * raf + -k15 * p38Jun
dJunFos/dt = k15 * p38Jun + k29 * Fos + -k16 * JunFos
dTCR/dt = -k17 * TCR
dLATp/dt = k17 * TCR + -k19 * LATp
dPIP2/dt = k22 * PI + -kl 8 * PIP2
dIP3/dt = k18 * PIP2 + -k2I * IP3
dDAG/dt = k18 * PIP2 +-k30 * DAG
dPLCg/dt = k19 * LATp
dPI3K/dt = k19 * LATp + k23 * CD28
dGefs/dt = k19 * LATp + -k25 * Gefs
dSLPvav/dt = k 19 * LATp + -k24 * SLPvav
dCa2/dt = k21 * IP3 + -k20 * Ca2
dPKC/dt = k20 * Ca2 + k30 * DAG + -k27 * PKC
dCalcineurin/dt = k20 * Ca2
dPI/dt = -k22 * PI
dCD28/dt = -k23 * CD28
dIKK/dt = k23 * CD28
dZ/dt = -k26 * Z
CA 02399272 2002-08-02
WO 01/57775 PCT/USO1/01988
-46
dFos/dt = k28 * raf + -k29 * Fos
dSTAT4/dt = -k31 T STAT4
dSTAT4p/dt = k31 * STAT4 + -k32 * STAT4p
dIFNg/dt = k32 * STAT4p
Referring back to FIG. 15, a user could click on the "." linking
each of the model components and insert various kinetic parameters
(accessible from the database) thereby altering the system of equations
representing the model. In this way, the model incorporates qualitative
simulators with quantitative methods.
This model can be integrated into a system model, such as T-cell
differentiation in rheumatoid arthritis illustrated in FIG. 10. This allows
the
user to simulate the heterogeneous time scales found in the system model via
qualitative and quantitative analysis.
Having thus described the invention in rather full detail, it will
be understood that such detail need-not be strictly adhered to but that
various
changes and modifications may suggest themselves to one skilled in the art,
all falling within the scope of the present invention as defined by subjoined
claims.