Note: Descriptions are shown in the official language in which they were submitted.
CA 02401555 2002-08-21
WO 01/65454 PCT/USO1/06652
DELIVERY SYSTEM AND METHOD FOR VEHICLES AND THE LIKE
Technical Field
The present invention relates to the logistics of delivering a product, such
as a vehicle, upon release from a manufacturing plant, to a destination, and
fuxther
relates to providing feedback from a delivery network to influence
manufacturing
processes and scheduling.
Background of the Invention
Worldwide production of automobiles to a level of 38 million vehicles in
1998 and beyond in subsequent years. A vehicle manufacturer must transport
each
of these large, heavy items from a manufacturing plant to a dealer for retail
sale.
Transportation of vehicles will become even more complex if Internet commerce
results in substantial direct delivery from factory to a purchaser's home or
place of
business.
A typical known solution for vehicle transportation involves the
manufacturer, one or more railroad carriers, one or more car hauler carriers,
and a
dealer. Generally described, vehicles begin their journey at an origin ramp at
an
assembly plant, where they axe loaded on rail cars, travel to mixing centers,
where
they are unloaded and then re-loaded on rail cars, travel to destination
ramps,
where they are unloaded and re-loaded onto car hauler trailers, and travel to
dealer
locations for final unloading. The transport of each vehicle involves a unique
combination of origin and destination points, modes of transport, and transit
times,
referred to as a "lane." Lanes consist of a combination of segments, each of
which
is a portion of a lane defined by a specific origin and destination location.
In the
United States the delivery process may take about twelve days or longer,
because
of various delays and bottlenecks that can arise.
-1-
CA 02401555 2002-08-21
WO 01/65454 PCT/USO1/06652
In general, delays are caused by problems with equipment and labor
shortages or unavailability, damage to vehicles, accidents or breakdowns
affecting
carrier transports, and unreliable information about the status of vehicles
moving
along lanes. Individual carriers generally take responsibility for providing
sufficient labor and equipment at the right places at the right times to move
the
large volume of vehicles. Carriers have collected and reported information
from
along lanes mainly for the purpose of submitting documentation to be paid for
jobs
completed. They have provided such information to vehicle manufacturers in
varying formats via various modes of communication. When delays and
bottlenecks have arisen, they have been difficult to resolve. Damaged
vehicles, for
example, may be difficult to locate, and payments to carriers often are
delayed.
Car haulers and rail carriers have not sufficiently coordinated their efforts.
Turning more specifically to practices at origin ramps at assembly plants,
the manufacturer must coordinate with rail (and for nearby dealers, car
hauler)
carriers to obtain and load a correct number of transport devices to transport
the
plant's production. This is a difficult goal, because production schedules
change
and the manufacturer places varying numbers of vehicles exiting the production
line on quality hold for varying periods of time. The information shared on
the
status of vehicles in production and on hold has been unreliable.
To even out deliveries to a group of dealers spread around the country, at
least one manufacturer has scheduled production with this goal in mind.
However,
such attempts have not had a dramatic effect on delivery efficiency, and large
daily
fluctuations in the volume of vehicles for distribution are not uncommon.
With regard to present use of mixing centers, unloading and loading
massive numbers of vehicles consumes much time. Again, Garners face the
challenge of providing sufficient labor and equipment when needed without
leaving loaders and rolling stock idle. Carriers have insufficient information
to
accurately estimate arnval times of trains or knowledge of their contents and
the
vehicle destinations to project labor and equipment needs. Therefore the
phenomena of "dwell" occur; fox example, transit dwell occurs when rail cars
cannot be unloaded, and a process dwell occurs when railcars are not available
to
load outbound vehicles. Damaged vehicles sometimes are set aside and become
"lost" at a facility because their status and location were not accurately
reported.
-2-
CA 02401555 2002-08-21
WO 01/65454 PCT/USO1/06652
Usually, car haulers are needed to transport some vehicles to dealers within a
set
distance from the mixing center, adding increased complexity to the unloading,
sorting, and loading process.
At destination ramps, respective employees unload railcars and load car
hauler trailers with vehicles bound for dealers along their route. Here, dwell
again
occurs because of inaccurate projections or unavailability of labor and
equipment
on the part of both rail and car hauler carriers, who must coordinate their
activities.
Dealers sometimes put holds on vehicles, or are not available for unloading
vehicles at the time of day when a car hauler can most efficiently deliver the
vehicles. These situations cause vehicles to occupy space at destination ramps
prior to being accepted by a dealer, extending the total delivery time.
Stated in another way, a bottleneck occurs whenever there are more
vehicles at a point in the vehicle distribution network than what the
resources at
that point are capable of handling. These bottlenecks are what extend the
transit
time of vehicles to dealers. Bottlenecks occur primarily at three specific
locations
in the system for
the following reasons:
At a manufacturing plant:
a) too many vehicles (parking constraint)
b) vehicles not loaded fast enough (resource
constraint)
c) not enough empty railcars or car haulers (tamer
constraint)
At a mixing center:
a) too many railcars or car haulers (mixing center
constraint)
b) too many vehicles (parking constraint)
c) not enough empty railcars or car haulers (tamer
constraint)
d) vehicles not loaded or unloaded fast enough
(resource constraint)
e) too many railcars to unload (mixed loads vs.
LTD (load to
destination) railcars constraint)
At a destination ramp:
a) too many railcars or car haulers (ramp constraint)
b) vehicles not unloaded fast enough (resource constraint)
c) too many vehicles (parking constraint)
Thus, present vehicle delivery methods are cumbersome and relatively
inefficient. Present procedures and levels of communication between the
various
-3-
CA 02401555 2002-08-21
WO 01/65454 PCT/USO1/06652
participants have made it difficult to move vehicles efficiently through
bottlenecks,
to resolve exceptions because of unexpected problems. As a result, there has
been
a need for a vehicle transportation system that can move vehicles from
assembly
plant to dealer more quickly and reliably.
Summary of the Invention
The present invention seeks to provide a product delivery system that can
move products from manufacturing plant to destination more quickly and
reliably.
In furtherance of this goal, the invention seeks to improve the delivery
process .as
far upstream in the process as possible, to minimize handling of products, to
bypass intermediate sites and facilities wherever possible, and to move
products in
larger volumes or batches. These goals apply particularly to the application
of the
invention to the delivery of vehicles from vehicle assembly plants to
dealerships.
The present invention accomplishes these objects by providing improved
visibility of and improved tools for operating a delivery network to a
centralized
management organization overseeing a number of separate parts of the network.
In
one aspect, the invention relates to delivery of products upon release of the
products from the plant in which they are manufactured. Tn another aspect, the
invention relates to influencing the sequence in which the products are
manufactured in response to conditions and capacities within the delivery
network.
One tool preferably utilized in the present invention is a tracking system by
which managers in many parts of the network have access to the status of
individual products and network facilities. Another tool preferably utilized
in the
present invention is a simulation tool by which managers can model the network
and test scenarios for the purpose of changing product routing plans based on
predicted capacity and bottlenecks. Another tool preferably utilized in the
present
invention is a planning tool that can facilitate preparation of product
routing plans
in response to status information from the tracking system and analyses
produced
by the simulation tool.
Generally described, one embodiment of the present provides a system and
method for facilitating delivery of manufactured items from a manufacturing
-4-
CA 02401555 2002-08-21
WO 01/65454 PCT/USO1/06652
facility to customers via a delivery network, utilizing: (1) one or more
databases,
including:
(a) in transit information describing a location and status of items in the
delivery network being delivered from the manufacturing facility to a
destination;
(b) network facility information including identification and capacity of a
plurality of network facility points, including origin points, mixing center
points,
termination points, customer facility points;
(c) carrier information describing capacity, location and status of network
transport devices and transport operators;
(d) routing information describing transportation routes within the delivery
network, capacity of the routes, and cost of delivery of items along the
routes; ~' ,
(e) a delivery plan including routes for items and planned times for
shipment and delivery of items to points along routes;
(f) measured transit time information including actual times taken for
1 S movement of items between points in the network; and
(2) access to the one or more databases from one or more of the network
facility
points; and the capability to download from one or more of the databases
information useful in carrying out a delivery plan implemented via the
delivery
network. In a preferred option, remote access units are configured to upload
to one
or more of the databases information for updating the in transit information,
the
network facility information, and/or the carrier information. Preferably, one
or
more of the databases includes manufacturing information identifying items to
be
completed over a known period of time; and the access units are configured to
upload to one or more of the databases information for updating the
manufacturing
information. The access units may be configured to upload to one or more of
the
databases information for updating the route information, the measured transit
time
information, and the delivery plan. In one preferred option, the system and
method
utilize a simulation tool operative to predict performance of alternate
delivery
plans based on the information stored in the one or more databases.
According to another of its aspects, the present invention provides a
method of transporting vehicles from a manufacturing plant to a plurality of
destination locations via a delivery network, comprising transporting by rail
at
least some of a plurality of vehicles released from a manufacturing plant
origin
-s-
CA 02401555 2002-08-21
WO 01/65454 PCT/USO1/06652
point to a mixing center; consolidating vehicles bound for a common
destination
location at the mixing center; transporting the consolidated vehicles to the
common
destination location; using a simulation tool to model a delivery network
including
the manufacturing plant origin point, the mixing center, the destination
location,
and transport devices and to predict occurrence of delays at the mixing
center; and
in response to prediction of a delay at the mixing center, planning and
executing a
routing plan that transports at least some of the vehicles directly from a
first point
in the delivery network upstream of the mixing center to a second point in the
delivery network downstream of the mixing center so as to bypass the mixing
I O center and reduce the predicted delay. In one implementation, the routing
plan
may transport vehicles from the manufacturing plant origin point directly to
the
destination location, preferably by car hauler.
According to another of its aspects, the present invention provides a
method of transporting vehicles from a manufacturing plant to a plurality of
destination ramps via a delivery network, comprising transporting by rail at
least
some of a plurality of vehicles released from a manufacturing plant origin
point to
a mixing center; consolidating vehicles bound for a common destination ramp at
the mixing center; transporting the consolidated vehicles to the common
destination ramp; transporting the consolidated vehicles by car hauler in
groups to
a plurality of dealerships; using a simulation tool, modeling a delivery
network
including the manufacturing plant origin point, the mixing center, the
destination
ramp, the plurality of dealerships, and transport devices and predicting
occurrence
of delays at the destination ramp; and in response to prediction of a delay at
the
destination ramp, planning and executing a routing plan that transports at
least
some of the vehicles directly from a point in the delivery network upstream of
the
destination ramp to one or more of the dealerships so as to bypass the
destination
ramp and reduce the predicted delay. In particular implementations, the
routing
plan transports vehicles from the manufacturing plant origin point directly to
one
or more of the dealerships, or transports vehicles from the mixing center
directly to
one or more of the dealerships, preferably by cax hauler.
According to another of its aspects, the present invention provides a
method of transporting vehicles from a manufacturing plant to a plurality of
destination ramps via a delivery network, comprising transporting by railcar
at
-6-
CA 02401555 2002-08-21
WO 01/65454 PCT/USO1/06652
least some of a plurality of vehicles released from a manufacturing plant
origin
point to a mixing center, utilizing a first group of railcars each carrying
unmixed
vehicles bound for a respective common destination ramp, and a second group of
railcars carrying mixed vehicles bound for more than one destination ramp;
unloading the second group of railcars at the mixing center; consolidating the
unloaded vehicles onto a third group of railcars each carrying unmixed
vehicles
bound for a respective common destination ramp; transporting the first and
third
groups of railcars from the mixing center to the respective common destination
ramps; using a simulation tool, modeling a delivery network including the
manufacturing plant origin point, the mixing center, the destination ramp, and
transport devices and predicting occurrence of delays at the mixing center;
and in
response to prediction of a delay at the destination ramp, planning and
executing a
routing plan that diverts at least some of the mixed vehicles at the
manufacturing
plant origin point to car haulers for transport directly to a point in the
delivery
network downstream of the mixing center. In particular implementations, the
downstream point in the delivery network comprises a respective destination
ramp,
or the delivery network may comprise a plurality of dealerships, and, in
response
said prediction of a delay at the destination ramp, the method may divert at
least
some of the mixed vehicles at the manufacturing plant origin point to unmixed
car .
haulers for transport directly to respective dealerships.
According to another of its aspects, the present invention provides a . . .
method of operating a delivery network for transporting vehicles from a
plurality
of manufacturing plants to a plurality of destination locations, comprising
establishing a relationship with a plurality of independent entities, the
plurality of
entities providing a continuous delivery network from the manufacturing plants
to
the destination locations; providing at least partial management of each of
the
plurality of delivery network the companies by the use of delivery network
managers having a primary allegiance to a delivery network management
company; providing a delivery information network for use by the delivery
network managers; providing the delivery network managers with access to
information via the delivery information network; and in response to the
information provided, directing activities of employees of the plurality of
independent entities to facilitate delivery of the vehicles from the
manufacturing
CA 02401555 2002-08-21
WO 01/65454 PCT/USO1/06652
plants, along the continuous delivery network, and to the destination
locations.
Preferably the delivery network managers also have the ability to remotely
update
the delivery information network and to communicate with one another. The
independent entities may include vehicle manufacturers, rail carriers, car
hauler
carriers, load or unload contractors, and/or dealers.
According to another of its aspects, the present invention provides a
method of scheduling, manufacturing, and shipping items via a delivery
network,
comprising assembling a set of parts needed to make a predetermined number of
items in a predetermined order; providing a delivery network comprising a
plurality of network facility points, including one or more origin points and
mixing
center points, and a plurality of termination points; inserting the items as
they are
made into the delivery network; monitoring activity at the network facility
points;
projecting relative congestion along a plurality of routes through the
delivery
network based on the monitored activity in the network and the destinations of
the
items to be made; and responsive to the projected relative congestion in the
delivery network, altering one or both of the assembled set of parts and the
predetermined order of making the items, so as to cause the items to enter the
delivery network in an order calculated to improve efficiency of delivery. In
a
preferred implementation, the alteration includes ordering production from the
assembled set of parts of items going to the same termination point in
sequential
order, to facilitate direct loading from assembly line to transport device.
Furthermore, the invention provides a method of scheduling,
manufacturing, and shipping items via a delivery network, comprising providing
a
delivery network comprising a plurality of network facility points, including
one or
more origin points and mixing center points, and a plurality of termination
points;
assembling a set of parts needed to make a predetermined number of items;
ordering production from the assembled set of parts so as to manufacture items
going to the same termination point in sequential order; and inserting the
items as
they are made into the delivery network. The network may also include customer
facility points, each of the items having a delivery destination at one of the
customer facility points
More specifically described, a preferred embodiment of one aspect of the
invention provides a method and system of the present invention relate in one
_8_
CA 02401555 2002-08-21
WO 01/65454 PCT/USO1/06652
embodiment to the transportation of vehicles from a plurality of vehicle
manufacturing plants to a plurality of vehicle dealer locations. In one
embodiment,
this invention comprises manufacturing the vehicles at each of the
manufacturing
plants in a sequence based on the destinations of the vehicles. The invention
also
comprises notifying rail and car hauler carriers of a manufacturing
productions
schedule, which takes into account the above mentioned sequence. The invention
also involves associating sets of the manufacturing plants into plant groups,
and
providing a plurality of parent mixing centers, each receiving vehicles from a
plurality of the plant groups, which are associated exclusively with one
parent
mixing center. A plurality of rail car loads of vehicles (bound for a single
destination, within a first time window) are released from one or more of the
plant
groups sharing a parent mixing center. The rail car loads are transported to
the
shared parent mixing center associated with each of the plant groups if the
destination is farther than a selected distance from a final loading location
of the
plant group;
In this embodiment, the present invention also provides for a system for
simulating
the best routes for vehicles released from all the manufacturing plants in the
first
time window, based on available rail transport and production schedules of all
the
manufacturing plants. At the shared parent mixing center, this embodiment of
the
invention combines the rail car loads with rail car loads from other plant
groups,
bound for the same destination; and then allows for the transporting of the
trains to
remote mixing centers, where there is further assembling of trains according
to the
simulated best routes. The invention also allows for the bypassing of remote
mixing centers when a full train has been assembled.
The invention further provides for the transportation of the trains to
destination ramps; the transferring of the vehicles to car hauler trailers;
and the
transporting of the car hauler trailer to a dealer location and unloading the
vehicles.
Another aspect of this embodiment of the invention is the ability to track
each vehicle. This is accomplished by, for example, marking each vehicle with
a
machine readable vehicle code (the marking can involve, for example, affixing
adhesive material with bar-coded information, or it can, for example, be a
permanent identification mark that is put on the vehicle). The system provides
for:
~ the scanning of each vehicle code as a vehicle is loaded onto a rail car;
_9_
CA 02401555 2002-08-21
WO 01/65454 PCT/USO1/06652
~ the marking of the rail cars loads with a machine-readable rail car code,
and storing the vehicle codes of each load in association with the rail
car code;
~ scanning the rail car code on arrival at the parent mixing center;
~ scanning the rail car code on departure from the parent mixing center;
scanning the rail car code on departure from the remote mixing center;
~ scanning the rail car code on arrival at a remote mixing center;
~ the scanning of the rail car code on arnval at a destination ramp;
~ the scanning of the vehicle codes as the vehicles are loaded onto a car
hauler trailer;
~ the scanning of the vehicle codes on arrival at the dealer location.
On each of the scans mentioned above, the system enables the sending of the
scanned vehicle or rail car codes to a central computer, where they can be
used to
track the vehicles, and for other logistical purposes.
Also, in this embodiment there is provided a management team
independent of the rail and car hauler carriers. The management team is
capable of
accessing the central computer to monitor the location of each manufactured
vehicle at any time, monitoring the performance of the carriers in delivering
vehicles to predetermined destinations within preset time limits, and alerting
the
carriers if a vehicle is behind schedule. The management team also possesses
the
ability to provide alternate transport for vehicles that are behind schedule.
In somewhat more detail, according to one preferred embodiment,
the system of the invention is designed to provide vehicles from a
manufacturing
plant to a dealer facility reliably within a set number of days. The system
establishes a transportation network that is coordinated with vehicle assembly
in
the manufacturing plant. A goal is to assemble and load vehicles onto rail
cars and
car hauler trailers in blocks going to the same destination, in order to
minimize the
handling of the vehicles and to maximize bypassing of handling and sorting
facilities whenever possible.
At the manufacturing plant associated with this embodiment, vehicles are
assembled according to a "geographic build principle." Geographic build has
several possible implementations, as described below. The purpose is to
improve
vehicle transit time and delivery predictability by aligning the plant
production
-lo-
CA 02401555 2002-08-21
WO 01/65454 PCT/USO1/06652
sequence by geographic region. This alignment allows the vehicle delivery
network to improve efficiencies through better equipment utilization and
reduced
rail switching which provides improved cycle times. Assembly plants also
improve rail loading practices through simplified load make-up requirements.
Geographic build increases railcar utilization and train length, increases the
number of unit trains to improve velocity and reduce switching time and dwell
time at interchange points, improves arnval predictability, helps prevent
vehicle
storage, reduces the number of loading destinations, reduces load makeup time,
and reduces plant dwell due to partial loads.
In one implementation of geographic build, vehicles are assembled in
groups going to the same destination. The manufacturer coordinates just in
time
delivery of parts for the vehicles in accordance with the schedule to
optimally feed
vehicles into the transportation network. The plant also works to release the
vehicles for transportation as soon as they are complete, and the vehicles are
loaded and transported immediately. Origin automotive manufacturing plants are
consolidated into groups that feed an assigned "parent mixing center." In the
past,
multiple manufacturing plants have sent vehicles to several mixing centers, at
which all the vehicles were unloaded and re-mixed after sorting according to
destination. The present system moves the sorting process as far upstream as
possible, including the scheduling of vehicle assembly, as noted above.
Whenever
possible, rail cars are filled at the assembly plant with vehicles bound for a
single
destination ramp. Thus, in one typical scenario the vehicles are moved from
the
assembly plant by rail car or car hauler to a mixing center where full rail
cars are
consolidated with others and car hauler loads are loaded onto rail cars. The
rail
cars take the vehicles to a destination ramp, at which the vehicles are
unloaded
onto car haulers for transport to dealerships. However, the system bypasses
mixing centers whenever possible, for example, by sending car hauler loads
directly to dealerships from the vehicle assembly plant, or by forming
complete
trains at a manufacturing plant and sending them to a destination ramp. The
need
for unloading vehicles for the purpose of sorting them is minimized. This is
facilitated by providing high volumes of vehicles bound for the same
destination at
the same time from an origin group of manufacturing plants. The result is a
-lI-
CA 02401555 2002-08-21
WO 01/65454 PCT/USO1/06652
sufficient volume of such vehicles to build trains that the railroads will
handle at a
reasonable cost.
The transportation network uses simulation programs to determine the best
way to load car haulers and rail cars and to build trains based upon the
assembled
vehicles that will be available and their destinations. The simulations will
be used
not only for production planning, but also to optimize transportation in the
event of
exceptional circumstances, such as a need to adjust planned loads when a group
of
assembled vehicles must be held to correct a defect.
A part of the system is the ability to track each assembled vehicle
throughout the transportation network. The concept is called "full
visibility." The
vehicle identification number of each assembled vehicle is entered into the
system
at the assembly plant, and associated with each car hauler or rail car in
which that
vehicle is loaded. Whenever the car hauler or rail car is scanned, the
location of -
each vehicle is updated in the system memory. The system provides accurate
advance notification to Garners (car haulers and railroads) so that they are
able to
provide transportation resources in a timely manner. The location information
is
also compared to the planned schedule for each vehicle, and an alert or alarm
is
provided if a vehicle has fallen off schedule. In pre-identified situations,
the
system will automatically re-route a particular vehicle or change its method
of
transportation to overcome a difficulty.
The system also provides management of the transportation network by
personnel at various facilities in the network. These personnel in the
field,will ,
manage the carriers actively to assure that they meet their commitments. The
network managers will observe network activity based on information from the
car
tracking system, respond to off schedule alarms which impact their facility or
will
impact another facility, and notify other network managers and carriers of
problems and how to respond to overcome the problems. They will also work with
the carriers on load planning and the timing of shipments. They will be
responsible for proper loading of rail cars and car haulers, for Garner
timeliness,
and for assuring that vehicles are placed in the correct loads and reach the
correct
destination. The car tracking system will allow these managers to determine
the
status of every vehicle at all times.
-12-
CA 02401555 2002-08-21
WO 01/65454 PCT/USO1/06652
The system requires dealers to be flexible in their availability for receiving
car haulers with loads for their dealership. An object of the system is to
make
delivery to dealers more efficient by unloading car haulers at any time on a
seven
day, twenty-four hour basis, while at the same time notifying dealers in
advance of
a precise delivery time, so that the dealer can be ready to receive the
vehicles
without having to have personnel on site at all times. For example, the dealer
may
be notified via the network or by e-mail that a shipment will arrive on a
certain
date between 7:00 and 9:00 am. The system allows prediction of the delivery
time
with accuracy, and the dealer is responsible for having personnel present to
receive
the vehicles.
Thus, the present invention is capable of optimizing a vehicle distribution
network. A system according to the invention can transport new vehicles
produced
at many manufacturing plants to a large number of dealers nationwide. As
dealers
place orders for vehicles, the orders go directly to the manufacturing plant
that
produces the particular vehicle ordered. The vehicle is produced, then shipped
to
the dealer as fast as possible. The preferred modes of transportation used are
railcars and car haulers. The delivery network is a type of "hub and spoke"
network with mixing centers located at strategic points in the U.S. for
consolidating vehicles into railcars arriving from the manufacturing plants
and
20. creating direct shipments to destination ramps in other parts of the
country.
All vehicles are identified by a unique "vehicle identification number" or
"VIN." In accordance with common practice, a uniquely identified vehicle will
sometimes be referred to below as a VIN.
Other features and advantages of the present invention will become
apparent to one skilled in the art upon examination of the following drawings
and
detailed description. It is intended that all such features and advantages be
included herein within the scope of the present invention as defined by the
appended claims.
Brief Description of the Drawings
Fig. 1 a schematic diagram of a vehicle delivery system 10 according to the
present invention.
Fig. 2 is a diagrammatic representation of the velucle distribution network.
-13-
CA 02401555 2002-08-21
WO 01/65454 PCT/USO1/06652
Fig. 3 is a geographical map showing a portion of a distribution network.
Fig. 4 is a geographical map showing vehicle transport outbound from the
mixing centers.
Fig. 5 is a diagram of the basic vehicle flow through the distribution
network.
Fig. 6 is a diagrammatic representation of a consolidation hub.
Fig. 7 is a diagrammatic representation of the data flow network.
Fig. 8 is a further concept diagram of the data flow network.
Fig. 9 is a diagrammatic data flow diagram showing that how shipper data
(such as from rail carrier data sources 54 and car hauler data sources 56 can
be sent
to become part of the manufacturer's data 52, to then be~ passed along to the
vehicle tracking system 34, or in the alternative how the shipper data could
be
routed directly to the tracking system 34 without going through the
manufacturer's
system. It may be understood that in the alternative version, a record may be
created by the carrier that links the vehicles (e.g., through VINs) to the
delivery
vehicles (e.g., train cars), and this linking records can be sent to the
system 34.
It should also be understood that the railcars could be tracked via
conventional railcar tracking systems and such information could also be used
to
better pinpoint vehicle locations.
Fig. 10 is a diagrammatic process diagram showing how the tracking
. database 50 of the vehicle tracking system 34 is updated by use of user-
added data
such as hold instructions, as well as manufacturer data passed from the data
communications interface 40.
Fig. 11 is a screen navigation chart 1011.
Fig. 12 is a diagrammatic view 1012 showing connectivity between the
user at 42 and redundant systems which may used to run redundant tracking
applications if desired.
Fig. 13 is a tracking system entity relationship diagram 1013.
Fig. 14 is a object class hierarchy 1014 of the tracking system 34 software
application.
Fig. 15 is a object class hierarchy 1015 of the tracking system 34 software
application.
-14-
CA 02401555 2002-08-21
WO 01/65454 PCT/USO1/06652
Fig. 16 is a screen shot 1016 of viewable items - Dealers, Ramps and
Lanes.
Fig. 17 is a screen show of a status report 10I7.
Fig. 18 is a screen navigation flow diagram 1018.
Fig. 19 is a screen shot 1019 of a Dealer View.
Fig. 20 is a screen shot 1020 of a Unit View (a.k.a., Model Summary).
Fig. 21 is a screen shot 1021 of a Vehicle Summary.
Fig. 22 is a screen shot 1022 of a dealer view, status details.
Fig. 23 is a screen shot 1023 of a dealer view, status details; insert hold
event screen 1.
Fig. 24 is a screen shot 1024 of a dealer view, status details, insert hold
event screen 2.
Fig. 25 is a screen shot 1025 of a search screen.
Fig. 26 is a screen shot 1026 which shows search results.
Fig. 27 is a screen shot 1027 showing Vehicle Detail.
Fig. 28 is a screen shot 1028 showing a Ramp View.
Fig. 29 is a screen shot 1029 showing a unit breakdown (Model Summary)
in ramp view..
Fig. 30 is a screen shot 1030 of a Vehicle Sununary in ramp view.
Fig. 31 is a screen shot 1031 of a lane view.
Fig. 32 is a screen shot 1032 of a unit breakdown in lane view.
Fig. 33 is a screen shot 1033 of a Vehicle Summary in lane view.
Fig. 34 is a screen shot 1034 of a lane view, status detailed.
Fig. 35 is a screen shot 1035 showing viewable items.
Fig. 36 is a screen shot 1036 showing a Dealer View.
Fig. 37 is a screen shot 1037 showing a Model Summary.
Fig. 38 is a screen shot 1038 showing a Vehicle Summary.
Fig. 39 is a screen shot 1039 showing Status Details.
Fig. 40 is a screen shot 1040 showing Railcar Summary.
Fig. 41 is a screen shot 1041 showing Ramp Summary
Fig. 42 is a screen shot 1042 showing Vehicle Summary.
Fig. 43 is a screen shot 1043 showing Status Details.
Fig. 44 is a screen shot 1044 showing Vehicle Detail.
-15-
CA 02401555 2002-08-21
WO 01/65454 PCT/USO1/06652
Figs. 45-54 relate to management structures. Fig. 45 is a management flow
chart showing how the management team 31 provides a "management layer" over
(although not necessarily directly supervising) various other entities which
may not
necessarily be employed by, paid, or salaried employees of the management team
31. These entities include but are not necessarily limited to manufacturer's
personnel 33, vehicle loading/unloading contractors 35, car hauler personnel
37
(who operate car haulers 28), rail carrier personnel 41 (who operate trains
23), and
dealers 29. It should be understood that the car hauler personnel 37 and rail
carrier
personnel 41 could be referenced generically herein as "carner" personnel. It
should also be understood that preferably this management is done via contact
with
the management structure of the above entities. However, it should be
understood..
that the activities and results of those being managed (e.g. hourly workers)
will be
monitored as many of the management team will be on site.
Fig. 55 is a diagram of inputs to and outputs from the planning tool.
Fig. 56 is a diagram of vehicle flow in the distribution network following
operation of the planning tool.
Fig. 57 is a flow diagram for an automated planning process.
Fig. 58 is a diagram of the contents of the routing plan database.
Fig. 59 is a diagram of a daily routing process.
Fig. 60 is a diagram of transit event descriptions and the entities associated
with the events in the distribution network.
Fig. 61 is a diagram of vehicle flow for transporting vehicles on LTD
railcars from a manufacturing plant to a mixing center.
Fig. 62 is a diagram of vehicle flow for transporting vehicles initially on
car
haulers from a car plant to a destination ramp via two mixing centers.
Fig. 63 is a diagram of vehicle flow for transporting vehicles from the
mixing center to a destination ramp and dealer.
Fig. 64 is a diagram of vehicle flow for transporting vehicles on mix
railcars from a manufacturing plant to a mixing center.
Fig. 65 is a diagram of vehicle flow for direct delivery from origin plant to
dealer by car hauler.
-1G_
CA 02401555 2002-08-21
WO 01/65454 PCT/USO1/06652
Detailed Description of Preferred Embodiments
SYSTEM OVERVIEW
Referring now in more detail to the drawings, in which like numerals refer
to like elements throughout the several views, Fig. 1 shows a schematic
diagram of
a vehicle delivery system 10 according to the present invention. The delivery
system 10 includes generally a vehicle distribution network 20, which includes
various physical facilities described below for transporting vehicles, and an
data
flow network 30, which includes various data processing, storage, user
interface,
and software components that are also described below. The distribution
network
20, conceptually shown in Fig. 1, provides for the transport of vehicles 22 by
trains
23 of railcars from an origin point 25, such as a manufacturing plant or ,
accumulation hub, to a mixing center 26, where personnel unload and sort the
vehicles if necessary. Railroad personnel then load the vehicles onto railcars
and
build trains 23 to transport the vehicles to destination ramps 27, where
personnel
unload the vehicles. Others at the destination ramps 27 load the vehicles onto
car
haulers 28 for transport to automobile dealerships 29. Fig. 1 shows the data
flow
network 30 conceptually as a system for collecting information from each of a
plurality of facility points of the distribution network, and for providing
information to each of those points. The flow of information is shown in
dashed
lines.
On a very generic level, the facilities and basic functions of the
distribution
network 20 are well known. That is, distribution networks including mixing
centers and transport by rail and car hauler existed prior to the present
invention.
The vehicle delivery system 10 of the present invention improves upon prior
distribution networks by providing a more efficient structure as well as
comprehensive information describing the status of the network, allowing the
network to be operated in an efficient and flexible manner to deliver vehicles
faster. The network as described below minimizes the handling of vehicles,
maximizes the bypassing of intermediate sites and facilities, and assembles
large
volumes of vehicles having similar destinations for speedier transport. A team
of
managers, members of which work at each point of the network, coordinate each
operation from initial loading at origin plants to final transfers at
destination ramps
-m-
CA 02401555 2002-08-21
WO 01/65454 PCT/USO1/06652
or dealerships. This team manages the efforts of manufacturers, individual
carriers
and dealers.
It should be understood that the delivery system described herein is not
restricted to delivery of items from their place of manufacture, nor to any
particular
source of goods or type of goods. Without limiting the scope of the claims,
examples of application of the present system are to distribute rental cars,
to
distribute raw paper from paper manufacturers to factories where the paper is
used,
and transportation of in-bound parts from parts manufacturers to factories
where
the parts axe incorporated into other products. Of course, the invention is
not
limited to any type of destination for the items being transported. Any
reference
herein to particular companies, products or places is by way of example only,
and
not a limitation on the scope of the claims.
A diagrammatic representation of the vehicle distribution network is shown
in Fig. 2. At the origin point 25, a vehicle 22 is manufactured at a plant 25a
and
released to an origin ramp 25b for loading. Fig. 2 shows multiple possible
initial
lane segments for the vehicle 22. Segment 3 represents car hauler
transportation to
a mixing center 26. Segment 4 represents "LTD" (load to destination ramp)
railcar
23a transport to the mixing center for attachment (without unloading) to a
train
bound for a destination ramp 27. LTD railcars contain vehicles bound for the
same
destination ramp. Segment 5 represents "mix" (mixed vehicle destinations)
railcar
23b transport to the mixing center for unloading, sorting, loading with other
vehicles bound for the same destination ramp, and attachment to a train bound
for
the destination ramp 27. Segment 6 represents a train of railcars proceeding
directly from the origin ramp 25b to the destination ramp 27. One or more
additional rail or car hauler lane segments 7 are traversed between the mixing
center 26 and the destination ramp 27, from which the vehicle is transported
to a
dealer 20 by car hauler. Some vehicles may have one car hauler lane segment 8
between the mixing center and the dealer. Segment 9 represents car hauler
transport directly from the origin ramp to a dealer 29.
Fig. 3 represents a geographical map showing a portion of an example of a
distribution network 20 utilizing the present invention, showing how vehicles
move from origin points 25, in this case groups of manufacturing plants, to a
mixing center 26. Each origin manufacturing plant sends it manufactured
vehicles
-i8-
CA 02401555 2002-08-21
WO 01/65454 PCT/USO1/06652
to one "parent" mixing center 26p. In the example shown, a set of Southeastern
U.S. plants in Louisville, Kentucky, Norfolk, Virginia, and Atlanta, Georgia
route
vehicles produced to the mixing~center 26p at Shelbyville, Kentucky by rail.
From
Shelbyville, trains of vehicles may pass through other mixing centers 26 at
Fostoria, Ohio, Kansas City, Kansas, or Chicago, Illinois, where the railcars
may
be attached to other trains if necessary. The arrows represent rail routes
from the
origin plant groupings to the parent mixing center, and on to other mixing
centers.
Fig. 4 represents vehicle transport outbound from the mixing centers 26 of
the network 20 for the example of Fig. 3. The arrows represent rail routes
from the
mixing centers to a large number of destination ramps 27. As shown, trains may
stop at intermediate destination ramps to drop rail cars, or split at a
destination
ramp so that the resulting trains can take different routes to more distant
destination ramps.
Fig. 5 is a diagram of the basic vehicle flow Z 00 through the distribution
network 20. The process begins at block 101, when dealers place orders for
vehicles. At block 102, a manufacturing plant 25 produces and releases a
vehicle,
which may be put on hold, such as a quality defect hold delaying
transportation of
the vehicle. An inquiry whether the vehicle is being held is made at block
103. If
so, the vehicle will be held for an indefinite time at block 104 until the
quality or
other problem is resolved. The released vehicles are placed in a lot pending
transport. If it is determined at block 105 that the lot's parking capacity is
exceeded, the vehicle is moved into an overflow parking lot at block 106. At
block
107, it is determined whether the vehicle will be shipped directly to a nearby
dealer
or to a long distance destination. If to a nearby dealer, the vehicle is
loaded at
block 109, after a dwell time at the manufacturing plant represented by block
108,
onto a car hauler 28, which transports the vehicle to the dealer for unloading
at
block 110.
If the vehicle must travel a multi-segment lane, then at block 111 it is
determined if the mode of transport will be by train 23. If so, it is loaded
onto a
rail car at block 112. If not, it is loaded onto a car hauler 28 at block 113.
At
block 114 it is determined whether the transport device is bound for a mixing
center 26. If so, the vehicle is transported over a transit time represented
by block
114 to a mixing center 26. At block 115, it is determined whether, in the case
of
-19-
CA 02401555 2002-08-21
WO 01/65454 PCT/USO1/06652
rail transport, the vehicle's railcar must be unloaded, or whether it will
bypass the
mixing center. If unloading is required for one of the vehicles on the
railcar, the
railcar will be unloaded entirely over a time represented by block 116. Then
at
block 117 it is determined whether the vehicle is bound for a dealer near the
mixing center. If so, at block 119 the vehicle is loaded, after a dwell time
in a car
hauler parking lot at the mixing center represented by block 118, onto a car
hauler
28, which transports the vehicle to the dealer for unloading at block 120.
If the vehicle does not fit in the main parking lot for another intermediate
lane segment, as determined at block 121, the vehicle is parked in an overflow
lot
at 122. From either the main or overflow lot, the vehicle's mode of transport
is
determined at block 123. If the vehicle will travel the next lane segment by
car
hauler, then it is loaded on a car hauler at block 124. If the vehicle will
travel the
next lane segment by rail, then it is loaded on a railcar at block 124. In
both cases
(and in the case of a vehicle on a railcar that was not unloaded following a
mixing
center dwell time represented by block 126), the vehicle is transported to a
destination ramp 27 over a transit time represented by block 127. The vehicle
is
unloaded from its transport device at block 128. After a dwell time
represented by
block 129, the vehicle is loaded at block 130 onto a car hauler 28, which
transports
the vehicle to the dealer 29 for unloading at block 131.
Returning to the determination at block 114, if the transport (car hauler or
railcar) is bound directly to the destination ramp 27, then the vehicle is
transported
to the destination ramp over a transit time represented by block 133. The
process
then proceeds to block 128 and continues as described above until the vehicle
is
unloaded at the dealer.
An optional consolidation hub 25c associated with the origin point 25 is
shown in Fig. 6. In this embodiment, the vehicles produced at a grouping of
nearby origin plants 25a are driven or transported by car hauler to the hub
25c
rather than being loaded on railcars at the individual plants. On arriving at
the hub
25c, the vehicles are presorted into lines 25d according to destination point
for the
initial segment of the vehicle's delivery lane. Each line 25d leads to a
railcar
loading dock 25e, from which the vehicles in the line will be loaded onto the
railcars of a train 23. As a result of the presorting, most of the railcars
leaving the
consolidation hub 25c will be LTD railcars 23a.
-20-
CA 02401555 2002-08-21
WO 01/65454 PCT/USO1/06652
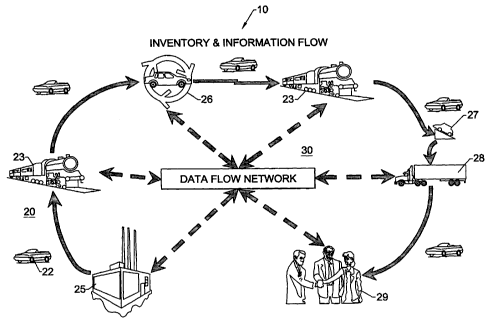
The data flow network 30 is shown diagrammatically in Fig. 7. An intranet
32, shown as surrounded by a plain dashed line, is maintained by a network
management team 31 (see Fig. A31), which preferably is the same entity that
employs the team of managers noted above. The intranet 32 includes a tracking
system component 34, a planning tool component 36, and a simulation tool
component 38. The intranet 32 receives input data from various external
sources
(described below) via a data communications interface 40, which may be, for
example, an electronic mailbox.
Components within the intranet send output data to a plurality of
workstations 42, which may be a "thin client" accessible from the intranet or
from
the Internet. The workstations 42 may be portable computers used by members of
the team of managers at any of the network facility points. Remote connection
can
be a dial-up modem connection, or via the Internet. Components within the
intranet
also send output data to a manufacturer's production scheduling system 44. As
explained below, in a preferred embodiment of the vehicle delivery system 10,
feedback of information from the distribution network 20 and the data flow
network 30 is used to schedule production of vehicles to produce level
distribution
of the product as it enters the delivery network, and to respond to output
requirements of the transportation of the vehicles to market. This principle,
referred to herein as "geographic build," reduces or eliminates large daily
fluctuations in distribution which can occur in the first stages of the
distribution
network. Level distribution evens out the demand for staffing, equipment, and
power in the distribution network.
In alternative configurations, any appropriate external communications
system may be utilized for input to and output from the intranet 32; for
example:
electronic mail, the Internet, an extranet, dial-up modem connection, or a
private
data communications network.
The tracking system 34 includes a tracking database 50 containing status
information on all aspects of the distribution network 20, and related
software.
This status information is received via the interface 40, from three main
sources:
vehicle manufacturers data 52, including production schedules, when actual
production of a V1N begins, and when each VIN is released; railroad data
sources
54, including scanners for reading encoded symbols on VINs and railcars, and
-21 -
CA 02401555 2002-08-21
WO 01/65454 PCT/USO1/06652
terminals for manually sending information on the time planned events and
unplanned disruptions occur; and car hauler data sources 56, similar to the
railroad
data sources. The tracking system also receives V1N routing information from
the
planning tool 36. The purpose of the tracking system 34 is to provide full
visibility
of the status of the distribution network to the management team, to assist
the
manufacturers with geographic build efforts, and to provide status and
statistical
information needed by the planning tool 36 and the simulation tool 38.
The planning tool 36 includes a planning database 58 containing data
received from the tracking database 50, from the simulation tool 38, and from
a
work station 59, and related software. The tracking system provides actual
collected data on VIN status and elapsed transit times. The simulation tool
provides routing evaluations for upcoming planned VINs. The workstation 59
allows a user to select routes for upcoming VINs and to input origin and
destination information as well as time in transit standards. This information
is
available to the management team through the tracking system, which receives
routes, standards, and the like from the planning database 58.
The simulation tool 38 provides an operational/strategic planning tool that
will allow the system and its managers to analyze the vehicle distribution
network
each day as well as look out a number of days into the future to determine if
20 bottlenecks will appear in the network and where they will occur: In
addition, this
tool provides the ability to test changes to the existing vehicle
distribution. network
"off line" to determine what changes should be made to the network and the
impact of making those changes. The simulation tool 38 includes a simulation
database 60 stored in two formats, a format unique to the simulation engine
being
used, such as Arena. and a spreadsheet format, such as Microsoft Excel format.
The simulation database contains input data needed to run the simulation
engine
being used, obtained from the tracking database 34 via the planning tool 36,
and
from users via an Excel interface 62, which can be used to modify the delivery
network parameters to study the effect of modifications on the efficiency of
the
delivery network. Simulations are run on a simulation workstation 64 on which
the simulation program is loaded. Details of the input data required for a
simulation and of the analytical output obtained are described below.
-22-
CA 02401555 2002-08-21
WO 01/65454 PCT/USO1/06652
Referring now to Fig. 8, a concept diagram of the data flow network is
shown. The tracking system 34, planning tool 36, simulation tool 38, and a
payment application 70 provide input to a central data store 72. The tracking
system receives input data from the data feed 40 as well as from the
workstations
42. The planning and simulation tools receive data inputs 61 representing the
various inputs described above. The payment application receives input 71,
which
may include payment applications from carriers, contractors, and suppliers, as
well
as work confirmation data from the delivery network. The central data store 72
is
utilized to generate many reports useful in operating and assessing the
delivery
system 10. These include management reports 74, network planning reports 75,
operational reports 76, customer reports 77, dealer reports 78, and buyer
reports
79.
In a preferred embodiment of the system 10, members of the management
team 31 or appropriate personnel of the entities operating the network may be
equipped with data acquisition terminals that are capable of capturing
signatures.
Such terminals may be used to obtain the signature of a person accepting a VIN
at
the end point of any lane segment, and particularly the signature of a dealer
on
accepting final delivery of a VIN. By conventional means, the signature data
may
then be uploaded to the tracking system database 50 or to another data storage
location. The management team or vehicle manufacturer may then access the
signature data as proof of delivery, and release payment to the carrier who
obtained
the signature.
TRACKING SYSTEM
The vehicle tracking system 34 tracks vehicles of the automobile
manufacturer in the automobile manufacturer's distribution network 20. The
vehicle tracking system 34 provides information about the location of vehicles
22
of the automobile manufacturer at certain points in the automobile
manufacturer's
distribution network. As discussed elsewhere in this application, the
automobile
manufacturer's distribution network 20 is divided into Zones, which contain
many
Areas, and each area may contain many Ramps. There are several types of ramps
including factory ramps, mixing center ramps, and destination ramps. The
invention has determined that various types of managers associated within this
-23-
CA 02401555 2002-08-21
WO 01/65454 PCT/USO1/06652
distribution network will be given summary level access to shipment data
typically
based on a time window for a group of vehicles as they progress through the
distribution network.
The vehicle tracking system 34 can provide shipment visibility down to a
specific V1N within the automobile manufacturer's distribution network.
Shipment
visibility pertains not only to the ability to locate individual VINs, but
also
includes the ability to determine the expected arrival time of that VIN at
various
locations along its delivery route. Shipment visibility also includes the
capability
to view the VIN in conjunction with a number of other VINs within a variety of
"views". For example, a dealer can view all of the VINs which are en route to
his
facility, or the Dealer can view only the VINs which are expected in the next
week
or day. This visibility can be accomplished via the web or other suitable
networks
such as LANS, WANS, or other electronic networks.
On the specific VIN level, all tracking data associated with a particular VIN
can be viewed, including not only historic data relating to past delivery
tracking
data, but also anticipated delivery scheduling. This is an important feature
of the
invention in that it allows for "pull"-type management (discussed elsewhere)
by
allowing management several days ahead in which to arrange for and anticipate
incoming delivery, or to divert delivery along different routes if upstream
~ bottlenecks or impediments are discovered or known. It should be understood
that
other selected and/or predetermined time periods such as shifts, etc., could
be .
substituted for days in the previous sentence.
A VIN Detail View allows for review of the particular specifications of the
particular V1N.
Views showing specific VIN level detail or views showing more than one
VIN can be provided as output by the vehicle tracking system 34 depending upon
the needs and authorization of the user. As previously noted, the automobile
manufacturer's distribution network is divided into Zones, which contain many
Areas, and each area may contain many Ramps, and there are several types of
ramps including factory ramps, mixing center ramps, and destination ramps.
Thus,
a variety of users are associated along this network, including but not
limited to:
Dealers
-24-
CA 02401555 2002-08-21
WO 01/65454 PCT/USO1/06652
VP Managers
Zone Managers
Area Managers
Ramp/Supervisor Managers
These individuals have certain tailored views which they can access
through the Tracking System 34. Other views are also available for other
entities
such as Administrators, Data Archivers, and Maintenance.
A variety of reports are also available, including Expediting Reports and
Planning Reports. Expediting Reports include Critical VIN, Aged VIN, No Start
VIN, and Jeopardized Delivery VIN reports. Some of the Planning Reports
include Origin Ramp reports, Pass Through Car reports, and Mixed Car reports.
A
search capability of also available.
The vehicle tracking system 34 is facilitated by the use of software running
on hardware and includes data input and output ports. Data is input into the
vehicle tracking system 34 through any of the number of ports, and data is
output
from the system through another number of ports. Data input can be in the form
of
new or updated data, provided by a data source system such as the automobile
manufacturer's event occurrence database, or another suitable data source:
It should readily be understood that the vehicle tracking system 34 may be
considered a "module" for operation within a larger system environment, in the
present case within the transportation system 10 of the present invention.
For purposes of further discussion, certain terms and their definitions are
now provided.
Term Definition
Actual Date The date that the event has actually occurred. In Phase I, this is
provi~
from data from the manufacturer's legacy computer system (hereinaft
"Legacy").
Alert A proactive notification of a specific event occurrence or non-occurre
an event within its tolerance windows
-25-
CA 02401555 2002-08-21
WO 01/65454 PCT/USO1/06652
Term Definition
Alternate Lane A change in the routing regardless of time of validity of that
routing that
applies to any vehicle (VIII that has not dropped into a transportation
network. (In Phase I, prior to Legacy 1B Factory Release.)
Carrier Any provider that transports a vehicle: car hauler, rail provider,
etc. Also
known as Vendor.
Legacy A system operated by the automobile manufacturer
that supplies data to the
vehicle tracking system 34.
DestinationA Destination Ramp is the final facility through
which a vehicle passes
Ramp prior to delivery to the dealer. Destination Ramps
are predominately
inbound railyards where trains from the Mixing
Center or Plant are
unloaded and then loaded onto car-haulers for
delivery to the dealer.
Destination Ramps can also be located at the Plant
or Mixing Center as a
consolidation point for vehicles that are to be
delivered locally. See also
Mixing Center, Origin Ramp.
Dwell Time The waiting time after release or unloading at
origin ramp, mixing center,
ramp, or other transportation facility prior to
departure from that facility.
Lane A unique combination of ultimate origin, destination,
transit time and mode
of transport. A lane consists of a combination
of segments.
Location Location refers to the ramp, lane or other place
where the event is planned
to take place or actual occurs.
Mixing CenterA Mixing Center (4 total facilities) is a hub
used for consolidation (unload
and re-load) of vehicles coming from multiple
origins onto railcars for like
destination ramps. Additionally, Mixing Centers
take pure railcars (Load to
Destination Ramp) from multiple origins and build
trains going to the
Destination Ramp. The Mixing Center can also take
vehicles from these
origins that are destined for local dealers and
load them out for delivery via
over the road car-haul operations. There are presently
four (4) Mixing
Centers in the network: Kansas City, Chicago,
Shelbyville (K~, and
Fostoria (Oh).
Origin RampOrigin ramps are located at the factory or plant.
Planned The date that the event is projected to occur
Date based on the information
originally provided by the automobile manufacturer.
In Phase I, this is
derived from the Legacy 1A record.
Ramp Refers to a location. Origin ramps are at the
plant. A Destination Ramp is
the final facility through which a vehicle passes
prior to delivery to the
dealer. See also Destiytatioh Ramp, O~igi~z Ramp,
Mixiytg Center.
Region A geographical area as defined by the Delivery
Logisitics Company.
-26-
CA 02401555 2002-08-21
WO 01/65454 PCT/USO1/06652
Term Definition
Revised Date The date that the event is expected to occur based on the actual
information.
In Phase I, this information is derived from information provided by The
Automobile Manufacturer's Legacy system.
Segment A segment is a portion of a lane that is defined by a specific origin
and
location. Specific (planned and unplanned) events occur along segments.
Vendor Any provider that is contracted to transport a vehicle: car hauler,
rail
provider, etc. in the network. Also known as Carrier.
VIN The Vehicle Identification Number is the unique number assigned to a
vehicle. It is a federally required identifier unique to every vehicle
. manufactured in the United States (and Canada). Each VIN consists of a
series of numbers and letters, each representing a particular field of
information, such as manufacturing site, model type, engine size, etc. This
is standard terminology used whenever referencing a vehicle, car, truck, or
automobile.
Tracking System 34 -First Embodiment
This embodiment may also be referred to as "Phase I".
As noted before, the vehicle tracking system 34 (Fig, 9) tracks vehicles 22
(Fig. 1) in the distribution network 20 of the Automobile Manufacturer. The
vehicle tracking system 34 provides information about the location ofvehicles
22 ~..
of the Automobile Manufacturer at certain points in the Automobile
Manufacturer's distribution network 20. The vehicle tracking system 34 could
be
seen as part of the data flow network 30.
The automobile manufacturer's distribution network 20 is divided into
Zones, which contain many Areas, and each area may contain many Ramps. There
are several types of ramps including factory ramps, mixing center ramps, and
destination ramps.
Several types of managers will require summary level access to shipment
data typically based on a time window for a group of vehicles as they progress
through the distribution network 20.
In one embodiment, the vehicle tracking system 34 application will receive
vehicle manufacturers data 52 from a tracking event database provided by the
automobile manufacturer (in one embodiment through the automobile
-27-
CA 02401555 2002-08-21
WO 01/65454 PCT/USO1/06652
manufacturer's legacy system, hereinafter "Legacy" system), imports it and
then
provides an web format view of the data via the Internet. The objective of
vehicle
tracking system 34 is to provide shipment visibility down to a specific VIN
within
the automobile manufacturer's distribution network 20. The vehicle tracking
system 34 adds value to this data by proj ecting and tracking shipment status.
The following data views are included in the first embodiment: Dealer
View, Ramp View, and Lane View
Data for the first embodiment is supplied by the automobile manufacturer's
Legacy system, which is discussed elsewhere in this discussion.
Functions which are not in the scope of the first embodiment of Vehicle
Tracking System 34, but may be included later, include:
~ Alarms and Alerting
~ Lane Maintenance Screens
~ Car Hauler View
~ Rail Hauler View
~ Enhanced Security
~ Carpoint / XML support
~ Factory Manager View
Data sources other than Legacy also are not be used in the first embodiment
with the exception of holds.
Users of this application include a team of managers working as a
management team 31 that will work with the automobile manufacturer to manage
the Automobile Manufacturer's distribution network 20. The application is
accessible to these users via the Internet. Users will include area, ramp and
lane
supervisors and planners whose activities will include all facets of managing
the
network, including daily movement of vehicles, contingency planning,
notification
and response, short-range and long-tern planning.
For reference purposes, certain of these managers of the management team
31 are now referenced:
-28-
CA 02401555 2002-08-21
WO 01/65454 PCT/USO1/06652
Position Description
Region DivisionThe Region Division Managers are responsible for
all activities and
Managers results within their defined regions of operations.
Their responsibility
will primarily consist of carrier management in
the field, insuring that
the requirements of the network are met in each
segment or lane of
transit. They are responsible for activities at
varying types of
locations; plants, mixing centers, and destination
ramps. The Region
Division Managers are expected to develop working
relationships with
those earners assigned business at each location.
Additionally, they
are expected to serve as contact point for all
matters in the field
relating to the delivery of new vehicles. This
will involve establishing
lines of communication and a presence before dealers
and carriers.
Activities will include the following:
Carner performance reviews: daily, monthly, quarterly
as required
Auditing: facilities, vehicle handling, paperwork,
cost accounting,
personnel
Planning sessions
Dealer visits
Cost control and review
Quality programs and enforcement
Area Managers The operating Area Managers are responsible for
all activities and
results within their defined areas of operations
-- one assigned per
mixing center, and assignment by geographic definitions
(including
assembly plants, lanes and segments, and the associated
territory
served.) Their responsibility will consist of executing
the plan through
carrier management in the field, insuring that
the requirements of the
network are met. At plant locations, additional
responsibilities will
include vehicle entry into the network per a planned
earner mode;
distribution and flow plan, and building trains
according to blocking
schedules as required by the rail network to feed
the mixing centers.
The Area Managers are expected to develop working
relationships
with those carriers assigned business at each location.
Additionally,
they are expected to serve as contact point for
all matters in the field
relating to the delivery of new vehicles.
Activities will include the following:
Daily contact with operations and network planning
Carrier performance reviews: daily, monthly as
required
Planning sessions
Dealer visits
Cost control and review
Quality programs and enforcement
-29-
CA 02401555 2002-08-21
WO 01/65454 PCT/USO1/06652
Position Description
Planning & The Planning & Systems Division Managers are
responsible for
Systems Divisionsupporting the operators and all activities
and business elements
Managers related to the joint venture. The positions
are aligned with the two
zones dividing the operation into geographic
areas of responsibility.
The activities and business elements will encompass
all facets of the
operations, including daily movement of vehicles,
contingency
planning, notification and response, short-range
and long-term
planning, efficiency studies.
Southwest Zone
Systems/IS
Tracking and Contingency
NorthEast Zone
Empty Rail equipment
This alignment of functional differences was
enlisted to distribute
areas of responsibility equally between the
two groups, while
providing for a central location for decision-making
and coordination.
Activities will include the following:
Daily network performance monitoring
Volume proj ections
Statistical performance tracking and analysis
Equipment positioning and balance
Systems maintenance (IS)
Contingency planning and implementation
Exception tracking
Data Table maintenance
' Network Optimization
Forward model planning
Facilities planning and design
Planning, both short-range and long-term
Simulation model production and processing
The vehicle tracking system 34 has been developed using known web
development techniques. One embodiment includes a web-based application
server and an Oracles database. The web server hosting this application can be
an
industry standard Sun SolarisTM based web server. An Oracles database server
running under HP-UXTM can anchor the application. However, other hardware
configurations can be used without departing from the spirit and scope of the
present invention. More details on such hardware are provided elsewhere in
this
application.
- 30-
CA 02401555 2002-08-21
WO 01/65454 PCT/USO1/06652
Vehicle TYacking System Eve~ats Used With Tracki~ag System 34
As noted above, the vehicle tracking system 34 (see Fig. 9) is configured to
"track" vehicles as they pass though the distribution network 20. In one
embodiment this tracking is done at least partially by the use of certain
events
which are captured and subsequently reported. Events that are captured and
reported on by the vehicle tracking system 34 in Phase I include but are not
limited
to the following:
Event Source of Data
1.Vehicle Forecasted Legacy 1J
2.Production Begins Legacy IA
3.Vehicle Released Legacy 1B
4.Loaded onto Rail Car Legacy 1C & 1D
5.Unloaded from Rail Car Legacy 2A & 2B
6.Vehicle Arrives at DestinationLegacy 2A & 2B
7.Rail Switch-OutlCar HaulerLegacy 3C
De art
I Vehicle Delivered Legacy 3A - "F" if field 28
8.
9.Vehicle Put on Hold Legacy & Vehicle Tracking System
Data
Entry
Production forecasts are used by the vehicle tracking system 34 to establish
that a vehicle will require transportation to a dealership or a customer. .
Plant
release data is used to establish that a vehicle has been produced and is
ready for
transportation. Routing and transportation data are used to determine if the
vehicle
is being transported in a time frame consistent with the standards established
for
the route and routing.
It should be understood that the above events are not necessarily in order;
for example, vehicles can be put "On Hold" at any point along the distribution
network 20.
As discussed elsewhere, a wide variety of users can place the vehicle "On
Hold".
For reference purposes, the following is a restatement of various
previously-discussed data entities and terms used relating to the distribution
network 20.
A lane is a unique combination of ultimate origin, destination, transit time
and mode of transport. A lane consists of a combination of segments. A segment
-31-
CA 02401555 2002-08-21
WO 01/65454 PCT/USO1/06652
is a portion of a lane that is defined by a specific origin and location.
Specific
(planned and unplanned) events occur along segments. Origin ramps are at the
assembly plant. Destination ramps are the final facility through which a
vehicle
passes prior to delivery to the dealer. Origin ramps are at the plant.
A carrier or vendor is any provider that transports a vehicle such as a car
hauler, rail provider, etc.
The date that and event has actually occurred is referred to as the Actual
Date. The Planned Date is the date that the event is projected to occur based
on
the information originally provided by the automobile manufacturer. The
Revised
Date that the event is expected to occur based on the actual information.
Location refers to the ramp, lane or other place where the event is planned
to take place or.actually occurs. '
Data Sources
In the first embodiment of the invention (Phase I), the primary source of
data for tracking vehicles in the distribution network 20 is manufacturer's
data 52
which can include an events database of the automobile manufacturer system,
which may be referenced as Legacy. Legacy data is comprised of production
forecasts, plant release data and routing and transportation data. Legacy data
can
also be used to facilitate the payment of Garners and to facilitate other
functions as
described elsewhere in this application.
The Automobile Manufacturer's Legacy Data
The automobile manufacturer can provide Legacy records bearing
exemplary names such as "1J" and "1A" to the Tracking System 34. Carrier
Legacy records can be picked up by the management team Delivery from the
automobile manufacturer's EDI mailbox. Order in which records are received may
not correspond to chronological order. Such item names and characteristics are
for
example only; other formats of other data sources could also be used without
departing from the invention.
-32-
CA 02401555 2002-08-21
WO 01/65454 PCT/USO1/06652
RecordDescription of Part of RecordHow Used by the Vehicle Tracking
Relevant to the Vehicle System 34
Tracking
S stem 34
1J Reports on advance shippingUsed to initialize vehicle
notice data in the
provided 4 days before completionvehicle tracking system 34,
of "Vehicle
vehicle assembly. Includes:Forecasted" event
VIN
Origin Planned dates are calculated
for subsequent
Destination events for each vehicle based
on the Route
Route Code Code.
The automobile manufacturer
uses this
record to plan segments
and costs. In
Route Code table, N = Normal,
P =
Preferred, only one route
code is
active. Origin/Destination
Pair and
mode determine route code.
1A Produced 4 days before vehicleReports on "Production Begins"
leaves
production. event"/"Invoiced (Search)"
Includes:
VIN Subsequent events and their
associated
Origin dates are determined. .
Destination
Used to initialize vehicle
data in The
All carriers receive 1A Vehicle Tracking System if
record, not all 1J not
want to receive 1J record received.
from the
automobile manufacturer. Subsequent events and their
associated
dates are determined using
OID pair
Without Route Code.
1B Reports on plant release Used to indicate "Vehicle
of vehicle. Released" event
Includes'. has occurred and actual release
date.
VIN
Origin Revised event dates are calculated
if actual
Destination release date is different
than planned
Release Date release date.
Currently, a 1B can be sent
for a
vehicle that is not shippable.
The
automobile manufacturer
has plans to
make "released" _ "shippable".
The
automobile manufacturer's
QLS
system has information about
holds.
-33-
CA 02401555 2002-08-21
WO 01/65454 PCT/USO1/06652
RecordDescription of Part of RecordHow Used by the Vehicle Tracking
Relevant to the Vehicle System 34
Tracking
S stem 34
1C Reports a rail switch-out Used together to determine
-- that a if a vehicle is
1D vehicle has changed rail loaded at a mixing center:
Garners.
These records associate
the VIN to a
rail car. Used for "Loaded onto Rail
Car" event
first time received.
1 C - Railcar Header Record.Used for "Switchout Event"
after first
1D - Provided for each vehicletime received.
shipped on a railcar, has
railcar id
Revised event dates are calculated
if actual
release date is different
than planned
release date.
2A The convoy carrier submits System 34 will assume that
this at the the activity
destination ramp to signifytook place at the point identified
the VINS in the
have been unloaded and are standard routing and 'calculate
available accordingly
to the convoy carriex. to produce information for
the "Unloaded
from Rail Car" event.
Indicates that rail cars
have changed
trains. Revised event dates are calculated
if actual
release date is different
than planned
Normal arrival... release date.
2B The convoy Garner will send
in a 2B if
there is a correction to
the 1C/1D.
Example: A VIN reported '.
to be on the
railcar but wasn't, instead
there was a
different VIN. 2B adds and
deletes
VINS from the Consist
transmission(1C/D). The
2B will have
all the fields a 2A would
have plus the
"A" for add or "D" for delete
and the
VIN associated
with the action code.
2C The 2C is sent by the GarnerRepoxts arnval of a rail car
when for which
there is an arrival of a switchout not xec'd.
railcar for
which a switchout was not
received.
When received, Legacy will
send a
1 C/1D back to the carrier.
2D One record for each vehicle
on the
railcar reported in the
ZC.
- 34 -
CA 02401555 2002-08-21
WO 01/65454 PCT/USO1/06652
Record Description of Part of How ><Ised by the Vehicle
Record Tracking
Relevant to the Vehicle System 34
Tracking
S stem 34
3A Reports on delivery to Used to indicate "Vehicle
dealer or final Delivered" event
destination (customer). has occurred and its date.
Normal
movements.
Revised event dates are calculated
if actual
This transaction will haverelease date is different
a "F". "R", than planned
or a "T" in field 28. release date.
F = a final delivery to
dealer.
T = a convoy move for a 3A-F - "Vehicle Delivered
ramp to to Dealer"
ramp
R = Refused by the dealer.Can be used for "Unloaded
from Rail Car"
-- because the vehicle has
been dispatched
via convo carrier.
3B Reports on diversions directedWill be used to indicate exceptions.
by the . .
automobile manufacturer.
These
include: reduced move to
dealer,
return to ramp; any diversion
to
location or dealer other
than the one
desi ated in IB or 1D.
3D Reports on convoy dispatch.Can be used for "Unloaded
from Rail Car"
-- because the vehicle has
been dispatched
via convoy caiTier.
4A Reports on changes to vehiclePlans are to use this record
status, to report on
including exceptions such exceptions that affect vehicle
as in-transit tracking.
repair, removed from networkAny exceptions that do not
to affect time in
storage, etc. Also includestransit are ignored.
payment
information.
As shown in Fig, 7, Legacy data 52 from the vehicle manufacturer and
vendors (carriers) can be sent through interface 40 to the vehicle tracking
system
34 In one embodiment, a "mailbox" is used as an intermediate repository to
facilitate such transfer, with appropriate security such as firewalls in place
as
known in the art. The vehicle tracking system picks up this data at regular
intervals.
Views
The vehicle tracking system 34 functionality includes various views for
querying, administrating, and reporting on vehicle tracking data:
All views will contain several multiple web pages with hyperlinks to such
functions as search, description, and reports.
The views contained described in this section may be readily accessed from
all user types:
-35-
CA 02401555 2002-08-21
WO 01/65454 PCT/USO1/06652
1) Vehicle Summary View
2) Unit Breakdown (a.k.a., "Model Summary") View
3) Vehicle Tracking (a.k.a., "Status Details") View
4) Vehicle Detail View
The Vehicle Summary View is a list of vehicles based on the location of
the user and time requirements of the view. Selection of a vehicle displays
the
vehicle detail view. Selection of a vehicle's status summary displays the
vehicle
tracking view. The Vehicle Summary can include the following:
~ VIN
~ Vehicle model
~ Model Year
~ Planned date of arrival at location (depending on user view)
~ Revised date of arnval at location (depending on user view)
Current location of the vehicle
~ On-schedule indicator (i.e., status lights: green = on time, yellow = one
day late, red = 2 or more days late)
The Unit Breakdown (a.k.a., "Model Summary") view contains a listing of
the following information for the selected user view:
Model Name Models for selected user view
Quantit uantity of Models
Vehicle Summary Hyperlink to Vehicle Summary View
Reference is briefly made to Fig. 20, which shows an Unit Breakdown
(a.k.a., "Model Summary") view.
The Vehicle Tracking (a.k.a., "Status Details") view, in one embodiment,
contains a summary of shipment activity (status details) for the selected
vehicle:
Event Descri tion of event
Location Location where event has taken or
will take lace
Planned Date Planned date for the event
Revised Date Revised date for the event (if a
licable)
Actual Date Actual date of the event
Notes An notes re orted about the event
Reference is made to Fig. 22, which shows an exemplary Vehicle Tracking
(a.k.a., "Status Details") view.
-36-
CA 02401555 2002-08-21
WO 01/65454 PCT/USO1/06652
The Vehicle Detail View, in one embodiment, contains a detailed
description of the selected vehicle, including information such as the
following:
~ Model Name
~ VIN
~ Make (Manufacturer)
~ Line & Series
~ Model Year
~ Body Type
~ Chassis Type
~ Engine Details (Cylinders, Litres, Net Brake HP, Fuel)
~ Miscellaneous (Restraint, System)
View.
Reference is made to Fig. 27, which shows an exemplary Vehicle Detail
The Advanced Query View (not shown) contains that allow the user to
search for a vehicle by selected criteria. The search criteria include VIN,
model;
model year, date range and status (e.g., forecasted, released from plant,
invoiced).
The Holds & Damages View (not shown) allows the user to assign &
remove hold statuses to a given vehicle. The user is able to assign a damage
code
to a given vehicle.
The Lane Summary View provides the user with a list of areas that are
included in the user's lanes. In the Lane Summary View, the user will see a
listing
of the following:
Date Date for events associated
with
lane
Quantity Quantity of vehicles
associated
with that date and lane
Unit Breakdown A hyperlink to the Unit
Breakdown for this date
and lane
(a list
Vehicle Summary A hyperlink to the Vehicle
Summary for this date
and lane.
The Ramp Summary View shows the same elements as the Lane Summary
View within the user's assigned Ramp(s).
The Ramp Supervisor View shows the same elements as the Lane
Summary View for the Ramp Supervisor's assigned Ramp(s). This view can be
for 2 days out. It can include the following information for the Ramp:
~ Hours of operation
~ Days of operation
~ Holidays
~ Comrnents/Notes
-37-
CA 02401555 2002-08-21
WO 01/65454 PCT/USO1/06652
~ Contact Name
~ Contact Telephone
FIPS Code
The Dealer Summary View shows the same elements as the Lane Summary
View for the user's assigned Dealers.
Administration Views allow for the maintenance of Users, Areas, Dealers,
Lanes, Ramps, Regions, and Vehicle Holds.
Adding, changing and deleting users and assigning access rights is
performed using the User Account Setup view. This view allows for entry of the
following elements to create a New User:
Element Descri tion
User to 'n ID: User's Login ID
User name: User's FuII Name
Chan a assword User-Selected Password
to:
User email: User's email address
User pager: User's pager number
After entering the new user, the user will use the Add New Permissions
link to display the Permissions Maintenance Page. This page displays the
following:
To level ermissions Add/Remove
Permissions
a 'on area ram ennissions addermission emoveennission
Dealer ermissions addermission emoveermission
ane ermissions addermission emoveermission
dmin ermissions addermission emoveennission
These hyperlink functions do the following:
Element Descri tion
Region, area, ramp Left link to select specific regions
permissions or right link for
all
Dealer Left link to select specific dealer
or right link for all
Lane Left link for selected lanes or
right link for all
Admin Access to administrative function
based on user
role
Remove Permission Link to remove the permission next
to which it
a ears
Back to User PermissionsLinks to add User Permissions List
List Pa a
-38-
CA 02401555 2002-08-21
WO 01/65454 PCT/USO1/06652
Administrative Permissions are assigned based on the user's job
requirements for Region(s), Area(s), Ramp(s), lane(s), Dealer(s), and/or
Hold(s):
Access To Admin Functions_ Add_ /Remove
Permissions '
sers add ermission
a 'ons add ennission
eas add ennission
am s add ermission
apes add ermission
ehicle Holds add ermission
eaters add ermission
The "add permissions" link (links are in underline) is a link to assign new
permissions to the user.
An "Update User" function allows for changing user information or
deleting users a search function will allow the administrator to locate a user
by user
id or name.
Searching can be by either:
~ User ID (blank for all)
~ User Name (blank for all)
A list of users which meet the above search criteria are displayed.
User ID User Name Permissions Remove
User ID serl First Userl edit ermissions delete user
1 Last
ser >D ser2 First User2 edit ermissions delete user
2 Last
ser ID sera First User3 edit ermissions delete user
3 Last
ser 1D ser4 First User4 edit ermissions delete user
4 . Last
ser ID ser5 First Users edit ermissions delete user
5 Last
A hyperlink can also allow for deletion of the user.
Changing permissions can also be done. Depending on the permissions
assigned to the user id, the Add/Remove column will show either add permission
(permissions not assigned for all) or remove permissions (permissions assigned
for
all).
To level ermissions Add/Remove
Permissions
a 'on area ram ermissions addermission emove ermission
eater ermissions
ane ermissions addermission emove ennission
drain ermissions addermission emove ermission
Editing of permissions can also be done as follows:
-39-
CA 02401555 2002-08-21
WO 01/65454 PCT/USO1/06652
Element Description
Region All or selected re ions can be assi ed
based on user role
Dealer All or selected dealers can be assigned
based on user role
Lane All or selected lanes can be assigned
based on user role
Admin Access to administrative function based
on user role
Remove PermissionLink to remove the ermission next to
which it a ears
Add New Links to add Permissions Maintenance
Permissions Page
The administrator is able to remove permissions using a Remove
Permission links) or add permissions using an Add Permissions link.
Depending on the permissions assigned to the user id, the Add/Remove
column will show either add permission (permissions not assigned for all) or
remove permissions (permissions assigned for all).
Access To Admin Functions Add/Remove
Permissions
sers addermission emoveermission
egions addermission removeermission
eas addermission removeerrnission
am s addermission emoveermission
anes addermission emoveermission
ehicle Holds addennission emoveermission
Balers addermission emoveennission
The Area Maintenance view provides the capability to add, change and
delete areas.
The Region Maintenance view provides the capability to add; change and
delete regions (zones).
The Lane Maintenance view provides the capability to add, change and
delete lanes, and define the segments per lane. In segment maintenance,
segments
can be defined for each lane.
For any given segment of a shipping lane, the time in transit can be
modified. The total time in transit for the lane includes the total of the
individual
segment times in transit, plus the following assumptions (in the first
embodiment):
Dwell Time at Plant Ram Assumed to be 1 day
Dwell Time at Destination Assumed to be 2 days
Ramp
Dwell Time at Mixizi Center Assumed to be ? days
Segment Time in Transit User-Defined
-40-
CA 02401555 2002-08-21
WO 01/65454 PCT/USO1/06652
Total Lane Time in Transit = Segmentl Time in Transit + Segment2 Time
in Transit. . .+ Dwell Times at various locations
It, should be noted that dwell time at a Mixing Center varies from 8-24
hours. Dwell times at destination ramps vary.
The Ramp Maintenance view provides the capability to add, change and
delete ramps.
The Dealer Maintenance view provides the capability to add, change and
delete dealers.
The Vehicle Holds view allows the user to place holds by any combination
of the following:
~ Production date
~ Origin ramp
~ Destination ramp
~ ' Engine type
General Screen Navigation
General screen navigation will now be discussed.
Referring now to Fig. 11, the following common functions can appear on
all screens:
Menu Bar Functions (typically at the top):
~ Back (returns from previous page)
~ Home (returns to home screen)
~ Admin (displays administrative screen)
~ Logout (logs user out)
Tool Bar Functions (can be at the left):
~ Reports (displays reports screen)
3S ~ Search (displays screen search)
~ VIN Search (displays VIN search screen)
Reports
The report interface will provide the user with all the potential parameters,
supplied as input to any given report. All user types as part of their
reporting
functionality will share this web page.
Several predefined reports have been identified. They include Expediting,
Planning and Performance Reports.
Expediting Reports include:
-41-
CA 02401555 2002-08-21
WO 01/65454 PCT/USO1/06652
Name Description _Data Elements Included
Critical VIN Reports on events that VIN
Report have
failed to take place . Event (Activity)
as scheduled Date
date. Last Event Completed
Last Car
Last Segment Scheduled
Carrier SCAC
Aged VIN ReportReports on vehicles VIN
for which
there has been no statusEvent
update
indicating that the . Scheduled Event
next event has Date
taken place; reports Scheduled Event Location
is by age
category (72, 48-71, . Segment Carrier
24-47 SCAC
hours) in applicable , Scheduled Delivery
segments Date
No Start VIN Reports on vehicles . VIN
for which a
Report plant release has been . Release Date
received,
but which have not beenDestination Ramp
associated with a rolling. Origin Segment Carrier
stock.
By origin, date of release.. Scheduled Delive
Date
Jeopardized Reports on vehicles . VIN
that have not
Delivery Reportarrived at the destination. Current Segment
ramp as Garner
scheduled, indicating . Car (1C/1D Car)
that the
delivery date may be . New Scheduled Delivery
in
jeopardy. In VIN Order.Date
Completed Days for
Completed Segments
Scheduled Delivery
Date
Planning Reports include:
Name Description Data Elements Included
Origin Ramp ReportReports on a breakdown Destination Ramp
of
the vehicles released V~
or
scheduled to be released Carrier
by
vehicle type that Release Date
have not
been loaded. By destination, Destination
vehicle type or release Scheduled Delivery
date. Date
Total for
D estination/Vehicle
T a
Pass Through Reports on a view Rail Car ID
Car By of
Destination Reportvehicles that do . Carrier SCAC
not require
vehicle unloading Scheduled Arrival
or loading Date
at the mixing center, Origin Ramp
vehicles
scheduled to arrive Destination Ramp
on a
selected date. By
mixing
center by carrier.
-42-
CA 02401555 2002-08-21
WO 01/65454 PCT/USO1/06652
Name Description Data Elements Included
Mixed Car Report Reports on rail carsRail Car
scheduled to arnve . VIN
at the
mixing center that . Carrier
require
unloading. By mixing, oval Date
center
by scheduled arrival, Destination Ram
date.
Reload Vehicle To be determined.
Re ort B Destination
Mixing Center To be determined.
Inbound Re ort
Destination Ramp To be determined.
Re ort B Dealer
Destination Ramp To be determined.
Re ort B Carrier
Vehicle tracking System - Second Embodiment
This section describes the functional requirements identified to date for a
second embodiment of the auto delivery system. These requirements may be
modified in response to changing customer needs.
Items excluded from the second embodiment of the vehicle tracking system
34 efforts but which may be included in additional embodiments include: Car
Hauler View, Rail Provider View, and Consumer View
An enhanced function and view "enhanced dealer view" (not shown) is
used which dealers to locate forecasted or inbound vehicles matching specified
.
criteria. The criteria includes make l model, engine type.
A diversion view (not shown) allows the user to manually define a new
destination for a vehicle. This serves as a notification to The vehicle
tracking
system 34 not to generate an alert when the vehicle isn't delivered as
originally
forecasted. Only a Ramp, Area, or Zone Manager can divert a vehicle.
New data services such as payload tracking information from the railroads
is incorporated into the vehicle tracking system 34 database. At a minimum,
this
information provides location scans on railcars as they travel throughout the
vehicle distribution network.
The car hauler personnel also provide tracking information on VINs as they
transport them to their destinations.
-43-
CA 02401555 2002-08-21
WO 01/65454 PCT/USO1/06652
Alarms and alerts are also possible; under this embodiment the system
generates an email notification based on late arnving or missing vehicles at a
predefined point in a lane.
A lane configuration interface is created that allows the user to
add/change/delete lane segments. Each lane segment origin also contains a user
defined vehicle dwell time.
This interface also allows the user to define shipment lanes by combining
segments, with an origin, destination and method of travel.
A lane shipment notification allows, on a lane by lane basis the user to
define a delivery tolerance that when exceeded generates an email to a
responsible
individual.
A damage notification concept is provided such that when a VIN is
assigned a damage code the system sends an email notification to a damage
manager. This manager is defined at the damage code level.
A hold notification is also provided such that when a VIN is assigned a
hold code the system sends an email notification to a hold manager. This
manager
is defined at the hold code level.
When ramp capacity is exceeded, the vehicle tracking system 34 sends an
alert.
Each ramp has a predefined VIN capacity. When a mixing center is
defined in the vehicle tracking system 34, the administrator provides a
parameter
that defines vehicle dwell time while at the center. On a system wide basis,
the
administrator also defines the number of days in the future to generate this
alert.
The system shall support the definition of ASCII-based reports. These
reports can be downloaded via the web browser and then imported into Excel or
some other Database.
The format of each individual report is determined as the business needs
require.
Under the second Vehicle Delivery System embodiment the holds &
damages view is modified to assign/un-assign holds and damage codes to groups
of vehicles based on commonly used filter criteria; things like current/future
location, manufacturing date, VIN range, make/model, engine type.
CA 02401555 2002-08-21
WO 01/65454 PCT/USO1/06652
Design Specifications
The vehicle tracking system 34 system does the following:
- Stores EDI data feeds into a data feed directory repository
- Processes EDI data in accordance to the Customer's business rules
- Populates an Oracle database with data that is either pulled directly from
the EDI data, or is generated in accordance to the Customer's business rules
- Provides access to the shipment information to users with varying degrees
of access and business interests via a secure Internet application
- Provides the facility for a "logistics manager" user to manage and
optimize shipment routes and logistics
- Provides facility to generate reports for the various users of the system
Fundamental components of the software include:
Database
EDI Processor
Data Processing Engine
Obj ect Library
Applications
Database tables/views/stored procedures and supporting object models and
code, were developed to provide functionality specifically for the vehicle
tracking
system 34 v1. A relational database specific to the vehicle tracking system
34's
requirements was also developed.
Much of the data provided to users vehicle tracking system 34 is derived
from the original EDI data using a "Data Processing Engine". This data
requires
regular processing to determine state of the shipment. For instance, the
"state" of a
shipment (whether it is "late", "on-time", or "early") is derived from the
dates
associated with the generation of lx, 2x, 3x, 4x, "flags/alerts/alarms" is
calculated
on a regular basis, as new EDI data comes in.
To capitalize upon the strengths of the development tools (WebObjects,
Java, Oracle, etc.) an "object library" is created. Objects are software
components
-45-
CA 02401555 2002-08-21
WO 01/65454 PCT/USO1/06652
that are "reusable". The object library would include: reusable web components
(reusable components can be used to render information in the same manner for
different application using a simple APn, Java user interface widgets,
utilities for
paging or faxing data to customers when a problem occurs, utilities for
sharing
data between applications, and so forth.
The main user interface to The vehicle tracking system 34 provides
shipment-tracking information to the ramp, area and zone supervisors. Under
this
interface, data is "read-only". The information displayed secured by logon id
and
password. Search capabilities are provided to locate specific vehicle
information
by VIN, VIN fragment, make/model, Shipment "milestone" dates. This interface
also allows for the display of shipment detail and status, indexed by expected
ship
date, expected arnval date, vehicle Types, etc. Reports can also be obtained
to
provide shipment metrics and/or history.
The "System Admin" interface to The vehicle tracking system 34 enables a
"super user" to add/modify/delete users of the system, set/reset metrics,
performs
database admin duties, etc., as needed.
Monitoring and logging the usage of the system and other metrics is used as
needed for determining usage, loading, and "cost-of operation" of the system.
A conventional computer CPU, memory and disk space according to the
prior art includes ample capacity to host the DBServer process for one
prototype-
type version of the invention. This process would accept queries from the
Webserver, execute the query against the Oracle (ET) DB, and reply with the
results.
Web server utilization according to the present invention can be
accomplished through use of known web server architecture.
Reference is made to Fig. A6 for the Web Track & Trace network
connectivity, which shows how a user Internet browser on a workstation 42 can
access redundant systems through the management team's network user.
Hardware and Software Platforms for System 34
The vehicle tracking system 34 software can be run by use of the following
hardware / software platform support:
-46-
CA 02401555 2002-08-21
WO 01/65454 PCT/USO1/06652
Platform Specific Vendor / Product
Web Server Hardware Sun Microsystems hardware
2-4 250's
Processor Performance: TBD
512 MB RAM minimum
Application Server Hardware Sun Microsystems hardware
2-4 250's
Processor Performance: TBD
300 MB Disk Space
Database Server Hardware (Prototype)Compaq 3000 hardware,
Processor Performance: 200
MHZ dual,
128 MB RAM minimum
Database Server Hardware (Production)As known in the art
Web Server Software Netscape Suitespot Enterprise
Web
Server, Version 3.6 or later
Application Server Software Solaris 2.6 and upwardly compatible
releases
Database Server Software Oracle Database Server Version
8.05 or
later
Secure Socket Layer Software Verisign (Version 3)
Reporting Server Software ReportMill 3.0
Such specifications are for example only and should not be construed as
limiting.
Performance Criteria
Being a web project, the performance of the vehicle tracking system 34
can be more or less arbitrary, however, testing on the current system can be
undertaken to determine the average performance times for the existing system
as a
baseline set of performance specifications. The following are some general
figures, which much be considered as part of the design and acceptance
process.
The following table summarizes user-related numbers:
-47-
CA 02401555 2002-08-21
WO 01/65454 PCT/USO1/06652
PROTOTYPE
Statistic Minimum Maximum
Total Users 0 118
Concurrent Users 0 35
U time 95% 95%
PRODUCTION
Statistic Minimum Maximum
Total Users 6,000 10,000
Concurrent Users 0 1,000
Vehicles 4m Sm
10% growth/year 10% growth/year
Lanes 150 1000
Events 7 er vehicle 10 er vehicle
Status 7 er vehicle 20 er vehicle
Dealers 6,000 10,000
U time 100% 100%
Data related specifications are summarized in the table below:
Statistic (Tables) MAX
Shipment (Vehicles) 142 Bytes
Shipment Status 425 Bytes
Shi ment Event 367 Bytes
User 299 Bytes
Lane 18 Bytes
Dealer 112 Bytes
With these sizes in place, the following statistics can be derived:
Statistic MAX
Shipment Display Set 556 K
(200 record
limit)
Shipment Event Display 28 K
(10 record
limit
Vehicle Tracking System Object Class Hierarchy
Reference is now made to Figs. 14 and 15, which show the object class
hierarchy of the object-based programming structure.
Tlehicle Tracking System Screens
-48-
CA 02401555 2002-08-21
WO 01/65454 PCT/USO1/06652
Various exemplary screen which will be seen by the users will now be
discussed.
The vehicle tracking system 34 screens can be displayed using a Web
browser. The user enters ID and password to login into the vehicle tracking
system
34.
RAMPS & LANES USER'S VIEWABLE RAMPS AND LANES
This type of screen, shown as Fig. 16, displays the ramps and lanes that are
viewable to the user. Standard functions that appear on the top of each screen
include: <back>, <home>, <admin>, and <logout>. This screen also has <reports>
and <search> options, discussed in later detail.
Clicking on a link in the ramps column displays the ramps screen. Clicking
on a link in the lanes column displays the lanes screen.
RAMPS SCREEN: USER'S VIEW > A RAMP IS SELECTED ON RAMPS &
LANES SCREEN
This screen (not shown) displays the details for the ramp selected by the
user. This screen also has <reports> and <search> options. Clicking on unit
breakdown displays the unit breakdown screen. Clicking on the vehicle summary
displays the vehicle summary. screen. These types of screens are discussed in
later
detail.
UNIT BREAKDOWN SCREEN: USER'S VIEW>A RAMP IS SELECTED IN
TABLE>UNIT BREAKDOWN ICON IS SELECTED FOR A DATE
This screen (not shown) displays the details for the breakdown selected by
the user on the previous screen. This screen also has <reports> and <search>
options. Clicking on the vehicle summary displays the vehicle summary screen.
UNIT BREAKDOWN DATE: USER'S VIEW>A RAMP IS SELECTED>UNIT
BREAKDOWN ICON IS SELECTED FOR A DATE>VEHICLE SUMMARY
ICON IS SELECTED FOR DATE
This screen (not shown) displays the details for the unit breakdown selected
by the user. This screen also has <reports> and <search> options. It displays
the
-49-
CA 02401555 2002-08-21
WO 01/65454 PCT/USO1/06652
V1N, Model Year, Expected Arnval Date, Projected Arrival Date, Location and
Status.
VEHICLE DETAIL: USER'S VIEW>A RAMP IS SELECTED IN TABLE>UNIT
BREAKDOWN ICON IS SELECTED FOR A DATE>
VEHICLE SUMMARY ICON IS SELECTED FOR DATE>VIN SELECTED ON
LINE ITEM
Under this screen (not shown) detailed vehicle information is displayed for
the VIN selected from the previous screen.
SHIPMENT LANE SCREEN: USER'S VIEW>A RAMP IS SELECTED IN
TABALE>UNIT BREAKDOWN ICON IS SELECTED FOR A DATE>
VEHICLE SUMMARY ICON IS SELECTED FOR DATE>LOCATION
SELECTED FOR A VIN LINE
In this screen, (not shown) Shipment Lane information is displayed for the
lane selected from the Unit Breakdown Lane.
LANE SCREEN: USER'S VlEWABLE RAMPS AND LANES>LANE
SELECTED
~ When the user selects Lane from the Ramps & Lane Screen, the
Lane Screen is displayed (not shown). Clicking on Unit Breakdown link displays
the Unit Breakdown Screen and clicking on Vehicle Summary displays the Vehicle
Summary Screen.
More details and examples of the output and uses of the vehicle tracking
system 32 will be discussed later by way of example, particularly in
conjunction
with Figs. 16-44.
SIMULATION TOOL
The transportation system 10 of the present invention utilizes an
operational/strategic planning tool that will allow the system and its
managers to
analyze its vehicle distribution network 20 each day as well as look out a
number
of days (for example, fourteen) into the future to determine if bottlenecks
will
-so-
CA 02401555 2002-08-21
WO 01/65454 PCT/USO1/06652
appear in the network and where they will occur. In addition, this tool
provides the
ability to test changes to the existing vehicle distribution network "off
line" to
determine what changes should be made to the network and the impact of making
those changes. There is a benefit to simulating changes to the existing
network and
seeing the impact of those changes on service and cost. Examples of such
changes
are:
- routings (origins, destinations, mixing centers, etc.)
- mode of transportation (rail versus car hauler)
- volume of vehicles demanded (dealer orders)
- capacity changes (number of vehicles loaded/unloaded,
parking capacity, vehicles per railcar or car hauler, etc.)
The selected tool 38 is a computer simulation model of the vehicle
distribution
network, one acceptable program being the simulation model sold by Systems
Modeling Corporation under the brand ARENA. It should be understood that
several other simulation engines are readily available and can be utilized in
connection with the present invention.
The following discussion will identify all parameters necessary to
accurately develop a simulation model of a vehicle distribution network using
the
ARENA tool. It will clearly define the objective of the model, all
assumptions, the
, model scope, the input and output data required, specific model logic, and
model
validation. Also described will be the definition of the model inputs, the
definition
of model outputs, and the definition of information required for validating
that the
model accurately represents the existing system.
Model Assumptions
There are a number of specific assumptions under which the model is built.
These assumptions may change if the functionality of the model is expanded or
contracted. The assumptions for an example of the model described below are as
follows:
1. An alternate routing is considered a change in:
- the mode of transportation (rail vs. car hauler)
- the routing from the origin mfg. plant to destination ramp
- the destination ramp
- car hauler company
-sl-
CA 02401555 2002-08-21
WO 01/65454 PCT/USO1/06652
2. The input data describing the current system status will be accurate.
3. The time units used for the model will be days.
4. No human resource issues will be considered in this model.
5. This phase of the simulation model will not track empty railcars.
6. All holds on vehicles occur at either a manufacturing plant or a
destination ramp.
7. No vehicles are loaded or unloaded between a mixing center and a
destination ramp nor a manufacturing plant and a mixing center.
8. Once a vehicle is released from manufacturing its routing is locked.
However, routings can be changed up until the vehicle is released
from manufacturing.
9. All railcars are the same size and type at each manufacturing plant.
There are two types - bi-level and tri-level.
10. All car haulers are the same size and type (53' long).
11. The number of vehicles and railcars switchable each day is achieved
at manufacturing plants.
12. All shipments of vehicles from a manufacturer or mixing center
direct to a dealer via car hauler will be "black boxed." However, the
simulation assumes a 24-hr dwell time at the manufacturing plant
and a 48-hr dwell time at the destination ramp (which could be a
mixing center).
13. Vehicles are grouped by destination ramp at the manufacturing
plant (origin).
14. Lanes are made up of segments from an origin manufacturing plant
to a destination ramp.
15. Vehicles are in transit to a destination ramp within 24 hours of
being released from production.
16. Initially, only one manufacturer's vehicles on the railcars will be
considered.
17. There is one train per day that leaves a mixing center or
manufacturing plant going to a destination.
18. Railcars will always be full.
-52-
CA 02401555 2002-08-21
WO 01/65454 PCT/USO1/06652
19. Vehicles in the system will not be tracked by VIN#, but rather by
simulation vehicle type (1 - 21).
20. Empty railcars and empty car haulers are always available at the
manufacturing plant and mixing center.
21. The date that a VIN is associated with a railcar is the date the railcar
leaves that location (origin manufacturing plant or mixing center).
22. All vehicles at one location with the same origin and destination
that are associated with railcars will all be part of the same train.
23. Vehicles must be loaded onto a specific railcar type (bi-level or tri-
level) at either the manufacturing plant or mixing center. Vehicles
can only be transported on the type of railcar used at the plant they
were produced.
24. The vehicle manufacturer only uses two car hauler companies.
System Description and Scope
The manufacturer's dealers place orders for vehicles. These orders go
directly to the manufacturing plant that produces the particular vehicle
ordered.
The vehicle is produced, then shipped to the dealer as fast as possible. The
modes
of transportation used are railcars and car haulers. The vehicle delivery
network is
a "'hub and spoke" network with four "mixing centers" located at strategic
points in
the U.S. for consolidating vehicles into railcars arriving from the
manufacturing
plants and creating "direct shipments" to destination ramps in other parts of
the
country.
The example of a vehicle distribution network described below will include
the daily transportation of vehicles between 21 manufacturing locations, one
mixing center (Kansas City), and the mixing center's 17 ramp destinations.
Transportation to and from locations outside of this scope will not be
tracked.
Expanding the model is desirable, therefore the model should be constructed in
a
way to allow easy expansion of the model to include other locations. The flow
chart of Fig. 5 represents the logical flow of vehicles in the model.
Model Input Data
The simulation model requires a large quantity of input data to minimize
the assumptions used; otherwise the simulation model may not be validated and
its
-53-
CA 02401555 2002-08-21
WO 01/65454 PCT/USO1/06652
output may be suspect. A separate simulation database (database 60 shown in
Fig.
7) with the required data may be created and maintained. In addition to the
simulation database, Microsoft Excel spreadsheet interface is provided to
allow
users to easily change rail and parking capacity as well as vehicle routings.
Following is a list of the input data for the simulation model:
~ Simulation Vehicle Type (1-21)
The tracking system will provide simulation vehicle types (I -21) to
the simulation database. Each of the 21 manufacturing plant
produces a unique vehicle type. If necessary, the vehicle tracking
system 34 will convert manufacturer vehicle types to simulation
vehicle types.
~ Origin (Integer value of 1-21).
The tracking system will pass unique integer values representing all
21 origin ramps to the simulation database. If necessary, the vehicle
tracking system 34 will convert manufacturer origin alphanumeric
assignments to the integer values..
~ Destination (Integer value of 22 - 75).
The tracking system passes unique integer values representing all
54 destination ramps to the simulation database. If necessary, the
vehicle tracking system 34 will convert manufacturer destination
razrzp alphanumeric assignnzents to the integer values.
~ Mixing Center (Integer value of 76 - 79).
The tracking system passes unique integer values representing all 4
mixing centers to the simulation database.
~ Vehicle routing number (Integer value from Master Routing Table
of 1 - 4,536).
A unique integer value is entered for all possible routings and
alternate routings (4, 536 possible routings) between the 21 origin
-54-
CA 02401555 2002-08-21
WO 01/65454 PCT/USO1/06652
manufacturing plants and the 54 destination ramps. An example of
this table is shown in the Master Routing Table below. If necessary,
the tracking system will convert manufacturer routing alphanumeric
assignments to the integer values.
_ _ _ _ _ _ _ _ _ _ _ _ _ _ _ _ _ _ _ _ _ _ _ _ _ _ _ _ _ _ _
Master Routing Table
(This is a list of all nnssihle T.anes anti Alternate Lanes.l
RoutingOriginDestinationNumberStopl Mode to Mode Mode Mode to
Mode to to I
to
NumberI(1-21)(22-79)ofStopsStopl Stop2 Stop3 Stop4~ StapS
13 Stop 1-3 Sto 3 1-3 1-3 Sto 5
2 Sto 4 1-3
1 DetroitSan 1 )San l
Diego, ' ai
Die
o,
CA
2 DetroitSan 2 ostoriaSan Rail
Diego, d Diego,
C I
.
CA
3 DeironSan 2 nsas San Hauler A
Die auler Die
o, A o
C g
Cit CA
~
4 DetroitSan 1 ' an
Diego, Hauler
C A
ie o.
CA
...DetroitSan I ~an I
Diego, a-lauler
C B
pie I
n o CAS
IVOte: tcounng lvumoer of v represents a vemcle on nola.
Note: Mode 1 = rail Mode 2 = car hauler A Mode 3 = car hauler B
The Master Routing Table may be used to define all possible standard and
alternate routings that vehicles could take to get from a manufacturing plant
to a
destination ramp. Each routing will contain the O-D pair as well as the number
of
intermediate stops between the origin and destination. If there are
intermediate
stops along the route, then each stop is entered in the table. This table only
has to
be created once and can be appended as routes change.
~ Current or last known location of vehicle along routing
(intermediate stop).
The tracking system will pass the current or last known location of
all vehicles already in the pipeline to tlae simulation database. This
information is part of a Current Location Table shown below. This
location must be a unique integer value (1-79) and represents an
origin manufacturing plant, a mixing center, or a destination ramp.
If necessary, the tracking system maintains a cross-reference table
of these integer values and the corresponding manufacturer
alphanumeric value.
-55-
CA 02401555 2002-08-21
WO 01/65454 PCT/USO1/06652
Current Location Table
LocationRouting ~ j CSurentExpectedI ActualExpectedActualRailcar
ID ~ i
(origin,Number j Or ~ ~
DepartureManufacturingManufacturingUnload
MC, LastDepartureDate Flag
Date ~
DR, (fromQuantityQuantityQuantityKnown; from ~ from ReleaseRelease(1=unload
railcar, CLrrentLast Date Date
i
orearMasterof of OfTypeLocation~ Location; Known(mmdd-y)(wnddyy)and
TypeType 21 Location 0=don't
I 2 ~ .
haulerTableVehiclesVehiclesVehiclesI-79mmdd 1 mmdd unload
,
..
G2 1 345 324 2 [ 12/13!99 !2/!2/99j 0
I
G2 34 278 77 2 12113/99I !2/12/99_ D
- -
C4 23 142 34 I 79 I 12/13/9912/03/99!2/01/99 D
I !
C4 28 355 79 ~ 12/13199i 12/04/99!2/01/9912/04/99D
V1
C4 34 76 ( 79 12/73/99t 12/05/9912/01/9912/04/99D
113
R17 44 66 I ~ 38 12/13199( 11/28/99!1/26/99~ D
52
-
arHauler5 ( 8 14 12/08/9912/07/99 D
21
ailca~207~ 15 J ( 76 ~ 12/02/9912/07/99/ D
j j
-
At the start of the simulation run, the current location of all vehicles in
the system
will be read in from the simulation database and tallied. This will be done
for all
valid routings of vehicles that are defined in the Master Routing Table.
~ Expected manufacturing release date of vehicle (from 1 Jan in
mmddyy) format).
The tracking system passes this date to the simulation database in
mrnddyy format. It as part of the Current Location Table that
contains the information on all vehicles currently in the system for a
given day. An example of this table is shown above.
Actual manufacturing release date of vehicle already in pipeline
(mmddyy format.).
The tracking system passes this date to the simulation database in
mmddyy format. It is part of the Current Location Table that
contains the information on all vehicles currently in the system for a
given day. Art example of this table is shown above. Note that this
field is blank unless the actual release date is different than the
planned release date of the vehicle. This date will override the
planned release date.
~ Quantity of vehicles on each railcar or car hauler by vehicle type
and routing number (Integer value).
The tracking system passes the total quantity of each sirnulation
vehicle type on each railcar or car hauler and its routing number to
-56-
CA 02401555 2002-08-21
WO 01/65454 PCT/USO1/06652
the simulation database at the start of the simulation. The tracking
system assigns a unique integer value to each of these railcars and
car haulers and pass this to the simulation database as well. The
tracking system tracks the routing number for each V11V in the
model. This information is part of the Current Location Table
above.
~ Railcar Unload Flag (Integer value of 0 = don't unload and 1 =
unload).
The tracking system passes either a zero (0) or one (1) to the
simulation database for each railcar or car hauler that is carrying
vehicles at the start of the simulation. This value will determine
whether the railcar should be unloaded at the mixing center upon
arrival. The railcar or car hauler ID will be a unique integer value
assigned by the tracking system. This informatiort will be part of
the Current Location Table above.
~ Actual departure date from last known location (mmddyy format).
The tracking system provides the date each railcar left from its last
known location (origin or mixing center). This information will be
part of the Current Location above.
~ Location and quantity of cars on hold (location will be an integer
value 1-75).
Tlae tracking system passes the total quantity of vehicles ora quality
laold at an origin maraufacturirag plant or destination ramp to the
simulation database at startup. Cars orz hold will have a routing
number of zero (0).
~ Usual number of railcars per train between origin and mixing center
and mixing center and destination ramp (Integer value).
This faumber is based on historical data on the number of railcars
that were allowed on a train for each combination of origin and
-57-
CA 02401555 2002-08-21
WO 01/65454 PCT/USO1/06652
mixing center (84 possible) and mixing center and destination ramp
(216 possible). This information is contained in a table that the
user can update. An example of this table is shown in the Number of
Railcars Per Train Table below. This information provides a
constraint on the number of railcars that can travel on one train
between two points.
Number of Railcars Per Train
59 destinations
Kansas (4
ostoriaCity earborn ** MCs, 54 DRs,
&
Dealers)
Fostoria X 80 100
Kansas City 80 X 90
Dearborn 100 90 X
*** X
25 origins (21 X
mfrs & 4
MCs)
_ _ _ _ _ _ _ _ _ _ _ _ _ _ _ _ _ _ _ _ _ _ _ _ _ _ _ _ _ _ _
~ Dealer orders for vehicles for the next 14 days by manufacturing
plant and routing number.
Manufacturer provides all dealer orders for vehicles for the next 14
days ofproduction. These orders are at the YIN level. The tracking
systerrZ "rolls up" these orders and pass the data to the simulation
database as total quantity of vehicles ordered each day for each
manufacturing plant by routing number. The user can override the
maximum number of railcars and car haulers loaded as well as the
load to delivery (LTD) percentage. An example of this data is shown
in the Planned Orders from Dealers Table below.
_ _ _ _ _ _ _ _ _ _ _ _ _ _ _ _ _ _ _ _ _ _ _ _ _ _ _ _ _ _ ,
Planned Orders from Dealers
Day 1 (have 14 tables, one for each day, so that manufacturer can make changes
on
any day)
-ss-
CA 02401555 2002-08-21
WO 01/65454 PCT/USO1/06652
Max Max Quantity Quantity Quantity Quantity
Car
RailcarsHaulers For for for for Quantity
LoadedLoadedLTD%
TotalRoutingRoutingRoutingRoutingRoutingRoutingRoutingRoutingRoutingForRoutin
OriginOverrideOvertideOverrideProduced1 1 2 2 3 3 4 4 5 5
MFG1 500 12 500.1-
MFG2 600 34 300."2 100 10 10D 77 100
MFG3 700 66 3%;-I-38 350
*** 800 4 600'-1 200
MFG21 0.5 __ - -) 356 200 ~ 400
~ 900 8 300 9
~ " ~
~ The transit time for a loaded railcar or car hauler to travel from a
manufacturing facility (0) to a destination ramp (D). Each O-D pair
will have a unique transit time.
~ The transit time for a loaded railcar or car hauler to travel from a
mixing center (MC) to a destination ramp (D)~. Each MC-D pair
will have a unique transit time.
~ The transit time for a loaded railcar or car hauler to travel from a
manufacturing facility (0) to a mixing center (MC). Each O-MC
pair will have a unique transit time.
~ The transit time for a loaded car hauler to travel from a
manufacturing facility (0) to a local dealer within 250 miles.
~ The transit time for a loaded car hauler to travel from a mixing
center (MC) to a local dealer within 250 miles.
Below is an example of transit times needed from a manufacturing plant to
a destination ramp (i.e., O-D pairs) via railcar. Note that the first column
will contain all 21 manufacturing plants and four mixing centers. The
header row will contain the 21 manufacturing plants, four mixing centers,
and the 17 destination ramps.
O-D Travel Time - Rail
(Enter all travel times in days.)
-59-
CA 02401555 2002-08-21
WO 01/65454 PCT/USO1/06652
Kansas 59 destinations
(4 MCs, 54 DRs,
& Dealers)
FostoriaCity Dearbom***
Fostoria X 2 2
Kansas City 2 X 3
Dearborn 2 3 X
***
25 od ins X
21 mfrs &
4 MCs
This same information will be needed for car hauler transit times, but the
header row will also include one dealer representing all dealers within 250
miles of a manufacturing plant or mixing center. There will be two car
hauler transit time tables to reflect the two car hauler companies that serve
manufacturer.
~ Vehicle capacity at site (max number of parking spaces at
manufacturing, mixing center, and destination ramp)
~ Railcar capacity at site (max number of railcars allowed at
manufacturing, mixing center, and destination ramp)
~ Max number of railcars or car haulers loaded per day (at
manufacturing and mixing center)
~ Max number of railcars or car haulers unloaded per day (at mixing
center or destination ramp)
~ Number of vehicles per railcar
~ Number of vehicles per car hauler
Below is an example of a table for capacity information needed for each
manufacturing plant:
-60-
CA 02401555 2002-08-21
WO 01/65454 PCT/USO1/06652
Origin Capacity Information
OriginType VehiclesVehiclesLengthLinear Max Max Max Max Deal
ofRailcar per of vehiclerailcarsvehiclescar
(bi-ortri-level)perCar VehicleFeetMax parkingloadedloadedhaulersloadedDwel
Hauler of per per
Railcar (feet)RailcarLTD capacityday day per Time
% day
GI
G2
G3
G21
Below is an example of a table for capacity information needed for each
mixing center:
Mixing Center Capacity Information
MaxMax
MaxMax numbervehicleMax Max Max Max Max MaxMax
vehicl car car
MixingNumbernumberof
parkingparkingRailcarsvehicleshaulersRailcarsvehiclesbaulersDealer
loaded
Centerof
ofloadedcaicapacitycapacityLoadedloadedloadedunloadedunloadedunloadedDwell
per per per
LTDsrailcarshaulers(rail)(hauler)day day day per per' Time
day dayper
day
MC1
MC2
MC3
MC4
Below is an example of a table for capacity information needed for each
destination ramp:
Destination Ramp Capacity Information
DestinationMax Max
Ramp numbernumberMax Max Max Max
of car
loadedofloadedvehiclerailcarsvehicleshaulersDealer
railcarscar parkingunloadedunloadedunloadedDwell
haulersco or er er Time
acit da da da
DRl
DR2
DR3
+++
DR17
Delivery network management and manufacturer should determine the
amount of financial data needed to produce the desired model outputs. Some
miscellaneous costs to consider are freight costs, divert costs, etc. The
following
costs are included:
~ Railcar cost per vehicle per day (railcar cost/vehicle/day)
~ Car hauler cost per vehicle per day (car hauler cost/vehiclelday)
-61-
CA 02401555 2002-08-21
WO 01/65454 PCT/USO1/06652
Model Logic
Logic in the simulation model to allows the model to perform as close to
reality as possible. Following is a list of logic that is part of the model.
1. Vehicles will be routed from an origin to a destination via a routing
from the Master Routing Table. This routing will include mode of
transportation and any intermediate stops along the way. The
duration to get from an origin to a destination will be taken from the
O-D Travel Time Table.
2. At the beginning of the simulation run, the status of the system will
be read into Arena from the simulation database. This information
will "load" the model with the current status or state of the vehicle
distribution network. It will consist of the number of vehicles
located at each point in the network that is included in the scope of
the model. In addition, production orders for the next 14 days will
be read into Arena. As these vehicles are produced over the I4-day
period in the simulation, they will be assigned a routing from the
Master Routing Table based on the origin and destination (O-D)
pair. The simulation will use the O-D pairs and the duration times
from the O-D Travel Time Table to move the vehicles through the
network. For vehicles already in the pipeline as part of a train, the
location of the railcar will be used as well as the date it left its last
known position. Arena will subtract that time from the total
duration time to determine the remaining duration to the destination
ramp.
3. Alternate routings will be allowed. These alternate routings are part
of the Master Routing Table.
4. Railcars that do not need to be unloaded at a mixing center (all
vehicles are going to the same destination ramp) will "pass through"
on the next train bound for that destination from the mixing center.
5. The Excel Interface permits changes in capacity information as
described above.
-62-
CA 02401555 2002-08-21
WO 01/65454 PCT/USO1/06652
6. Vehicles will be loaded on a first-in-first-out (FIFO) basis at the
manufacturing plant.
7. Vehicles will be grouped by common destination ramp at the
manufacturing plant before being loaded on a railcar or car hauler.
~. If a vehicle needs to be unloaded at the mixing center, all vehicles
are removed from the railcar.
9. The number of vehicles per railcar and the number of vehicles
moving to a common destination will determine the number of
railcars per train. If there is a train restriction on the allowable
number of railcars on a train, then railcars that exceed the train
capacity will be held until the next train departs.
10. If a vehicle is diverted after already being loaded onto a railcar, then
the entire railcar is diverted. It must be unloaded, then reloaded
with the vehicles that were not diverted.
11. No railcars will move unless they are full.
Model Outputs
Specific output from the model will be used to measure the results of
different scenarios. Management will use the results to determine the
effectiveness
of changes made to the vehicle distribution network. These outputs will be
written
: to an Excel file to allow for better analysis. Following is a list of
outputs (or
measures) which the model will provide:
1. Cycle time from 21 manufacturing sites to 17 destination ramps.
2. Cycle time from 21 manufacturing sites to Mixing Center (Kansas
City).
3. Cycle time from Mixing Center (Kansas City) to 17 destination
ramps.
4. Number of vehicles delivered to each destination ramp.
5. Number of vehicles in transportation system at all times (including
all inbound and outbound vehicles to a mixing center).
6. Number of vehicles at each manufacturing site.
7. Number of vehicles at Mixing Center (Kansas City).
Transit cost of vehicles in transit.
9. Freight cost ( provided by network management and manufacturer).
-63-
CA 02401555 2002-08-21
WO 01/65454 PCT/USO1/06652
10. Estimated number of car haulers used at each manufacturing plant.
11. Estimated number of car haulers used at each mixing center.
12. Estimated number of railcars used at each manufacturing plant.
13. Estimated number of railcars used at each mixing center.
Model herification and Tlalidation
The simulation model is verified and validated before scenarios can be run.
Verification is the process of making sure the model is built the way it was
intended. Validation is the process of making sure the model behaves according
to
reality. The simulation model is validated by its results to the historic
performance
of the vehicle delivery system.
Model Analyses (scenarios)
Once the simulation model is built and verified, an infinite number of
scenarios (or experiments) can be run by altering model inputs. For each
scenario,
delivery network management and manufacturer study how the results (outputs)
change based on changes made to the model inputs. This information is used in
making planning decisions that increase the effectiveness and efficiency of
the
delivery network. Examples of such planning decisions include the choice of
routing (lanes) for vehicles, and the order in which vehicles will be built.
By using the Excel Interface provided with the simulation model,
management will be able o change. specific inputs such as:
~ Number of vehicles loaded/unloaded per day per location.
~ Number of vehicles produced at each manufacturing plant and their
routing number.
~ Vehicle type produced at each manufacturing plant.
~ Transit time between all origin-destination ramp (O-D) pairs.
~ Transit time between all mixing center-destination ramp (MC-D)
pairs.
~ Transit time between all origin-mixing center (O-MC) pairs.
~ Transit time between all origin-dealer pairs within 250 miles.
~ Transit time between all mixing center-dealer pairs within 250
miles.
~ Add routings to the Master Routing Table.
-64-
CA 02401555 2002-08-21
WO 01/65454 PCT/USO1/06652
~ Number of vehicles that can fit on a railcar and car hauler by
simulation vehicle type.
~ Parking capacity at all manufacturing plants, mixing centers, and
destination ramps.
~ Rail capacity at all manufacturing plants, mixing centers, and
destination ramps.
~ Time of rail switch by location (1 - 79).
~ Costs (freight, rail, car hauler, divert, etc.).
Animation
Using Arena animation of the model can be displayed representing the
movement of trains from the 21 manufacturing facilities to the 17 destination
ramps, via the Kansas City mixing center. In addition, all model outputs
listed
above are displayed on the screen during the simulation run as status
variables:
This is known as scoreboard animation. A bitmap image of the U.S., with all
manufacturing plants, mixing centers, and destination ramps, is used as a
"backdrop" for the animation.
The model contains a menu system to help the user move about the screen
to view different parts of the animation, system status variables, or actual
model
logic. There also is a direct link with the Excel Tnterface to allow the user
to
change input variables to run different scenarios.
Modification of the Model
Further input data may be passed to the model to allow other functionality,
such as simulating the effects of blocking at manufacturing plants (loading
vehicles .
on railcars based on destination ramp). The goal of such functionality would
be to
reduce the number of railcars that need to be uncoupled during transit from
the
manufacturing plant to the destination ramp, thereby reducing transit time
further.
Other additional functionality may include:
1. Adding or removing manufacturing plants and mixing centers.
2. Tracking empty railcars throughout distribution network.
3. Allowing alternate routings with effective and termination dates.
4. Allowing mixed loads (vehicles from different manufacturers) on
railcars.
-65-
CA 02401555 2002-08-21
WO 01/65454 PCT/USO1/06652
5. Adding data on loading practices at the manufacturing plant (such
as practices to reduce vehicle handling).
6. Adding data on train make-up (such as practices to reduce the
switching and shunting times).
OPERATION OF THE DELIVERY SYSTEM
As should be apparent from the foregoing description, components of the
vehicle delivery system 10 interact, and in particular share raw and/or
processed
data which is then used in carrying out the functions of each component. For
this
reason, the operation of the data flow network 30 is interactive, rather than
linear,
and while the delivery of a vehicle in the distribution network 20 can be
described
from manufacturer to dealer, events along the way are monitored, recorded, and
tracked for use in operation of the overall system. Thus, there is no critical
starting
point in the following description of the operation of the system.
Tracking and Associated Data Collection
At this point further exemplary views, reports, etc., will be discussed as
examples of ways in which the Tracking Application may be used.
The following section provides a discussion of the vehicle tracking system
34 features prixriarily from the standpoint of the end user in the field,
namely, the
Dealers, Ramp Managers and Lane Managers.
The Vehicle Tracking System Features
As discussed in at least part detail above, the Vehicle Delivery System 34
offers the following features, based on the permissions of the particular user
profile.
-66-
CA 02401555 2002-08-21
WO 01/65454 PCT/USO1/06652
Feature Descri tion
Dealer Tracking . See all vehicles that are expected to
arrive at a
dealership on a particular date.
See all vehicles that are expected to arrive
at a
dealership on a particular date, according
to model.
See the revised arrival date for a vehicle
expected at a
dealership on a particular date.
See how late a vehicle is in arriving at
a dealership.
See the current location of a vehicle expected
at a
dealershi on a articular date.
Ramp Tracking . See all vehicles that are expected to
arrive at a ramp on
a particular date.
See all vehicles that are expected to arrive
at a ramp on
a particular date, according to model.
See the revised arrival date for a vehicle
expected at a
ramp on a particular date.
See how late a vehicle is in arriving at
a ramp.
See the current location of a vehicle expected
at a ramp
on a articular date.
Lane Tracking See all vehicles that are expected to arrive
at the
destination point of a lane on a particular
date.
See all vehicles that are expected to arnve
at the
destination point of a lane, according to
model.
See the revised arrival date for a vehicle
expected at
the destination point of a lane on a particular
date.
See how late a vehicles is in arnving at
the destination
point of a lane.
See the current location of a vehicle expected
at the
destination oint of a lane on a articular
date.
Placing a Vehicleden the user drills down to the status events
on for a single VIN,
Hold the user can insert a Hold event, so that
the vehicle does not
roceed fiuther.
Search The user can search for a vehicle within
one of the views. For
instance, if the user searches for a vehicle
within the view for a
dealer, the search is limited to vehicles
destined for that
dealership.
Search criteria includes: VIN, model, year
of vehicle, date or
date ran e, and event status.
Vehicle DescriptionsThe user can see a description for any vehicle
in the system.
The vehicle detail includes body type, chassis
type, various
en ine characteristics, and the restraint
system.
-67-
CA 02401555 2002-08-21
WO 01/65454 PCT/USO1/06652
Feature Description
Reports Design the user's own report for repeated
use, or use one of the
standard Vehicle Trackin System re orts.
Introduction to Vehicle Tracking System Views
When a user enters the vehicle tracking system 34 application, the user has
access to one or more of the following views for getting description and
status
information about vehicles:
View Description
Dealer For a given date, this view shows what
vehicles are initially
projected for arrival at a particular
dealership.
A revised date may also appear for the
vehicle's arnval at the
dealership.
The user can inquire further to see the
entire status detail for
a vehicle.
Ramp This view shows all vehicles destined
for a particular ramp,
according to the original proj ected date
and lane.
A revised date may also appear for the
vehicle's arrival on
the ramp.
The user can inquire further to see the
entire status detail for
a vehicle.
Lane This view shows all vehicles that are
being transported along
a particular lane, according to the original
destination date
for the end point of the lane.
A revised date may also appear for the
vehicle's arrival at the
end point of the lane.
The user can inquire further to see the
entire status detail for
a vehicle.
Viewable Items Onscreen
Under one embodiment of the invention, when the user accesses vehicle
tracking system 34 though the login screen, the Viewable Items Screen is
shown.
Depending on the job requirements of the user, the user will see a list of
hyperlinks
for one or more of these categories:
Dealers
Ramps
Lanes
-68-
CA 02401555 2002-08-21
WO 01/65454 PCT/USO1/06652
Reference is now made to Fig. 16, which shows a Viewable Items screen
for a user with access to all three categories.
Dealer, Ramp and Lane Searches
As noted above the user can conduct various searches. Under one
embodiment of the invention the outcome may differ depending on who the user
is.
When the user selects Search the search looks for vehicles
in ... ...
Dealer View (a dealer selected) scheduled for arrival at
the dealership on
the dates) that the user
s ecifies.
Ramp View (a ramp selected) scheduled for arnval the
ramp on the
date s) that the user s ecifies.
Lane View (a lane selected) schedule to arnve at the
lane's end
destination on the date s
the user s ecifies.
Vehicle Status Information
The tracking system 34 enables a user to see the current status of a vehicle
in terms of the events that occur between production and shipment of a vehicle
to a
dealership. As discussed in detail later, the user can track each vehicle
though all
its status checkpoints as shown in the status details chart of Fig. 17.
Navigation for Dealer, Ramp, and Lane Views
Reference is now made to Fig. 18, which illustrates how the user can
navigate within the Dealer, Ramp, and Lane views.
Dealer View
This section describes how a user can check status information and
descriptions for vehicles destined for arrival at a dealership.
To see the view for a dealer (in this case Wade Motors at Buford), the user
clicks a dealer name on the Viewable Items screen. A table similar to that
shown
in Fig. 19 is displayed.
This "Dealer View" shows the quantity of vehicles that were originally
planned to arnve at the dealership for each date listed. The following options
are
available in the Dealer View:
~ See the quantity of vehicles for a date according to model (click the Unit
Breakdown icon).
~ See the revised arrival date and current status of each vehicle for a date
(click the Vehicle Summary icon).
-69-
CA 02401555 2002-08-21
WO 01/65454 PCT/USO1/06652
~ See the entire status table of events for a particular vehicle (click the
Vehicle Summary icon, then click the status location).
Accessing the Unit Breakdown
To see the quantity of vehicles originally planned for delivery at the
dealership according to model, the user goes to the row for a specific date
and
clicks the icon in the Unit Breakdown (a.k.a. Model Summary) column. A screen
appears similar to that shown in Fig. 20, which lists a Model column, a
Quantity
column, and a Vehicle Summary column.
The Unit Breakdown of Fig. 20 shows the user the quantity of models
originally planned for arrival on a specific date at a dealership. The Unit
Breakdown includes the following:
1) Model
2) Quantity (quantity for a particular model)
3) Vehicle Summary (a link to more detailed information about vehicles for
a particular model)
Unit Breakdown Options
The user has the following options in the Unit Breakdown:
1) See the revised arrival date and current status of each vehicle for a date
(click the Vehicle Summary icon).
2) See the entire status table of events for a particular vehicle (by clicking
the Vehicle Summary icon, and then clicking the status location).
Accessing the Vehicle Summary
The user can see a list of vehicles with the current status and revised
arrival
date at the dealership, by going to the row for a specific date and clicking
the
Vehicle Summary icon, either in the Dealer View or in the Unit Breakdown.
The Vehicle Summary for the Dealer View (Fig. 21) lists all vehicles
originally planned to arnve at the dealership on a specific date. The Vehicle
Summary includes the following:
-~o-
CA 02401555 2002-08-21
WO 01/65454 PCT/USO1/06652
VIN (partial VIN, VIN column)
Vehicle model (Model column)
Year of the vehicle (Year column)
Planned date of arrival at dealership (Planned Arrival)
Revised date of arrival at dealership, when applicable (Revised Arrival
column)
Current Location of the vehicle (Location column)
On-schedule indicator (traffic light in Status column). When lit, green is on
time, yellow is one date late, and red is two days late.
Vehicle Summary Options
The user has the following options in the Vehicle Summary:
1) Seeing a description of a vehicle (by clicking the VIN).
2) Seeing the entire status table of events
Accessing Status Details
To see all status events for a vehicle, go to the vehicle in question on the
Vehicle Summary and click the current status item in the Location column. This
provides the Status Details screen display as shown in Fig. 22.
This vehicle Status Details screen for the Dealer View shows all status
information concerning a particular vehicle on its way to the dealership.
Status
Details includes the following:
A standard event that involves production or transport of the vehicle
Location information tied to the vehicle event
The original date planned for the event to occur
The revised date for the event to occur
The date when the event actually occurred
Any notes associated with the event
-m-
CA 02401555 2002-08-21
WO 01/65454 PCT/USO1/06652
Vehicle Status Updates
For the standard sequence of events necessary to get a vehicle to its final
' destination, the vehicle tracking system 34 updates a vehicle's status in
the
following ways:
~ Planned dates are assigned to events when a vehicle is determined to be
"shippable" at the assembly plant.
~ Revised dates are assigned to events when the vehicle leaves the mixing
center.
~ An actual date is assigned to an event after the event has occurred.
Status Details, Put Vehicle on Hold
The Status Details screen, if the user has permission to do holds, the user
can place the vehicle on hold by doing the following:
1. Select put on hold on the side navigation bar. This brings up the screen
shown in Fig. 23.
2. Click the insert here link for the event at which the user is stopping
transport of the vehicle as shown in Fig. 24, a blank line appears for the
' new hold event the user is creating.
3. In the boxes below, select the type of event, the start date for the event,
the duration of the event, and any applicable notes. The user should
click Save when finished.
Searching for a Vehicle
When the user does a vehicle search while in Dealer View, under one
embodiment the search only involves those vehicles associated with delivery to
that dealer. To search for a vehicle planned for arrival at a dealership, the
user
does the following:
1. Select a dealer on the Viewable Items screen.
2. Click Search on the side navigation bar. Fig. 25 is displayed.
3. Enter the search criteria the user wants.
-72-
CA 02401555 2002-08-21
WO 01/65454 PCT/USO1/06652
Search Options
The Search screen has the following options to narrow the search:
Option Description
VIN Enter the 17-character VIN or any part of it:
beginning, middle, end.
Model Select a model from the drop-down list or accept
Any.
Year Select year of the vehicle from the drop-down
list or accept any.
Date/Date Select the month and year pertaining to the
Range status of the vehicle
destined for the dealership. Then select a
day in the calendar on the
left, or select a date range by clicking a
day in both the from
calendar and to calendars.
Vehicle Status. Forecasted Vehicles - Vehicles that have
the Vehicle Forecasted
event as the last occurring event. The date/date
range that the user
specifies is matched to the vehicle-forecasted
date. A vehicle is
forecasted for a release date.
Invoiced Vehicles - Vehicles that have the
Production Begins event
as the last occurring event. The date/date
range that the user
specifies is matched to the production-begins
date. A vehicle is
invoiced when production begins.
Released Vehicles - Vehicles that have the
Vehicle Released event
as the last occurring event. The date/date
range that the user
specifies is matched to the vehicle-released
date. A vehicle is
"released" when it begins transport from the
plant.
Exemplary results are shown on Fig. 26.
Accessing Vehicle Detail
The vehicle tracking system 34 provides a description of each vehicle in the
system. This information is derived from the VIN.
To access detail for a vehicle, the user clicks the vehicle identification
number (VIN) for a vehicle on a Status Detail screen. Fig. 27 shows an example
of
Vehicle Detail.
-73-
CA 02401555 2002-08-21
WO 01/65454 PCT/USO1/06652
Ramp View
This section describes how the user can check status information and
descriptions for vehicles destined for arrival at a dealership.
To see the view for a ramp, click a ramp name on the Viewable Items
screen. A table similar to that shown in Fig. 28 following is displayed. This
"Ramp View" shows the quantity of vehicles that were originally planned to
arrive
at the ramp for each date listed.
The user has the following options in the Ramp View:
~ See the quantity of vehicles for a date according to model (click the
Unit Breakdown icon).
~ See the revised arrival date and current status of each vehicle for a date
(click the Vehicle Summary icon).
Accessing the Unit Breakdown
To see the quantity of vehicles originally planned for delivery at the ramp
according to model, the user should go to the row for a specific date and
click the
icon in the Unit Breakdown column. A screen such as in Fig. 29 appears.
The Unit Breakdown (Fig. 29) shows the user the quantity of models
originally planned for arrival on a specific date at a ramp. The Unit
Breakdown
, (a.k.a., Model Summary) includes the following:
~ Model
~ Quantity (quantity for a particular model)
~ Vehicle Summary (a link to a more detailed information about vehicles
for a particular model)
The user has the following options in the Unit Breakdown:
~ See the revised arnval date and current status of each vehicle for a date
(click the Vehicle Summary icon).
~ See the entire status of table of events for a particular vehicle (click the
Vehicle Summary icon, then click the status location).
-74-
CA 02401555 2002-08-21
WO 01/65454 PCT/USO1/06652
Accessing the Vehicle Summary
To see a list of vehicles with the current status and revised arrival date at
the dealership, the user should go to the row for a specific date and click
the
Vehicle Summary icon, either in the Ramp View or in the Unit Breakdown. Fig.
30 is shown.
The Vehicle Summary for the Ramp View lists all vehicles originally
planned to arnve at the ramp on a specific date.
As may be seen, the Vehicle Summary includes the following:
~ VIN (partial VIN, VIN column)
~ Vehicle model (Model column)
~ Year of the vehicle (Year column)
~ Planned date of arrival at ramp (Planned Arrival)
~ Revised date of arrival at ramp, when applicable (Revised Arrival
column)
~ Current location of the vehicle (Location column)
~ On-schedule indicator (traffic light in Status column). When lit, green
is on time, yellow is one day late, and red is two days late.
Vehicle Summary Options
The user has the following options in the Vehicle Summary:
~ See a description of a vehicle (click the VIII.
~ See the entire status table of events for a particular vehicle (click the
status
location).
Other Views
It should be understood that similar Status Details Views, Hold procedures,
search functions, and Vehicle Detail access is similar to those discussed in
Dealer
mews.
-75-
CA 02401555 2002-08-21
WO 01/65454 PCT/USO1/06652
Lane View
This section described how the user can check status information and
descriptions for vehicles associated with a lane.
To see the view for a Lane, the user clicks a ramp name on the Viewable
Items screen. A table similar to Fig. 31 is displayed.
The Lane View shows the quantity of vehicles that were originally planned
to arrive at the lane's end destination for each date listed.
The user has the following options in the Lane View:
~ See the quantity of vehicles for a date according to model (click the
Unit Breakdown icon).
~ See the revised arrival date and current status of each vehicle for a date
(click the Vehicle Summary icon).
Accessing the Unit Breakdown
To see the quantity of vehicles originally planned for delivery at the lane's
end-destination according to model, the user goes to the row for a specific
date and.
click the icon in the Unit Breakdown column. A screen appears similar to Fig.
32.
The Unit Breakdown shows the user the quantity of models originally
planned for arrival on a specific date at the end destination (ramp). The Unit
Breakdown includes the following:
~ Model
~ Quantity (quantity for a particular model)
~ Vehicle Summary (a link to more detailed information about vehicles
for a particular model)
The user has the following options in the Unit Breakdown:
~ See the revised arrival date and current status of each vehicle for a date
(click the Vehicle Summary icon).
-76-
CA 02401555 2002-08-21
WO 01/65454 PCT/USO1/06652
~ See the entire status table of events for a particular vehicle (click the
Vehicle Summary icon, then click the status location).
Accessing the Vehicle Summary
To see a list of vehicles with the current status and revised arrival date at
the dealership, the user goes to the row for a specific date and click the
Vehicle
Summary icon, either in the Ramp View or in the Unit Breakdown. Fig. 33 is
then
shown.
The Vehicle Summary for the Lane View lists all vehicles originally
planned to arnve at the lane's end destination on a specific date.
The Vehicle Summary (Fig. 33) includes the following:
~ VIN (partial VIN, VIN column)
~ Vehicle model (Model column)
~ Year of the vehicle (Year column)
I S ~ Planned date of arrival at ramp (Planned Arrival)
~ Revised date of arrival at ramp, when applicable (Revised Arrival
column)
~ Current location of the vehicle (Location column)
~ On-schedule indicator (traffic light in Status column). When lit, green
is on time, yellow is one date, and red is two days late.
Vehicle Summary Options
The user has the following options in the Vehicle Summary:
~ See a description of a vehicle (click the VIN).
~ See the entire status table of events for a particular vehicle (click
the status location).
CA 02401555 2002-08-21
WO 01/65454 PCT/USO1/06652
Accessing Status Details
To see all status events for a vehicle, the user goes to the vehicle in
question on the Vehicle Summary and click the current location item in the
Location column.
The vehicle Status Details screen for the Lane View (Fig. 34 is shown)
shows all status information concerning a particular vehicle on its way to the
dealership.
Status Details includes the following:
~ A standard event that involves production or transport of the vehicle
~ Location information tied to the vehicle event
~ The original date planned for the event to occur
~ The revised date for the event to occur
~ The date when the event actually occurred
~ Any notes associated with the event
Other Views
Vehicle Status Updates, Hold techniques, searches, and vehicle detail
access procedures are again similar to those discussed with respect to the
Dealer
views.
Reports
This section shows the user how to use Query Builder to design the user's
own Vehicle Tracking System report.
To access Query Builder to design the user's own report, the user does the
following:
1. Goes into Vehicle Tracking System and click Reports on the left
navigation bar. The Report Builder main screen appears.
2. Clicks Query Builder. The Query Builder screen appears.
_~s_
CA 02401555 2002-08-21
WO 01/65454 PCT/USO1/06652
Report Information
Query Builder enables the user to design the user's own reports based on
the following Vehicle Tracking System information:
Enti Attributes for Enti
~~
Area Area m
Name
Zone m
Assembly Plant Name
Plant Code
Dealer City
County
Dealer Code
Dealer Name
FIPS
SPLC Code
State
Street Address
Zi
Lane Description
Destination
Lane m
Origin
Lane Segments Duration
Segment Name
S a ent Order
Ramp Area m
Mnemonic
Plant Code
Ramp Code
State
Vehicle Base Color Code
Body Option
Dealer Code
Destination Ramp Code
Emission Indicator
Estimated Delivery Date
Estimated Production Date
Last Status
Model Year
Plant Code
Plant Ram Code
Zone Name
Zone m
-79-
CA 02401555 2002-08-21
WO 01/65454 PCT/USO1/06652
Designing a Report
To design a report, the user does the following:
1. Choose an option in the drop-down box for the basis of the query and
click Continue. The user's choice appears at the top of the screen, next
to Entity, and the next list of options appears.
2. Select an attribute from the drop-down list and click Continue. A
search criteria screen is displayed that allows the user to specify a range
of limitation for the attribute.
3. Specific the starting point of the search (in this case associated with
"Zip") and click Continue. The Report Editor for formatting controls
appears.
Some attributes bring up a numeric search criteria screen, such as the one
below.
The user can then specify a range of numbers.
4. Accept the report as it is, clicking Save Report or Use Report, or
continue to design this report by changing the page orientation or by
clicking Column Editor.
Column Editor allows the user to add more columns with related information.
5. Use the Column Editor to add more columns and do column formatting,
then click Accept. The user return to the Format Editor with the
changed displayed.
6. The user can click either Save Report or Use Report, after reviewing the
column formatting for the report.
7. When the user selects Save Report, the user can enter a report name and
description, then click Save.
The user returns to the Report Editor screen. The report the user designed
will appear as a report option on the Predefined Reports screen.
-80-
CA 02401555 2002-08-21
WO 01/65454 PCT/USO1/06652
8. To generate the report immediately, click Use Report. The Generate
Report screen appears.
Make any changes the user wants to make to the fields, then scroll down
the page to specify output parameters for the report.
9. Specify how the user wants the report produced and what to do with it. The
user clicks Go to output the report.
Output Format Options
The following options are available in Query Builder for a report's output
format.
O tion Descri tion
HTML, Single page Places entire report on one HTML page,
so that the user
onl has to scroll down to see entire
re ort.
HTML, Paginated Separates the report into pages. Enter
a number in the
Records er pa a box to s ecif number
of records.
HTML, Records per When the user selects Paginated, enter
page the number of
records to be contained on each a e.
PDF Makes the report a PDF file. A PDF viewer
(Adobe) must
be installed to view the PDF formatted
results
Text, Display in The user should select one of the following:
browser display in
browser, download to local machine, e-mail
to xxx. The
report displays directly in the browser,
like Microsoft
Explorer or Netsca e. The user can then
Tint the re ort.
Text, Download to The user should select one of the following:
local display in
machine browser, download to local machine, e-mail
to xxx.
Downloads and allows the user to save
it as a text file on
the user's computer.
Text, E-mail to The user should select one of the following:
... display in
browser, download to local machine, e-mail
to xxx.
Text, Comma delimited~ Separates the items on the re ort rows
with a comma.
Text, Tab delimitedSeparates the items on the re ort rows
with a tab s ace.
Text, Specify delimiterSeparates the items on the report by
the character that the
char, user specifies.
Text, First row Adds the header names at the top of the
headers page.
Text, new lines This check box should be selected the
user is working on a
Unix machine, to adjust the line feed
(carriage return or
Unix line feed only .
-si-
CA 02401555 2002-08-21
WO 01/65454 PCT/USO1/06652
O tion Descri tion
Text, Apply formattersThis check box should be selected to indicate
that the user
wants a character formatter carried forward
to the output
(example, $). See the Formatter field
on the Report
Column Editor screen.
Text, No surroundingReport items are not enclosed by quotation
marks.
uotes
Text, Double quotesReport items are enclosed by double quotation
marks.
Text, Sin 1e uotesRe ort items are enclosed by single uotation
marks.
Specify surroundingReport items are enclosed by the character
char. that the user
s ecifies.
Predefined Reports
This section describes the reports that are available with vehicle tracking
system 34 , Phase 1.
To access the Origin Ramp Report, the user does the following:
1. Goes into The Vehicle Tracking System and click Reports on the left
navigation bar. The Report Builder main screen appears.
2. Click Predefined Reports. The Predefined Report screen appears.
3. Click the Planning arrow, the click Origin Ramp. The Generate Report
screen for the Origin Ramp Report appears.
The Origin Ramp Report lists all vehicle status information according to
the origin ramp the user specifies.
When the user has accessed the Origin Ramp Report, complete the
following information:
1. Enter the number of records to include in the report (Fetch Limit).
2. Enter an origin ramp code (Input Value: Origin Ramp Code).
3. Define the date range for vehicle release dates) the user wants (Input
Value: Release Date Range Start and Release Date Range End).
4. Select the output format for the report (HTML, PDF, Text), including
any options the user prefers and click Go. See Dutput Format Options
for more explanation of options.
Introduction to the No Start VINs Report
The No Start VlNs Report lists all vehicles that have been released from the
plant as the last recorded status.
-82-
CA 02401555 2002-08-21
ar ."" ,.",., ~ z
WO 01/65454 ~ vt°r'.~~~~» ~ ..'~ °k..~~ PCT/USO1/06652 ~~~~'~
~'~::
Accessing the No Start VINs Report
To access the No Start VINs Report, the user does the following:
1. Goes into The Vehicle Tracking System and click Reports on the left
navigation bar. The Report Builder main screen appears.
2. Clicks Predefined Reports. The Predefined Report screen appears.
3. Clicks the Expediting arrow, then click No Start VINs. The Generate
Report screen for the No Start VINs Report appears.
Using the No Start VINs Report
When the user has accessed the No Start VINs Report, the user then
completes the following information, by:
1. Entering the number of records to include in the report (Fetch Limit).
2. Entering an origin ramp code (Input Value: Origin Ramp Code).
3. Selecting the output format for the report (HTML, PDF, Text),
including any options the user prefers, and clicking Go. See Output
Format Options for more explanation of options.
Output Format Options
The following options are available in Query Builder for a report's output : .
format.
O tion Descri tion
HTML, Single page Places entire report on one HTML page,
so that the user
only has to scroll down to see entire
re ort.
HTML, Paginated Separates the report into pages. The user
enters a number in
the Records er page box to specify number
of records.
HTML, Records per When the user selects Paginated, the user
page enters the number
of records to be contained on each age.
PDF Makes the report a PDF file. A PDF viewer
(Adobe) must
be installed to view the PDF formatted
results.
Text, Display in The user should select one of the following:
browser display in
browser, download to local machine, e-mail
to xxx. The
report displays directly in the browser,
like Microsoft
Ex lorer or Netsca e. The user can then
rint the re ort.
-83-
CA 02401555 2002-08-21
WO 01/65454 ~~'~'''l~'.:~;'t'~",..;~ ~~u:~~' PCT/USO1/06652~w'a"~.''
O tion Descri tion
_
Text, Download to The user should select one of the following:
local display in
machine browser, download to local machine, e-mail
to xxx.
Downloads and allows the user to save
it as a text file on the
user's com uter.
Text, E-mail to The user should select one of the following:
... display in
browser, download to local machine, e-mail
to xxx.
Text, Comma delimitedSeparates the items on the report rows
with a comma.
Text, Tab delimitedSe arates the items on the re ort rows
with a tab s ace.
Text, Specify delimiterSeparates the items on the report by
the character that the
char. user s ecifies.
Text, First row Adds the header names at the to of the
headers a e.
Text, new lines This check box should be selected if
the user is working.on
a Unix machine, to adjust the line feed
(carriage return or
Unix line feed only).
Text, Apply formattersThis check box should be selected to
indicate that the user
wants a character formatter carried forward
into the output
(example, $). See the Formatter field
on the Report Column
Editor screen.
Text, No surroundingReport items are not enclosed by quotation
marks.
uotes
Text, Double uotes Re ort items are enclosed by double uotation
marks.
Text, Sin 1e uotes Re ort items are enclosed by sin 1e uotation
marks.
Specify surroundingReport items are enclosed by the character
char. that the user
s ecifies.
Additional Embodiment
Reference is now made to an additional embodiment of the invention, to be
discussed in conjunction with Figs. 35-44.
After logging in (screen not shown) the user is presented with "viewable
items" which the user can access, which can be by password access or by the
shown search factor. Assuming the user clicks on the "Beach Motors" by
hyperlink at "X". Fig. 35A will be presented, which is a Dealer View. As may
be
seen, this view shows for a given date, the number of vehicles projected for
arnval
at the dealership. As an example, on 2/19/01, four vehicles are projected. For
that
date, four different summaries are available: model summary, railcar summary,
ramp summary, and vehicle summary.
Assuming link "A" is selected from Fig. 26, a screen such as Fig. 37 is then
displayed. Fig. 37 is a model summary list, by model, of the four vehicles
which
are to arrive at the dealership on 2/19/01. As may be seen, one is a Crown
Victoria, whereas the others are Expedition XLT models. Assuming one "clicks"
-84-
CA 02401555 2002-08-21
WO 01/65454 PCT/USO1/06652
(selects) the Vehicle Summary hyperlink shown on Fig. 37, the Vehicle Summary
will be shown as in Fig. 38. Fig. 38, the Vehicle Summary, shows the VIN
(ZFAFP73W8YX167501), the model (Crown Victoria Standard), year (2000),
planned arrival (02/19/01), revised arrival (2/24!01) location (loaded on
railcar
ETTX907680) and status. If more than one vehicle was located, the Vehicle
Summary would have looked more like Fig. 42.
If the "location" link is selected, a Status Details Screen such as in Fig. 39
(or 43) is provided, which in this case shows the past history, present
status, and
future anticipated events planned for the automobile.
Deferring back to Fig. 36, if instead link "B" is selected, namely the Railcar
Summary, a screen such as Fig. 40 is provided. As may be seen, this screen
where
twenty-four autos interact with the Rail System. If the Vehicle Summary link
is
selected as shown, a Vehicle Summary display similar to Fig. 38 will be shown,
except more lines of display will accommodate the twenty-four autos (unless
they
are on the same train).
Deferring again back to Fig. 36, if the "Ramp Summary" link is selected,
then a Ramp Summary screen such as Fig. 41 is then shown, which as may be seen
shows the Winston Salem ramp with fifteen (15) vehicles. If Vehicle Summary is
selected, a Vehicle Summary report such as shown in Fig. 42 is shown, which in
this case requires two pages (only one is shown). -
Deferring back again to Fig. 36, if the Vehicle Summary link is selected
from this screen, a list of vehicles similar to Figs. 38 or 42 would be shown.
As may also be seen, a VIN search is provided in many of the screens, to
allow an independent VIN search (which could be limited to the user's
associated .
VINS). AS may also be seen, in Fig. 39 a link is provided to allow the user to
put a
vehicle "on hold", as discussed earlier.
Simulation Rums
As noted above, the simulation tool 38 (1) analyzes the vehicle distribution
network currently and into the future to predict bottlenecks; and (2) tests
the
impact of proposed changes to the existing vehicle distribution network "off
line."
Periodically, and preferably at least once each day, an experienced simulation
operator employed by the management team runs a simulation of the network at
the simulation workstation 64. In preparation for running scenarios, the
operator
-85-
CA 02401555 2002-08-21
WO 01/65454 PCT/USO1/06652
checks for the presence of required, up-to-date input data as described above.
As
noted, most of the required input data is received from the tracking system
34,
which in turn receives the data from monitors or scanners in the distribution
network 20, or from manufacturer and carrier computers.
At the beginning of the simulation run, the workstation reads in the status
of the system from the simulation database. This information loads the model
with
the current status or state of the vehicle distribution network, and includes
the
number of vehicles located at each point in the network, production orders for
the
next selected number of days, and (as the vehicles are produced) assigned
routings
from the Master Routing Table based on the origin and destination (O-D) pair.
Updates to the manufacturer's production schedule can be input via the Excel
interface 62. The simulation uses the O-D pairs and the duration times from
the O-
D Travel Time Table to move the vehicles through the network. For vehicles
already in the pipeline as part of a train, the location of the railcar will
be used as
well as the date it left its last known position. Arena will subtract that
time from
the total duration time to determine the remaining duration to the destination
ramp.
Running the current status of the network provides the outputs listed above,
which measure the current efficiency of the network. The operator can view the
hroughput of the network, cycle times between points in the network, transit
and
freight costs, and the number of transport devices being utilized at each
origin
point and mixing center. Over the selected number of days, the operator can
see
where bottlenecks will occur, and provide recommendations for adjusting the
network to avoid the predicted bottlenecks.
As discussed above, bottlenecks can occur principally (1) at a
manufacturing plant, when the number of vehicles produced exceeds parking
capacity, or vehicles are not loaded fast enough to meet target times, or
there is a
lack of sufficient empty railcars or car haulers; (2) at a mixing center when
the
number of railcars or car haulers exceeds their "parking" capacity, or the
number
of vehicles unloaded exceeds parking capacity, or there is a lack of
sufficient
empty railcars or car haulers, or vehicles are not loaded fast enough to meet
target
times, or the proportion of railcars that must be unloaded (rather than
bypassing the
mixing center) is too high; or (3) at a destination ramp, when the number of
railcars or car haulers exceeds their "parking" capacity, or the number of
vehicles
-86-
CA 02401555 2002-08-21
WO 01/65454 PCT/USO1/06652
unloaded exceeds parking capacity, or vehicles are not loaded fast enough to
meet
target times. To attempt to avoid such bottlenecks, the operator can change
specific inputs to the model, selected from the list given above in the
description of
the Arena model. The Excel interface 62 allows users to easily change inputs
to
the simulation. Examples of responses to particular bottlenecks, with a
possible
implementation if the modified model eliminates the bottleneck, are given in
the
following table:
BOTTLENECK EXAMPLE INPUT MODIFICATION IMPLEMENTATION
At a manufacturin
lant:
Too many vehicles No. of vehicles loaded/unloadedHire labor
per
day , or
No. of vehicles made, Spread production
or
Parking capacity, or Rent space
Rail ca aci . More or bi
er railcars
Vehicles not loaded No. of vehicles loadedlunloadedHire labor
fast enough per
da
Not enough empty railcarsRail capacity, or More or bigger
or car railcars
haulers No. of vehicles made S read roduction
At a mixin center:
Too many railcars Add routings, or Alter arrival
or car haulers times
Parking capacity, or Rent car hauler
space
Rail ca aci Fewer railcars
Too many vehicles No. of vehicles loaded/unloadedHire labor,
per extend
day, or processing
hours
Add routings, or Divert to direct
delivery
No. of vehicles made S read roduction
Not enough empty railcarsRail capacity, or , More or bigger
or car railcars,
haulers Hauler capacity, or Haul away
No. of vehicles made Spread production
or
hold vehicles
Vehicles not loaded No. of vehicles loaded/unloadedHire labor
or unloaded fast per or direct
.
enou h da train around
mixin ctr.
Too many railcars No. of vehicles loaded/unloadedHire labor
to unload per or direct
da train around
mixin ctr.
At a destination ram
Too many railcars Add routings, or Accelerate
or car haulers arrival times
Parking capacity, or Rent car hauler
space
Rail ca acity Fewer railcars
Vehicles not unloadedNo. of vehicles loaded/unloadedHire labor
fast enough per
da
Too many vehicles No. of vehicles loaded/unloadedHire labor
per
day, or
Add routin s S ace arnval
times
CA 02401555 2002-08-21
WO 01/65454 PCT/USO1/06652
Planning Tool
The planning tool 36 serves as the control panel for the vehicle delivery
system 10. Refernng to Fig. 55, the planning tool utilizes both actual status
data
201 and distribution statistics 202 from the tracking system 34 as well as
analyses
203 of possible network designs from the simulation tool 38, and information
needed to transport special/exception vehicles 205 that are planned for
transport.
The basic planning model will consider manufacturer production projections 204
for 90-, 60-, 14-, and 5-day periods, and will determine system requirements
on a
daily basis once the vehicles are produced.
In one embodiment of the invention, an operator at the workstation 59 can
access this information, and make decisions to designate routes at 206 for
upcoming VINs, as well as time in transit standards. The operator can input
origin
and destination information. The operator also issues orders at 208 for
scheduling
equipment and staffing that carriers will need to provide to carry out the
designated
routes, and notifies the Garners at 210, either by direct communication (e-
mail,
telephone, fax, letter, data communications interface 40) or through the
management team whose members receive the orders at their portable
workstations
42 via the tracking system 34. The equipment schedules will cover deliveries
over
a number of days, and include the number and type of empty railcars and car.
haulers needed at all origin points and mixing centers at appointed times,
and. the
train departures needed at specified departure times at origin points and
mixing
centers. For the same period, the staffing schedules will include staff to
load
railcars and car haulers at origins points and mixing centers, to unload at
mixing
centers and destination ramps, to receive vehicles at dealers, to reposition
vehicles
for proper loading, to handle bypass LTD railcars, and to build trains. Such
staff
may be employed by one or more railroads, one or more car haulers, one or more
load/unload contractors, and multiple dealers.
In another embodiment, a software planning engine is run on the
workstation 59 to optimize the delivery network 20, automatically assigning
routes
and ordering resources. Such software allows the planning tool to better
actively
plan the network and be less reactive. In particular, the software focuses on
managing resources to reduce or eliminate unplanned dwell time at origin
points
and mixing centers. Results of the simulation tool analyses are used to
generate
_ss_
CA 02401555 2002-08-21
WO 01/65454 PCT/USO1/06652
time phased workload plans across the network, and to provide vehicle
estimated
time of arnval (ETA) at rail switching or other network facilities.
Furthermore,
alternative routes for lane segments, namely, the best predetermined
workaround
contingencies for foreseeable problems, are factored into the original plan
for use if
necessary.
Fig. 57 shows a flow diagram for such an automated planning process 300.
Generally, the planning process 300 utilizes the output of the simulation tool
38
given a set of inputs, based on simulation data inputs 305 of the type
discussed
above, and generates a routing plan database 310 which includes routes
according .
to which the vehicle distribution network 20 is operated. The route planning v
database 310 receives information directly and indirectly from numerous
sources
including the tracking system database 50 and the planning database 58. Other
input information received through the simulation tool 38 includes VIN . .
information 318 such as the product family (vehicle type, origin plant, and
LTD or
mix designation of origin ramp) and the load ratio of LTD to mix for the
origin
plant; transportation cost data 319; and dealer profile information 320.
Direct
inputs include ETA data 322 for arrival of vehicles at network facilities and
demand data 323 reflecting the dealer demand for vehicles by region (such as 3
digit zip code) at a given date.
As shown in Fig. 58, the routing plan database 310 contains for each
segment of a lane assigned to each VIN 22 a current routing plan 330, revised
routing plans 332, and a record of the actual route 334 taken by the VIN,
allowing
each routing plan to contain the VIN status, a dynamic normal plan, revisions
to
the dynamic normal plan, and actual events for the VIN. Initial workload
conditions are fed to the simulation tool 38 from the revised plans 332.
Furthermore, routing plans are provided for each network facility, giving on a
daily
basis the facility's gross capacity, number of VINs present ("wheels
rolling"), and
available capacity. Both planned dates and actual events from pre-release
through
delivery are captured in the routing plan database 310 for each VIN. These
plans
and events begin with initial production sequencing and include gate release,
rail
switchout or haul away from the origin ramp, various in transit events, and
dealer
delivery.
_89_
CA 02401555 2002-08-21
WO 01/65454 PCT/USO1/06652
The VIN routing planning process 300 takes advantage of the predictive
capability of the simulation tool 38 to plan capacity in the network. The
process
utilizes key capacity effectively, eliminates bottlenecks and reduces
unplanned
dwell, thus reducing network cycle time for vehicle delivery and relative
costs.
One aspect of this process is to apply alternative routings from origin ramps
in the
simulation process to control bottlenecks at mixing centers. The process
focuses
on the mixing center as the resource most likely to experience bottlenecks,
and on
the origin ramp and the best source of high volume workarounds. The simulation
tool 38 is used to predetermine the best workaround contingencies for the
known
production schedule, taking into consideration the relative cost and the
effect on
cycle time. Any expected origin ramp release of a "batch and hold" is
incorporated
into the simulation tool model. In operation of the network, flexing normal
routes
in response to contingencies on a day to day basis produces improved cycle
times,
and the routing planning process 300 builds such contingencies into the
routing
plans stored in the routing plan database 310. After several iterations of the
simulation tool analysis, a best plan is accepted and communicated as
described
above to the carriers and the management team.
Reducing the ratio of mix railcar loads to LTD loads in load plans 315 is an
example of a technique that is applied to origin ramps. Refernng to Fig. 2,
assume
that the simulation predicts that the need to a few VINs on a mix railcax will
prevent an entire train of LTD railcars from bypassing the mixing center. In
this.
case, the extra flexibility available in assigning alternative routings may
result, for
example, in sending the mix load VINs directly to a destination ramp or dealer
by
car hauler even though such a destination is farther than the normal limit for
direct
car hauler delivery. The VIN routing operations process 307 generates time
phased workload plans across the network for scheduling personnel and
equipment
and for notifying management team members at various network facility points
of
upcoming needs. The management team then has the accurate information it needs
to assure that downstream facilities and carriers have labor and haul away
capacity
in place to carry out the routing plan. This process also calculates VIN ETAs
at
rail switchout points that the network is capable of meeting.
-90-
CA 02401555 2002-08-21
WO 01/65454 PCT/USO1/06652
Actual network performance is tracked by providing metrics 316 (cost per
VIN and cycle time) and "report cards." The following table shows a comparison
of a VIN routing plan 330 to the VIN's routing actual data 334, allowing the
management team to assess on time delivery performance.
VIN Plan
VIN lFaxxxxxxxx
Produced
at 9/15,
to be delivered
9/26
Ship FacilityPlanned ShipReceipt Planned Mode
Date Facility Recei t Date
Ori in ram Shi 9/17 To FostoriaReceive 9/19- "
m/c ~
Fostoria Shi 9/20 To destin Receive 9/23
ramp
Destin ram Shi 9/24 To Dealer Receive 9/26
VIN Actuals
Transaction Facility Date
Shi Origin ram 9/18
Receive Fostoria 9120
Shi Fostoria 9/22
Receive Destin ramp 9/24
Shi Destin ramp 9/25
Receive Dealer 9/28
-_______________________________________
Segment events can be summarized to provide "report cards" such as the
following chart, which can be utilized to update the simulation model.
________________________________________
Report Cards
Segment Plan lead Actual On Time
time Lead Percenta
time a
Origin ram to Mix Center2 days 2 days 100%
Mix Center 1 2 50%
Mix Ctr to Destination3 2 150%
Ram
Destination Ram 1 1 100%
A post planning process is carried out to allow the management team to
identify new problems requiring solutions or contingencies, to monitor and
coordinate the execution of the routing plans in operation of the network, and
to
-91-
CA 02401555 2002-08-21
WO 01/65454 PCT/USO1/06652
maintain the accuracy of the network model and initial conditions used by the
simulation tool.
Geographic Build. Preferably, the planning tool 34 also will influence
scheduling of vehicle production so that advanced geographic build practices
are
utilized at vehicle assembly step 213 of Fig. 55. In one embodiment,
manufacturer
production volume is planned to meet available delivery network capacity.
Geographic build will be utilized to smooth the volume levels for a given
destination ramp based on the planned production forecast for a given week.
This
will allow for a more consistent flow of vehicles by day within each week,
while
adhering to the total planned production to each destination for the week.
Based
on advance notice of dealer orders (for example, three weeks lead-time prior
to
production), the planning tool will be used to provide a production schedule
request to a manufacturer indicating the desired daily leveling of volume for
a
given week. This production schedule request will be based on current network
operating capacity, rail and haulaway Garner performance and total forecasted
volume for each destination ramp. The production schedule request can be input
by the manufacturer into the manufacturer's production scheduling solve
algorithm.
Pursuant to another aspect of geographic build, the planning tool
scheduling request can specify consolidation of production for shipment to lbw
volume destinations into a more condensed pattern. Also, with access to long
range production forecasts, the planning tool will be used to reduce spikes
incurred
by fleet sales to auto rental agencies or corporations by spreading production
of
such vehicles to evenly use capacity in the delivery network.
In another type of geographic build, in response to prediction of bottlenecks
or actual bottlenecks in the network, the manufacturers can alter the sequence
in
which particular VINs enter the network (to ease congestion in particular
lanes),
adjust the ratio of LTD to mix loads, or otherwise affect the sequence of VINs
at
network facility points experiencing congestion or bottlenecks. If a
manufacturer
uses a logistics program to coordinate arrival of parts at a plant for
production over
a following number of days, the manufacturer can plan the vehicles to be made
in
that period of days by ordering a particular set of parts to fit network
capacity, or
can alter the sequence in which the planned vehicles are assembled. For
example,
-92-
CA 02401555 2002-08-21
WO 01/65454 PCT/USO1/06652
making enough vehicles going to the same destination ramp can increase the
ratio
of LTD loads to mix loads.
Geographic build may be used to control the number of vehicles built for
particular destinations over a period of time, such as a week. In the
alternative,
vehicles for a particular destination may be made only on one day of the week,
to
allow more efficient car hauler loads. In some cases a plant near the first
destination may make vehicles going in the other direction only on a day of
the
week that allows the same car haulers to make an efficient round trip. For
example, the manufacturer may do a Louisville to Atlanta build on Monday, and
an
Atlanta to Louisville build on Tuesday. The same car haulers could then
transport
both sets of vehicles.
In a preferred embodiment, the manufacturer produces vehicles in an order
such that a group of vehicles going to the same destination ramp is released
in
sequence, allowing the vehicles to be loaded onto railcars without parking
them in
a holding area.
Daily Routing Plan Process. A daily routing plan process is summarized in
Fig. 59. Various updates to the simulation model are represented at block 340,
and VIN profiles, family data, and production schedules are represented at
block
341. These pre-routing inputs include batch and hold updates, facility
capacity
updates, carrier updates, and route contingency plans. These inputs are
associated
with a set of simulation parameters at block 344, depending on the current
iteration
of route planning. Iteration no. 1 assumes unlimited capacity at mixing
centers
and takes into account batch and hold expectations at the origin ramps. The
simulation tool does a routing analysis at block 345, assessing the magnitude
of the
worst predicted mixing center problems and the possible origin ramp options
for
dealing with those problems. Plan metrics, including the cost per VIN and the
cycle time to complete the plan, are output. The process of optimizing and
simulating then returns to block 344 for iteration no. 2, which uses the real
capacity of the mixing centers. On this iteration, the simulation tool at
block 345
integrates origin ramp workarounds into the model, and outputs the same
metrics.
The process again returns to block 344 for iteration no. 3, which uses the
best
workarounds, and at block 345, outputs a final plan with update VIN ETAs,
-93-
CA 02401555 2002-08-21
WO 01/65454 PCT/USO1/06652
verifies that the final plan is acceptable, identifies any continuing problem
attributes for post-planning evaluation, arid provides a plan summary. At
block
349, the plan is accepted. The routing process includes a mixing center
review,
planning for origin ramp contingencies, planning cycle time, planning a cost
summary, and updating ETAs. Block 350 represents post routing analysis and
adjustments to be applied to the next daily routing process, based on review
of
final cycle time and cost, workloads, new issues that arise, and lead time
analysis.
It will be understood that the techniques described above can be
implemented by an operator examining the simulation tool output, as well as
automatically.
hehicle Flow in the Routing Plan
Returning to Fig. 56, the vehicle assembly step 212 is followed by a plant
release event of the finished vehicles at block 213. At block 214, the
vehicles are
divided into held VINs 216 and shippable VINs 217. Those held eventually
become shippable at block 218, their ship date is recalculated at block 220,
and
they return to shippable status at 217. Next, they are loaded by vehicle
manufacturer employees 33 or load/unload contractors 35 (See also Fig. 45) at
block 222 either onto a railcar at block 223 or a car hauler at 225. The car
hauler
28 conveyance may be routed to a dealer 29 for final delivery at block 226, or
may
proceed to a rail yard or consolidation hub of the type described above at
block
228. At such a loading point, the car hauler is unloaded at 229 and reloaded
at
block 230 onto a railcar as indicated at block 223.
Staging of vehicles at origin plant consolidation hubs and mixing centers,
as well as loading and unloading of vehicles onto or from railcars, is
typically done
by employees of an independent load or unload contractor 35 (see also Fig.
45).
Rail carrier personnel 41 include personnel to operate and switch railcars and
trains. Car hauler personnel 37 include drivers and assistants who typically
load
and unload, as well as drive, car hauler trailers. However, the system 10 also
contemplates car haulers engaging independent load or unload contractors. In a
system according to the present invention, these independent employers are
supervised and coordinated by the management team, taking advantage of the
-94-
CA 02401555 2002-08-21
WO 01/65454 PCT/USO1/06652
visibility of the network made possible by the tracking system 34, and the
routing
and workload plans received from the planning tool 36.
Trains of railcars at 223 are in transit to a switching point 232, a mixing
center 233, or a destination ramp 235. A railcar arrival event at the mixing
center
is indicated at block 237, following which the railcars are staged at 238
either to an
area 239 for mixed loads or a yard 240 for LTD (unmixed) loads that will
bypass
the mixing center process. The mixed loads are unloaded at block 242 and
reloaded at 243 onto railcars after sorting. At block 245, new trains are
built from
the railcars of newly sorted vehicles and the LTD railcars. A railcar
departure
event from the mixing center is indicated at block 247, followed after transit
time
by a railcar arrival event at a destination ramp indicated at block 235. The
vehicles
are unloaded from the railcars at block 249, and loaded at 250 onto car
haulers 251
for transport to a dealer for final delivery at block 252. It should be
understood
that Fig. 56 shows a simplified version of the delivery network. The actual
network includes multiple origin points, mixing centers, destination ramps,
and
dealers. Trains traveling between mixing centers and destination ramps may
stop
at a switching point for the addition or subtraction of railcars.
Plant to Dealer Examples. Figs. 61 - 65 show vehicle flows for several
specific examples using a vehicle delivery system 10 according to the present
invention. Figs. 61 and 63 illustrate the process 400 for transporting
vehicles on .
LTD railcars from a Michigan truck plant to a California (Mira Lorna)
destination
ramp via a Kansas City mixing center. At step 401, a bar code or other encoded
symbol on a completed VIN is scanned into the tracking system 34 and at 402
the
vehicle is released by the manufacturer as ready for shipment. The vehicle is
inspected by a load contractor at 403, found acceptable for rail
transportation at
404, and staged by the load contractor in a geographic load line of an
outbound rail
yard at 405. The VIN is scanned to update its status. The geographic load line
may be outside the origin plant, or may be a consolidation hub 25c for
consolidating vehicles either produced at multiple plants of the same
manufacturer,
or commingled from plants of different manufacturers. Until enough vehicles
have
been released to fill a rail car, at 406, the vehicles in the load line wait
at 407, and
then they are loaded onto a rail car at 408 and tied down at 409. The VIN
identification code is tied in the tracking database 50 with a scanned railcar
-95-
CA 02401555 2002-08-21
WO 01/65454 PCT/USO1/06652
identification code. The routing plan will assume a standard maximum time of,
for
example, 24 hours between plant release and scanning of a rail car containing
the
vehicle upon the rail car moving out of the loading area at 410.
The management team 31 oversees the staging and loading process,
utilizing a routing plan for each VIN received on workstations 42. The routing
plan detail includes an indication of where each VIN should be staged prior to
loading so that the VIN will efficiently begin its proper lane segment
according to
the routing plan. As key events occur to the VIN, its code is scanned by the
management team 31 or personnel under their supervision, and the information
is
transmitted through the workstations 42 or through the communications
interface
40 to update the tracking database 50 The management team 31 also may manually
enter status information to the tracking database. The involvement of
personnel
employed by the carriers and the load/unload contractors is shown
diagrammatically in Fig. 60 for typical LTD and mix scenarios.
The management team 31 also may receive an alert concerning a VIN via
the workstation 42. For example, if a VIN's status has not been updated to
indicate
it has been loaded within a planned time from its plant release, the
appropriate
team member will receive an alert. Based on the alert, the team member will
determine the reason for the delay and takes steps to get the VIN back on
schedule.
20~ The management team 31 also deals with capacity problems that arise at
origin points. For example, if 100 vehicles are held prior to release for a
day, and
then are released along with the next day's production of 100 vehicles, and
the
capacity of the origin ramp for loading vehicles is 100 vehicles per day, the
members of the management team 31 on site at the origin point will consider
options for resolving the problem. They may level the shipment volume by
spreading the 100 car backlog over time on a first-in first-out basis, in
conjunction
with finding additional railcars to handle the increased volume level. A
contingency planning group of the management team 31 is notified, and the
contingency planning group in turn notifies all affected managers,
contractors, and
carriers. An equipment control group of the management team 31 also is
notified
so that they can assist in obtaining additional railcars, as well as dealing
with the
effect of diverting any of such railcars from other parts of the delivery
network.
The team members on site might also consider shipping all 200 vehicles on
their
-96-
CA 02401555 2002-08-21
WO 01/65454 PCT/USO1/06652
day of release, but this would create an activity spike at the next operation
downstream, overloading capacity there. Also, finding equipment to ship double
the usual quantity of vehicles would be more difficult.
The management team 31 uses the following form to guide it through
problem analysis:
Questions Your Res oases
What solutions) do you
ro ose?
What steps will you
follow to
resolve the situation?
Who will you contact?
What alternatives did
you
consider?
What makes your solution
the
best?
Another example of a capacity problem at an origin point might be a rail
equipment shortage. This problem might be dealt with using a car hauler
diversion
by using existing car hauler capacity to make up for the rail equipment
shortage, so
long as the diversion of car haulers would not jeopardize planned car hauler
shipments. Again, the contingency planning group and equipment control group
would be notified. An option of holding vehicles at the origin point probably
would be rejected in order to maintain schedule for all the vehicles.
The management team 31 at other locations would deal with problems in a
similar way. For example, the team at a mixing center might find that luxury
vehicles were damaged in loading, or that some VINs have been mis-routed, or
that
there is a bottleneck at the next destination point for some VINs, or that
there is an
unexpected 24 hour delay due to rail congestion. The team at a destination
ramp
might find that a dealer is not open to receive vehicles that have arrived at
the
ramp, or that congestion at the ramp makes it impossible to bring in any more
vehicles although more are scheduled to arrive, or that there are not enough
car
haulers to deliver to dealers the vehicles present at the ramp.
Continuing with the vehicle flow of Fig. 61, the loaded rail cars are blocked
at 412 by rail carrier personnel to build a train, which leaves the origin
point at 413
within 36 hours if the standard schedule time is met. In this example, the
train
travels directly to the Kansas City mixing center, where the rail car
containing the
_97_
CA 02401555 2002-08-21
WO 01/65454 PCT/USO1/06652
VIN is pushed onto support tracks at 415 by rail carrier personnel (in the
case of
LTD railcars). The railcar is scanned on departure from the origin point and
on
arrival at the mixing center. Within a period of time, planned to be no more
than
24 hours, the rail car is consolidated by rail Garner personnel at 416 with
others
bound for the Mira Loma destination ramp as a train is built. At 417 the
railcars of
the train are scanned, and the train begins its long trip, about 48 hours, to
Mira
Loma.
Referring now to Fig. 63, the rail cax arrives and is scanned at the Mira
Loma ramp at 427. Unload contractor employees unload the railcar within 6
hours
if on schedule, at 428, and place it in a geographic bay according to dealer
location
at 429. The vehicle is scanned on arrival at the bay, where the haulaway
contractor
inspects the VIN at 430 for any damage caused in transit thus far. The
contractor
loads the VIN onto a car hauler and scans it at 432, ties down the VIN at 433,
and
drives the car hauler to the dealer at 435. The VIN identification code is
tied in the
tracking database 50 with a scanned haulaway trailer identification code. The
cax
hauler contractor personnel unload the VIN at the dealership at 436, the
dealer
gives the VIN a final inspection at 437, and a final scan is done to update
the
tracking system with an indication of completion of transport and acceptance
by
the dealer. The scheduled maximum time between arrival at the geographic bay
and final inspection is 48 hours.
Fig. 62 shows a vehicle flow for a somewhat different.process 440 for
transporting vehicles initially on car haulers from a car plant in Michigan to
a
California (Mira Loma) destination ramp via a two mixing centers. Steps 441 to
443 are identical to steps 401 to 403 described above. However at 444 the VIN
is
scanned and accepted for haulaway transport and contractor personnel stage the
VIN to a load line at 445. When there are enough VINs to fill a truck load as
noted
at 446 (if not there is a wait at 447), the car hauler personnel load their
rig at 448
and tie down at 449. The VIN identification code is tied in the tracking
database 50
with a scanned haulaway frailer identification code. The rig moves out at 450
and
travels for a time represented by 452 to the Fostoria, Ohio, mixing center
where at
455 the VIN is unloaded, scanned, and staged for inspection by an unload
contractor. At 456, the unload contractor inspects the VIN and sends it to a
geographic load line at 457 for consolidation with other VINs bound for the
same
_98_
CA 02401555 2002-08-21
WO 01/65454 PCT/USO1/06652
destination ramp. When there are sufficient VINs to fill a railcar for that
destination as noted at 458 (wait at 459), the contractor loads a rail car at
460,
scans the VINS loaded and the rail car, and ties down at 461. Steps 462 to 466
are
identical to steps 410 to 416 above, as the train travels to the Kansas City
mixing
center, the railcars are rebuilt into trains. Then the process continues with
the steps
of Fig. 62 as described above, culminating in delivery to the dealer.
Fig. 64 shows a vehicle flow for a somewhat different process 470 for
transporting vehicles on mix railcars from the Michigan truck plant to a
Phoenix,
Arizona, destination ramp via the Kansas City mixing center. Steps 471 to 474
are
identical to steps 401 to 404 described above as the VIN is released and
identified
for rail transport. At 475, the vehicle is staged at a load line with others
bound in
mixed loads .for the Kansas City mixing center. Steps 476 to 483 are identical
to
steps 406 to 413 described above as the VIN is loaded onto a railcar and
travels by
train to the mixing center. The railcar is pushed by rail carrier personnel
into ramp
tracks at the mixing center at 485, where the VINs are unloaded at 486 by
unload
contractor personnel, scanned, and inspected by the contractor at 487. The
contractor determines that the VIN's next lane segment will be by rail at 488
(using information from the tracking database 50). Steps 489 to 496 are
identical
to steps 457 to 464 described above, as the VIN is shipped by rail to the
destination
ramp. The process continues with the steps of Fig. 63 as described above, . .
culminating in delivery to the dealer.
Fig. 65 shows a vehicle flow for a process 500 for direct delivery from
origin plant to dealer by car hauler. At step 501, a bar code or other encoded
symbol on a completed VIN is scanned into the tracking system 34 and at 502
the
vehicle is released by the manufacturer as ready for shipment. The vehicle is
inspected by a load contractor at 503, and staged by the load contractor in a
geographic load line at 504. The load contractor scans the VIN and loads it
onto a
haulaway trailer at 505, and ties down at 506. The V1N identification code is
tied
in the tracking database 50 with a scanned haulaway trailer identification
code.
Travel to a dealership is indicated at 507, followed by unloading of the V1N,
which
is scanned on arnval. Final inspection by the dealer and acceptance occurs at
509,
and the accepted status of the VIN is sent to the tracking database. A
standard time
of, for example, 72 hours, is established in the routing plan for this total
process.
-99-
CA 02401555 2002-08-21
WO 01/65454 PCT/USO1/06652
MANAGEMENT TEAM
This management structure is responsible, primarily, for the reliable, safe
and expeditious delivery of manufactured vehicles from all plants through a
distribution network 20 to all dealerships located throughout the United
States and
Canada. As shown in Fig. 45, this management structure is provided by a
management team 31 which consists of a pool of managers which provide on-site
and remote management to a plurality of entities, providing a "management
layer".
Fig. 45 is a management flow chart showing how the management team 31
provides a "management layer" over (although not necessarily directly
supervising) various other entities which may not necessarily be employed by,
paid, or salaried employees of the management team 31. These entities include
but
are not necessarily limited to manufacturer's personnel 33, vehicle
loading/unloading contractors 35, car hauler personnel 37 (who operate car
haulers
28), rail carrier personnel 41 (who operate trains 23), and dealers 29. It
should be .
understood that the car hauler personnel 37 and rail carner personnel 41 could
be
referenced generically herein as "carner" personnel. It should also be
understood
that preferably this management is done via contact with the management
structure
of the above entities. However, it should be understood that the activities
and
results of those being managed (e.g. hourly workers) will be monitored as many
of
.20 the management team will be on site. Figs. 46-54 show other management
structure diagrams.
Such a management structure is configured to provide the following
in conjunction with other features of the present invention:
a) Providing a network to satisfy suitable business requirements,
b) Delivery to dealerships not to exceed a designated number of transit in
any point to point lane or segment days (8 days in on embodiment),
c) Visibility of vehicles as they are transported through the network and,
d) Management of the network provided to facilitate the delivery.
The following discussion describes the plan for managing the network, as
well as give an overview of an overall implementation plan, allowing for an
effective assumption of those responsibilities as stated above. This
incorporates
-ioo-
CA 02401555 2002-08-21
WO 01/65454 PCT/USO1/06652
training of the management team, as well as dispatch and positioning in the
field,
ultimately encompassing the entire North American continent.
The management structure has assumed responsibilities for managing an
existing automotive distribution network 20. Under one embodiment of the
present
invention, the management structure consists of two main groups or functional
responsibilities:
1) a Staff and Support group which includes planning, contingency,
finance, customer service and relationships, and the like, and
2) an Operations group which is positioned throughout the system
managing the vendors responsible for the transporting of the vehicles.
Both of these groups, while being accountable for specific portions of the
distribution network 20 management, work closely together to effectively
manage
the distribution network 20 and improve efficiencies as the network and its
management evolve. Assumption of the responsibility of the network is being
achieved through a phase-in program designed to assume management of specific
areas of the network with each phase *check with client re status*. As each
phase
is added, areas introduced in prior stages are turned over to the mmagement
people
responsible for those lanes and segments. Prior to each of the five
implementation
phases, training workshops will be held with each of the management groups as
they are added. Such training can include learning about the vehicle
manufacturer,
vendor management, business conduct and compliance, railroad and car hauler
practices, etc.
Managemefat Method
Before discussing the management techniques, it is first beneficial to
understand the concepts and applications utilized during the design phase of
the
proj ect.
-ioi-
CA 02401555 2002-08-21
WO 01/65454 PCT/USO1/06652
In designing the network, a few basic principles of transportation
management were invoked:
1) Work within the system as upstream in the process as possible.
2) Minimize handling of the units.
3) Bypass intermediate sites and facilities wherever possible.
4) Volume creates opportunity. (The larger (the train), the better).
With these principles in mind, a network was plotted after determining
North American distribution of the vehicles, the purpose and position of the
four
mixing centers which happen to exist in the current delivery network,
productive
and time-definite segments and lanes, and the characteristics of the
manufacturing
plants: location, product type, manufacturing schedule, and facility
constraints.
As a result of these determinations, rather than being treated as stand-alone
origins, the plants were theoretically grouped together to create syngular
origin ,
sites consisting of one, two, up to five plants (in the case of the Michigan
Plants),
combining their production to be introduced into the network. This concept
became an enabler of the application of several of the stated principles,
beginning
with #4 - volume creates opportunity. As the volume levels increase from the
combination of multiple sites, the distribution of the production takes on new
~ ~.,
meaning, forming a larger pool from which to draw like destinations. This in
turn
provides for the ability to build more direct (bypass) railcars based on
average load
ratio's, eliminate handles, and begins with the vehicle coming off the
assembly line
as a finished product ready for transport - Principles 2 and 3.
Prior to actual production, a concept known as Geographic Build is applied.
This planning model consists of capturing Sales data, and mathematically
scheduling the production to produce level distribution of the product as it
enters
the network. This schedule reduces/eliminates large daily fluctuations in
distribution which occur in the first stages of the network today, causing
varying
demands on staffing, equipment, and power. Ultimately the intent is to manage
the
system to the dealer level, which will produce significant production and
economic
gains to the car haulers 37. This process of setting the manufacturing
schedule
- 102 -
CA 02401555 2002-08-21
WO 01/65454 PCT/USO1/06652
based on output requirements of the transportation of the product to market
satisfies Principle #1 listed above: work as far upstream in the process as
possible.
Managing the network is a direct reflection of the approach taken in
designing the network. The system is managed utilizing a "Push-Pull" method of
accountability and system performance.
Each origin location (grouping) is managed by the management, with on-
site personnel. Their responsibility is to effectively and accurately "push"
the
vehicles out into the distribution network 20, using flow plans and load make-
ups
incorporated in the design of the network. In addition to the loading of the
railcars
with specific destinations, these origin management people are responsible for
building the trains, in sequence. These trains are built and blocked, based
upon a
planned system, dependent on the destination of the train.
As this occurs, management people at the destination locations (Mixing
Centers, Hubs, and Ramps) are "pulling" the vehicles through the distribution
network 20. This pull effect is accomplished through continuous monitoring of
the
transport mode being utilized as the vehicles progress through the system.
While the vehicles are in transit, the destination management are working
with the vendors responsible for final delivery. They are providing
information
and helping in the planning process for upcoming operations based upon what is
flowing through the network, the requirements of the transportation cycle, as
well
as the reliability, accuracy, and performance of the network while it is being
managed.
Between the origin and final destination are the existing Mixing Centers.
These facilities are managed on a daily basis. This management group works
using its own internal method in opposite fashion: they are in effect '
pulling"
trains into the Mixing Centers, and then ' pushing" them back out again. The
change in focus of the Mixing Centers also becomes apparent here. In the
design
of the network, as stated earlier, by combining plants, the opportunity to
create
direct rail cars and bypasses increases dramatically. This reduces the amount
of
mixed volume having to go into the Mixing Centers. As each origin point is
implemented, the Mixing Centers evolves from predominantly an unload/reload
(of
mixed volume) operation, to a large majority of their activity becoming train
management. This train management consists of bringing trains in, breaking,
-103-
CA 02401555 2002-08-21
WO 01/65454 PCT/USO1/06652
switching, and rebuilding them to create pure direct trains to ultimate and
final
destinations. One should keep in mind here that facilitating the building of
these
trains at the Mixing Centers is greatly enhanced by the origin point
management
directing the building and blocking of the trains prior to their departure to
the
Mixing Centers. The trains from each of the origin locations are integrated
into
single units with planned routes to destination-hubs and ramps.
Remaining volume, "mixed" volume, is handled through a coordinated
effort between multiple plant sites within each grouping and the Mixing
Centers.
This is accomplished on a daily basis dependent upon the production schedule
and
destination of the VIN's. Low volume levels (<6 vehicles to a single ramp)
dictate
that those vehicles are moved to the Mixing Centers for loading and creating
direct
rail cars. Other, mid range volume levels, suggest that one Plant build a
partial
railcar for a particular destination, while vehicles to that destination from
other
plants, even within the same origin grouping, are moved to the Mixing Centers.
At
this time, those random vehicles would be loaded on to the partial railcar,
creating
a full load departing the Mixing Center.
Witlun the management structure, several other groups exist with varied
areas of responsibility in support of the Joint Venture and/or the operators
in the
field:
A) Plannin~ystems - Each Zone of Operation has a Planning &
Systems group assigned to it. While operating independently and focusing on
operations within their respective zones, they are collectively responsible
for
integrating the entire network into a single operating unit. Each Planning &
Systems Group Manager has a Network Planning Manager and Supervisor
assigned. These people are responsible for the planning of the operations,
both
long range and short term, as well as continuously reviewing the network and
seeking ways to improve efficiencies. The basic planning model progresses
through a 90-, 60-, 14-, and S-day projection process for production
scheduling and
determine the system requirements on a daily basis once the vehicles are
produced.
Currently, 14-day projections are 95% accurate, while 5-day projections to the
build order run above a 98% accuracy rate. Geographic Build (as described on
Page 5) are determined by this Planning Group.
-104 -
CA 02401555 2002-08-21
WO 01/65454 PCT/USO1/06652
As the vehicles are released into the distribution network 20, there are two
separate groups working behind the scenes. One group, reporting to the West
Zone
Planning & Systems Division Manager, are responsible for tracking of the
vehicles
as they flow through the system and monitoring performances as they relate to
the
Standards Metrics established for each segment and lane. As situations arise,
this
group is responsible for developing contingency plans to recover lost or
delayed
transit time while the vehicles are enroute. They communicate with the
operators
in the field to respond to the contingencies, and manage the required
adjustments
through the operators and vendors. The second group, reporting to the East
Zone
Planning & Systems Division Manager, is responsible for tracking and directing
the positioning of empty rail equipment. This group works through the
appropriate
railroads and equipment managers to insure that sufficient railcars for
loading are
in place at each plant and mixing center.
Completing the responsibilities of the two Planning & Systems Division
Managers are Customer Service, reporting to the East Zone, and Systems/IS
reporting to the West Zone. The Customer Service people are responsible for
maintaining relationships between the management team 31 and all of its
customers, both internal and external. All questions, comments, suggestions,
etc as
they relate to the management team 31 flow through this group. Systems/IS
consists of a Manager and two Supervisors. Their responsibilities reflect
those of a
Help-Desk scenario, where they are available to aII users of the vehicle
tracking
system 34 for system-related problems or questions. Initially they will be
staffed
for 24-hour coverage; determinations are made as the management team 31
evolves as to the requirement of total coverage and the demands on the people
in
the performance of this activity. They also serve as a first-pass evaluation
of new
systems or development requested by management team 31 personnel. Upon their
approval, established procedures for software development, hardware purchase,
etc
follow.
B) Finance - The Finance Group is responsible for all categories associated
with expenses, revenue, and accounting for the management team 31. Initially,
Freight Payment is conducted by vehicle manufacturer employees working for the
management team 31. As systems are developed and merged, payment to the
vendors is done electronically, eliminating the need for these people. This
plan
-ios-
CA 02401555 2002-08-21
WO 01/65454 PCT/USO1/06652
takes into consideration the eventual assumption of Contract responsibilities
by the
management team 31 with the vendors. As existing contracts between the vehicle
manufacturer and the transportation vendors reach maturity, they are handed
over
to the management team 31 for negotiation and ownership of the contracts. As
in
the case of the Freight Payment, in a final embodiment transfer of this to an
electronic system controlled by the management team 31 will be in place.
Finally,
the Finance group is responsible for the effective management of revenues,
cost
control systems, Business Planning models and completion, buildings and
facilities, etc.
C) Railroad Operations, Car Hauler Operations - while constituting two
separate and distinct branches within the management structure, the
responsibilities
of these groups run parallel to each other. Representative management people
for
each of the major vendors are the liaison between the management team 31 and
the
vendor corporations. Initial responsibilities include establishing
relationships with
the vendors, and assisting in the implementation of the new network from the
vendor perspective. As the system grows, additional areas of responsibility
will be
added to this group as they involve the vendors. These responsibilities will
include
performance reporting and reviews, contract negotiations, business
opportunities
which are created, etc. This group will in no way influence the expectation ~
that
every field operator is expected to develop working relationships with each
vendor
appropriate to their portion of the network. The partnership approach
suggested
here will be critical to the success of the network in each of the lanes and
segments.
Maraagement Apparatus
The management of the manufacturer's distribution network 20 requires
and incorporates several tools and systems. Perhaps the most important of
these
systems is the tracking system 34. This system will actually provide value and
assistance to two separate entities.
-106 -
CA 02401555 2002-08-21
WO 01/65454 PCT/USO1/06652
The tracking system 34 is a system that provides visibility of the unit to the
user. The tracking system 34 will let the inquiring person know the units'
location
in the pipeline, its' status compared to a planned time in transit at each
stage of the
transportation, provide for alerts and alarms when units fall behind schedule,
and
give a view of the network in progress, down to the vehicle level if desired.
This
has been recognized by the inventors as being critical to assuming
responsibility
for the manufacturer's distribution network 20. Visibility of the vehicles in
transit
will be a quantum leap forward towards improving delivery times.
Management Results
Performance of the network are to be reviewed on a daily basis.
Under one embodiment of the invention, daily performance reviews will be
conducted with the local vendors by the local-area management people. Along
with these reviews are improvement action plans and accountability discussions
to
satisfy the standards for each destination.
Monthly reviews are planned at a higher level. At this point in time, under
one embodiment of the invention, Division and Zone Managers assume
responsibility for these sessions with each Garner, at corresponding levels
within
their organizations. These reviews also include the appropriate Support
functions
and the management people designated as Garner representatives.
Critical to the success of the time in transit improvements are
improvements internal to the manufacturer's organization. These changes
include
a re-definition of when a vehicle is considered in transit. In today's
operation, the
vehicle delivery time begins when the unit comes off the assembly line,
although it
may be placed on hold immediately; sometimes for several days. Another change
necessary to accurately assess the performance of vehicle delivery is the
expansion
of geographic build. This procedure described earlier, based on distribution
of
build orders, is designed to even the flow of vehicles throughout the system,
maximize the utilization of the network, and optimize cost effectiveness of
both the
vendors and the management team 31.
-io~-
CA 02401555 2002-08-21
WO 01/65454 PCT/USO1/06652
Additional improvements included flexible dealer delivery schedules,
correct geographic sourcing of the production of models or product types based
on
their final destination, and evaluation of engineering restrictions placed on
certain
vehicle types for transportation securing devices.
S
One additional improvement is the use of training sessions and workshops
for the management team.
COMPUTER-IMPLEMENTED ASPECTS
As will be appreciated by one of ordinary skill in the art, some aspects of
the present invention may be embodied as a method, a data processing system,
or a
computer program product. These aspects may take the form of an entirely
hardware embodiment, an entirely software embodiment or an embodiment
combining software and hardware aspects. Furthermore, these aspects may take
the form of a computer program product on a computer-readable storage medium
having computer-readable program code means embodied in the storage medium.
Any suitable computer readable storage medium may be utilized including hard
disks, CD-ROMs, optical storage devices, or magnetic storage devices.
The present invention is described above with reference to block diagrams
~' 20 and flowchart illustrations of methods, apparatus (i.e.~ systems) and
computer
program products according to embodiments of the invention. It will be
understood that in appropriate circumstances a block of the block diagrams and
flowchart illustrations, and combinations of blocks in the block diagrams and
flowchart illustrations, respectively, can be implemented by computer program
instructions. These computer program instructions may be loaded onto a general
purpose computer, special purpose computer, or other programmable data
processing apparatus to produce a machine, such that the instructions which
execute on the computer or other programmable data processing apparatus create
means for implementing the functions specified in the flowchart block or
blocks.
These computer program instructions may also be stored in a computer-readable
memory that can direct a computer or other programmable data processing
apparatus to function in a particular manner, such that the instructions
stored in the
computer-readable memory produce an article of manufacture including
instruction
-~os-
CA 02401555 2002-08-21
WO 01/65454 PCT/USO1/06652
means which implement the function specified in the flowchart block or blocks.
The computer program instructions may also be loaded onto a computer or other
programmable data processing apparatus to cause a series of operational steps
to be
performed on the computer or other programmable apparatus to produce a
S computer implemented process such that the instructions which execute on the
computer or other programmable apparatus provide steps for implementing the
functions specified in the flowchart block or blocks.
Accordingly, when appropriate for full or partial computer implementation,
blocks of the block diagrams and flowchart illustrations support combinations
of
means for performing the specified functions, combinations of steps for
performing
the specified functions and program instruction means for performing the
specified
functions. It will also be understood that such blocks of the block diagrams
and
flowchart illustrations, and combinations of blocks in the block diagrams and
flowchart illustrations, can be implemented by special purpose hardware-based
computer systems which perform the specified functions or steps, or
combinations
of special purpose haxdware and computer instructions.
CONCLUSION
Therefore it may be understood that the present invention provides a
product delivery system that can move products from manufacturing plant to
destination more quickly and reliably. The invention minimizes handling of
products, maximizes bypassing of intermediate sites, and moves products in
laxger
volumes or batches. In a vehicle delivery context, these improvements
translate
into more direct trains, larger trains, and faster delivery from plant to
dealer. The
present invention provides a novel centralized management organization
overseeing a number of separate parts of the network, and provides improved
visibility of delivery network to the management organization, as well as
improved
tools for operating the network. These tools benefit from the information
collected
on the status of the network. The invention also provides a system that can
influence the sequence in which the products are manufactured in a manner that
makes operation of the delivery network more efficient.
Many modifications and other embodiments of the invention will come to
mind to one skilled in the art to which this invention pertains having the
benefit of
- 109 -
CA 02401555 2002-08-21
WO 01/65454 PCT/USO1/06652
the teachings presented in the foregoing descriptions and the associated
drawings.
Therefore, it is to be understood that the invention is not to be limited to
the
specific embodiments disclosed and that modifications and other embodiments
are
intended to be included within the scope of the appended claims. Although
specific
terms are employed herein, they are used in a generic and descriptive sense
only
and not for purposes of limitation.
-iio-