Note: Descriptions are shown in the official language in which they were submitted.
CA 02414443 2002-12-24
WO 02/05205 PCT/USO1/21461
-1-
METHOD AND SYSTEM FOR MODELING BIOLOGICAL SYSTEMS
CROSS-REFERENCE TO RELATED APPLICATION
This application claims the benefit of priority of provisional U.S.
S patent application Serial No. 60/216,576, filed July 7, 2000, which is
incorporated herein by reference.
BACKGROUND OF THE INVENTION
Field of the Invention
The present invention relates generally to a method and system for
quantitative and semi-quantitative modeling of biological systems.
Description of Background Art
As part of the drug discovery process, increasing amounts of DNA
sequence data, RNA expression data, protein expression data, and other
types of data are being generated. In particular, recent breakthroughs in
developing automated methods of obtaining gene expression and protein
expression data (including microarray-based technology) have allowed
researchers to collect vast amounts of new data. Indeed, DNA sequence,
RNA expression and protein expression data sets are being generated at
rates that vastly exceed the research community's ability to interpret them.
Researchers need to store, analyze, link, and compare heterogeneous
data from many sources, including in-house databases, public databases,
and private content-providers. Commonly used public databases of
sequence analysis data include: CCSD (Complex Carbohydrate Structural
Database); EMBL (nucleic acid sequences from published articles and by
direct submission, sponsored by the European Molecular Biology
Laboratory); GenBank (nucleic acid sequences, sponsored by the National
Institute of General Medical Sciences (NIGMS), NIH and Los Alamos
Laboratory); GenInfo (nucleic acid and protein sequences, sponsored by the
National Center for Biotechnology Information (NCBI) and NIH); NRL_3D
(protein sequence and structure database); PDB (protein and nucleic acid
CA 02414443 2002-12-24
WO 02/05205 PCT/USO1/21461
_2_
three-dimensional structures); PIR/NBRF (protein sequences, sponsored by
the National Library of Medicine (NLM)); OWL (protein sequences
consolidated from multiple sources, sponsored by the University of Leeds
and the Protein Engineering Initiative); and SWISS-PROT (protein
sequences, sponsored by the University of Geneva).
Furthermore, researchers need analytical tools to analyze and make
sense of the mountains of bioinformatics data currently being generated. In
particular, researchers need, and are increasingly making use of, highly
detailed computer simulations of biological or physiological systems.
These models can be used to describe and predict the temporal evolution of
various biochemical, biophysical and/or physiological variables of interest.
Accordingly, these simulation models have great value both for
pedagogical purposes (i.e., by contributing to our understanding of the
biological systems being simulated) and for drug discovery efforts (i.e., by
allowing in silica experiments to be conducted prior to actual i~z vitro or in
viva experiments).
Coupling these detailed computer simulation models with the afore-
mentioned automated sequencing techniques (and the volumes of data
generated using these techniques) should increase the fidelity of the
simulation models, tllereby allowing for more accurate predictions of the
dynamics of the biological/physiological system in question. Hence, there
is a need for methods that systematically incorporate gene- and protein-
expression data into predictive biological simulation models.
Existing techniques for analyzing gene-expression data fall into a
handful of categories, including: (1) visual inspection of simple scatter
plots; (2) cluster analysis; (3) principal component analysis; and (4) vector
machine-learning algorithms (e.g., support vector machines ("SVMs")).
More recently, a software tool, Gene MicroArray Pathway Profiler
(GenMAPP), for visualizing gene-expression data on maps of known
metabolic and signaling pathways has been developed (see
http: / / ~;ladstone-genome.ucsf.edu/introduction.asp / ). The
CA 02414443 2002-12-24
WO 02/05205 PCT/USO1/21461
-3-
aforementioned teehniques allow researchers to visualize and manipulate
gene-array data, and to analyze the data qualitatively (e.g., by identifying
groups of functionally related genes), but do not provide a means for
making quantitative predictions about the biological or physiological
system of interest.
The most popular method for analyzing gene-expression data -
cluster analysis - lessentially seeks to group together genes with similar
expression profiles (i.e., expression levels over time of the genes are
correlated in some fashion). The expression profile for a particular gene
can be represented by a vector, the kth element of which corresponds to the
expression level of that gene at time tk. In order to determine which gene-
expression profiles are "similar," one must first choose a "distance" metric
that measures how similar two expression profiles are. A simple distance
metric is the Euclidean distance metric or L2 norm (i.e., the square root of
the sum of the squares of the differences in expression levels for the two
genes at corresponding time points). Another distance metric is Pearson
correlation metric, which is equivalent to calculating the Euclidean distance
metric after each gene-expression vector is normalized to unit length before
the calculation. A drawback of the Pearson correlation is that it is sensitive
to outliers in the data, and frequently produces false positives (i.e.,
indicating that two genes are co-expressed or correlated when the
expression levels of the two patterns are unrelated in all but one time point
where there is a significant peak or trough). Many other distance metrics
may also be suitable depending upon the particular application, including
the so-called "jackknife" correlation, which has been shown to be robust
with respect to single outliers (thereby reducing the number of false
positives). See L.J. Heyer, "Exploring Expression Data: Identification and
Analysis of Co-Expressed Genes," Genome Res., vol. 9, pp. 1106-15 (1999);
S. Tavazoie et al., "Systematic Determination of Genetic Network
Architecture,'° Nat. Genet., vol. 22, pp. 281-85 (1999).
CA 02414443 2002-12-24
WO 02/05205 PCT/USO1/21461
-4-
Numerous algorithms and approaches to clustering analysis have
been developed, including: (1) agglomerative hierarchical clustering (see,
e.g_, M.B. Eisen et al., "Cluster Analysis and Display of Genome-Wide
Expression Patterns," Proc. Natl. Acad. Sci. USA, vol. 95, pp. 14863-68
(1998); X. Wen et al., "Large-Scale Temporal Gene Expression Mapping of
Central Nervous System Development," Proc. Natl. Acad. Sci. USA, vol. 95,
pp. 334-39 (1998)); (2) divisive hierarchical clustering (see, e.~., U. Alon
et
al., "Broad Patterns of Gene Expression Revealed by Clustering Analysis of
Tumor and Normal Colon Tissues Probed by Oligonucleotide Arrays,"
Proc. Natl. Acad. Sci. USA, vol. 96, pp. 6745-50 (1999); C.M. Perou et al.,
"Distinctive Gene Expression Patterns in Human Mammary Epithelial Cells
and Breast Cancers," Proc. Natl. Acad. Sci. USA, vol. 96, pp. 9212-17 (1999));
(3) self-organizing map (SOM) analysis (see, e.~., T. Kohonen, Self-
Organizing Maps (Berlin: Springer, 1995); P. Tamayo et al., "Interpreting
Patterns of Gene Expression with Self-Organizing Maps: Methods and
Application to Hematopoietic Differentiation," Proc. Natl. Acad. Sci. USA,
vol. 96, pp. 2907-12 (1999); P. Toronen et al., "Analysis of Gene Expression
Data Using Self-Organizing Maps," FEBS Lett., vol. 451, pp. 142-46 (1999));
and (4) k-means clustering (see, e.~., B. Everitt, Cluster Anal, sis, p. 122
(London: Heinemann, 1974)).
Notably, several patents directed toward clustering analysis
techniques have recently been issued, including U.S. Patent No. 5,729,662
(Neural Network for Classification of Patterns with Improved Method and
Apparatus for Ordering Vectors); U.S. Patent No. 6,012,058 (Scalable
System for K-Means Clustering of Large Databases); and U.S. Patent No.
6,203,987 (Methods for Using Co-Regulated Genesets to Enhance Detection
and Classification of Gene Expression Patterns). In addition, cluster
analysis software is now widely available, including free software such as
the software that may be downloaded from: http: / / g;enome-
www.stanford.edu/~sherloek/cluster.html; and
http: / /rana.lbl.gov/EisenSoftware.htm.
CA 02414443 2002-12-24
WO 02/05205 PCT/USO1/21461
_5_
While the above-enumerated techniques for analyzing gene-
expression data are useful and, indeed, valuable for studying and
characterizing biological systems, they cannot be used directly to make
predictions as to how a particular biological system will behave under a
particular set of conditions. Moreover, neither cluster analysis nor any of
the above-listed methods for analyzing gene-array data is capable of
forecasting the temporal evolution of a biological or physiological system.
Furthermore, current approaches to predictive modeling of biological
and physiological systems do not utilize gene- or protein-expression data
or, at best, take such data into account in a quite limited fashion. Even
those biological and physiological simulation systems that are able to take
into account expression data are not capable of automatically and
systematically updating or adjusting the model structure or parameters
based upon such data.
Another disadvantage of these simulation systems is that models of
complex systems not only require greater computing power or CPU speed
to simulate in a reasonable amount of time; but also require large memory
or other storage capacity to save/store these models. Moreover, if a
researcher is interested in developing a number of models of the same
biological system, the storage capacity needed will generally grow in
proportion with the number of models created. What is needed therefore is
a method for reducing the memory and/or storage costs of multiple,
related models.
One example of an advanced biological simulation model is the
computational model for simulating the electrical and chemical dynamics of
the heart that is described in U.S. Patent No. 5,947,899 (Computational
System and Method for Modeling the Heart), which is incorporated herein
by reference. This computational model combines a detailed, three-
dimensional representation of the cardiac anatomy with a system of
mathematical equations that describe the spatiotemporal behavior of
biophysical quantities, such as voltage at various locations in the heart.
CA 02414443 2002-12-24
WO 02/05205 PCT/USO1/21461
-6-
Notably, tile simulation model disclosed in the patent does not utilize or
incorporate gene- or protein-expression data, nor does the model provide
for an efficient method for storing multiple, related models.
Further examples of biological simulation software for modeling of
biological and physiological systems include: DBsolve (see I. Goryanin et
al., "Mathematical Simulation and Analysis of Cellular Metabolism and
Regulation," Bioinformatics, vol. 15, pp. 749-58 (1999)); GEPASI (see P.
Mendes & D. Kell, "Non-Linear Optimization Of Biochemical Pathways:
Applications to Metabolic Engineering and Parameter Estimation," Bio-
informatics, vol. 14, pp. 869-83 (1998); P. Mendes, "Biochemistry By Num-
bers: Simulation of Biochemical Pathways with GEPASI 3," Trends
Biochem. Sci., vol. 22, pp. 361-63 (1997); P. Mendes & D. B. Kell, "On the
Analysis of the Inverse Problem of Metabolic Pathways Using Artificial
Neural Networks," Biosystems, vol. 38, pp. 15-28 (1996); P. Mendes,
"GEPASI: A Software Package for Modeling the Dynamics, Steady Sfates
and Control of Biochemical and Other Systems," Comput. Appl. Biosci., vol.
9, pp. 563-71 (1993)); NEURON (see M. Nines, "NEURON: A Program for
Simulation of Nerve Equations,°' Neural Systems: Analysis and
Modeling
(F. Eeckman, ed., Kluwer Academic Publishers, 1993)); GENESIS (see J.M.
Bower & D. Beeman, The Book of GENESIS: Exploring Realistic Neural
Models with the General Neural Simulation System, (2d ed., Springer-
Verlag, New York, 1998)).
Numerous other simulation packages have been applied to modeling
biological and physiological systems including: Talis (a visual and
interactive real-time tool for simulating metabolic pathways, gene circuits
and signal transduction pathways); Network (a Java applet for interactive
simulation of genetic networks); SCAMP (a command-line driven software
package running on the Atari ST and MS-DOS operating systems; capable
of simulating steady-state and transient behavior of metabolic pathways
and calculation of all metabolic control analysis coefficients); MIST (a
biological pathway simulation package running on MS Windows 3.1);
CA 02414443 2002-12-24
WO 02/05205 PCT/USO1/21461
MetaModel (MS-DOS-based software package for steady-state simulation of
metabolic pathways); SCoP (a commercial simulation program that can be
used to simulate metabolic systems); CONTROL (a DOS-based software
package that uses the Reder matrix method to calculate control coefficients
from elasticity values); MetaCon (a DOS-based metabolic control analysis
program available at ftp://bmshuxley.brookes.ac.uk/pub/software/-
ibmpc/metacon); BioThermo (a simulation package that calculates the
feasibility of individual pathway reactions based upon Gibbs free energy
values and metabolite concentrations); FluxMap (a simulation package that
calculates metabolic fluxes based on metabolite balancing); BioNet (a
metabolic flux analysis package); and the Matlab Simulink and Stateflow
simulation packages.
Notably, none of the other abovementioned simulation software
packages currently provide for the systematic incorporation of gene- or
protein-expression data into the simulation models, nor do any of the
software packages leave the capability ~ of efficiently storing multiple,
related models.
SUMMARY OF THE INVENTION
In accordance with the present invention, there is provided a method
and system for storing and saving computational biological models using
overlays. Advantageously, use of overlays can reduce the memory and
storage requirements for manipulating multiple, related biological
simulation models.
There is also provided a method and system for creating overlays. In
one embodiment, the method for creating overlays comprises comparing
two existing computational biological models and storing the differences
between the second model and the base model as an overlay. The second
model can later be recreated by applying the overlay to the base model. In
another embodiment, the overlay is created directly based upon new
information or data about the biological system being modeled.
CA 02414443 2002-12-24
WO 02/05205 PCT/USO1/21461
_g_
In accordance with another aspect of the invention, there is provided
a system and method for automatically generating new computational
biological models from existing computational biological models based
upon experimental data or other information. More specifically, an overlay
is generated based upon the new data/information; and subsequently, the
overlay is applied to an existing computational biological model to
generate a new model that thereby takes into account the new
data/information.
In accordance with yet another aspect of the invention, there is
provided a method and system for systematically incorporating gene and
protein expression data into a computational biological model. In one
embodiment, the computational biological model is a model of a cell during
various phases of the cell cycle. In another embodiment, the computational
biological model is a model of the heart or a portion of the heart.
Also provided is a method and system for incorporating information
into a computational biological model in a hierarchical manner, said
method comprising the steps of: creating a series of overlays; applying the
series of overlays in sequence to a base computational biological model;
and running a simulation of at least one of the computational biological
models produced by applying the overlays.
Finally, also provided are computer program products comprising an
overlay incorporated in a computer usable medium in a computer readable
format. Preferably, the overlay is represented in an extensible mark-up
language (XML). Also provided are computer program products,
comprising computer readable code means for causing a computer to
execute the steps of the above-described methods.
Further features, aspects and advantages of the present invention will
become apparent from the drawings and description contained herein.
CA 02414443 2002-12-24
WO 02/05205 PCT/USO1/21461
-9-
BRIEF DESCRIPTION OF THE DRAWINGS
The invention will be more fully understood and further advantages
will become apparent when reference is made to the following detailed
description and the accompanying drawings in which:
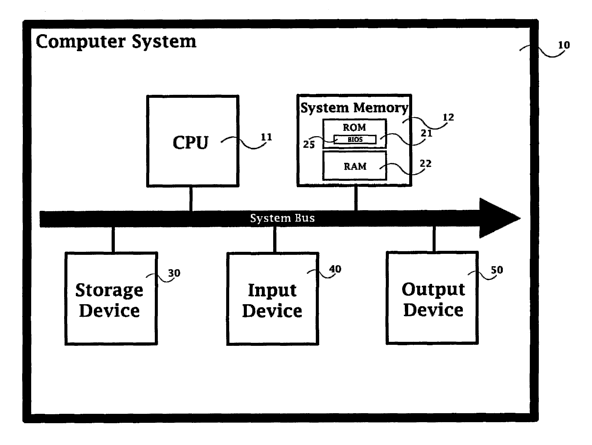
FIG. 1 is a diagram depicting some of the hardware components of
one embodiment of the invention;
FIGS. 2a and 2b are flowcharts of the process steps in certain
embodiments of the invention;
FIG. 3 is a diagram depicting the phases of the cell cycle;
FIGS. 4 through 6 are screenshots from a biological modeling
software package, showing some equations from a cardiac model; and
FIG. 7 is a graph of cell membrane voltage as simulated by a
biological modeling software package.
DESCRIPTION OF THE PREFERRED EMBODIMENTS
In the following description, reference is made to the accompanying
drawings which form a part hereof, and which is shown, by way of
illustration, several embodiments of the present invention. It is understood
that other embodiments may be utilized and structural changes may be
made without departing from the scope of the present invention.
The present invention relates to a method of using "overlays"
(described in more detail below) to manipulate and store models of
biological and/or physiological systems. (As used herein, the term
"biological system" encompasses and includes physiological systems.)
Such models of biological and/or physiological systems are often referred
to as computational biological models; and such models can describe events
at different levels of the system being modeled, ranging from the
subcellular level (e.g., biochemical reaction networks) to the cell level to
the
organ or tissue level to the whole organism level (and perhaps higher, as in
population model).
CA 02414443 2002-12-24
WO 02/05205 PCT/USO1/21461
-10-
The term "computational biological model" ("CBM"), in the most
general sense, refers to a mathematical system of equations that describe a
biological process or entity (e.g., reaction, cell, organ, tissue, organism).
For purposes of illustration, the examples used in this patent application
will assume that the system of equations underlying the CBM is a system of
ordinary differential equations (ODEs). However, more complex CBMs can
include partial differential equations (requiring more sophisticated
numerical algorithms for solution), and very simple CBMs can be modeled
entirely using a system of algebraic equations. Other types of CBMs also
include, inter alia, stochastic models (e.g., a system of stochastic
differential
equations), finite-difference models (i.e., when one or more variables are
discrete rather than continuous), and/or Boolean (or binary) network
models. In a CBM, the underlying system of equations describes a set of
variables that completely determine the current state of a biological system
(at least insofar as the variables of interest to the scientist-modeler and/or
the experimentally observable variables are concerned). Such a system is
commonly referred to as a state-equation representation.
For a typical state-variable model, the model can be decomposed into
three types of components: (1) the equations that describe the possible
states of the system (i.e., state equations); (2) the parameters in these
equations; (3) and the initial values for the state variables, as well as any
applicable boundary conditions (i.e., initial conditions and/or boundary
conditions). Fully describing each of the three components uniquely
specifies a particular model. For certain types of models, there may be
additional "components" that may be specified, such as the topology of the
system being modeled (e.g., when modeling a biochemical reaction
pathway).
An overlay can be viewed as a subset of one or more model
components (e.g., state equations, parameters and/or initial
conditions/boundary values) that does not by itself necessarily constitute a
CBM, but can be "overlaid" on (or applied to) an existing CBM to produce a
CA 02414443 2002-12-24
WO 02/05205 PCT/USO1/21461
-lI-
new CBM. (In certain instances, an overlay may itself be a self-contained
CBM capable of generating simulation predictions, but, in the general case,
an overlay need not be a complete CBM.) An overlay can also be viewed as
the set of all information necessary to specify the differences between two
models. Hence, the combination of Model A with an overlay representing
the differences between Models A and B can be used to determine Model B
uniquely. The overlay itself, however, does not fully describe either Model
A or Model B.
One convenient approach to implementing the overlay method is to
represent models and overlays using Extensible Mark-Up Language (XML),
a standard maintained by the Worldwide Web Consortium. XML is a
simple dialect of SGML or Standard Generalized Markup Language (ISO
8879:1985), the international standard for defining descriptions of the
structure of different types of electronic documents. In essence, XML is a
'metalanguage' - or a language for describing other languages - which
allows for flexible implementation of various customized markup
languages for numerous different types of applications. XML is designed to
make it easy and straightforward to author and manage various data files,
and to transmit and share them across the Web. However, XML is not just
for Web pages, and can be used to store any kind of structured information,
and to enclose or encapsulate information in order to pass it between
different computing systems that would otherwise be unable to
communicate.
In a preferred embodiment of the invention, CellML, a subset of
XML, is used to describe the CBMs at the cell level (and MathML to
describe the underlying mathematical equations). In another preferred
embodiment, the CBMs are described partially using CellML and partially
using another XML, such as AnatML or FieldML.
The CellML language is an XML-based markup language, which was
developed by Physiome Sciences, Inc. (Princeton, NJ), in conjunction with
the Bioengineering Researeh Group at the University of Auckland's
CA 02414443 2002-12-24
WO 02/05205 PCT/USO1/21461
-12-
Department of Engineering Science and affiliated groups. CelIML was
specifically designed to store and exchange CBMs. CellML includes
information about model structure (i.e., how the parts of a model are
organizationally related to one another), mathematics (i.e., the equations
describing the underlying biological processes) and metadata (i.e.,
additional information about the model that allows scientists to search for
specific models or model components in a database or other repository).
The contents of each CellML file must conform to a set of grammar rules
defined in the CellML Document Type Definition (DTD) (see
http://www.esc.auckland.ac.nz/sites/physiome/cellml/public/specificati
on/appendices.html ).
Overlay Method Reduces Mernorh/Database Storage Needs
CBMs are typically stored in relational databases. As the size of
individual CBMs grow to encompass thousands or millions of state
equations in a single model, the overhead cost of storing such models may
become substantial. Overlays provide a convenient method for storing a
related sequence of CBMs at considerably lower storage costs. Even if the
cost of disk storage is not an issue, the overhead of retrieval from data
vaults may be considerable. Additionally, a user may wish to load and
manipulate several CBMs in memory at once. If a single complete CBM is
stored in memory, while related CBMs are generated as needed using
overlays, then the computer-memory requirement for storing all models
will be considerably reduced as a consequence.
For example, consider a sequence of CBMs that represent the time
evolution of a disease process X in a cell type Y. Assuming that one tracks
the disease process every day for a year, one could generate a sequence of
models YXI, YXZ, ..., YX365, where YXn represents a model of disease process
X in a cell type Y on day n. Using the overlay method, one would generate
a base model Y and n overlays; each model YXn could then be generated by
applying overlay x to base model Y: YX" = xn'~Y. If the size of each overlay
x" is small compared to the corresponding complete model YXn, then
CA 02414443 2002-12-24
WO 02/05205 PCT/USO1/21461
-13-
considerable savings in storage and memory will result. For instance, if the
mean storage requirement for a complete model YXn were 10 MB/model,
then storing all 365 models would impose a total memory cost of 3.65 GB.
However, if only 10% of the model components are altered by the disease,
S then the average storage requirement for overlay xn is 1 MB, and the cost of
storing one base model plus 365 overlays is 375 MB or 0.370 GB (about one-
tenth the requirement for storing 365 complete models). An even more
compact representation might be achieved using sequentially applied
overlays, where the nth model can be computed by applying n successive
overlays to the base model: YXn = Xn*xn-i* ... x1*Y. Assuming that only 1
of model components are altered by the disease from day to day, then the
average size of each overlay xn is 0.1 MB, and the cost of storing one model
and 365 overlays is 46.5 MB or 0.0465 GB (or about 1.3% of the storage
requirement for storing all 365 complete models).
1S Description of Overlay Algebra
It is possible to apply multiple overlays in sequence. For example,
after overlay x is applied to a base model A to construct a new model B, a
second overlay y could applied to model B to generate another new model
C. The application of multiple overlays is governed by an "algebra" or set
of rules, which are summarized in the table below. (The following
conventions are used: bold upper case letters designate models and bold
lower case italics designate overlays. ' Also, "-" refers to a context-
specific
differencing of two models and not simply a binary subtraction operation.)
B - A = x Overlay x is defined as the difference between1
model B and model A.
xA = B Overlay x can be applied to a model A to 2
generate
model B.
C - B = y Overlay y is defined as the difference between3
model C and model B.
yxA = C First overlay x is applied to a model A 4
to generate
model B, overlay y is applied to a model
B (= xA)
to generate model C.
SUBSTITUTE SHEET (RULE 26)
CA 02414443 2002-12-24
WO 02/05205 PCT/USO1/21461
-14-
yC = yxC = Applying overlay y or x then y to model 5
C C has no
effect.
in general Overlays are not commutative. Changes to 6
yxA model
~ xyA are applied in order of application of overlay.
yxA
could but does not have to be equivalent
to xyA.
C - A = z Overlay z is the difference between model 7
C and
model A.
z = w iff zD Equivalent overlays must produce equivalent~
=
wD for any models when applied to any base model. For
model D example, by definition (4) and (7), zC =
xyC for
model C, but a similar relation is not known
in
general for alI models.
if xfl y = If overlay y and/ or x modify a disjoint 9
O then set of model
yxA = xyA components, then these overlays are commutative.
yxA = xyA doesConsider that the intersection of overlay 10
x and
not require overlay y may be non-empty, but common
xfl y
= O component modification may affect model
A in a
similar way.
xy = r then Overlay x can be applied to y to produce 11
rA = new
C overlay r. Now applying overlay r to model
A
produces model C.
The above rules are generic in that they can be applied to a wide class
of models including ODE systems, as well as other systems of equations
such as partial differential equations (PDEs), binary networks, or combined
representations.
Computer Hardware
Figure 1 depicts an exemplary computer system for practicing the
invention. Referring to Figure 1, the exemplary computer system comprises
a general purpose computing device 10, including one or more processing
units or CPUs 11, a system memory 12, and a system bus 13 that connects
various system components (such as the system memory 12) to the
processing units) 11. Any one of a variety of bus architectures (including
ISA, MCA; AGP, USB, AMR, CNR, PCI, Mini-PCI, and PCI-X) may be used.
The system memory 12 includes both read-only memory (ROM) 21
and random access memory (RAM) 22. A Basic Input/ Output System
SUBSTITUTE SHEET (RULE 26)
CA 02414443 2002-12-24
WO 02/05205 PCT/USO1/21461
-15-
(BIOS) 25, containing basic software routines, including those needed
during start-up, is stored in ROM 21.
The exemplary computer system also includes a storage device 30
providing nonvolatile storage of computer programs (including operating
system programs and application programs), data, and other electronic
files. Although the primary storage device typically used is a hard disk
drive, numerous other storage devices may be used instead of, or in
addition to, a hard disk drive, including: optical disks (e.g., CD ROM);
removable magnetic disks; Bernoulli cartridges; digital video disks;
magnetic tapes or cassettes; flash memory cards; and various other storage
devices familiar to fhe skilled artisan.
Data and/or commands may be entered using an input device 40.
The primary input device is typically a keyboard and/or pointing device
(such as a mouse). However, numerous other input devices may be used
instead of, or in addition to, a keyboard and pointing device, such as:
joysticks; microphones; satellite dishes; scanners; video cameras; and other
devices known to those skilled in the art. The ' input device is typically
connected to the bus 13 or to the processing unit 11 through some interface,
such as a serial port, a parallel port or USB port. Advantageously, gene
array or other data may be ported directly to the computer. Special
purpose hardware devices are currently available to read, analyze and
export gene-array data to desktop workstations (e.g., the GeneChip~
instrument systems sold by Affymetrix (Santa Clara, CA), see
http: / /www.affymetrix.com).
The exemplary computer system also includes an output device 50,
typically a monitor or other display terminal connected to the bus. Other
peripheral output devices may also be used, including printers and
speakers.
The exemplary computer system may be operated in a networked
environment or on a standalone basis. If operated in a networked
environment, the computer system may be connected to one or more
CA 02414443 2002-12-24
WO 02/05205 PCT/USO1/21461
-16-
remote computers in a local area network (LAN) using network adapter
cards and Ethernet connections, or in a wide area network (WAN) using
modems or other communications links.
The Base Simulation Model
The overlay method does not generate a model de novo, but rather
requires at least one preexisting base model. The base model may be
generated using any one of a number of approaches and/or software tools,
which are familiar to the skilled artisan. Figures 2a and 2b depict the base
model generation step 100.
One example of a very sophisticated biological modeling platform is
the In Silico CellTM modeling environment developed by Physiome Sciences,
Inc. (Princeton, NJ). The In Silico CellTM modeling platform, which allows
biological-systems modelers to create computational models of subcellular,
cellular and intercellular systems and processes, is described in more detail
in U.S. Patent Application Nos. 09/295,503 (System and Method for
Modeling Genetic, Biochemical, Biophysical and Anatomical Information:
In Silico Cell); 09/499,575 (System and Method for Modeling Genetic,
Biochemical, Biophysical and Anatomical Information: In Silico Cell);
09/599,128 (Computational System and Method for Modeling Protein
Expression); and 09/723,410 (System for Modeling Biological Pathways),
which are each incorporated herein by reference.
A biological simulation system that explicitly allows for spatial
modeling of cells is the Virtual Cell, a software package developed at the
University of Connecticut. The Virtual CellTM program and its capabilities
is described in some detail in the following references: J.C. Schaff, B.M.
Slepchenko, & L.M. Loew, "Physiological Modeling with the Virtual Cell
Framework," in Methods in Enzymolo~y, vol. 321, pp. 1-23 (M. Johnson &
L. Brand, eds., Academic Press, 2000); J. Schaff & L.M. Loew, "The Virtual
Cell," Pacific Symposium on Biocomputing, vol. 4, pp. 228-39 (1999); J.
Schaff et al., "A General Computational Framework for Modeling Cellular
Structure and Function," Biophys. T., vol. 73, pp. 1135-46 (1997); and C.C.
CA 02414443 2002-12-24
WO 02/05205 PCT/USO1/21461
-17-
Fink et al., "An Image-Based Model of Calcium Waves in Differentiated
Neuroblastoma Cells," Bioph,r~s. T., vol. 79, pp. 163-83 (2000). The Virtual
Cell program and some of its underlying algorithms are also described in
U.S. Patent No. 6,219,440 (Method and Apparatus For Modeling Cellular
Structure and Function), which is incorporated herein by reference.
Numerous other systems and methods for creating predictive models
of biological and physiological systems are well known in the art. The
selection of a suitable method for creating a base model will depend upon
the nature of the system being modeled, but is well within the skill of the
ordinary artisan. Preferably, the modeling platform or method generates
models in CellML or another XML format.
Creating; An Overlay
Two complementary methods exist for creating overlays. The first
method comprises computing the overlay as the "difference" between two
existing models; this method is depicted in Figure 2a. The second method
involves to constructing the overlay directly based upon experimental or
other data; this method is depicted in Figure 2b. These two methods are
described in detail below.
Differencin~ Method
Given any two non-identical models, an ovexlay can be created by
comparing the two models to detect any differences between the two
models. Referring to Figure 2a, the second model may be generated 110
using the same model generation technique used to create the base model.
The overlay creation step 120 involves comparing the two models on a
character-by-character (or byte-by-byte) basis or at some higher level of
abstraction.
Preferably, the comparison is done at a level that will reveal actual
structural differences between the models (e.g., differences that will affect
the control flow of the compiled code). From a biological modeling
standpoint, only biologically significant differences between the CBMs
should be stored in an overlay, and two models that produce identical
CA 02414443 2002-12-24
WO 02/05205 PCT/USO1/21461
-18-
compiled code should be deemed identical from a modeling perspective. A
string comparison (or bitwise comparison) approach, as is typically used in
software version-tracking programs, will result in spurious or biologically
insignificant "differences" being stored in the overlay.
Comparison of two or more models can also serve a pedagogical
purpose in terms of elucidating the underlying biology or physiology of the
system being modeled. For example, if two CBMs have been developed
independently to model the same system in different states (e.g., diseased
versus normal, quiescent versus mitotic, exposure to a drug versus no
exposure), a comparison of the two models may reveal the underlying
biological/biochemical triggers that induce the system to transition
between the two states. This will not only increase our understanding of
the system being modeled but may also be invaluable in identifying drug
targets or possible treatments/interventions for particular diseases.
There are a variety of ways to measure the differences between
models. Standard text-editing tools, such as the POSIX "diff" program (or
variants such as "ediff" and "gnudiff"), identify text-based differences
between two text files or buffers in memory. Source-code management
systems fox software development (e.g., CVS, RCS, SCCS, Microsoft
SourceSafe) make use of this program to store multiple versions of a
changing software program by storing one version and the differences
between versions. Such a method can be applied to computational
biological models stored as text.
Some biological modeling software, such as Physiome's In Silico Cell
platform, use an XML-representation for manipulating and storing
computation biological models. Because XML is an ordinary text-based
markup language, the above-described text-based differencing can be
applied.
Preferably, the "differencing" is performed at a level of abstraction
higher than the text level; the identified differences should reflect
structural
or biologically significant differences between the models being compared.
CA 02414443 2002-12-24
WO 02/05205 PCT/USO1/21461
-19-
In such a situation, the differencing methodology or algorithm used will
likely be more domain-specific (i.e., make use of a priori information about
the type/structure of the model to help define the differences between
models). For example, in a CBM including models of geometric structures,
a user may be able define structures in terms of specified shapes and
dimensions and may be able to revise/edit geometric structures using lligh-
level commands such as "add a substructure," "delete a substructure,"
"move a structure to a new location," or "change the shape of a structure";
the differencing methodology used may track differences in terms of the
high-level commands necessary to transform the geometric structure
specified in one model versus the structure specified in a base model.
Similarly, differences between CBMs including models of biochemical
reactions can be tracked at the level bf differences between two models in
terms of reactant and product species, concentrations and kinetic rate
constants.
Finally, as shown in step 130 of Figure 2a, the base model and
computed overlay are both stored. The choice of a particular
representation of the differences stored in the overlay (as well as the
representation of the base model itself) will likely depend upon such
requirements as compactness, intuitive communication of differences to a
user and/or computational efficiency.
Storing the models in XML format will facilitate comparison of
models in a more straightforward manner, as will stringent variable naming
and typing conventions. If modelers (or programmers) adhere to the syntax
conventions set forth in the Document Type Definition (DTD) for the XML
language, structurally similar models stored in XML format will necessarily
be similar on a text-level basis. Even DTD-less XML files, as long as they
are well formed, will have a structure that facilitates straightforward
comparison of models. For these reasons, both models and overlays are
preferably stored in an XML format such as CeIIML.
CA 02414443 2002-12-24
WO 02/05205 PCT/USO1/21461
-20-
Direct Method
Although the most straightforward approach to creating an overlay is
by direct comparison of two existing CBMs, it is also possible to create an
overlay directly (as depicted in steps 111 and 121 in Figure 2b). For
example, if the second model differs from the base model only in the values
of certain parameters, one may directly create an overlay that when applied
to the base model will change the appropriate parameters to their new
values. Again, as in the differencing method, it is only necessary to store
130 the base model and the overlay.
In a preferred embodiment, the overlay is generated based upon
experimental data. For example, a base model may have as a component a
particular enzyme-catalyzed reaction known or hypothesized to exhibit
Michaelis-Menten kinetics. Perhaps initially, one had only estimates or
guesses of the Km and VmaX values for this enzyme (e.g., based on values
reported in the literature for similar enzymes); and these "best guess"
values were used as parameters in the initial or base model. Subsequently,
one might obtain experimental data that could be used to calculate Km and
VmaX values. An overlay could then be created that reflects the
experimentally derived IC~" and Vmax values.
Another approach to using experimental data in the overlay creation
process is to modify a base model in such a manner as to minimize some
error metric measuring the difference between predictions made by the
model and a set of experimental measurements of one or more variables of
the system being modeled. The error-minimization and candidate-model-
selection process may be constrained or unconstrained, and may involve
changes in parameters only or may include structural changes to the model.
One technique for adjusting a model based on image data is described in
Provisional U.S. Patent Application Ser. No. 60/275,287 (Biological
Modeling Utilizing Image Data), which is incorporated herein by reference.
Once a new model is derived from the base model, one may generate an
CA 02414443 2002-12-24
WO 02/05205 PCT/USO1/21461
-21 -
overlay by identifying the differences between the two models, as described
above.
Comparison and Selection of Candidate Models
When selecting between or among two or more computational
biological models, it is necessary to determine which model is better suited
. for a particular purpose. An objective assessment of the "quality" of a
model will often include a determination as to which model more
accurately predicts the outcome of an experiment (or experiments). In
order to make such a determination, one must have some measure of the
goodness-of-fit between model-forecasted results and the experimental
data. Such measures may be deterministic (e.g., L2 norm) or statistical
(e.g., measuring the probability that one model is a better representation
than another). Other measures of model quality include the simplicity of
the model (in terms of structure, number of variables, etc.), availability of
software and hardware needed to simulate using that model, and
understandability for users of the model.
Example 1
Incorporation of Genomic and Proteomic Data into CBMs
Advances in gene array and protein array technology have
revolutionized the study of gene and protein expression. See, e.~., P.O.
Brown & D. Botstein, "Exploring the New World of the Genome With DNA
Microarrays," Nature Genet., vol. 21 (Suppl.), pp. 33-37 (1999). These
automated data collection techniques allow researchers to evaluafe patterns
of gene and protein expression on a genome-wide level.
Examples of automated methods include using ordered arrays of
related entities such as oligonucleotides (DNA chip technologies), peptides
(protein chip technologies), or drugs. Concomitant with the recent
advances in technology for building microarrays, various analytical
techniques have been developed, including techniques for identifying
differentially expressed genes (amongst potentially thousands of genes that
CA 02414443 2002-12-24
WO 02/05205 PCT/USO1/21461
_22_
share the similar levels of activity) and for quantifying the expression
levels
of these genes.
Preferably, the data collected from these microarrays is stored in
Microarray Markup Language (MAML) format. MAML, which is based on
XML, provides a framework for describing and communicating information
about a DNA-array experiment. MAML data structures include details
about: (1) the experimental design (e.g., the set of the hybridization
experiments as a whole); (2) the array design (e.g., each array used and .
each element (spot) on the array); (3) the samples used (and the procedures
for extract preparation and labeling); (4) the hybridization procedures and
parameters; (5) the measurements made (e.g., images, quantitation,
specifications); and (6) the controls used (e.g., types, values,
specifications).
MAML is independent of the particular experimental platform and
provides a framework for describing experiments done on all types of
DNA-arrays, including spotted and synthesized arrays, as well as
oligonucleotide and cDNA arrays, and is independent of the particular
image analysis and data normalization methods used. MAML is not limited
to any particular image analysis or data normalization method. Instead,
MAML provides a format for representing microarray data in a flexible
way, thereby enabling researchers to represent data obtained from not only
any existing microarray platforms, but also many of the possible future
variants. The format allows representation of both raw and processed
microarray data, and is compatible with the definition of the "minimum
information about a microarray experiment" (MIAME) proposed by the
MGED group, see http: / /www.m~ed.org.
In addition to MAML, other markup languages have been proposed
for representing gene array data, including, for example, Gene Expression
Markup Language (GEMLTM) (see htt~://www. eml.org), an XML-based tag set
which was developed by Rosetta Inpharmatics to provide a standard protocol for
exchanging gene expression data along with associated gene and experiment
annotation. For purposes of creating an overlay, the exact format of the gene-
array
CA 02414443 2002-12-24
WO 02/05205 PCT/USO1/21461
-23-
input data is unimportant. However, in a preferred embodiment as described
herein, the use of both XML-based input and XML-based models will provide
some commonality as between the input data and the resulting overlay.
The simplest use of microarrays involves measuring the absolute or
relative level of mRNA in a population of cells. Generally, researchers have
assumed that the level of mRNA approximates (or correlates with) the
corresponding protein level in the cell. While this relationship may hold in
some cases, the exact relationship between the expressed level mRNA and
the corresponding level of functional protein is less certain. For any given
gene, the amount of RNA accumulated in the cell at a given point in time is
dependent on rates of transcription, RNA processing and export, and
mRNA turnover (or catabolism). While the mRNA is the input for
ribosomal translation, the final level of functional protein may depend on
post-translational modification, intracellular transport, and degradation
rates. Hence, functional protein levels depend on steps that cannot be
assessed with current gene-array technologies.
When modeling signal pathways and other cellular processes, the key
variable is the concentration of various proteins rather than the levels of
mRNA coding for those proteins. To the extent that there are differences in
translational efficiency or protein stability, the mRNA level may not be an
accurate proxy for gene-product or protein levels. With this limitation in
mind, many technologies are currently under development that will allow
for more direct assessment of the protein content in Bells.
Indeed, various technologies for automating the identification and
measurement of constituent proteins are well known in the art. One
example of such a technology is high-density, two-dimensional electro
phoretic separation of proteins. The advantage of two-dimensional
electrophoresis over one-dimensional electrophoresis is the much higher
resolution achieved with the former method. Typically, in the first
dimension, proteins are resolved according to their isoelectric points (pIs)
using immobilized pH gradient electrophoresis (IPGE), isoelectric focusing
CA 02414443 2002-12-24
WO 02/05205 PCT/USO1/21461
-24-
(IEF), or non-equilibrium pH gradient electrophoresis (NEPHGE). Under
standard conditions of temperature and urea concentration, the observed
focusing points of the great majority of proteins using IPGE (and to a lesser
extent IEF) closely approximate the predicted isoelectric poinfs calculated
from the proteins' amino acid compositions. In the second dimension,
proteins are separated according to their approximate molecular weight
using sodium dodecyl sulfate poly-acrylamide-electrophoresis (SDS-PAGE).
The overlay method described herein can be applied in a
straightforward manner to take advantage of these emerging proteomics
technologies. However, for the examples described below, the less direct
but currently more commonly used gene-array technologies are considered.
Currently, no standardized methods currently for systematic
incorporation of genomic and proteomic data from automated arrays into
CBMs. Gene and protein expression data, standing alone, are generally
insufficient to create a CBM (without other a priori knowledge about the
system being modeled). However, gene and protein expression data do
provide essential information relating to an important subset of CBM
model components. Hence, because overlays constitute, in essence, a subset
of model components, using overlays are a natural way to integrate data
that describe a subset of the CBM.
Moreover, as described above, overlays provide a natural means for
incorporating modifications into CBMs in a hierarchical fashion. Indeed,
the algebra defining sequential overlay operations provides a systematic
means to incorporate data with ordered precedence. This ordered
precedence is needed because genomic assays can generate overlapping
data that suggest conflicting effects on model components. Conversely,
different automated data collection methods can generate non-overlapping
data (i.e., affecting different subsets of model components). Any automated
system for incorporating large genomic/proteomic datasets into a CBM
must be able to handle tile complex ranking, filtering, and incorporation of
genomic/proteomic data.
CA 02414443 2002-12-24
WO 02/05205 PCT/USO1/21461
- 25 -
For example, consider a scenario where data is collected using two
different methods: (1) gene array chips (Method GC); and (2) high-density,
two-dimensional electrophoretic separation (Method 2dES). Assume that
the Method GC data is used to compute an overlay p, and the Method 2dES
data is used to compute an overlay q. Further assume that both overlay p
and overlay q are applied to base model A to produce new models that
reflect the incorporation of their respective data sets.
These different data sets could be simultaneously incorporated into a
CBM using overlays by the following methods:
1. If Method GC and Method 2dES data describe changes to
disjoint sets of model components (if p ~ q = ~), then overlay p and overlay
q can be applied to base model A in either order (i.e., pqA = qpA). Because
models and overlays include potentially thousands of components,
automated methods must be used to insure the required condition that p ~ q
= f~.
2. If one data set is deemed more accurate than the other, then a
hierarchical method can be used. For example, assume that Method 2dES is
more accurate than Method GC, and these methods provide data on some
common model components (i.e. p ~ q ~ ~). In this case, overlay p is applied
before overlay q to base model A. Changes in base model A produced by
overlay p will override those of overlay q.
3. If both data sets are deemed suspect, then a correlation method
can be used to incorporate consistent data from overlay p and overlay q.
For example, assume that base model A should only be modified with data
from Method 2dES that is consistent with data from Method GC. In this
case, only components in both overlay p and overlay q (i.e. p ~ q) will be
included. In addition, corresponding parameters and initial conditions of
these equations would have to ,agree within some defined tolerance. In
this case, a new overlay could be constructed using the common equations,
the mean values of each parameter, and the mean values of each initial
condition. Because models and overlays comprise potentially thousands of
CA 02414443 2002-12-24
WO 02/05205 PCT/USO1/21461
-26-
components, automated methods will be used to generate the new overlay
from the initial overlays p and q.
4. A combination of the above methods may be used. For
example, more than two overlays could be combined using a combination
of the rules above.
In a preferred embodiment, the CBM is stored in the form of an
extensible mark-up language (XML). CelIML and other XMLs are especially
suited for describing computational models and CBMs in particular.
Furthermore, the , overlay method is particularly suited to incorporating
genomic/proteomic data into a hierarchical series of biological models
constructed using XML.
Consider a biological reaction present in a living cell such as the
binding of a ligand to a receptor on a cell surface. Assume that an XML
(e.g., BiochemML) has been developed to facilitate the modeling of such
biological reactions. Now consider that the same biochemical reaction may
need to be represented in a model of a complete cell. In this case, the
particular reaction may be an intermediate occurrence in a chain of events
that ultimately results in a cellular response. Assume further that the cell
model is represented using CellML, an XML designed specifically for
modeling of cells. Because modeling cells may require taking into account
more interactions that modeling simple biological reactions, CellML can be
defined as a superset of BiochemML. Extending this to the organ level, an
XML designed for modeling organs (OrganML) can be defined as a superset
of CellML.
In the scenario described above, the modeled biological reaction
(which is a CBM) occurs in a cell that is part of a larger organ. However, a
hierarchical system for modeling, as proposed here, would allow for the
same reaction to be represented whether the CBM is at the level of reaction,
cell, or tissue. Moreover, assuming that the model of the initial ligand
binding to a receptor is implemented in BiochemML, then any overlay
modifying such a model would constitute a subset of a BiochemML model
CA 02414443 2002-12-24
WO 02/05205 PCT/USO1/21461
-27-
and llence would itself be implemented in BiochemML. The same overlay
can then be applied without modification to a model of cell or a tissue that
include the reaction of interest. Because the overlay is a subset of
BiochemML (which is a subset of CelIML and OrganML), the overlay may
validly be applied to higher level CBMs as well as to the reaction-level
CBM.
Example 2
Incorporating-Cell-C~~cle-Dependent Protein-Expression Data Using
Overlays
It is known that a cell's gene expression profile changes in response
to various growth factors and mitogens, and that different sets of genes are
differentially expressed during different parts of the cell cycle. See, e.~.,
D.
Fambrough et al., "Diverse Signaling Pathways Activated by Growth Factor
Receptors Induce Broadly Overlapping, Rather Than Independent, Sets of
Genes," Cell, vol. 9~, pp: 727-41 (1999); V.R. Iyer et al., "The
Transcriptional
Program in the Response of Human Fibroblasts to Serum," Science, vol. 283,
pp. 83-87 (1999); L.F. Lau & D. Nathans, "Identification of a Set of Genes
Expressed During GO/G1 Transition of Cultured Mouse Cells," EM~O ,
vol. 4, pp. 3145-51 (1985). Gene array technology is particularly suited to
studying induction of gene expression as a function of the cell cycle phase.
The cell cycle consists of a cyclical progression of states that a cell
undergoes during the process of proliferation through cell division. As
shown in Figure 3, there are four phases of the cell cycle: G1, S, G2, and M.
G1 and G2 are the so-called gap or growth phases, during which organelles
are duplicated and the cell increases in size prior to mitosis. DNA
synthesis takes place during the Synthesis or S phase. And mitosis takes
place during the M phase, when the chromosomes segregate into the two
daughter cells. Collectively, G1, S, and G2 phases are referred to as
interphase. Cells that are quiescent (i.e., not growing) are said to be in the
GO phase. The duration of yeast cell cycles is typically around 90 minutes.
CA 02414443 2002-12-24
WO 02/05205 PCT/USO1/21461
-28-
Somatic cells of higher plants and animals have much longer cell cycles,
varying in duration from 10 to 24 hours (or more). Tn rapidly dividing
human cells, a complete cell cycle takes around 24 hours - with about 12
hours in the G1 stage, about 6 hours each in the S and G2 stages, and about
30 minutes in the M stage.
The overlay method is particularly suited to modeling the impact of
gene expression on cell-cycle dependent processes. One could first develop
a general cell model, and then utilize experimental gene-expression data
collected during the various cell-cycle phases to produce overlays that
correspond to CBMs applicable during the states G1, S, G2, and M. The
process of constructing and applying such overlays is described in further
detail below:
1. Constructing A Base Model
As noted above, the overlay method is not applicable to de novo
generation of models. Rather, a starting model must be generated using
traditional modeling methods or automated model generation techniques.
Recently, various automated techniques have been developed to deduce
certain relations between various gene products and proteins using
clustering, self-organizing maps, two-hybrid protein binding, or other
methods, as described in more detail above. In addition, new techniques to
streamline and automate model generation have recently been developed,
such as the automated technique for extracting functi~nal relationships
between cellular components from gene and text-based databases described
in Tor-ICristian Jenssen et al., "A Literature Network of Human Genes for
High-Throughput Analysis of Gene Expression," Nature Genetics, vol. 28,
pp. 21-28 (2001).
For purposes of the present invention, it is not necessary that the
initial model be generated using any particular methodology or be of any
particular scope. Hence, the overlay method can be applied to a wide range
of existing CBMs.
CA 02414443 2002-12-24
WO 02/05205 PCT/USO1/21461
-29-
The base model may be some general representation of the cell or a
subset of the total cell (i.e., the biochemical pathways or cellular processes
of interest). Such a generalized cell model may not take into account cell-
cycle dependent variables or the cell-cycle state. Alternatively, the base
model may be a model of the cell during a particular cell cycle phase such
as the G1 phase.
2. Collecting Relevant Gene Expression Data
If the base model used is generalized with respect to the cell cycle,
then one must consider cell-cycle dependent effects on a subset of model
components. In a preferred embodiment of the invention, the cell cycle
dependent components would be modeled based upon experimental gene-
expression data.
Data relating to the effect of the cell cycle on all genes (or, more
specifically, on open-reading frames) in yeast has been published: Paul T.
Spellman et al., "Comprehensive Identification of Cell Cycle-Regulated
Genes of the Yeast Saccharomyces cerevisiae by Microarray Hybridization,"
Molecular Biology of the Cell, vol. 9, pp. 3273-97 (1998). The data is
accessible on the Internet at the website for the Yeast Cell Cycle Analysis
Project: http://cellcycle-www.stanford.edu. Alternatively, such data may
be generated using gene chip arrays that are currently available from
commercial manufacturers such as Affymetrix
(http: / /www.affymetrix.com). The gene chip could contain a standard set
of genes or could be custom designed to contain the relevant genes that
correspond to the genes that code for the relevant proteins represented in
the base model.
3. Data Preprocessing
If the chip contains a standard set of genes, then the initial
preprocessing step would include sorting out the genes that are relevant to
the system of interest. This step can be automated if one can extract from
the model a table of genes that correspond to the model components.
CA 02414443 2002-12-24
WO 02/05205 PCT/USO1/21461
-30-
The next preprocessing step is to eliminate genes with expression
levels that do not vary across the different cell cycle states by more than a
predefined threshold. Because overlays store information relating to
differences between models, there is no reason to store information on
components that are unchanged (or relatively unchanged) between the
models.
In the next step, in one embodiment, the base model is modified (or
created) to correspond to state G1. It is logical to assign state G1 as the
default model because, in the absence of experimental manipulation, the
largest population of a group of dividing cells is in state G1. Moreover,
state G1 is closest to state G0, the quiescent state (an arrested state that
prevents cell division typically when the cell is starved of nutrients). The
GI state is also the easiest to produce experimentally. Various methods
exist for synchronizing a cell in G1, including cx factor arrest, elutriation
of
the smallest cells, and arrest of a cdcl5 temperature-sensitive mutant. See
Paul T. Spellman et al., "Comprehensive Identification of Cell Cycle-
Regulated Genes of the Yeast SaccYcaromyces cerevisiae by Microarray
Hybridization," Molecular Biolo~y of the Cell, vol. 9, pp. 3273-97 (1998).
While each such method likely produces certain artifacts, redundant
information could be collected using different methods to produce a
consensus picture of the default cell in G1 phase.
4. Computing Changes In Gene Expression From Default
Pattern
Expression data must be collected from a population of cells in each
of the four states. Assuming current techniques are used, the gene arrays
will report the differential expression level for each gene with respect to
the
value of the same gene in the GI data. For example, assume that the gene-
array reports a 50% repression of gene CLN2 during the M phase.
Accordingly, this gene would be assigned a weight of 0.5 for the M phase
given that it is expressed at 50% of the value of the gene-expression level
during phase G1. This process is repeated for all genes that are
CA 02414443 2002-12-24
WO 02/05205 PCT/USO1/21461
-31-
differentially expressed during the three cell cycle phases M, G2, and S
(relative to phase G1). Note that the example here is simplified. In
practice, some degree of averaging across experimental runs at each phase
may be necessary to achieve reliable results given the poor signal-to-noise
ratios of existing gene array technologies. However, the process of
assigning weights to genes based on reported expression ratios remains
essentially as described; and any modifications to the process would be
within the skill of the ordinary artisan.
5. Generating Overla~~
Overlays are constructed by changing model components that
correspond to the differentially expressed genes (in accordance with the
assigned weight). For example, if a particular gene codes for an enzyme
known to catalyze a specific reaction, then the reaction rate for the
conversion of reactant species to products can be adjusted according to the
weight (e.g., 50% decrease in that gene produces a net reaction rate that is
50% of the base model rate).
As just described, such an adjustment might entail a simple scaling of
the magnitude of some model components. However, a more accurate
method would involve the modification of components using knowledge
stored with the model components in a database. For example, if the
reaction of interest is known to be limited by the amount of substrate
present, and not by the amount of enzyme, then the over-expression of the
gene coding for this enzyme will be assumed to have minimal or no effect.
On the other hand, repression (or under-expression) of this gene would
produce less of the enzyme and could potentially change the reaction
kinetics such that the reaction rate is limited by the enzyme concentration,
not the reactant concentration alone. Such modifications to model
components must be made to each model component at a given cell cycle
state to generate an overlay. Distinct overlays must be generated for each
of the three cell cycle phases M, G2, and S.
CA 02414443 2002-12-24
WO 02/05205 PCT/USO1/21461
-32-
Example 3
Incorporating Gene-Expression Data Into a Cardiac Model
It is known that cardiac function is affected by gene expression in
cardiac cells. Indeed, there have been recent attempts to develop
computation models of cardiac cells to predict, albeit in a limited way, the
effects produced by altered gene regulation.
For example, in R.L. Winslow et al., "Mechanisms of Altered
Excitation-Contraction Coupling In Canine Tachycardia-Induced Hearf
Failure II: Model Studies," Circ. Res., vol. 84, pp. 571-86 (1999), the
authors
report that alteration of two calcium-transport mechanisms could account
for observed physiological changes in heart failure in canine myocytes.
Specifically, the sodium-calcium exchanger flux is unregulated while
uptake into ~ the sarcoplasmic reticulum via SERCA pumps is down-
regulated. Together these changes produced a reduced-amplitude, but
prolonged, intracellular calcium transient as observed experimentally. In
this particular study, model parameters in a computational model were
adjusted to match various experimental estimates from both physiological
measurements and protein content that was measured in a companion
study, as described in O'Rourke et al., "Mechanisms of Altered Excitation-
Contraction Coupling In Canine Tachycardia-Induced Heart Failure I:
Experimental Studies," Circ. Res., vol. 84, pp. 562-70 (1999).
The above-described study illustrates the overall feasibility of
modifying existing CBMs based upon data relating to differential changes
in gene expression and/or protein level. Notably, the overlay method
provides significant advantages over the approach utilized in the Window
study, wherein the modifications to the model were accomplished by ad hoc
"hand-tuning," rather than automatically generated based upon the
experimental data. In contrast to the manual parameter adjustments
performed by the Winslow group, overlays may be generated directly from
the experimental data using an automated process. Moreover, the overlay
CA 02414443 2002-12-24
WO 02/05205 PCT/USO1/21461
-33-
method is more flexible and extensible (e.g., a single overlay can be applied
to multiple models and multiple overlays can be applied to a single model).
The following example illustrates how the overlay method can be
used to modify a model in an efficient manner and simultaneously make it
possible for standard regression or optimization software to automate the
adjustment of parameters. Figure 4 shows a subset of the equations for part
of the Winslow model cited above, as displayed by Physiome Sciences In
Silico CellTM modeling software. The investigators suggested that calcium
flux in the uptake store was down-regulated. This hypothesis can be
incorporated into the model by multiplying the expression for the variable
"jup" by a factor IupFactor, as shown in Figure 5. When the factor has a
value of 1.0, the model behaves as if it is unmodified from the original
model, shown in Figure 4. When set to a factor between 0.0 and 1.0, the
model represents simple down-regulation; and when the factor is set to
values greater than 1.0, the model represents simple up-regulation by a
fixed fraetion.
The equations that initialize the value of IupFactor are shown in
Figure 6, where default values of 1.0 are shown. IupFactor, in essence,
defines a family of models (i.e., one model for each value of IupFactor).
Winslow used a manual, trial-and-error process of adjusting the
parameter values until the model fit the experimental data, but standard
nonlinear regression software can be used to find an optimal value of
IupFactor that fits the experimental data. This can be accomplished using
regression packages such as that found in the IMSL libraries from Visual
Numerics, Inc., together with simulation tools, such as In Silico CellTM
modeling software.
Notably, the In Silico CellTM software package represents models in
MathML, a plain-text Extensible Markup Language (XML), which
represents mathematical equations that can be translated into simulations
or rendered as mathematical expressions. The advantages of using
MathML content markup to mark-up algorithms is described in J. Li & G.S.
CA 02414443 2002-12-24
WO 02/05205 PCT/USO1/21461
-34-
Lett, "Using MathML to Describe Numerical Computafions," MathML
International Conference 2000 (Oct. 20, 2000). See
http://www.mathmlconference.or /g-Talks/li~. The following shows the
MathML representation for the equation defining jup in the model shown in
S Figure 4.
<math>
<RELN>
<EQ/>
<CI other="extension">jup</CI>
1O <APPLY>
<TIMES/>
<APPLY>
<DIVIDE/>
<APPLY>
15 <TIMES/>
<CI>KSR</CI>
<APPLY>
<MINUS/>
<APPLY>
20 <TIMES/>
<CI>vmaxf</CI>
<CI>fb</CI>
</APPLY>
<APPLY>
25 <TIMES/>
<CI>vmaxr</CI>
<CI>rb</CI>
</APPLY>
</APPLY>
3O </APPLY>
<APPLY>
<PLUS/>
<CN>1.0</CN>
<CI>fb</CI>
35 <CI>rb</CI>
</APPLY>
</APPLY>
<CI>IupFactor</CI>
</APPLY>
4O </RELN>
CA 02414443 2002-12-24
WO 02/05205 PCT/USO1/21461
-35-
</math>
The , following shows a similar MathML expression for the
corresponding equation from Figure 5.
<math>
<reln>
<eq/>
<ci other="extension">jup</ci>
<apply>
<divide/>
1~ <apply>
<times/>
<ci>KSR</ci>
<apply>
<minus/>
IS <apply>
<times/>
<ci>vmaxf</ci>
<ci>fb</ci>
</apply>
2~ <apply>
<times/>
<ci>vmaxr</ci>
<ci>rb</ci>
</apply>
~5 </apply>
</apply>
<apply>
<plus/>
<cn>1.0</cn>
30 <ci>fb</ci>
<ci>rb</ci>
</apply>
</apply>
</reln>
3S </math>
Since MathML is a plain-text format, standard text-manipulation
software, such as the "cliff" routines found in the standard POSIX libraries,
can be used to generate the overlay. The output of "cliff" can be used by
other packages to create multiple documents from a single document and
CA 02414443 2002-12-24
WO 02/05205 PCT/USO1/21461
-36-
multiple diff outputs. The output of the UNIX "diff" command applied to
the above text strings would look Iike this:
5a6,7
> <TTMES/>
S > <APPLY>
30a33,34
> <CI>IupFactor</CI>
> </APPLY>
This notation is much more compact than storing the entire text of
the new model. Once software, such as the In Silico CellTM modeling
platform, has applied the differences to generate new models, the software
can then translate the model into a simulation of the behavior of cardiac cell
function. Figure 7 shows a graph of the cell membrane voltage represented
by a healthy (solid curve) and post-heart-failure conditions (dotted curve)
of corresponding to the models depicted in Figures 4 and 5 respectively.
The foregoing descriptions of specific embodiments of the present
invention are presented for purposes of illustration and description. They
are not intended to be exhaustive or to limit the invention to the precise
forms disclosed; indeed, many modifications and variations are possible in
view of the above teachings. The embodiments were chosen and described
in order to explain the principles of the invention and its practical
applications, and to thereby enable others skilled in the art to utilize the
invention in its various embodiments with various modifications as are best
suited to the particular use contemplated. Therefore, while the invention
has been described with reference to specific embodiments, the description
is illustrative of the invention and is not to be construed as limiting the
invention. In fact, various modifications and amplifications may occur to
those skilled in the art without departing from the true spirit and scope of
the invention as defined by the subjoined claims.
All publications, patents and patent applications mentioned in this
specification are herein incorporated by reference to the same extent as if
each individual publication or patent application were specifically and
individually designated as having been incorporated by reference.