Note: Descriptions are shown in the official language in which they were submitted.
CA 02417909 2003-01-31
WO 02/12447 PCT/US01/24243
1
ISOLATION AND USE OF SOLID TUMOR STEM CELLS
TECHNICAL FIELD
[01] This invention relates to the diagnosis and treatment of cancer.
BACKGROUND ART
[02] Cancer remains the number two cause of mortality in this country,
resulting in over
500,000 deaths per year. Despite advances in detection and treatment, cancer
mortality remains
high. Despite the remarkable progress in understanding the molecular basis of
cancer, this
knowledge has not yet been translated into effective therapeutic strategies.
[03] In particular, breast cancer is the most common cancer in American women,
with
approximately one in nine women developing breast cancer in their lifetime.
Unfortunately,
metastatic breast cancer is still an incurable disease. Most women with
metastatic breast cancer
succumb to the disease.
[04] Traditional modes of therapy (radiation therapy, chemotherapy, and
hormonal therapy),
while useful, have been limited by the emergence of treatment-resistant cancer
cells. Clearly,
new approaches are needed to identify targets for treating metastatic breast
cancer and cancer
generally.
DISCLOSURE OF THE INVENTION
[05] The invention is based upon the discovery that a small percentage of
cells within an
established solid tumor have the properties of "stem cells". These solid tumor
"stem" cells give
rise both to more solid tumor stem cells and to the majority of cells in the
tumor, cancer cells that
have lost the capacity for extensive proliferation and the ability to give
rise to new tumors. Thus,
solid tumor cell heterogeneity reflects the presence of a variety of tumor
cell types that arise
from a solid tumor stem cell.
[06] The previous failure of cancer therapies to significantly improve outcome
has been due in
part to the failure of these therapies to target the solid tumor stem cells
within a solid tumor that
have the capacity for extensive proliferation and the ability to give rise to
all other solid tumor
cell types. This invention provides a way that anti-cancer therapies can be
directed, both
generally and now specifically directed, against the solid tumor stem cells.
The directed
anti-cancer therapies of the invention thus result in much more effective and
durable therapeutic
responses.
CA 02417909 2003-01-31
WO 02/12447 PCT/US01/24243
2
[07] By the methods of the invention, one can characterize the phenotypically
heterogeneous
populations of cells within a solid tumor. Populations of cells obtained from
the solid tumor are
isolated and structurally characterized using Fluorescence Activated Cell
Sorting (FACS). In
particular, one can identify, isolate, and characterize a phenotypically
distinct cell population
within a tumor having the stem cell properties of extensive proliferation and
the ability to give
rise to all other tumor cell types. Solid tumor stem cells are the truly
tumorigenic cells that are
capable of re-establishing a tumor following treatment.
[08] The invention provides in vivo and in vitro assays of solid tumor stem
cell function and
cell function by the various populations of cells isolated from a solid tumor.
The invention
provides methods for using the various populations of cells isolated from a
solid tumor (such as a
population of cells enriched for solid tumor stem cells) to identify factors
influencing solid tumor
stem cell proliferation, to analyze populations of cells isolated from solid
tumors for gene
expression patterns or protein expression patterns, to identify new anti-
cancer drug targets, to
predict the sensitivity of tumors from individual patients to existing anti-
cancer treatment
regimens, to model anti-cancer treatment, to test new therapeutic compounds,
to identify and test
new diagnostic markers, to treat tumors, to produce genetically modified solid
tumor stem cells,
and to prepare cDNA libraries and microarrays of polynucleotides and
polypeptides from solid
tumor stem cells.
[09] The invention provides a method for consistently growing solid tumor
cells in vivo. The
invention also provides a method to grow solid tumor cells that are in single
cell suspension or in
small aggregates. Moreover, the invention provides a chimeric animal (a
xenograft model) in
which tumors can be established from solid tumor primary cells and in which
the tumors derived
from these solid tumor cells can be tested. Furthermore, the invention
provides tumor banks
(large enough to perform substantial numbers of bioassays) derived from single
solid tumor stem
cells.
[10] In its several aspects, the invention usefully provides methods for
screening for
anti-cancer agents; for the testing of anti-cancer therapies; for the
development of drugs targeting
novel pathways; for the identification of new anti-cancer therapeutic targets;
the identification
and diagnosis of malignant cells in pathology specimens; for the testing and
assaying of solid
tumor stem cell drug sensitivity; for the measurement of specific factors that
predict drug
sensitivity; and for the screening of patients (e.g., as an adjunct for
mammography). The
invention can be used as a model to test patients' tumor sensitivity to known
therapies; as a
model for identification of new therapeutic targets for cancer treatment; as a
system to establish a
tumor bank for testing new therapeutic agents for treatment of cancer; and as
a system to identify
CA 02417909 2003-01-31
WO 02/12447 PCT/US01/24243
3
the tumorigenic cancer cells. Also, the invention provides synergy between the
methods of the
invention and breast cancer genomic databases, for an improved anti-cancer
drug discovery.
BRIEF DESCRIPTION OF DRAWINGS
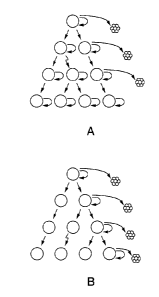
FIG. 1 shows two models of solid tumor heterogeneity. In the classic model
(FIG. 1A),
mutations or environmental differences cause tumor cells to adopt a variety of
different
phenotypes. Environmentally determined differences in phenotype, represented
by white, green,
and red cells, may be reversible while mutationally determined changes in
phenotype,
represented by purple cells, may not be reversible. Many cells with a variety
of different
phenotypes are thought to have the potential to proliferate extensively and
form new tumors.
The tumor stem cell model (FIG. 1B) is distinguished by having only a minor
population of
tumor cells that are tumorigenic (yellow cells). These tumor stem cells are
characterized by
indefinite proliferative potential, the ability to form new tumors, and the
ability to give rise to
heterogeneous non-tumorigenic cancer cells that typically form the bulk of a
tumor.
[11] FIG. 2 is a set of FACS plots of breast cancer tumor cells. Mice were
implanted with
primary breast cancer tumor cells removed from two human patients. Resultant
tumors were
removed from the mouse and single cell suspensions were made. Cells were
stained with
anti-CD44-PE, anti-520C9-APC, anti-mouse H2K-FITC (which stains infiltrating
mouse cells)
and Propidium Iodide (PI, which stains dead cells). Live, human CD44+ and
human CD44- cells
were isolated and used for in vitro and in vivo studies.
[12] FIG. 3 is a set of FACS plots showing the expression of CD24 by malignant
breast cells.
Cells were isolated and stained as described in FIG. 2. Mouse cells and dead
cells were gated
out of the analysis. The FACS plots of cells from three breast cancer tumors
are shown. Note
that cells from all three tumors have a similar phenotype.
[13] FIG. 4 is a set of FACS plots showing an analysis of tumors arising from
the CD24" cell
population from human breast cancers. According to the solid tumor stem cell
model, the CD24.-
cells give rise to tumors that contain both CD24.+ and CD24" cells.
Accordingly, secondary
transplants were performed using B38.1+CD24- cells (FIG. 4A). The resultant
tumors were
removed and the cells were re-analyzed with respect to B38.1 and CD24
expression. As
predicted by the stem cell model, cells obtained from a tumor arising from
transplanted
B38.1+CD24" cells were heterogeneous with respect to expression of both B38.1
and CD24 (FIG.
4B). The marker expression pattern of the cells isolated from the tumor
initiated by the
B38.1+CD24- cells was similar to that of the original tumor (FIG. 4).
[14] FIG. 5 is a FACS plot showing an analysis of Notch 4 expression. Cells
were isolated
CA 02417909 2003-01-31
WO 02/12447 PCT/US01/24243
4
from a mouse xenograft tumor (see, below) and stained with antibodies.
Malignant cells were
analyzed for expression of B38.1 and Notch 4. Mouse cells and dead cells were
gated out of the
analysis.
[15] FIG. 6 shows the fractionation of breast cancer cells based upon CD44
expression.
Tumor Ti cells (FIG. 6A, FIG. 6C, and FIG. 6E) and Tumor T2 cells (FIG. 6B,
FIG. 6D, and
FIG. 6F) were stained with anti-CD44-PE, anti-mouse H2K-FITC and the viability
dye 7AAD.
Flow cytometry was used to isolate live, human (H2K-) cells that were either
CD44+ (FIG. 6C,
FIG. 6D) or CD44- (FIG. 6E, FIG. 6F). Dead cells (7AAD) were eliminated from
all analyses.
FIG. 6A and FIG. 6B are dot plots of the unfractionated Ti and T2 cells
showing CD44 and H2K
expression as indicated. Plots showing the isolated CD44 + (FIG. 6C, FIG. 6D)
and CD44" (FIG.
6E, FIG. 6F) populations depict reanalyses of cells that had been isolated by
flow-cytometry.
These cells were injected into the mammary fat pads of mice to examine their
tumorigenicity.
TABLES 1 and 3 show that the CD44+ cells but not the CD44- cells were
tumorigenic.
[16] FIG. 7 shows the isolation of tumorigenic cells. Flow cytometry was used
to isolate
subpopulations of Tumor Ti (FIG. 7A, FIG. 7D, and FIG. 7G), Tumor 12 (FIG. 7B,
FIG. 7E,
and FIG. 7F) or Tumor T5 cells (FIG. 7C, FIG. 7F, and FIG. 71) that were
tested for
tumorigenicity in NOD/SCID mice. Ti and T2 cells had been passaged once in
NOD/SCID
mice while 15 cells were obtained from material that had been frozen
immediately after removal
from a patient. Cells were stained with anti-B38.1-APC, anti-CD44-PE, anti-
CD24-FITC,
anti-LINEAGE-Cytochrome, anti-mouse-H2K-Cytochrome (Ti and T2 cells only), and
7AAD.
Dead cells (7AAD), mouse cells (H2K) and LINEAGE+ cells were eliminated from
all
analyses. Each dot plot depicts the CD24 and CD44 staining patterns of live
human
B38.1+LINEAGE- cells. FIG. 7A, FIG. 7B, and FIG. 7C show unfractionated tumor
cells.
B38.1+CD44+LINEAGE" cells that were either CD2441 (FIG. 7G, FIG. 7H, FIG. 71)
or CD24+
(FIG. 7D, FIG. 7E, FIG. 7F) were isolated from these tumor cells by flow-
cytometry. FIGS.
7D-71 depict reanalyses of these sorted populations, which were subsequently
injected into the
mammary fat pads of NOD/SCID mice to test tumorigenicity. FIG. 7J shows a
representative
tumor in a mouse at the B38.1+CD44+CD2441 LINEAGE- injection site, but not at
the
B38.1+CD44+CD24+LINEAGE- injection site. Histology performed on tissue from
the CD24+
(FIG. 7K, 20x objective magnification) and CD2441 (FIG. 7L, 40x objective
magnification)
injection sites exhibited normal mouse tissue and malignant cells
respectively.
[17] FIG. 8 shows the enrichment of tumorigenic cells based upon ESA
expression. Flow
cytometry was used to isolate subpopulations of Tumor Ti cells that were
tested for
tumorigenicity in NOD/SCID mice. Ti cells had been passaged once in NOD/SCID
mice. Cells
CA 02417909 2003-01-31
WO 02/12447 PCT/US01/24243
were stained with anti-B38.1-APC, anti-CD24-PE, anti-ESA-FITC, anti-LINEAGE-
Cytochrome,
anti-mouse-H2K-Cytochrome (Ti), and 7AAD. Dead cells (7AAD+), mouse cells
(H2K+) and
LINEAGE+ cells were eliminated from the analysis. The dot plot in FIG. 8A
depicts the CD24
and ESA staining pattern of live human B38.1+L1NEAGE- cells. The tumorigenic
population is
boxed and marked with an arrow. In FIG. 8B, the ESA+B38.1+CD2441 LINEAGE-
cells (left
panel) and the remaining LINEAGE H2K" cells (right panel) were collected using
flow
cytometry.
[18] FIG. 9 is the results of an in vitro clonogenic assay. Flow cytometry was
used to isolate
tumorigenic cell or the rest of the non-tumorigenic neoplastic (non-
tumorigenic cells) as
described. The cells were placed in tissue culture medium containing soluble
Delta for the
indicated number of days. The tumorigenic and non-tumorigenic xenograft Tumor
1 (Ti) (FIG.
9A), Tumor 4 (T4) (FIG. 9B) or primary patient (FIG. 9C) cells are shown at
the indicated time
after being placed in tissue culture. T4 cells were stained with Papanicolaou
stain and examined
under light microscopy (100x objective). Note that both the non-tumorigenic
(FIG. 9D) and
tumorigenic (FIG. 9E) populations consist of neoplastic cells with large
nuclei and prominent
nucleoli. Note that the number of cells that attached to the tissue culture
plate is similar in both
populations, but that the tumorigenic population always gave rise to colonies.
Non-tumorigenic
populations do not give rise to established colonies (or only for brief
periods, about 2-6 days).
[19] FIG. 10 is a set of dot plots showing the phenotypic diversity in tumors
arising from
B38.1+CD44+CD24'LINEAGE- cells. The dot plots depict the CD24 and CD44
staining
patterns of live human LINEAGE- cells from Tumor Ti (FIG. 10A - FIG. 10C) or
Tumor T2
(FIG. 10D - FIG. 10F). FIG. 10A and FIG. 10D show nnfractionated Ti or T2
cells obtained
from tumors that had been passaged once in NOD/SCID mice.
B38.1+CD44+CD2441 LINEAGE- cells from T1 (FIG. 10B) or T2 (FIG. 10E) were
isolated as
described in FIG. 2, above. The B38.1+CD44+CD2441 LINEAGE- populations
reanalyzed in
FIG. 10B and FIG. 10E) were injected into the mammary fat pads of NOD/SCID
mice. FIG.
10C and FIG. 1OF depict analyses of the tumors that arose from these
B38.1-1-CD44+CD2441 LINEAGE- cells. Note that in both cases, the
B38.1+CD44+CD2441 LINEAGE cells formed tumors that contained a phenotypically
diverse
population of cells similar to that observed in the original tumor.
[20] FIG. 11 shows the expression of HER2/neu and EGF-R. Flow cytometry was
used to
isolate subpopulations of Tumor Ti cells that had been passaged once in
NOD/SCID mice. Cells
were stained with, in FIG. 11A, anti-EGF-R-PE, anti-B38.1-APC, anti-CD24-FITC,
CA 02417909 2003-01-31
WO 02/12447 PCT/US01/24243
6
anti-LINEAGE-Cytochrome, anti-mouse-H2K-Cytochrome, and 7AAD or, in FIG. 11B
anti-HER2/neu-FITC, anti-B38.1-APC, anti-CD24-PE, anti-LINEAGE-Cytochrome,
anti-mouse-H2K-Cytochrome, and 7AAD. Dead cells (7AAD), mouse cells (H2K+) and
LINEAGE cells were eliminated from all analyses. The histogram in FIG. 11A
depicts the
EGF-R expression of the unstained cells (dotted line), B38.1+CD24-LINEAGE"
tumorigenic
population (shaded) and the B38+CD24+LINEAGE- non-tumorigenic (solid line)
population.
The histogram in FIG. 11B shows HER2/neu expression of the unstained cells
(dotted line),
B38.1+CD24-LINEAGE tumorigenic population (shaded) and the B38+CD24+LINEAGE"
non-tumorigenic (solid line) population. RT-PCR was performed using nested
primers to detect
EGF-R (FIG. 11C and FIG. 11D) or to detect HER2/neu (FIG. 11E). One cell per
sample in
panels FIG. 11D and FIG. 11E, or ten cells per sample in panel FIG. 11C, were
analyzed.
EGF-R is expressed at lower levels in tumorigenic cells than in non-
tumorigenic cells at both the
protein (FIG. 11A) and mRNA levels (FIG. 11C, FIG. 11D).
[21] FIG. 12 is a photomicrograph of breast cancer cells placed in tissue
culture after exposure
to an anti-Notch 4 antibody. Cells were incubated on ice for one hour in HBSS
with or without
soluble Delta but no anti-Notch 4 antibody, with anti-Notch 4 antibody, or
with anti-Notch 4
antibody that had been preincubated with the peptide used to generate the
antibody. The number
of colonies that formed in the triplicate experiments is shown. Soluble Delta
was added to the
culture. Fe-control medium without soluble Delta was added to the culture.
Symbols: Ab¨the
anti-Notch 4 antibody; Block¨the peptide used to generate the anti-Notch 4
antibody.
[22] FIG. 13 is a schematic diagram of B38.1+ cells within a tumor. The breast
cancer stem
cells from multiple patients are B38.1+. To successfully treat a cancer with a
gene therapy
approach, these cells can be targeted with a vector.
[23] FIG. 14 is a description of the method for obtaining the bi-specific
conjugate and the
chemical modifications introduced in the antibodies.
[241 FIG. 15 is a strategy for re-targeting Adenovirus. The LaZ virus can
infect most of the
cells from a tumor. After the LaZ virus is incubated only with the anti-fiber
antibody, the LaZ
virus loses ability to infect all of the cells. After the LaZ virus is
incubated with the bi-specific
conjugate, the B38.1 moiety of the molecule allows the attachment of the virus
to the B38.1+
cells, so only these cells are infected.
[25] FIG. 16 shows the targeting of breast cancer stem cells with the hi-
specific antibody.
Different cell lines were infected with AdLaZ, which is an El-deleted
Adenovirus that expresses
the I3-galactosidase gene (gray columns, control for virus infection). In some
cases, the virus was
incubated with the anti-fiber antibody for 30 min before infection (yellow
columns). In other
CA 02417909 2003-01-31
WO 02/12447 PCT/US01/24243
7
cases, the virus was incubated with the bi-specific conjugate (green columns).
After 24 hr of
infection, the monolayers were fixed and incubated with X-Gal-contained
buffer. The infected
cells are blue, and the graphic shows the percentage of blue cells obtained,
relative to the control
infection (i.e., the reduction or increase in infectivity of the virus after
incubation with the
different antibodies).
[26] FIG. 17 shows that the bispecific antibody can target an adenovirus
vector to breast
cancer stem cells. The columns represent the absolute number of infected cells
per field. Gray:
The indicated cells infected with the control adenovirus. Yellow: the
indicated cells were
infected with the adenovirus that had been incubated with the anti-fiber
antibody. Green: The
indicated cells were incubated with the bi-specific conjugate antibody. Red:
Cells were infected
with the virus that had been incubated with the bi-specific conjugate
antibody, but the cells were
pre-treated with an excess of B38.1 antibody.
[27] FIG. 18 is a photograph of some of the cell monolayers after X-Gal
staining. The infected
cells appear like dark dots in this black and white picture (the 0-
galactosidase gene of the LaZ
virus has a nuclear localization signal. The staining is in the nuclei of the
cells.
[28] FIG. 19 is an analysis if different populations of cells in a breast
cancer.
ESA+CD44+CD2441 LINEAGE- cells breast cancer stem cells (FIG. 19A) and
ESA+CD44+CD24+LINEAGE- non-tumorigenic cells (FIG. 19B) were obtained as
described in
FIG. 8. The cells were stained with Hoechst 33342 as described by Eaves and
colleagues
(Glimm H et al., Blood. 96(13): 4185-93 (2000)). The histogram for the breast
cancer stem cells
is shaded. Note that the breast cancer stem cells and the non-tumorigenic
cells are distributed in
all phases of the cells cycle.
[29] FIG. 20 is a further analysis if different populations of cells in a
breast cancer.
CD44+CD2441 LINEAGE" cells breast cancer stem cells and non-tumorigenic
CD44+CD24+LINEAGE" non-tumorigenic cells were obtained as described in FIG. 7.
The cells
were stained with Rhodamine 123 as described by Spangrude et al., Blood
85(4):1006-16, 1995).
The histogram for the breast cancer stem cells is shaded. Note that the breast
cancer stein cells
tend to stain less intensely with Rhodamine 123.
[30] FIG. 21 is an analysis of ascites fluid for ovarian cancer stem cells.
Cells were stained
with anti-B38.1-AF'C, anti-CD44-PE, anti-CD24-FITC, anti-Lineage-Cytochrome
and 7AAD.
Dead cells (7AAD+), and LINEAGE+ cells were eliminated from the analyses. Note
that there is
a distinct CD44+CD2441 LINEAGE- population of cells that resembles the breast
cancer stem
cells.
[31] FIG. 22 is an analysis of sarcoma cells for solid tumor stem cells. P1
sarcoma cells
CA 02417909 2003-01-31
WO 02/12447 PCT/US01/24243
8
growing in the xenograft model were stained with anti-B38.1-APC, anti-CD44-PE,
anti-CD24-
FITC, anti- LINEAGE-Cytochrome, anti-H2K-Cytochrome and 7AAD. Dead cells
(7AAD+),
LINEAGE' cells and mouse cells were eliminated from the analyses. Note that
the lineage
cocktail in this analysis did not include CD10, CD31 or CD140b. Also note that
there is a
distinct CD44+CD2441 LINEAGE" population of cells.
MODES FOR CARRYING OUT THE INVENTION
[32] Stem cells and solid tumor heterogeneity models. Solid tumors are
composed of
heterogeneous cell populations. For example, breast cancers are a mixture of
cancer cells and
normal cells, including mesenchymal (stromal) cells, inflammatory cells, and
endothelial cells.
Classic models hold that phenotypically distinct cancer cell populations all
have the capacity to
proliferate and give rise to a new tumor (FIG. 1A). In the classical model,
tumor cell
heterogeneity results from environmental factors as well as ongoing mutation
within cancer cells
resulting in diverse populations of tumorigenic cells and all populations of
cells would have
similar tumorigenic potential. Pandis et al., Genes, Chromosomes &Cancer 12:
122-129 (1998);
Kuukasjarvi et al., Cancer Res. 57: 1597-1604 (1997); Bonsing et al., Cancer
71: 382-391
(1993); Bonsing et al., Genes Chromosomes &Cancer 82: 173-183 (2000); Beerman
H et al.,
Cytometry. 12(2): 147-54 (1991); Aubele M & Werner M, Analyt. Cell. Path. 19:
53 (1999);
Shen L et al., Cancer Res. 60: 3884 (2000)).
[33] This invention is based upon an alternative model of solid tumor cell
heterogeneity, in
which a solid tumor results from a "solid tumor stem cell" (or "cancer stem
cell" from a solid
tumor) and the subsequent chaotic development of the solid tumor stem cell. In
this stem cell
model (FIG. 1B), solid tumors contain a distinct, limited (or possibly rare)
subset of cells that
share the properties of normal "stem cells", in that they proliferate
extensively or indefinitely and
that they efficiently give rise to additional solid tumor stem cells. Within
an established solid
tumor, most cells have lost the ability to proliferate extensively and form
new tumors, but solid
tumor stem cells proliferate extensively and give rise to additional solid
tumor stem cells as well
as to other tumor cells that lack tumorigenic potential. It is this solid
tumor stem cell population
that proliferates and ultimately proves fatal.
[34] To distinguish between these models, the deficiencies of the previous
clonogenic assays
(see, below) must be overcome. To prove the existence of a consistent stem
cell population
rather that a constant low probability of tumorigenicity in any cell type, one
must be able to
purify the stem cells and show that they are highly enriched for
tumorigenicity, while the
remainder of the neoplastic cells are depleted of such activity. The invention
provides this
CA 02417909 2010-11-01
9
ability.
[35] The ability to isolate and analyze cell populations within a solid tumor,
based upon
structural features of the solid tumor stem cells, described herein, allows
one skilled in the art of
oncology or stem cell biology to distinguish between the two models shown in
FIG. 1. By this
invention, solid tumor stem cells and cell populations from solid tumors have
been isolated and
analyzed. Moreover, these solid tumor stem cells have very high or unlimited
proliferative
potential, and thus represent the truly tumorigenic population. According to
the solid tumor stem
cell model and the results provided below (see, EXAMPLES), these tumorigenic
cells are the =
clonogenic cells of solid tumors.
[36] During normal animal development, cells of most or all tissues are
derived from normal
precursors, called stem cells (Morrison et al., Cell 88(3): 287-98 (1997);
Morrison et al., Curr.
Opin. Immunol. 9(2): 216-21 (1997); Morrison et al., Annu. Rev. Cell. Dev.
Biol. 11: 35-71
(1995)). The term "stem cell" is known in the art to mean (1) that the cell is
a cell capable of
generating one or more kinds of progeny with reduced proliferative or
developmental potential;
(2) that the cell has extensive proliferative capacity; and (3) that the cell
is capable of
self-renewal or self-maintenance (see, Pollen et al., Development 110: 1001
(1990); U.S. Pat.
Nos. 5,750,376, 5,851,832, 5,753,506, 5,589,376, 5,824,489, 5,654,183,
5,693,482, 5,672,499,
and 5,849,553). In adult animals, some cells (including
cells of the
blood, gut, breast ductal system, and skin) are constantly replenished from a
small population of
stem cells in each tissue. Thus, the maintenance of tissues (whether during
normal life or in
response to injury and disease) depends upon the replenishing of the tissues
from precursor cells
in response to specific developmental signals.
[37] The best-known example of adult cell renewal by the differentiation of
stem cells is the
hematopoietic system (see, U.S. Pat Nos. 5,061,620, 5,087,570, 5,643,741,
5,821,108,
5,914,108). Developmentally immature precursors
(laematopoietic stem and progenitor cells) respond to molecular signals to
gradually form the
varied blood and lymphoid cell types. Stem cells are also found in other
tissues, including
epithelial tissues (see, Slack, Science 287: 1431(2000)) and mesenchymal
tissues. (see, U.S. Pat.
No. 5,942,225). In normal breast development, a normal stem
cell
gives rise to differentiated progeny to form a normal ductal system. Kordon &
Smith,
Development 125: 1921-1930 (1998); see also, U.S. Pat Nos. 5,814,511 and
5,650,317.
[38] By this invention, the principles of normal stem cell biology have been
applied to isolate
and characterize solid tumor stem cells. Examples of solid tumors from which
solid tumor stem
cells can be isolated or enriched for according to the invention include
sarcomas and carcinomas
CA 02417909 2003-01-31
WO 02/12447 PCT/US01/24243
such as, but not limited to: fibrosarcoma, myxosarcoma, liposarcoma,
chondrosarcoma,
osteogenic sarcoma, chordoma, angiosarcoma, endotheliosarcoma,
lymphangiosarcoma,
lymphangioendotheliosarcoma, synovioma, mesothelioma, Ewing's tumor,
leiomyosarcoma,
rhabdomyosarcoma, colon carcinoma, pancreatic cancer, breast cancer, ovarian
cancer, prostate
cancer, squamous cell carcinoma, basal cell carcinoma, adenocarcinoma, sweat
gland carcinoma,
sebaceous gland carcinoma, papillary carcinoma, papillary adenocarcinomas,
cystadenocarcinoma, medullary carcinoma, bronchogenic carcinoma, renal cell
carcinoma,
hepatoma, bile duct carcinoma, choriocarcinoma, seminoma, embryonal carcinoma,
Wilms'
tumor, cervical cancer, testicular tumor, lung carcinoma, small cell lung
carcinoma, bladder
carcinoma, epithelial carcinoma, glioma, astrocytoma, medulloblastoma,
craniopharyngioma,
ependymoma, pinealoma, hemangioblastoma, acoustic neuroma, oligodendroglioma,
meningioma, melanoma, neuroblastoma, and retinoblastoma. The invention is
applicable to
sarcomas (see, FIG. 22) and epithelial cancers, such as ovarian cancers (see,
FIG. 21) and breast
cancers (see, EXAMPLES).
[39] Solid tumor stem cells are defined structurally and functionally as
described herein; us.ing
the methods and assays similar to those described below. Because tumor cells
are known to
evolve phenotypically and functionally over time as additional genetic
mutations occur, the solid
tumor stem cells may change phenotypically and functionally over time in an
individual patient.
Nevertheless, one can use the method of the invention, employing the markers
disclosed herein,
which are consistently useful in the isolation or identification of solid
tumor stem cells in a
majority of patients.
[40] Also, solid tumor stem cells undergo "self-renewal" and "differentiation"
in a chaotic
development to form a tumor, give rise to abnormal cell types, and may change
over time as
additional mutations occur. The functional features of a solid tumor stem cell
are that they are
tumorigenic, they give rise to additional tumorigenic cells ("self-renew"),
and they can give rise
to non-tumorigenic tumor cells ("differentiation").
[41] The developmental origin of solid tumor stem cells can vary between
different types of
solid tumor cancers. Solid tumor stem cells may arise either as a result of
genetic damage that
deregulates the proliferation and differentiation of normal stem cells
(Lapidot et al., Nature
367(6464): 645-8 (1994)) or by the dysregulated proliferation of a normal
restricted progenitor
or a normal differentiated cell type. Typically, solid tumors are visualized
and initially identified
according to their locations, not by their developmental origin.
[42] By contrast, a non-tumorigenic cell from a solid tumor is a cell from a
population that
fails to form a palpable tumor upon transplantation into an immunocompromised
mouse, wherein
CA 02417909 2003-01-31
WO 02/12447 PCT/US01/24243
11
if the same number of unfractionated, dissociated tumor cells were
transplanted under the same
circumstances, the solid tumor stem cells would form a palpable tumor in the
same period of
time. Thus non-tumorigenic cells are depleted for tumor forming activity in an
animal model.
[43] A "palpable tumor" is known to those in the medical arts as a tumor that
is capable of
being handled, touched, or felt.
[44] Because the tumorigenic changes are intrinsic to solid tumor stem cells,
even after they
have been removed from their normal environment within the tumor, the
invention provides
several novel uses:
(1) by identifying the genes and proteins expressed by solid tumor stem cells
it is possible
to identify proteins whose function is necessary for tumorigenesis and which
represent novel
drug targets;
(2) by purifying solid tumor stem cells based on phenotypic markers it is
possible to
study their gene expression patterns and functions much more directly and
efficiently;
(3) by developing in vitro and in vivo assays of solid tumor stem cell
function it is
possible to more effectively test the effects of potential therapeutic
compounds;
(4) by identifying markers of solid tumor stem cells it is possible to more
effectively
diagnose the presence of malignant cells (even those that do not depend on
rare environmental
characteristics for their ability to make tumors); and
(5) by isolating solid tumor stem cells from individual patients and
transplanting them
into in vitro and in vivo functional assays it is possible to test the
effectiveness of different drug
regimens against them. Thus, it is possible to predict drug sensitivity and
drug resistance.
[45] The solid tumor stem cells of the model of the invention differs from the
"cancer stem
line" provided by U.S. Pat. 6,004,528. In that patent, the "cancer stem line"
is defined as a slow
growing progenitor cell type that itself has few mutations but which undergoes
symmetric rather
than asymmetric cell divisions as a result of tumorigenic changes that occur
in the cell's
environment. This "cancer stem line" hypothesis thus proposes that highly
mutated, rapidly
proliferating tumor cells arise largely as a result of an abnormal
environment, which causes
relatively normal stem cells to accumulate and then undergo mutations that
cause them to
become tumor cells. U.S. Pat. 6,004,528 proposes that such a model can be used
to enhance the
diagnosis of cancer. The solid tumor stem cell model is fundamentally
different than the "cancer
stem line" model and as a result exhibits utilities not offered by the "cancer
stem line" model.
First, solid tumor stem cells are not "mutationally spared". The "mutationally
spared cancer stem
line" described by U.S. Pat. No. 6,004,528 may be considered a pre-cancerous
lesion, while the
solid tumor stem cells described of this invention are cancer cells that
themselves contain the
CA 02417909 2003-01-31
WO 02/12447 PCT/US01/24243
12
mutations that are responsible for tumorigenesis. That is, the solid tumor
stem cells ("cancer
stem cells") of the invention would be included among the highly mutated cells
that are
distinguished from the "cancer stem line" in U.S. Pat. 6,004,528. Second, the
genetic mutations
that lead to cancer are largely intrinsic within the solid tumor stem cells
rather than being
environmental. The solid tumor stem cell model predicts that isolated solid
tumor stem cells can
give rise to additional tumors upon transplantation (thus explaining
metastasis) while the "cancer
stem line" model would predict that transplanted "cancer stem line" cells
would not be able to
give rise to a new tumor, since it was their abnormal environment that was
tumorigenic. Indeed,
the ability to transplant dissociated, and phenotypically isolated human solid
tumor stem cells to
mice (into an environment that is very different from the normal tumor
environment), where they
still form new tumors, distinguishes the present invention from the "cancer
stem line" model.
Third, solid tumor stem cells likely divide both symmetrically and
asymmetrically, such that
symmetric cell division is not an obligate property. Fourth, solid tumor stem
cells may divide
rapidly or slowly, depending on many variables, such that a slow proliferation
rate is not a
defining characteristic.
[46] As described above, solid tumor stem cells can be operationally
characterized by cell
surface markers. These cell surface markers can be recognized by reagents that
specifically bind
to the cell surface markers. For example, proteins, carbohydrates, or lipids
on the surfaces of
solid tumor stem cells can be immunologically recognized by antibodies
specific for the
particular protein or carbohydrate (for construction and use of antibodies to
markers, see,
Harlow, Using Antibodies: A Laboratory Manual (Cold Spring Harbor Press, Cold
Spring
Harbor, New York, 1999); see also, EXAMPLES). The set of markers present on
the cell
surfaces of solid tumor stem cells (the "cancer stem cells" of the invention)
and absent from the
cell surfaces of these cells is characteristic for solid tumor stem cells.
Therefore, solid tumor
stem cells can be selected by positive and negative selection of cell surface
markers. A reagent
that binds to a solid tumor stem cell is a "positive marker" (i.e., a marker
present on the cell
surfaces of solid tumor stem cells) that can be used for the positive
selection of solid tumor stem
cells. A reagent that binds to a solid tumor stem cell "negative marker"
(i.e., a marker not present
on the cell surfaces of solid tumor stem cells but present on the surfaces of
other cells obtained
from solid tumors) can be used for the elimination of those solid tumor cells
in the population
that are not solid tumor stem cells (L e., for the elimination of cells that
are not solid tumor stem
cells).
[47] In one embodiment, the discrimination between cells based upon the
detected expression
of cell surface markers is by comparing the detected expression of the cell
surface marker as
CA 02417909 2010-11-01
13
compared with the mean expression by a control population of cells. For
example, the expression
of a marker on a solid tumor stem cell can be compared to the mean expression
of the marker by
the other cells derived from the same tumor as the solid tumor stem cell.
Other methods of
discriminating among cells by marker expression include methods of gating
cells by flow
cytometry based upon marker expression (see, Givan A, Flow Cytometry: First
Principles,
(Wiley-Liss, New York, 1992); Owens MA & Loken MR., Flow Cytometry: Principles
for
Clinical Laboratory Practice, (Wiley-Liss, New York, 1995)).
[48] Solid tumor stem cell positive markers may also be present on cells other
than solid
tumor stem cells. Solid tumor stem cell negative markers may also be absent
from cells other
than solid tumor stem cells. While it is rare to identify a single marker that
identifies a stem cell,
it has often been possible to identify combinations of positive and negative
markers that uniquely
identify stem cells and allow their substantial enrichment in other contexts.
Morrison et al., Cell
96(5): 737-49 (1999); Morrison et al., Proc. NatL Acad Set USA 92(22): 10302-6
(1995);
Morrison & Weissman, Immunity 1(8): 661-73 (1994).
[49] A "combination of reagents" is at least two reagents that bind to cell
surface markers
either present (positive marker) or not present (negative marker) on the
surfaces of solid tumor
stem cells, or to a combination of positive and negative markers (see,
EXAMPLES 7 and 8,
TABLE 6). The use of a combination of antibodies specific for solid tumor stem
cell surface
markers results in the method of the invention being useful for the isolation
or enrichment of
solid tumor stem cells from a variety of solid tumors, including sarcomas,
ovarian cancers, and
breast tumors. Guidance to the use of a combination of reagents can be found
in PCT patent
application WO 01/052143 (Morrison & Anderson).
[50] By selecting for phenotypic characteristics among the cells obtained from
a solid tumor,
solid tumor stem cells can be isolated from any animal solid tumor,
particularly any mammalian
solid tumor. It will be appreciated that, taking into consideration factors
such as a binding
affinities, that antibodies that recognize species-specific varieties of
markers are used to enrich
for and select solid tumor stem cells. Antibodies that recogpin the species-
specific varieties of
CD44, B38.1, CD24 and other markers will be used to enrich for or isolate
solid tumor stem cells
from that species (for example, antibody to a mouse CD44 for mouse solid tumor
stem cells,
antibody to a monkey B38.1 for monkey solid tumor stem cells, etc.).
[51] An efficient xenograft model of human breast cancer. The invention
provides a xenograft
model in which to establish tumors by the injection of solid tumor cells into
a host animal. The
host animal can be a model organism such as nematode, fruit fly, zebrafish;
preferably a
laboratory mammal such as a mouse (nude mouse, SCID mouse, NOD/SCID mouse,
CA 02417909 2003-01-31
WO 02/12447 PCT/US01/24243
14
Beige/SCID Mouse), rat, rabbit, or primate. The severely immunodeficient NOD-
SCID mice
were chosen as recipients to maximize the participation of injected cells.
Immunodeficient mice
do not reject human tissues, and SCID and NOD-SCID mice have been used as
hosts for in vivo
studies of human hematopoiesis and tissue engraftment. McCune et al., Science
241: 1632-9
(1988); Kamel-Reid & Dick, Science 242: 1706-9 (1988); Larochelle et al., Nat.
Med. 2:
1329-37 (1996). In addition, Beige/SCID mice also have been used.
[52] Xeno graft tumors have been established from mastectomy specimens of all
the patients
that have been tested to date (see, EXAMPLE 7). Tumors in mice have also been
established
from malignant pleural effusions. In addition, tumors have been established by
the subcutaneous
injection of cells that have been obtained from two sarcomas. Furthermore, for
all the tumors that
we have attempted, we have been able to make single-cell suspensions (or
suspensions with a
few aggregates of cell, such as less than 100; preferably less than 10) and
then transfer the
tumors. This xenograft assay is useful for biological and molecular assays to
characterize the
tumorigenic, clonigenic solid tumor stem cells.
[53] The NOD/SCID or Beige/SCID mice can be further immunosuppressed, using VP-
16
(see, EXAMPLES 1 and 3), radiation therapy, chemotherapy, or other
immunosuppressive
biological agents.
[54] This in vivo assay is particularly advantageous for the better
understanding of breast
cancer and development of new treatments for this disease. Until now, it has
been impossible to
do biological and molecular studies involving primary breast cancer. Such
studies have been
limited to cell lines. Unfortunately, it is well known that the many of the
fundamental properties
of breast cancer cells change in tissue culture. Fenhall et al., British J.
Cancer 81: 1142-1149
(1999). This latter problem only worsens with continued culturing of the
cells.
[55] By contrast, using the method of the invention, breast cancer cells
(preferably enriched
for breast cancer stem cells) are injected into immunocompromised mice, to
grow the tumor. In
one embodiment, the cells are injected either into the mammary fat pads of
mice or
subcutaneously into the mice. Furthermore, tumors can be established from
single-cell
suspensions (or suspensions with a few aggregates of cell, such as less than
100; preferably less
than 10) and then the tumors transferred to other mice.
[56] The enrichment of solid tumor stem cells and the isolation of solid tumor
stem cells
distinguishes the present invention from the "primary bioassay of human tumor
stem cells"
referred to in U.S. Pat. No. 4,411,990 (see also, Hamburger et al., Blood 47:
995 (1976); Salmon
et al., AACR Abstracts 19: 231, Abstract No. 922 (1978)). In previous tissue
culture assays, only
a small proportion of the tumor cells were able to form colonies in an in
vitro clonogenic assay,
CA 02417909 2003-01-31
WO 02/12447 PCT/US01/24243
and large numbers of cells (such as myeloma and hematopoietic cells) were
typically needed to
be transplanted to form tumors in vivo. Ogawa M et al., Cancer Research.
31(12): 2116-2119
(1971); Ogawa M et al., Cancer Research 33(12): 3172-3175, 1973. Salmon SE &
Hamburger
AW, Science 197: 461-463 (1977). Schlag P & Flentje D, Cancer Treatment
Reviews 11 Suppl
A:131-7 (1984). This led to the hypothesis that only a small number of tumor
cells are actually
tumorigenic. However, because of technical limitations, this tumorigenic
fraction of cells could
not be isolated from non-tumorigenic cells and therefore it could not be
proven that there were
intrinsically different subsets of tumor cells, some with substantial
proliferative potential and
others with limited potential. That is, unless the tumorigenic cells can be
purified and
= distinguished from the non-tumorigenic cells it remains possible that all
tumor cells have a
similar low probability of exhibiting clonogenic activity in any assay.
Moreover, without the
ability to identify and isolate the tumorigenic fraction of cells (the tumor
stem cells) U.S. Pat.
No. 4,411,990 lacks the utilitities described in this invention. For example,
without markers to
isolate the tumorigenic cells it is not possible to study their gene
expression patterns, or their
expression of diagnostic markers, or their response to therapeutic agents..
Several technical
problems prevented prior inventions from isolating tumorigenic cells or tumor
stem cells. First,
in vitro assays resulted in some initial colony formation, but usually the
cells stopped
proliferating and could not be grown continuously in culture. Salmon, S.E. &
Hamburger AW,
Science 197: 461-463 (1977); Schlag P et al., Cancer Treatment Reviews. 11
Suppl A:131-7,
(1984); Salmon SE, Recent Results in Cancer Research 94: 8 (1984). Also, cells
from many
tumors failed to form colonies in vitro at all. Carney DN et al, Stem Cells 1:
149-164 (1981).
Similarly, dissociated cells isolated from most solid tumors rarely formed
tumors in
immunodeficient mouse models. Sakakibara T et al., Cancer J. Si. Am 2: 291-300
(1996);
Mueller B & Reisfeld RA, Cancer Metastasis Rev. 10: 193-200, (1991). The
observation that
only particular clones of immortalized tissue culture cancer cell lines were
capable of forming
tumors in the in vivo models further illustrates this problem (Hamilton TC et
al., Cancer
Research 44(11): 5286-90 (1984)). Thus, the limitations in the assays made it
impossible to
determine whether the colonies arose from stem cells that had lost their
capacity to proliferate in
vitro ,from non-tumorigenic cells that had limited proliferative potential, or
whether the small
number of cells able to form colonies in vitro was due to a "stem cell"
population within the
tumor or due to a rare cell that could proliferate in vitro. Furthermore, it
was not possible to
distinguish phenotypically different populations of cells: prior to this
invention, very limited use
was made of techniques like flow-cytometry to separate and analyze
phenotypically distinct
populations of solid tumor cells by flow-cytometry. Indeed, the clonogenic
assays used in the
CA 02417909 2010-11-01
16
prior art did not predict the behavior of an individual patient's tumor and
fell out of favor. Von
Hoff DD et al., Cancer. 67(1): 20-7 (1991); Federico M et al., Gynecologic
Oncology. 55(3 Pt
2): 8156-63 (1994). Thus, the limitations in the cell separation techniques,
and the assays used in
the prior art made it impossible for them to purify tumorigenic cells.
Therefore, it was
impossible to prove the existence of hypothetical tumor stem cells.
[57] Role of Notch in breast cancer. The Notch family of receptors has been
implicated in
stem cell development and differentiation (see, Morrison et aL, Cell 101(5):
499-510 (2000);
Artavanis-Tsakonas et al., Science 284: 770 (1999); and Artavanis-Tsakonas et
al., Science 268:
225-232 (1995); U.S. Pat. No. 6,090,922). Notch was originally
identified in Drosophila through loss-of-function mutations that produced too
many neurons at
the expense of other cell types. Poulson, Proc. Natl. Acad. Sci. USA 23: 133
(1937). In all animal
models tested, mutations in the Notch receptor result in developmental
abnormalities. In C.
elegans, Notch is required for germ line stem cell self-renewal. Berry et al.,
Development 124(4):
925-36 (1997). In rats, Notch regulates neural crest stem cell
differentiation. Morrison et al., Cell
101(5): 499-510 (2000). Transient Notch activation initiates an irreversible
switch from
neurogenesis to gliogenesis by neural crest stem cells.
[58] Because neighboring cells can express Notch receptors and ligands, one
cell can affect
the fate of a neighboring cell by activating Notch signaling in the
neighboring cell.
[59] Proteins with knife-edge names such as Jagged (Shimizu et al., Journal of
Biological
Chemistry 274(46) 32961-9 (1999); Jarriault et al., Molecular and Cellular
Biology 18:
7423-7431 (1998)), Serrate, and Delta (and variants of each, such as Deltal,
Delta2, Delta3,
Delta4, and Jagged2, LAG-2 and APX-1 in C. elegans), bind to the Notch
receptor and activate a
downstream signaling pathway that prevents neighboring cells from becoming
neural
progenitors. A recently identified ligand is D114, a Notch ligand of the Delta
family expressed in
arterial endothelium. Shutter et al., Genes Dev 14(11): 1313-8 (2000)).
[60] Notch ligands may bind and activate Notch family receptors promiscuously.
The
expression of other genes, like Fringe family members (Panin et al, Nature
387(6636): 908-912
(1997)), may modify the interactions of Notch receptors with Notch ligands.
Numb family
members may also modify Notch signaling intracellularly.
[61] Ligand binding to Notch results in activation of a presenilin-l-dependent
gamma-secretase-like protein that cleaves Notch. De Strooper et al., Nature
398: 518-522
(1999), Mumm et al., Molecular Cell. 5: 197-206 (2000). Cleavage in the
extracellular region
may involve a furin-like convertase. Logeat et al., Proceedings of the
National Academy of
Sciences of the USA 95: 8108-8112 (1998). The intracellular domain is released
and
CA 02417909 2003-01-31
WO 02/12447 PCT/US01/24243
17
transactivates genes by associating with the DNA binding protein RBP-J. Kato
et al.,
Development 124: 4133-4141 (1997)). Notch 1, Notch 2 and Notch 4 are thought
to transactivate
genes such as members of the Enhancer of Split (HES) family, while Notch 3
signaling may be
inhibitory. Beatus et al., Development 126: 3925-3935 (1999). Finally,
secreted proteins in the
Fringe family bind to the Notch receptors and modify their function. Zhang &
Gridley, Nature
394 (1998).
[62] In mammals, there are four known Notch family members. Notch 4 is the
human ortholog
of the mouse int-3 oncogene that plays a role in breast cancer in mice.
Gallahan et al., Cancer
Res. 56(8): 1775-85 (1996); Uyttendaele et al., Development 2122: 251 (1996);
Imatani &
Callahan, Oncogene 19(2): 223-31(2000)).
[63] The invention is based upon the discovery that Notch 4 plays a role both
in normal
human breast development and in tumorigenesis. Within an individual tumor,
only a small
subpopulation of tumorigenic cells expresses high levels of Notch 4. An
antibody that
recognizes Notch 4 blocks the growth of breast cancer tumor cells in vitro and
in vivo (see,
EXAMPLES 2, 5, 12 and 15). In one embodiment, the antibody binds to the
extracellular
domain of Notch 4. In a particular embodiment, the antibody binds to the
polypeptide region
LLCVSVVRPRGLLCGSFPE
(LeuLeuCysValSerValValArgProArgGlyLeuLeuCysGlySerPheProGlu) (SEQ ID NO:1).
However, any anti-Notch 4 antibody that inhibits Notch activation can be used
to impair tumor
survival.
[64] Inhibitors of Notch signaling (such as Numb and Numb-like; or antibodies
or small
molecules that block Notch activation) can be used in the methods of the
invention to inhibit
solid tumor stem cells. In this manner, the Notch pathway is modified to kill
or inhibit the
proliferation of solid tumor stem cells.
[65] By contrast, it had previously been found that stimulation of Notch using
soluble Delta
(Han et al., Blood 95(5): 161625 (2000)), a Notch ligand, promoted growth and
survival of
tumor cells in vitro. Thus, it had previously been found that stimulation of
the Notch pathway
promotes growth and survival of the cancer cells.
[66] The invention differs from the manipulation of non-terminally
differentiated cells using
the Notch pathway provided in U.S. Pat. No. 5,780,300. U.S. Pat. No. 5,780,300
addresses the
modification of normal cells, not cancer cells. That patent is directed to
methods for the
expansion of non-terminally differentiated cells (normal precursor cells)
using agonists of Notch
function, by inhibiting the differentiation of the cells without inhibiting
proliferation (mitotic
activity) such that an expanded population of non-terminally differentiated
cells is obtained.
CA 02417909 2003-01-31
WO 02/12447 PCT/US01/24243
18
These expanded cells can be used in cell replacement therapy, a use that is
incompatible with the
goal of killing or inhibiting the proliferation of solid tumor stem cells by
modifying Notch
signaling in this invention.
[67] Therapeutic aspects of the invention. A corollary to the solid tumor stem
cell model of
the invention is that, to effectively treat cancer and achieve higher cure
rates, anti-cancer
therapies must be directed against solid tumor stem cells. Since current
therapies are directed
against the bulk population, they may be ineffective at eradicating solid
tumor stem cells. The
limitations of current cancer therapies derive from their inability to
effectively kill solid tumor
stem cells. The identification of solid tumor stem cells permits the specific
targeting of
therapeutic agents to this cell population, resulting in more effective cancer
treatments. This
concept would fundamentally change our approach to cancer treatment.
[68] Advances in modern biotechnology have facilitated the identification of
new therapeutic
targets for cancer treatment. Advances in genomics have made it possible to
sequence and
identify the 10,000 to 30,000 genes that are expressed in individual cell
types. The human
genome has been sequenced. This has resulted in the identification of new
proteins involved in a
myriad of biological processes such as proliferation, cell death and
immortalization, providing
targets for drug intervention. Although genomics provides a powerful means for
identifying drug
targets in cancer cells, these targets are only valid if the targets are
present within the
tumorigenic cell population. To be effective, genomics must be focused on
individual
populations within the heterogeneous cells that compose a tumor that are
responsible for
tumorigenic growth. In solid tumors, these are the solid tumor stem cells.
Additionally, genomics
has not yet been used to identify genes expressed in purified cell populations
derived from
cancerous tissues.
[69] One of the major problems in identifying new cancer therapeutic agents is
determining
which of the myriad of genes identified in large scale sequencing projects are
the most clinically
important drug targets. This is made especially difficult since solid tumors
consist of a mixture of
a many types of normal cells and a heterogeneous population of tumor cells.
One way to reduce
the complexity is to make cDNA after microdissection of solid tumors to enrich
for tumor cells
(see, below). This technique is based on the assumption that the pathologist
dissecting out the
tumor cells can predict which cells are tumorigenic based upon appearance.
However, cells can
be morphologically similar and yet remain functionally heterogeneous.
Moreover, cells obtained
by microdissection are not viable and therefore the functional properties of
such cells cannot be
tested or verified.
[70] Instead, by the methods of the invention, one can use flow cytometry
(such as FACS) and
CA 02417909 2003-01-31
WO 02/12447 PCT/US01/24243
19
the xenograft animal model of the invention to enrich for specific cell
populations. This
technique has the advantage of being able to simultaneously isolate
phenotypically pure
populations of viable normal and tumor cells for molecular analysis. Thus,
flow cytometry
allows us to test the functions of the cell populations and use them in
biological assays in
addition to studying their gene expression profiles. Furthermore, such cells
can also be
characterized in biological assays. For example, mesenchymal (stromal) cells
can be analyzed for
production of growth factors, matrix proteins and proteases, endothelial cells
can be analyzed for
production of specific factors involved in solid tumor growth support (such as
neo-vascularization), and different subsets of tumor cells from a solid tumor
can be isolated and
analyzed for tumorigenicity, drug resistance and metastatic potential.
[71] "Enriched", as in an enriched population of cells, can be defined based
upon the increased
number of cells having a particular marker in a fractionated set of cells as
compared with the
number of cells having the marker in the unfractionated set of cells. However,
the term "enriched
can be preferably defined by tumorigenic function as the minimum number of
cells that form
tumors at limit dilution frequency in test mice. Thus, if 500 tumor stem cells
form tumors in
63% of test animals, but 5000 unfractionated tumor cells are required to form
tumors in 63% of
test animals, then the solid tumor stem cell population is 10-fold enriched
for tumorigenic
activity (see, EXAMPLES). The solid tumor stem cell model (FIG. 1A) provides
the linkage
between these two definitions of (phenotypic and functional) enrichment.
[72] FACS methods using CD44 alone can enrich solid tumor stem cells at least
2-fold (see,
EXAMPLE 1 and 3). FACS methods using B38.1 and CD24 can enrich for solid tumor
stem
cells 5-6 fold (see, EXAMPLE 3). Enrichment using additional markers can
enrich 10-fold or
more and can be used to isolate solid tumor stem cells.
[73] "Isolated" refers to a cell that is removed from its natural environment
(such as in a solid
tumor) and that is isolated or separated, and is at least about 75% free, and
most preferably about
90% free, from other cells with which it is naturally present, but which lack
the marker based on
which the cells were isolated.
[74] Purification (enrichment or isolation) of subsets of cancer cells from a
solid tumor allows
one of skill in the art of oncology to distinguish between classic models of
cancers and the solid
tumor stem cell model (FIG. 1). If indeed a minority of solid tumor cells has
stem cell properties,
then to efficiently identify the genes necessary for tumor proliferation and
drug resistance, the
genomics must be focused on the stem cell population. If however, the genomics
is targeted to
the bulk population rather than the solid tumor stem cells, then the most
promising drug targets
are obscured or lost in a sea of other genes expressed by the other cells
within a tumor that do not
CA 02417909 2003-01-31
WO 02/12447 PCT/US01/24243
have the capacity for extensive proliferation.
[75] In some of the EXAMPLES, we focused on the tumorigenic cells from breast
cancer.
Focusing on the individual populations of cells within a solid tumor provides
a clearer
understanding of how to focus new cancer treatments and identify novel targets
for drug
discovery. In addition, purifying solid tumor stem (such as breast cancer
tumorigenic) cells
provides a material for screening for drug sensitivity and identifying markers
that predict
tumorigenicity or metastatic potential.
[76] In vivo proliferation of solid tumor stem cells. The in vivo
proliferation of solid tumor
stem cells can be accomplished by injection of solid tumor stem cells into
animals, preferably
mammals, more preferably in rodents such as mice (due to the predictable
methods that have
been developed in the art for injection into laboratory rodents), and most
preferably into
immunocompromised mice, such as SCID mice, Beige/SCID mice or NOD/SCID mice
(see,
EXAMPLES). NOD/SCID mice are injected with the varying number of cells and
observed for
tumor formation. The injection can be by any method known in the art,
following the enrichment
of the injected population of cells for solid tumor stem cells.
[77] In one particular embodiment, to establish human breast cancer tumors in
the NOD/SCID
mouse model, eight week old female NOD-SCID mice were anesthetized by an
intraperitoneal
injection of 0.2 ml Ketamin.e/Xylazine (300 mg Ketamine combined with 20 mg
Xylazine in a 4
ml volume. Then, 0.02 ml of the solution was diluted in HBSS is used per 20 g
mouse. Mice
were then treated with VP-16 (etoposide) via an intraperitoneal injection (30
mg etoposide per 1
kg, diluted in serum-free HBSS for a final injection volume of 0.2 m1). At the
same time,
estrogen pellets were placed subcutanously on the back of the necks of the
mice using a trocar.
The mice were then warmed and placed back in to the cages after they awoke.
All tumor
injections/implantations were done 3-5 days after this procedure.
[78] For the implantation of fresh specimens, samples of human breast tumors
were received
within an hour after the surgeries. These tumors were cut up with scissors
into small pieces, and
the pieces were then minced with a blade to yield 2x2 mm-size pieces. Mincing
was done in
sterile RPMI 1640 medium supplemented with 20% Fetal Bovine Serum under
sterile conditions
on ice. The tumor pieces were then washed with serum free HBSS right before
implantation. A
2-mm incision was then made in the mid abdomen area, and using a trocar, one
to two small
tumor pieces were implanted onto the upper right and upper left mammary fat
pats (right below
the second nipple on both sides). A 6-0 suture was wrapped twice around the
MFP-Nipple
allowing it to hold the implanted pieces in place. Sutures were removed 5 days
later. Nexaban
was used to seal the incision and mice were weekly monitored from tumor
growth.
CA 02417909 2003-01-31
WO 02/12447 PCT/US01/24243
21
[79] For the injection of the pleural effusions or dissociated solid tumor
cells, cells were
received shortly after surgery and washed with HBSS serum-free. Cells were
then suspended in
serum free-RPMI/Matrigel mixture (1:1 volume) and then injected into the upper
right and left
mammary pads using an 18G needle. To do this, the desired number of cells were
suspended in
0.2 ml and injected. The site of the needle injection was sealed with Nexaban
to prevent any cell
leakage.
[80] For the injection of digested tumor cells, tumors from a patient (solid
tumors) or grown in
mice (by the methods of the invention) were cut up into small pieces and then
minced completely
using sterile blades. The resulting pieces were then mixed with ultra-pure
Collagenase III in
HBSS solution (200-250 U collagenase/ml) and allowed to incubate at 37C for 3-
4 hr, pipetting
with a 10 ml pipette is done every 15-20 minutes. At the end of the
incubation, cells were
filtered through a 45-micron nylon mesh and washed with RPMI-20%FBS, then
washed with
HBSS twice. Cells to be injected were then suspended in HBSS/Matrigel mix (1:1
volume) and
injected into the mammalian fat pad or subcutaneously as described above.
Nexaban can be used
to seal the injection site.
[81] For analysis of the xenotransplant tumor, a solid tumor is removed from
the mice and
made into a single cell suspension. Cells are stained and analyzed by flow
cytometry (FACS)
using methods known to those skilled in the art (Morrison & Weissman, Immunity
1(8): 661-73
(1994)). The phenotype of tumorigenic cells is CD44+CD2441 in all tumors, and
B38.1+CD44+CD2441 in most tumors. We then do limiting dilution analysis of
cells isolated by
FACS based upon expression of these markers. Next, we further purify the
breast cancer stem
cell. Cells are stained with 7AAD (which stains dead cells), anti H2K-PE
(which stains mouse
cells), and combinations of antibodies against various markers that have
heterogeneous
expression patterns by the cancer cells including anti-B38.1, -annexin V, -
Notch 4, -CD9,
-CD24, -MUC1, -CD49F, -CD62P, -P-glycoprotein, -Notch 1, -520C9, -260F9 and -
317G5.
FACS is used to isolate viable human cells that either do or do not express
one of the
differentially expressed antigens. A combination of markers allows the
greatest enrichment of
tumorigenic cells. For the limiting dilution assays, one hundred, one
thousand, ten thousand and
one hundred thousand cells of each population are analyzed in vivo.
[82] SCID mice, NOD/SCID mice or Beige/SCID mice are injected with the varying
number
of cells and observed for tumors. Any tumors that form are removed for
pathologic examination
and FACS analysis. The tests are repeated (for example, about ten times) to
confirm the results.
The phenotypes of the tumorigenic cells are thus determined.
[83] Other general techniques for formulation and injection of cells may be
found in
CA 02417909 2003-01-31
WO 02/12447 PCT/US01/24243
22
Remington's Pharmaceutical Sciences, 20th ed. (Mack Publishing Co., Easton,
PA). Suitable
routes may include parenteral delivery, including intramuscular, subcutaneous
(see, above),
intramedullary injections, as well as intrathecal, direct intraventricular,
intravenous,
intraperitoneal, intranasal, or intraocular injections, just to name a few.
For injection, the agents
of the invention may be formulated in aqueous solutions, preferably in
physiologically
compatible buffers such as Hanks's solution, Ringer's solution, or
physiological saline buffer. For
such transmucosal administration, penetrants appropriate to the barrier to be
permeated are used
in the formulation. Such penetrants are generally known in the art.
[84] By the use of populations of cells enriched for solid tumor stem cells,
the invention is an
improvement over the methods of Mueller & Reisfeld, Cancer Metastasis Rev. 10:
193-200
(1991) (who used the SCID mouse, which allows disseminated growths for a
number of human
tumors, particularly hematologic disorders and malignant melanoma) and
Sakakibara et al.,
Cancer J Sci. Am. 2: 291-300 (1996) (who studied the growth and metastatic
potential of
surgical specimens of breast carcinomas engrafted into the large abdominal
(gonadal) fat pad of
severe combined immunodeficient (SCID) mice). Sakakibara et al. observed that
placement of
human breast tumors within the gonadal fat pad could result in tumors that
grew either rapidly,
slowly, or not at all. Of 48 tumors studied, 12 (25%), including one of the
three lymph
node-derived tumors, grew rapidly enough within some or all of the implanted
mice (L e., the
tumors reached a diameter of 2-3 cm within 2-6 months) to allow repeated
passage.
[85] By contrast, the injection of solid tumor stem cells can consistently
result in the
successful establishment of tumors, more than 75% of the time, preferably more
than 80% of the
time, more preferably more than 85%, more than 90%, or more than 95% of the
time. We have
achieved 100% successful establishment of tumors from the five tumors tested,
as well as from
three pleural efflusions (see, EXAMPLES). Moreover, the invention provides for
the
advantageous establishment of solid tumors (particularly tumors from breast
tumor stem cells) in
mammary fat pads, an area not accessable for establishment using the methods
of Sakakibara et
al., Cancer J. 2: 291-300 (1996).
[86] In vitro proliferation of solid tumor stem cells. Cells can be obtained
from solid tumor
tissue by dissociation of individual cells. Tissue from a particular tumor is
removed using a
sterile procedure, and the cells are dissociated using any method known in the
art (see, Sambrook
et al., Molecular Cloning: A Laboratory Manual (Cold Spring Harbor Press, Cold
Spring
Harbor, New York, 1989); Current Protocols in Molecular Biology, Ausubel et
al., eds., (Wiley
Interscience, New York, 1993), and Molecular Biology LabFax, Brown, ed.
(Academic Press,
1991)), including treatment with enzymes such as trypsin, collagenase and the
like, or by using
CA 02417909 2010-11-01
23
physical methods of dissociation such as with a blunt instrument. Methods of
dissociation are
optimized by testing different concentrations of enzymes and for different
periods of time, to
maximize cell viability, retention of cell surface markers, and the ability to
survive in culture
(Worthington Enzyme Manual, Von Worthington, ed. (Worthington Biochemical
Corporation,
2000). Dissociated cells are centrifuged at low speed, between 200 and 2000
rpm, usually about
1000 rpm (210 g), and then resuspended in culture medium. For guidance to
methods for cell
culture, see Spector et al., Cells: A Laboratory Manual (Cold Spring Harbor
Press, Cold Spring
Harbor, New York, 1998).
[87] The dissociated tumor cells can be placed into any known culture medium
capable of
supporting cell growth, including HEM, DMEM, RPMI, F-12, and the like,
containing
supplements which are required for cellular metabolism such as glutamine and
other amino
acids, vitamins, minerals and useful proteins such as transferrin and the
like. Medium may also
contain antibiotics to prevent contamination with yeast, bacteria and fungi
such as penicillin,
streptomycin, gentamicin and the like. In some cases, the medium may contain
serum derived
from bovine, equine, chicken and the like. However, a preferred embodiment for
proliferation of
solid tumor stem cells is to use a defined, low-serum culture medium. A
preferred culture
medium for solid tumor stem cells is a defined culture medium comprising a
mixture of Ham's
F12, 2% fetal calf serum, and a defined hormone and salt mixture, either
insulin, transferrin, and
selenium or B27 supplement. Brewer et al., J. Neuroscience Res. 35: 567
(1993).
[88] The culture medium can be a chemically defined medium that is
supplemented with fetal
bovine serum or chick embryo extract (CEE) as a source of mitogens and
survival factors to
allow the growth of tumor stem cells in culture. Other serum-free culture
medium containing one
or more predetermined growth factors effective for inducing stem cell
proliferation, such as N2
supplement or B27 supplement, known to those of skill in the art can be used
to isolate and
propagate solid tumor stem cells from other bird and mammalian species, such
as human. See,
U.S. Pat. Nos. 5,750,376, 5,851,832, and 5,753,506; Atlas et al., Handbook of
Microbiological
Media (CRC Press, Boca, Raton, Louisiana, 1993); Freshney, Cutler on Animal
Cells, A Manual
of Basic Technique, 3d Edition (Wiley-Liss, New York, 1994).
[89] The culture medium for the proliferation of solid tumor stem cells thus
supports the
growth of solid tumor stem cells and the proliferated progeny. The
"proliferated progeny" are
undifferentiated tumor cells, including solid tumor stem cells, since solid
tumor stein cells have a
capability for extensive proliferation in culture.
CA 02417909 2003-01-31
WO 02/12447 PCT/US01/24243
24
[90] Conditions for culturing should be close to physiological conditions. The
pH of the
culture medium should be close to physiological pH, preferably between pH 6-8,
more
preferably between about pH 7 to 7.8, with pH 7.4 being most preferred.
Physiological
temperatures range between about 30 C to 40 C. Cells are preferably cultured
at temperatures
between about 32 C to about 38 C, and more preferably between about 35 C to
about 37 C.
Similarly, cells may be cultured in levels of 02 that are comparatively
reduced relative to 02
concentrations in air, such that the 02 concentration is comparable to
physiological levels
(1-6%), rather than 20% 02 in air.
[91] A particular patient's solid tumor stem cells, once they have been
proliferated in vitro,
can be analyzed and screened. Solid tumor stem cell proliferated in vitro can
also be genetically
modified using techniques known in the art (see, below; see also, Sambrook et
al., Molecular
Cloning: A Laboratory Manual (Cold Spring Harbor Press, Cold Spring Harbor,
New York,
1989); Current Protocols in Molecular Biology, Ausubel et al., eds., (Wiley
Interscience, New
York, 1993)). The in vitro genetic modification may be more desirable in
certain circumstances
than in vivo genetic modification techniques when more control over the
infection with the
genetic material is required.
[92] Solid tumor stem cells and stem cell progeny can be cryopreserved until
they are needed
by any method known in the art. The cells can be suspended in an isotonic
solution, preferably a
cell culture medium, containing a particular cryopreservant. Such
cryopreservants include
dimethyl sulfoxide (DMSO), glycerol and the like. These cryopreservants are
used at a
concentration of 5-15%, preferably 8-10%. Cells are frozen gradually to a
temperature of -10 C
to -150 C, preferably -20 C to -100 C, and more preferably -150 C.
[93] Additional guidance for the in vitro culture of solid tumor stem cells is
provided in
EXAMPLE 9 and FIG. 9.
[94] Genetic modification of solid tumor stem cells and solid tumor stem cell
progeny. In the
undifferentiated state, the solid tumor stem cells rapidly divide and are
therefore excellent targets
for genetic modification. The term "genetic modification" as used herein
refers to the stable or
transient alteration of the genotype of a precursor cell by intentional
introduction of exogenous
DNA. DNA may be synthetic, or naturally derived, and may contain genes,
portions of genes, or
other useful DNA sequences. The term "genetic modification" as used herein is
not meant to
include naturally occurring alterations such as that which occurs through
natural viral activity,
natural genetic recombination, or the like. General methods for the genetic
modification of
eukaryotic cells are known in the art. See, Sambrook et al., Molecular
Cloning: A Laboratory
Manual (Cold Spring Harbor Press, Cold Spring Harbor, New York, 1989); Current
Protocols in
CA 02417909 2003-01-31
WO 02/12447 PCT/US01/24243
Molecular Biology, Ausubel et al., eds., (Wiley Interscience, New York,
1993)).
[95] Many methods for introducing vectors into cells or tissues are available
and equally
suitable for use with solid tumor stem cells in vivo, in vitro, and ex vivo.
Vectors may be
introduced into hematopoietic stem cells taken from the patient and clonally
propagated. By the
method of the invention, such methods are extended to solid tumor stem cells.
[96] "Transformation," or "genetically modified" as defined herein, describes
a process by
which exogenous DNA enters and changes a recipient cell. Transformation may
occur under
natural or artificial conditions according to various methods well known in
the art, and may rely
on any known method for the insertion of foreign nucleic acid sequences into a
prokaryotic or
eukaryotic host cell. The method for transformation is selected based on the
type of host cell
being transformed and may include, but is not limited to, viral infection,
electroporation, heat
shock, lipofection, and particle bombardment. The term "transformed" cells
includes stably
transformed cells in which the inserted DNA is capable of replication either
as an autonomously
replicating plasmid or as part of the host chromosome, as well as transiently
transformed cells
which express the inserted DNA or RNA for limited periods of time.
[97] Genetic manipulation of primary tumor cells has been described previously
by Patel et
al., Human Gene Therapy 5: 577-584 (1994). Genetic modification of a cell may
be
accomplished using one or more techniques well known in the gene therapy
field. Mulligan RC,
Human Gene Therapy 5: 543-563 (1993). Viral transduction methods may comprise
the use of a
recombinant DNA or an RNA virus comprising a nucleic acid sequence that drives
or inhibits
expression of a protein to infect a target cell. A suitable DNA virus for use
in the present
invention includes but is not limited to an adenovirus (Ad), adeno-associated
virus (AAV),
herpes virus, vaccinia virus or a polio virus. A suitable RNA virus for use in
the present
invention includes but is not limited to a retrovirus or Sindbis virus.
Several such DNA and RNA
viruses exist that may be suitable for use in the present invention.
[98] Adenoviral vectors have proven especially useful for gene transfer into
eukaryotic cells
for vaccine development (Graham FL & Prevec L, In Vaccines: New Approaches to
Immunological Problems, Ellis RV ed., 363-390 (Butterworth-Heinemann, Boston,
1992).
[99] Specific guidance for the genetic modification of solid tumor stem cells
is provides in
EXAMPLE 13 and in FIGS. 15-18.
[100] "Non-viral" delivery techniques that have been used or proposed for gene
therapy include
DNA-ligand complexes, adenovirus-ligand-DNA complexes, direct injection of
DNA, CaPO4
precipitation, gene gun techniques, electroporation, and lipofection. Mulligan
RC, Science 260:
926-932 (1993). Any of these methods are widely available to one skilled in
the art and would be
CA 02417909 2003-01-31
WO 02/12447 PCT/US01/24243
26
suitable for use in the present invention. Other suitable methods are
available to one skilled in
the art, and it is to be understood that the present invention may be
accomplished using any of
the available methods of transfection. Lipofection may be accomplished by
encapsulating an
isolated DNA molecule within a liposoma1 particle and contacting the liposomal
particle with the
cell membrane of the target cell. Liposomes are self-assembling, colloidal
particles in which a
lipid bilayer, composed of amphiphilic molecules such as phosphatidyl serine
or phosphatidyl
choline, encapsulates a portion of the surrounding media such that the lipid
bilayer surrounds a
hydrophilic interior. Unilammellar or multilammellar liposomes can be
constructed such that the
interior contains a desired chemical, drug, or, as in the instant invention,
an isolated DNA
molecule. Delivery by transfection, by liposome injections, or by polycationic
amino polymers
may be achieved using methods which are well known in the art (see, e.g.,
Goldman, C. K. et al.
Nature Biotechnology 15:462-466 (1997)).
[101] Two types of modified solid tumor stem cells of particular interest are
deletion mutants
and over-expression mutants. Deletion mutants are wild-type cells that have
been modified
genetically so that a single gene, usually a protein-coding gene, is
substantially deleted. Deletion
mutants also include mutants in which a gene has been disrupted so that
usually no detectable
mRNA or bioactive protein is expressed from the gene, even though some portion
of the genetic
material may be present. In addition, in some embodiments, mutants with a
deletion or mutation
that removes or inactivates one activity of a protein (often corresponding to
a protein domain)
that has two or more activities, are used and are encompassed in the term
"deletion mutants."
Over-expression mutants are wild-type cells that are modified genetically so
that at least one
gene, most often only one, in the modified solid tumor stem cell is expressed
at a higher level as
compared to a cell in which the gene is not modified.
[102] Genetically modified solid tumor stem cells can be subjected to tissue
culture protocols
known in the art (see, U.S. Pat. Nos. 5,750,376 and 5,851,832, Spector et al.,
Cells: A
Laboratory Manual (Cold Spring Harbor Press, Cold Spring Harbor, New York,
1998)). Tumor
stem cells can be genetically modified in culture to promote differentiation,
cell death, or
immunogenicity. For example, tumor stem cells can be modified to enhance
expression of
products that direct an immune response against the patient's solid tumor.
Alternatively, the solid
tumor stem cells can be subjected to various proliferation protocols in vitro
prior to genetic
modification. The protocol used depends upon the type of genetically modified
solid tumor stem
cell or solid tumor stem cell progeny desired. Once the cells have been
subjected to the
differentiation protocol, they are again assayed for expression of the desired
protein. Cells
having the desired phenotype can be isolated and implanted into recipients in
need of the protein
CA 02417909 2003-01-31
WO 02/12447 PCT/US01/24243
27
or biologically active molecule that is expressed by the genetically modified
cell. Such molecules
can enhance tumor regression or inhibit tumor spread.
[103] In vitro models of solid tumor development, in vivo models, and methods
for screening
effects of drugs on solid tumor stem cells. Solid tumor stem cells and solid
tumor stem cell
progeny cultured in vitro (see, EXAMPLE 9) or in vivo (in the xenograft model
of the invention)
can be used for the screening of potential therapeutic compositions. These
compositions for the
treatment of solid tumors can be applied to these cells in culture at varying
dosages, and the
response of these cells monitored for various time periods. Physical
characteristics of these cells
can be analyzed by observing cells by microscopy. The induction of expression
of new or
increased levels of proteins such as enzymes, receptors and other cell surface
molecules can be
analyzed with any technique known in the art see, Clarke et al., Proc. Natl.
Acad. Sc!. USA 92:
11024-11028 (1995)) which can identify the alteration of the level of such
molecules. These
techniques include immunohistochemistry, using antibodies (see, EXAMPLES)
against such
molecules, or biochemical analysis. Such biochemical analysis includes protein
assays,
enzymatic assays, receptor binding assays, enzyme-linked immunosorbant assays
(ELISA),
electrophoretic analysis, analysis with high performance liquid chromatography
(HPLC),
Western blots, and radioimmune assays (RIA). Nucleic acid analysis such as
Northern blots can
be used to examine the levels of mRNA coding for these molecules or PCR (see,
EXAMPLE
14).
[104] Alternatively, such cells treated with these pharmaceutical compositions
can be
transplanted into an animal (such as in the xenograft model of the invention),
and their survival,
ability to form tumors, and biochemical and immunological characteristics
examined.
[105] The solid stem cells and solid stem cell progeny of the invention can be
used in methods
of determining the effect of a biological agents on solid tumor cells. The
term "biological agent"
or "test compound" refers to any agent (including a virus, protein, peptide,
amino acid, lipid,
carbohydrate, nucleic acid, nucleotide, drug, antibody, prodrug or other
substance) that may have
an effect on tumor cells whether such effect is harmful, beneficial, or
otherwise.
[106] To determine the effect of a potential test compound on solid tumor stem
cells, a culture
of precursor cells derived from tumor stem cells can be obtained from tissue
of a subject, such as
a patient with a tumor or other cancerous disease, such as an epithelial
cancer or breast cancer.
Once the solid tumor stem cells or other desired populations of cells are
obtained from the
subject, the cells are cultured in vitro. The choice of culture depends upon
the particular test
compound being tested and the diagnostic effects that the laboratory personnel
want to achieve.
[107] The ability of various biological agents to increase, decrease, or
modify in some other
CA 02417909 2003-01-31
WO 02/12447 PCT/US01/24243
28
way the number and nature of the solid tumor stem cells and solid tumor stem
cell progeny can
be screened. For example, it is possible to screen for test compounds that
decrease the
proliferative ability of the solid tumor stem cells, which would be useful for
identifying
anti-cancer therapeutic agents. In these assays, the relevant cells are
cultured in the presence of
the test compounds of interest and assayed for the degree of proliferation or
cell death that
occurs.
[108] The effects of a test compound or combination of test compounds on the
extensive
proliferation of solid tumor stem cells and their progeny can be determined.
It is possible to
screen non-tumorigenic solid tumor cells that have already been induced to
lose the ability to
extensively proliferate before the screening. It is also possible to determine
the effects of the test
compounds on the proliferation process by applying them to solid tumor stem
cells. Generally,
the test compound is solubilized and added to the culture medium or to the
mouse in the in vivo
assay at varying concentrations to determine the effect of the test compounds
or agent at each
dose. The culture medium may be replenished with the test compound or
biological agent every
couple of days in amounts so as to keep the concentration of the agent
somewhat constant.
Similarly, the test compound can be re-administered to the mouse at different
intervals to assess
the effect of the compound over time.
[109] Changes in proliferation are observed by an increase or decrease in the
number of cells
that form or an increase or decrease in the size of the foci in vitro, or
tumor size in vivo (which is
a reflection of the rate of proliferation and the rate of cell death--
determined by the numbers of
cells per foci or tumor size in the mouse). The effect of the test compound on
tumor stem cells
are measured by determining the number of tumor stem cells that persist in
culture or in the
tumors in vivo after treatment with the test compound. In addition to
determining the number of
tumor stem cells, the effects of the test compound on tumor stem cell cell-
cycle status, and
marker expression are also determined by flow-cytometry.
[110] The test compounds or biological agents added to the culture medium or
injected into the
mouse can be at a final concentration in the range of about 10 pg/m1 to 1
lag/ml, preferably about
1 ng/ml (or 1 ng/cc of blood) to 100 ng/ml (or 100 ng/cc of blood).
[111] The effects of the test compounds or biological agents are identified on
the basis of
significant difference relative to control cultures with respect to criteria
such as the ratios of
expressed phenotypes, cell viability, proliferation rate, number of tumor stem
cells, tumor stem
cell activity upon transplantation in vivo, tumor stem cell activity upon
transplantation in culture,
cell cycle distribution of tumor cells, and alterations in gene expression.
[112] Therapeutic compositions and methods. A pharmaceutical composition
containing a
CA 02417909 2003-01-31
WO 02/12447 PCT/US01/24243
29
Notch ligand, an anti-Notch antibody, or other therapeutic agent that acts as
an agonist or
antagonist of proteins in the Notch signal transduction/response pathway can
be administered by
any effective method. For example, a physiologically appropriate solution
containing an
effective concentration of anti-Notch therapeutic agent can be administered
topically,
intraocularly, parenterally, orally, intranasally, intravenously,
intramuscularly, subcutaneously or
by any other effective means. In particular, the anti-Notch therapeutic agent
may be directly
injected into a target cancer or tumor tissue by a needle in amounts effective
to treat the tumor
cells of the target tissue. Alternatively, a cancer or tumor present in a body
cavity such as in the
eye, gastrointestinal tract, genitourinary tract (e.g., the urinary bladder),
pulmonary and bronchial
system and the like can receive a physiologically appropriate composition
(e.g., a solution such
as a saline or phosphate buffer, a suspension, or an emulsion, which is
sterile) containing an
effective concentration of anti-Notch therapeutic agent via direct injection
with a needle or via a
catheter or other delivery tube placed into the cancer or tumor afflicted
hollow organ. Any
effective imaging device such as X-ray, sonogram, or fiber-optic visualization
system may be
used to locate the target tissue and guide the needle or catheter tube. In
another alternative, a
physiologically appropriate solution containing an effective concentration of
anti-Notch
therapeutic agent can be administered systemically into the blood circulation
to treat a cancer or
tumor that cannot be directly reached or anatomically isolated.
[113] All such manipulations have in common the goal of placing the anti-Notch
therapeutic
agent in sufficient contact with the target tumor to permit the anti-Notch
therapeutic agent to
contact, transduce or transfect the tumor cells (depending on the nature of
the agent). In one
embodiment, solid tumors present in the epithelial linings of hollow organs
may be treated by
infusing the vector suspension into a hollow fluid filled organ, or by
spraying or misting into a
hollow air filled organ. Thus, the tumor cells (such as a solid tumor stem
cells) may be present in
or among the epithelial tissue in the lining of pulmonary bronchial tree, the
lining of the
gastrointestinal tract, the lining of the female reproductive tract,
genitourinary tract, bladder, the
gall bladder and any other organ tissue accessible to contact with the anti-
Notch therapeutic
agent. In another embodiment, the solid tumor may be located in or on the
lining of the central
nervous system, such as, for example, the spinal cord, spinal roots or brain,
so that anti-Notch
therapeutic agent infused in the cerebrospinal fluid contacts and transduces
the cells of the solid
tumor in that space. (Accordingly, the anti-Notch therapeutic agent can be
modified to cross the
blood brain barrier using method known in the art). One skilled in the art of
oncology can
appreciate that the anti-Notch therapeutic agent can be administered to the
solid tumor by direct
CA 02417909 2003-01-31
WO 02/12447 PCT/US01/24243
injection of the vector suspension into the tumor so that anti-Notch
therapeutic agent contacts
and affects the tumor cells inside the tumor.
[114] One skilled in the art of oncology can understand that the vector is
administered in a
composition comprising the vector together with a carrier or vehicle suitable
for maintaining the
transduction or transfection efficiency of the chosen vector and promoting a
safe infusion. Such a
carrier may be a pH balanced physiological buffer, such as a phosphate,
citrate or bicarbonate
buffers a saline solution, a slow release composition and any other substance
useful for safely
and effectively placing the anti-Notch therapeutic agent in contact with solid
tumor stem cells to
be treated.
[115] In treating a cancer patient who has a solid tumor, a therapeutically
effective amount of
an anti-Notch therapeutic agent is administered. A therapeutically effective
dose refers to that
amount of the compound sufficient to result in amelioration of symptoms or a
prolongation of
survival in a patient. Toxicity and therapeutic efficacy of such compounds can
be determined by
standard pharmaceutical procedures in cell cultures or experimental animals,
e.g., for
determining the LD50 (the dose lethal to 50% of the population) and the ED50
(the dose
therapeutically effective in 50% of the population). The dose ratio between
toxic and therapeutic
effects is the therapeutic index and it can be expressed as the ratio
LD50/ED50. Compounds that
exhibit large therapeutic indices are preferred. The data obtained from these
cell culture assays
and animal studies can be used in formulating a range of dosage for use in
humans. The dosage
of such compounds lies preferably within a range of circulating concentrations
that include the
ED50 with little or no toxicity. The dosage may vary within this range
depending upon the dosage
form employed and the route of administration utilized. For any compound used
in the method of
the invention, the therapeutically effective dose can be estimated initially
from cell culture
assays. A dose may be formulated in animal models to achieve a circulating
plasma
concentration range that includes the IC50 as determined in cell culture. Such
information can be
used to more accurately determine useful doses in humans. Levels in plasma may
be measured,
for example, by high performance liquid chromatography (HPLC).
[116] The exact formulation, route of administration and dosage can be chosen
by the
individual physician in view of the patient's condition (see e.g. Fingl et
al., In The
Pharmacological Basis of Therapeutics, Ch. 1, pg. 1 (1975)). The attending
physician would
know how to and when to terminate, interrupt, or adjust administration due to
toxicity, or to
organ dysfunctions. Conversely, the attending physician would also know to
adjust treatment to
higher levels if the clinical response were not adequate (precluding
toxicity). The magnitude of
an administrated dose in the management of the clinical disorder of interest
can vary with the
CA 02417909 2003-01-31
WO 02/12447 PCT/US01/24243
31
severity of the condition to be treated and the route of administration. See,
Merck Index: An
Encyclopedia of Chemicals, Drugs and Biologicals, 12 Edition (CRC Press 1996);
Physicians'
Desk Reference 55th Edition (2000)). The severity of the condition may, for
example, be
evaluated, in part, by appropriate prognostic evaluation methods. Further, the
dose and perhaps
dose frequency, also vary according to the age, body weight, and response of
the individual
patient. A program comparable to that discussed above may be used in
veterinary medicine.
[117] Depending on the specific conditions being treated, agents may be
formulated and
administered systemically or locally. Techniques for formulation and
administration may be
found in Remington's Pharmaceutical Sciences, 20th ed. (Mack Publishing Co.,
Easton, PA).
Suitable routes may include oral, rectal, transdermal, vaginal, transmucosal,
or intestinal
administration; parenteral delivery, including intramuscular, subcutaneous,
intramedullary
injections, as well as intrathecal, direct intraventricular, intravenous,
intraperitoneal, intranasal,
or intraocular injections, just to name a few.
[118] For injection, the agents of the invention may be formulated in aqueous
solutions,
preferably in physiologically compatible buffers such as Hanks's solution,
Ringer's solution, or
physiological saline buffer. For such transmucosal administration, penetrants
appropriate to the
barrier to be permeated are used in the formulation. Such penetrants are
generally known in the
alt
[119] In addition to the active ingredients, these pharmaceutical compositions
may contain
suitable pharmaceutically acceptable carriers comprising excipients and
auxiliaries, which
facilitate processing of the active compounds into preparations which can be
used
pharmaceutically. The preparations formulated for oral administration may be
in the form of
tablets, capsules, or solutions. The pharmaceutical compositions of the
present invention may be
manufactured in a manner that is itself known, e.g., by means of conventional
mixing,
dissolving, granulating, levigating, emulsifying, encapsulating, entrapping or
lyophilizing
processes. Pharmaceutical formulations for parenteral administration include
aqueous solutions
of the active compounds in water-soluble form. Additionally, suspensions of
the active
compounds may be prepared as appropriate oily injection suspensions. Suitable
lipophilic
solvents or vehicles include fatty oils such as sesame oil, or synthetic fatty
acid esters, such as
ethyl oleate or triglycerides, or liposomes. Aqueous injection suspensions may
contain
substances that increase the viscosity of the suspension, such as sodium
carboxymethyl cellulose,
sorbitol, or dextran. Optionally, the suspension may also contain suitable
stabilizers or agents
that increase the solubility of the compounds to allow for the preparation of
highly concentrated
solutions.
CA 02417909 2003-01-31
WO 02/12447 PCT/US01/24243
32
[120] Polynucleotides and polypeptides obtained from solid tumor stem cells.
"Polynucleotide"
refers to chain of nucleotides, which can be a nucleic acid, nucleic acid
sequence,
oligonucleotide, nucleotide, or any fragment thereof. It may be DNA or RNA of
genomic DNA,
mRNA, cDNA, or synthetic origin, double-stranded or single-stranded, and
combined with
carbohydrate, lipids, protein or other materials to perform a particular
activity or form a useful
composition. "Oligonucleotide" is substantially equivalent to the terms
amplimer, primer,
oligomer, element, and probe. The term "probe" refers to a polynucleotide
sequence capable of
hybridizing with a target sequence to form a polynucleotide probe/target
complex. A "target
polynucleotide" refers to a chain of nucleotides to which a polynucleotide
probe can hybridize by
base pairing. In some instances, the sequences will be complementary (no
mismatches) when
aligned. In other instances, there may be up to a 10% mismatch.
[121] DNA or RNA can be isolated from the sample according to any of a number
of methods
well known to those of skill in the art. For example, methods of purification
of nucleic acids are
described in Tijssen, Laboratory Techniques in Biochemistry and Molecular
Biology:
Hybridization With Nucleic Acid Probes, Part I Theory and Nucleic Acid
Preparation (Elsevier,
New York N.Y, 1993). "Sample" is used in its broadest sense. A sample
containing
polynucleotides or polypeptides can be a bodily fluid; an extract from a cell,
chromosome,
organelle, or membrane isolated from a cell; genomic DNA, RNA, or cDNA in
solution or bound
to a substrate; a cell; a tissue; a tissue print; and the like.
[122] Total RNA can be isolated using the TRIZOL reagent (Life Technologies,
Gaithersburg
MD, USA), and mRNA is isolated using oligo d(T) column chromatography or glass
beads.
Alternatively, when target polynucleotides are derived from an mRNA, the
target
polynucleotides can be a cDNA reverse transcribed from an mRNA, an RNA
transcribed from
that cDNA, a DNA amplified from that cDNA, an RNA transcribed from the
amplified DNA,
and the like. When the target polynucleotide is derived from DNA, the target
polynucleotide can
be DNA amplified from DNA or RNA reverse transcribed from DNA.
[123] Several technologies produce pools of restriction fragments of limited
complexity for
electrophoretic analysis, such as methods combining double restriction enzyme
digestion with
phasing primers (see, e.g., European patent application EP 0 534 858 Al), or
methods selecting
restriction fragments with sites closest to a defined mRNA end (see, e.g.,
Prashar et al., Proc.
Natl. Acad. Sci. USA 93: 659-663 (1996)). Other methods statistically sample
cDNA pools, such
as by sequencing sufficient bases (in each of multiple cDNAs to identify each
cDNA, or by
sequencing short tags which are generated at known positions relative to a
defined mRNA end
(see, e.g., Velculescu, Science 270: 484-487 (1995)).
CA 02417909 2003-01-31
WO 02/12447 PCT/US01/24243
33
[124] Methods of modifying RNA abundances and activities currently fall within
three classes,
ribozymes, antisense species (PCT patent application WO 88/09810), and RNA
aptamers (Good
et al., Gene Therapy 4: 45-54 (1997)). Ribozymes are RNAs which are capable of
catalyzing
RNA cleavage reactions. (PCT patent application WO 90/11364). Ribozyme methods
involve
exposing a cell to, inducing expression in a cell, etc. of such small RNA
ribozyme molecules.
(Grassi & Marini, Annals of Medicine 28: 499-510 (1996); Gibson, Cancer and
Metastasis
Reviews 15: 287-299 (1996)).
[125] The term "antisense," as used herein, refers to any composition
containing a nucleic acid
sequence which is complementary to the "sense" strand of a specific nucleic
acid sequence.
Antisense molecules may be produced by any method including synthesis or
transcription. Once
introduced into a cell, the complementary nucleotides combine with natural
sequences produced
by the cell to form duplexes and to block either transcription or translation.
The designation
"negative" can refer to the antisense strand, and the designation "positive"
can refer to the sense
strand.
[126] Oligonucleotides may be synthesized by standard methods known in the
art, e.g. by use
of an automated DNA synthesizer (such as are commercially available from
Biosearch, Applied
Biosystems, etc.).
[127] "Amplification," as used herein, relates to the production of additional
copies of a nucleic
acid sequence. Amplification is generally carried out using polymerase chain
reaction (PCR)
technologies well known in the art. See, e.g., Dieffenbach CW & Dveksler GS,
PCR Primer, a
Laboratory Manual 1-5(Cold Spring Harbor Press, Plainview, N.Y., 1995).
Amplification can be
polymerase chain reaction (PCR), ligase chain reaction (LCR), nucleic acid
sequence-based
amplification (NASBA), or 17 based RNA amplification.
[128] "Polypeptide" refers to an amino acid, amino acid sequence,
oligopeptide, peptide, or
protein or portions thereof whether naturally occurring or synthetic.
[129] Methods for direct measurement of protein activity are well known to
those of skill in the
art. Such methods include, e.g., methods which depend on having an antibody
ligand for the
protein, such as Western blotting, see, e.g., Burnette, A. Anal. Biochem. 112:
195-203 (1981).
Such methods also include enzymatic activity assays, which are available for
most well-studied
protein drug targets. Detection of proteins can be accomplished by antibodies
(see,
EXAMPLES).
[130] The term "antigenic determinant," as used herein, refers to that
fragment of a molecule
(i.e., an epitope) that makes contact with a particular antibody. When a
protein or a fragment of a
protein is used to immunize a host animal, numerous regions of the protein may
induce the
CA 02417909 2003-01-31
WO 02/12447 PCT/US01/24243
34
production of antibodies which bind specifically to antigenic determinants
(given regions or
three-dimensional structures on the protein). An antigenic determinant may
compete with the
intact antigen (i.e., the immunogen used to elicit the immune response) for
binding to an
antibody.
[131] Proteins isolated from an enriched population of solid tumor stem cells
or isolated solid
tumor cells can be separated by two-dimensional gel electrophoresis systems.
Two-dimensional
gel electrophoresis is well-known in the art and typically involves iso-
electric focusing along a
first dimension followed by SDS-PAGE electrophoresis along a second dimension.
See, e.g.,
Hames et al, Gel Electrophoresis of Proteins: A Practical Approach (IRL Press,
New York
1990); Lander, Science 274:536-539 (1996). The resulting electrophoretograms
can be analyzed
by numerous techniques, including mass spectrometric techniques, western
blotting and
immunoblot analysis using polyclonal and monoclonal antibodies, and internal
and N-terminal
micro-sequencing. Using these techniques, it is possible to identify a
substantial fraction of all
the proteins produced under given physiological conditions, including in cells
(e.g., in solid
tumor stem cells) exposed to a drug, or in cells modified by, e.g., deletion
or over-expression of a
specific gene.
[132] cDNA libraries. The purified solid tumor stem cells, solid tumor stem
cell progeny, non-
tumorigenic cells, and unfractionated tumor cells can be used to make arrays
or cDNA libraries
using methods known in the art (see, Sambrook et al., Molecular Cloning: A
Laboratory Manual
(Cold Spring Harbor Press, Cold Spring Harbor, New York, 1989); Current
Protocols in
Molecular Biology, Ausubel et al., eds., (Wiley Interscience, New York, 1993))
to identify
potential novel drug targets.
[133] Molecular biology comprises a wide variety of techniques for the
analysis of nucleic
acids and proteins, many of which form the basis of clinical diagnostic
assays. These techniques
include nucleic acid hybridization analysis, restriction enzyme analysis,
genetic sequence
analysis, and separation and purification of nucleic acids and proteins
(Sambrook et al.,
Molecular Cloning: A Laboratory Manual, Second Ed. (Cold Spring Harbor
Laboratory Press,
Cold Spring Harbor, New York, 1989). Many molecular biology techniques involve
carrying out
numerous operations on a large number of samples. For guidance to genomics and
other
molecular biological methods useful in the invention, see Birren et al.,
Genome Analysis: A
Laboratory Manual Series, Volume I, Analyzing DNA (Cold Spring Harbor Press,
Cold Spring
Harbor, New York, 1997); Birren et al., Genome Analysis: A Laboratory Manual
Series, Volume
2, Detecting Genes (Cold Spring Harbor Press, Cold Spring Harbor, New York,
1998); Birren et
al., Genome Analysis: A Laboratory Manual Series, Volume 4, Mapping Genomes
(Cold Spring
CA 02417909 2003-01-31
WO 02/12447 PCT/US01/24243
Harbor Press, Cold Spring Harbor, New York, 1999).
[134] Nucleic acid hybridization analysis generally involves the detection of
a very small
numbers of specific target nucleic acids (DNA or RNA) with probes among a
large amount of
non-target nucleic acids. Multiple sample nucleic acid hybridization analysis
has been conducted
on a variety of filter and solid support formats. The "dot blot"
hybridization, involves the
non-covalent attachment of target DNAs to a filter, which are subsequently
hybridized with a
labeled probes. The "dot blot" hybridization has been further developed for
multiple analysis
(European Patent application EP 0 228 075) and for the detection of
overlapping clones and the
construction of genomic maps (U.S. Pat. 5,219,726). Another format, the so-
called "sandwich"
hybridization, involves attaching oligonucleotide probes covalently to a solid
support and using
them to capture and detect multiple nucleic acid targets (U.S. Pat. No.-
4,751,177; PCT
International patent application WO 90/01564). Multiplex versions of these
formats are called
"reverse dot blots".
[135] Methods are known in the art for amplifying signal using sensitive
reporter groups
(enzyme, fluorophores, radioisotopes, etc.) and associated detection systems
(fluorometers,
luminometers, photon counters, scintillation counters, etc.). These methods
can be combined
with amplification methods, such as the polymerase chain reaction (PCR) for
the amplification of
target nucleic acid sequences. See, Innis et al., PCR Protocols: A Guide to
Methods and
Applications, (Academic Press, 1990).
[136] Microarrays. Mimicking the in situ hybridization in some aspects, new
techniques are
being developed for carrying out multiple sample nucleic acid hybridization
analysis on
micro-formatted multiplex or matrix devices (e.g., DNA chips) (see, Barinaga,
Science 253:
1489 (1991); Bains, Bio/Technology 10: 757-758 (1992)). Guidance for the use
of microarrays is
provided by Wang, E et al., Nature Biotechnology 18; 457-459 (2000); Diehn M
et al., Nature
Genetics 25: 58-62 (2000).
[137] Microarrays are known in the art and consist of a surface to which
probes that correspond
in sequence to gene products (e.g., cDNAs, oligonucleotides, mRNAs, cRNAs,
polypeptides, and
fragments thereof), can be specifically hybridized or bound at a known
position. In one
embodiment, the microarray is an array (L e., a matrix) in which each position
represents a
discrete binding site for a product encoded by a gene (e.g., a protein or
RNA), and in which
binding sites are present for products of most or almost all of the genes in
the organism's
genome.
[138] The polynucleotides, polypeptides, or analogues are attached to a solid
support or
substrate, which may be made from glass, plastic (e.g., polypropylene, nylon),
polyacrylamide,
CA 02417909 2010-11-01
36
nitrocellulose, or other materials. "Substrate" refers to any suitable rigid
or semi-rigid support to
which polynucleotides or polypeptides are bound and includes membranes,
filters, chips, slides,
wafers, fibers, magnetic or nonmagnetic beads, gels, capillaries or other
tubing, plates, polymers,
and microparticles with a variety of surface forms including wells, trenches,
pins, channels and
pores. The polynucleotides can be immobilized on a substrate by any method
known in the art.
Preferably, the substrates are optically transparent.
[139] A variety of methods are currently available for making arrays of
biological
macromolecules, such as arrays of nucleic acid molecules or proteins. One
method for making
ordered arrays of DNA on a porous membrane is a "dot blot" or "slot-blot"
method A more
efficient technique employed for making ordered arrays of fragments uses an
array of pins
dipped into the wells, e.g., the 96 wells of a microtiter plate, for
transferring an array of samples
to a substrate, such as a porous membrane. An alternate method of creating
ordered arrays of
nucleic acid sequences is described by U.S. Pat. No. 5,143,854 (to Pirrwag).
and also by Fodor et
al., Science 251:767-773 (1991). The method involves synthesizing different
nucleic acid
sequences at different discrete regions of a support. Khrapko etal., DNA
Sequence 1:375-388
(1991) describes a method of making an oligonucleotide matrix by spotting DNA
onto a thin
layer of polyacrylamide, manually with a micropipette. U.S. Pat. No. 5,807,522
(to Brown et al.),
describes methods for fabricating microarrays of biological samples by
dispensing a known
volume of a reagent at each selected array position, by tapping a capillary
dispenser on the
support under conditions effective to draw a defined volume of liquid onto the
support).
[140] Spotters can use pin, ink-jet, and other technologies to deposit samples
onto the support
material. Several of the more common methods utilize metal pins, which can be
either solid or
split When the pins are dipped into wells that contain the compounds of
interest, each picks up a
small amount of the material. The pin is then brought into contact with the
solid support and a
nanoliter volume is dispensed at the desired location. In split pins
(otherwise known as quills) a
slot cut into the head of the pin functions as a reservoir for the compound
being spotted. Quill
pins are most often used with glass slides, while solid pins are typically
used for spotting
membranes. Amersham PharmaciTamBiotech, GeneMachines, and other companies
offer spotting
robots.
[141] Ink-jet technology provides another method of spotting microarrays.
Adapted from the
printer industry and redesigned for use in biotechnological applications, this
uses piezoelectric
crystal oscillators and an electrode guidance system to deposit the compound
in a precise
CA 02417909 2010-11-01
37
location on the slide or membrane. Companies such as Cartesian Technologies
and ProtoGene
Laboratories use this technology.
[142] A method for attaching the nucleic acids to a surface is by printing on
glass plates, as is
described generally by PCT publication WO 95/35505; DeRisi et al., Nature
Genetics 14:457-
460 (1996); Shalon et aL, Genome Res. 6:639-645 (1996); and Schena et al.,
Proc. Natl. Acad.
Sci. USA 93: 10614-10619 (1995). Another method for making microarrays is by
maldng high-
density oligonucleotide arrays. Techniques are known for producing arrays
containing thousands
of oligonucleotides complementary to defined sequences, at defined locations
on a surface using
photolithographic techniques for synthesis in situ (see, Fodor etal., Science
251:767-773 (1991);
Pease etal., Proc. Natl. Acad. Sci. USA 91:5022-5026 (1994); Lockhart et al.,
Nature Biotech
14:1675 (1996); U.S. Pat. Nos. 5,578,832; 5,556,752; and 5,510,270.
[143] U.S. Pat. No. 6,110,426 (to Shalon et al.) a method and apparatus for
fabricating
microarrays of biological samples for large scale screening assays, such as
arrays of DNA
samples to be used in DNA hybridization assays for genetic research and
diagnostic applications.
U.S. Pat. No. 6,221,674 (to Sluka et al.) discloses a process is described for
applying spatially
defined reagent areas to a solid phase which is characterized in that a liquid
containing an
adsorptive binding reagent is contacted with spatially defined areas of a
solid phase which
comprises an essentially continuous metal or metal oxide surface for an
adequate time period to
enable the formation of adsorptive bonds between the binding reagent and the
solid phase. A
process is described in PCT application WO 92/10092 which can be used to
generate a plurality
of different structures on a glass support by means of photoreactive compounds
and irradiation
using masks. A process is described in U.S. Pat. No. 4,877,745 in which
differently
functionalized spots can be applied to plastic supports by means of ink-jet.
[144] Among the vendors of microarrays and microarray technology useage are
Affymetrix,
Inc. (USA), NimbleGen Systems, Inc. (Madison, Wisconsin, USA), and Incyte
Genomics (USA)
(producing microarrays for core facilities in large industrial and academic
departments); Agilent
Technologies (USA) and Graffinity Pharmaceutical Design, GmbH (Germany) (which
provide
specific services such as printing and fingerprinting arrays designed and used
by individual
researchers); and CLONTEallaboratories (Becton Dickinson Bioscience) and
BioRobotics,
Ltd. (Great Britain) (which provide the basic tools necessary for individual
researchers tb carry
out the entire process of producing microarrays, including printing). See,
Gwynne P & Heebner
0, "DNA Chips and Microarrays" Science (2001).
[145] In contrast to plastic surfaces, metal and metal oxide surfaces have the
advantage that
CA 02417909 2003-01-31
WO 02/12447 PCT/US01/24243
38
they can be coated with an exactly defined matrix layer by self-assembly
techniques. A self-
assembled monolayer (SAM) is formed for example when organic alkylthiols are
adsorbed onto
a gold surface, the spontaneous organisation of such a densely packed
monolayer being based on
strong specific interactions between the support material and the adsorbent.
Nuzzo et al., .1 Am.
Chem. Soc. 105: 4481 (1983). In this manner it is possible to apply an exactly
defined monolayer
of a binding matrix to the surface of metals such as e.g. gold or silver.
Furthermore the specific
binding capability of self-assembled solid phases can be further optimized by
dilution of the
specific solid phase reactants as described in EP-A-0 515 615.
[146] The coating of metal surfaces with microstructures based on self-
assembled monolayers
is also known and can be used to attach components isolated from solid tumor
stem cells.
Whitesides etal., Langmuir 10 (1994) 1498-1511 describe a process in which
reagents are
stamped onto a noble metal surface by means of a special microstructured
silicone stamp. This
enables microstructured monolayers to be generated with zones that are
spatially separated from
one another. Microstructures of self-assembled monolayers on noble metal
surfaces can be
formed by irradiation through masks of substrates whose whole area is covered
with thiols and
subsequent washing. Hemminger etal., Langmuir 10: 626-628 (1994). Spatially
separate zones
are also formed in this process which are all identically functionalized. A
further possibility of
producing reagent spots is firstly to apply gold spots to a support that are
already spatially
separated from one another which are then subsequently coated with reagents.
[147] The binding of analytes to a functionalized solid phase matrix according
to the invention
can for example be detected by confocal scanner fluorescence microscopy or by
plasmon
resonance spectroscopy. Ruthenhausler B etal., Nature, 332: 615-617 (1988).
[148] U.S. Pat. No. 6,228,659 describes an apparatus for producing a plurality
of arrays of
reagent regions is disclosed. A dispensing assembly in the apparatus has a
plurality of heads
which are spaced for depositing reagents at selected positions in different
array areas in a
substrate.
[149] Transcript arrays can be employed for analyzing the transcriptional
state in a cell, and
especially for measuring the transcriptional states of cells exposed to graded
levels of a therapy
of interest such as graded levels of a drug of interest or to graded levels of
a disease state of
interest. In one embodiment, transcript arrays are produced by hybridizing
detectably labeled
polynucleotides representing the mRNA transcripts present in a cell (e.g.,
fluorescently labeled
cDNA synthesized from total cell mRNA) to a microarray. In alternative
embodiments, the
cDNA or RNA probe can be synthesized in the absence of detectable label and
may be labeled
subsequently, e.g., by incorporating biotinylated dNTPs or rNTP, or some
similar means (e.g.,
CA 02417909 2003-01-31
WO 02/12447 PCT/US01/24243
39
photo-cross-linking a psoralen derivative of biotin to RNAs), followed by
addition of labeled
streptavidin (e.g., phycoerythrin-conjugated streptavidin) or the equivalent.
The label for the
probe may be selected from the group consisting of biotin, fluorescent,
radioactive, and
enzymatic labels. When fluorescently-labeled probes are used, many suitable
fluorophores are
known, including fluorescein, lissamine, phycoerythrin, rhodamine (Perkin
Elmer Cetus), Cy2,
Cy3, Cy3.5, Cy5, Cy5.5, Cy7, FluorX (Amersham) and others (see, e.g., Kricka,
Nonisotopic
DNA Probe Techniques (Academic Press San Diego, Calif, 1992). It will be
appreciated that
pairs of fluorophores are chosen that have distinct emission spectra so that
they can be easily
distinguished. In another embodiment, a label other than a fluorescent label
is used. For example,
a radioactive label, or a pair of radioactive labels with distinct emission
spectra, can be used (see
Zhao et al., Gene 156:207 (1995); Pietu et al., Genome Res. 6:492 (1996); see
also, EXAMPLE
21). For example, 32P can be used.
[150] These methods of attaching transcripts usually attach specific
polynucleotide sequences
to very small specific areas of a solid support, such as micro-wells of a DNA
chip. These
hybridization formats are micro-scale versions of the conventional "reverse
dot blot" and
"sandwich" hybridization systems. The micro-formatted hybridization can be
used to carry out
"sequencing by hybridization" (see, Barinaga, Science 253: 1489 (1991); Bains,
Bio/Technology
10: 757-758 (1992). Sequencing by hybridization makes use of all possible n-
nucleotide
oligomers (n-mers) to identify n-mers in an unknown DNA sample, which are
subsequently
aligned by algorithm analysis to produce the DNA sequence (see, U.S. Pat. No.
5,202,231; see
also, United Kingdom patent application GB 8810400 (1988); Southern et al.,
Genomics 13:
1008 (1992); Fodor et al.,Nature 364: 555-556 (1993); Fodor et al., Science
251: 767-773
(1991); U.S. Pat. No. 5,143,854.
[151] Probes can be synthesized, in whole or in part, on the surface of a
substrate using a
chemical coupling procedure and a piezoelectric printing apparatus, such as
that described in
PCT publication WO 95/251116 (Baldeschweiler et al.). Alternatively, the probe
can be
synthesized on a substrate surface using a self-addressable electronic device
that controls when
reagents are added (U.S. Pat. No. 5,605,662).
[152] Furthermore, the probes do not have to be directly bound to the
substrate, but rather can
be bound to the substrate through a linker group. The linker groups are
typically about 6 to 50
atoms long to provide exposure to the attached polynucleotide probe. Preferred
linker groups
include ethylene glycol oligomers, diamines, diacids and the like. Reactive
groups on the
substrate surface react with one of the terminal portions of the linker to
bind the linker to the
substrate. The other terminal portion of the linker is then functionalized for
binding the
CA 02417909 2010-11-01
polynucleotide probe.
[153] Devices and computer systems for forming and using arrays of materials
on a chip or
substrate are known. For example, PCT International patent applications WO
92/10588 and WO
95/11995, describe techniques for sequencing or sequence checking nucleic
acids and other
materials. Arrays for performing these operations can be formed in arrays
according to the
methods of, for example, the pioneering techniques disclosed in U.S. Pat. Nos.
5,445,934,
5,384,261 and 5,571,639.
Improved methods of forming high-density arrays of peptides, polynucleotides,
and other-
polymer sequences in a short period of time have been devised using
combinatorial solid phase
synthesis. Very Large Scale Immobilized Polymer Synthesis (VLSIPS) technology
has greatly
advanced combinatorial solid phase polymer synthesis and paved the way to
clinical application
of deoxyribonucleic acid (DNA) array chips such as those sold under the name
GENECHIPTm
Kozal et al., Nature Medicine 2: 753-759 (1996). VLSIPS technology is
disclosed in U.S. Pat.
No. 5,143,854, PCT International patent applications WO 90/15070), WO
92/10092, and WO
95/11995; and Fodor etal., Science 251: 767-777(1991).
[154] Nucleic acid hybridization and wash conditions are chosen so that the
probe "specifically
binds" or "specifically hybridizes" to a specific array site, i.e., the probe
hybridizes, duplexes or
binds to a sequence array site with a complementary nucleic acid sequence but
does not
hybridize to a site with a non-complementary nucleic acid sequence. As used
herein, one
polynucleotide sequence is considered complementary to another when, if the
shorter of the
polynucleotides is less than or equal to 25 bases, there are no mismatches
using standard base-
pairing rules or, if the shorter of the polynucleotides is longer than 25
bases, there is no more
than a 5% mismatch. Preferably, the polynucleotides are perfectly
complementary (no
mismatches). It can easily be demonstrated th t specific hybridization
conditions result in
specific hybridization by carrying out a hybridi72tion assay including
negative controls. Optimal
hybridization conditions will depend on the length (e.g., oligomer versus
polynucleotide greater
than 200 bases) and type (e.g., RNA, DNA, PNA) of labeled probe and
immobilized
polynucleotide or oligonucleotide. General parameters for specific (i.e.,
stringent) hybridization
conditions for nucleic acids are described in Ausubel et al., Current
Protocols in Molecular
Biology (Greene Publishing and Wiley-Interscience, New York 1987). Useful
hybridization
conditions are also provided in, e.g., Tijessen, Hybridization With Nucleic
Acid Probes, (Elsevier
Science Publishers B.V., 1993) and Kricka, Nonisotopic DNA Probe Techniques,
(Academic
Press, San Diego, Calif., 1992).
CA 02417909 2003-01-31
WO 02/12447 PCT/US01/24243
41
[155] When cDNA complementary to the RNA of a cell is made and hybridized to a
microarray
under suitable hybridization conditions, the level of hybridization to the
site in the array
corresponding to any particular gene will reflect the prevalence in the cell
of RNA transcribed
from that gene. For example, when detectably labeled (e.g., with a
fluorophore) cDNA
complementary to the total cellular mRNA is hybridized to a microarray, the
site on the array
corresponding to a gene (i.e., capable of specifically binding the product of
the gene) that is not
transcribed in the cell will have little or no signal (e.g., fluorescent
signal), and a gene for which
the encoded mRNA is prevalent will have a relatively strong signal.
[156] U.S. Pat. No, 6,183,968 (to Bandman et al.) discloses polynucleotide
probes that can be
used as hybridizable array elements in a microarray, each of the
polynucleotide probes having at
least a portion of a gene which encodes a protein associated with cell
proliferation or a receptor.
[157] When fluorescently labeled probes are used, the fluorescence emissions
at each site of a
transcript array can be, preferably, detected by scanning confocal laser
microscopy. In one
embodiment, a separate scan, using the appropriate excitation line, is carried
out for each of the
two fluorophores used. Alternatively, a laser can be used that allows
simultaneous specimen
illumination at wavelengths specific to the two fluorophores and emissions
from the two
fluorophores can be analyzed simultaneously (see Shalon et al., Genome
Research 6:639-645
(1996)). Signals are recorded and, preferably, analyzed by computer, using
commercially
available methods. The abundance sort program of the invention described in
U.S. Pat. No.
5,840,484 can be used to tabulate and sort by frequency the mRNA transcripts
corresponding to
each gene identified. Since some of the polynucleotide sequences are
identified solely based on
expression levels, it is not essential to know a priori the function of a
particular gene in solid
tumor stem cells.
[158] Transcript image comparisons can be obtained by methods well known to
those skilled in
the art. Transcript levels and images can be obtained and compared, for
example, by a
differential gene expression assay based on a quantitative hybridization of
arrayed DNA clones
(Nguyen et al. Genomics 29:207-216 (1995), based on the serial analysis of
gene expression
(SAGE) technology (Velculescu et al. Science 270:484-487 (1995)), based on the
polymerase
chain reaction (Peng et al. Science 257:967-971(1992), based on a differential
amplification
protocol (U.S. Pat. No. 5,545,522), or based on electronic analysis, such as
comparative gene
transcript analysis (U.S. Pat. No. 5,840,484) or the GEMTOOLS gene expression
analysis
program (Incyte Pharmaceuticals, Palo Alto, Calif., USA). Preferably,
comparisons between two
or more transcript profiles are performed electronically.
[159] U.S. Pat. No. 6,215,894 discloses a system for scanning biochip arrays
includes a unique
CA 02417909 2003-01-31
WO 02/12447 PCT/US01/24243
42
image array identifier recorded for each array, and a computer-stored record
corresponding to
each identifier and containing the parameters of the experiment in the array
identified by the
identifier. The system further includes means for accessing a protocol library
to retrieve the
scanning protocols associated with the identified arrays and then scanning the
arrays in
accordance with the respective protocols. The resulting image maps generated
by the scanners
are stored in locations corresponding to the associated identifiers.
[160] Measurement of the translational state may be performed according to
several methods.
For example, whole genome monitoring of protein (i.e., the "proteome,") can be
carried out by
constructing a microarray in which binding sites comprise immobilized,
preferably monoclonal,
antibodies specific to a plurality of protein species encoded by the cell
genome.
[161] Use of microarrays. The microarrays describe above can be employed in
several
applications including solid tumor cancer diagnostics, prognostics and
treatment regimens, drug
discovery and development, toxicological and carcinogenicity studies,
forensics,
pharmacogenomics and the like.
[162] In one embodiment, the microarray is used to monitor the progression of
disease.
Physicians can assess and catalog the differences in gene expression between
healthy and
cancerous tissues by analyzing changes in patterns of gene expression compared
with solid
tumor stem cells from the patient. Thus, cancer can be diagnosed at earlier
stages before the
patient is symptomatie. The invention can also be used to monitor the efficacy
of treatment. For
some treatments with known side effects, the microarray is employed to "fine
tune" the treatment
regimen. A dosage is established that causes a change in genetic expression
patterns indicative of
successful treatment. Expression patterns associated with undesirable side
effects are avoided.
This approach may be more sensitive and rapid than waiting for the patient to
show inadequate
improvement, or to manifest side effects, before altering the course of
treatment.
[163] Alternatively, animal models which mimic a disease, rather than
patients, can be used to
characterize expression profiles associated with a particular disease or
condition. This gene
expression data may be useful in diagnosing and monitoring the course of
disease in a patient, in
determining gene targets for intervention, and in testing novel treatment
regimens.
[164] Also, researchers can use the microarray to rapidly screen large numbers
of candidate
drug molecules, looking for ones that produce an expression profile similar to
those of known
therapeutic drugs, with the expectation that molecules with the same
expression profile will
likely have similar therapeutic effects. Thus, the invention provides the
means to determine the
molecular mode of action of a drug.
CA 02417909 2003-01-31
WO 02/12447 PCT/US01/24243
43
[165] U.S. Pat Nos. 6,218,122, 6,165,709, and 6,146,830 (all to Friend et al.)
discloses methods
for identifying targets of a drug in a cell by comparing (i) the effects of
the drug on a wild-type
cell, (ii) the effects on a wild-type cell of modifications to a putative
target of the drug, and (iii)
the effects of the drug on a wild-type cell which has had the putative target
modified of the drug.
In various embodiments, the effects on the cell can be determined by measuring
gene expression,
protein abundances, protein activities, or a combination of such measurements.
In various
embodiments, modifications to a putative target in the cell can be made by
modifications to the
genes encoding the target, modification to abundances of RNAs encoding the
target,
modifications to abundances of target proteins, or modifications to activities
of the target
proteins. The present invention provides an improvement to these methods of
drug discovery by
providing the tumorigenic solid tumor stem cells, for a more precise drug
discovery program.
[166] An "expression profile" comprises measurement of a plurality of cellular
constituents that
indicate aspects of the biological state of a cell. Such measurements may
include, e.g., RNA or
protein abundances or activity levels. Aspects of the biological state of a
cell of a subject, for
example, the transcriptional state, the translational state, or the activity
state, are measured. The
collection of these measurements, optionally graphically represented, is
called the "diagnostic
profile". Aspects of the biological state of a cell which are similar to those
measured in the
diagnostic profile, e.g., the transcriptional state, are measured in an
analogous subject or subjects
in response to a known correlated disease state or, if therapeutic efficacy is
being monitored, in
response to a known, correlated effect of a therapy. The collection of these
measurements,
optionally graphically represented, is called herein the "response profile".
The response profiles
are interpolated to predict response profiles for all levels of protein
activity within the range of
protein activity measured. In cases where therapeutic efficacy is to be
monitored, the response
profile may be correlated to a beneficial effect, an adverse effect, such as a
toxic effect, or to
both beneficial and adverse effects.
[167] As is commonly appreciated, protein activities result from protein
abundances; protein
abundances result from translation of mRNA (balanced against protein
degradation); and mRNA
abundances result from transcription of DNA (balanced against mRNA
degradation). Therefore,
genetic level modifications to a cellular DNA constituent alters transcribed
mRNA abundances,
translated protein abundances, and ultimately protein activities. RNA level
modifications
similarly alter RNA abundance and protein abundances and activities. Protein
level
modifications alter protein abundances and activities. Finally, protein
activity modifications are
the most targeted modification methods. As is commonly appreciated, it is
ultimately protein
activities (and the activities of catalytically active RNAs) that cause
cellular transformations and
CA 02417909 2003-01-31
WO 02/12447 PCT/US01/24243
44
effects. Also, most drugs act by altering protein activities.
[168] In one embodiment, cDNAs from two different cells (one being the solid
tumor stem
cells of the invention) are hybridized to the binding sites of the microarray.
In the case of
therapeutic efficacy (e.g., in response to drugs) one cell is exposed to a
therapy and another cell
of the same type is not exposed to the therapy. In the case of disease states
one cell exhibits a
particular level of disease state and another cell of the same type does not
exhibit the disease
state (or the level thereof). The cDNA derived from each of the two cell types
are differently
labeled so that they can be distinguished. In one embodiment, for example,
cDNA from a cell
treated with a drug (or exposed to a pathway perturbation) is synthesized
using a fluorescein-
labeled dNTP, and cDNA from a second cell, not drug-exposed, is synthesized
using a
rhodamine-labeled dNTP. When the two cDNAs are mixed and hybridized to the
microarray, the
relative intensity of signal from each cDNA set is determined for each site on
the array, and any
relative difference in abundance of a particular mRNA detected. The use of a
two-color
fluorescence labeling and detection scheme to define alterations in gene
expression has been
described, e.g., in Shena et al., Science 270:467-470 (1995). An advantage of
using cDNA
labeled with two different fluorophores is that a direct and internally
controlled comparison of
the MRNA levels corresponding to each arrayed gene in two cell states can be
made, and
variations due to minor differences in experimental conditions (e.g.,
hybridization conditions)
will not affect subsequent analyses. Additional guidance is provided in
EXAMPLE 21.
[169] U.S. Pat. No. 6,194,158 (to Kroes et al.) for a diagnostic assay for
cancer with a DNA
chip of specific sequences for measuring expression levels of certain
sequences within a cancer
cell to determine whether expression is up- or down-regulated. The DNA chip
comprising
nucleotide sequences capable of hybridizing to one or more members of a panel
of DNA
sequences may be synthesized using commonly available techniques. mRNA is
isolated from a
normal, non-cancer cell and a cancer cell and hybridized to the DNA chip
comprising one of
more of the sequences from the panel. Hybridization is then detected by any of
the available
methods. In such a manner, sequences that are either overexpressed or
underexpressed in a
cancer cell as compared to a normal cell are. In a similar manner, mRNA from a
cancer cell that
has been contacted with a compound may be hybridized to sequences on the DNA
chip to
determine whether that compound affects expression of a particular sequence.
The present
invention provides an improvement over this method, in that the "cancer cell"
from which
mRNA can be isolated is the tumorigenic solid tumor stem cell of the
invention.
[170] Gene expression profiles of purified stem cells could give clues for the
molecular
mechanisms of stem cell behavior. Terskilch AV et al., Proc Natl Acad Sci USA
98(14): 7934-
CA 02417909 2010-11-01
7939 (2001) analyzed hematopoietie stein cells (HSC)-enriched cells by
comparison with normal
tissue and mouse neurospheres (a population greatly enriched for neural
progenitor cells) by
comparison with terminally differentiated neural cells, using cDNA microaxray
techniques and in
situ hybrid _________________________________________________________________
.ation, thus identifying potential regulatory gene candidates. The invention
provides
an improved method of drug discovery over the methods of Terskikh, in that the
use of the solid
tumor stem cells of the invention can, provide a distinct set of drug targets
when compared with a
patient's normal tissue (such as from the area of the solid tumor) or compared
with the other
populations of cells obtained from the solid tumor.
[171] Several other methods for utilizing DNA chips are known, including the
methods
described in U.S. Pat. Nos. 5,744,305; 5,733,729; 5,710,000; 5,631,734;
5,599,695; 5,593,839;
5,578,832; 5,556,752; 5,770,722; 5,770,456; 5,753,788; 5,688,648; 5,753,439;
5,744,306.
U.S. Pat No. 5,807,522 (to Brown et al.)
discloses a method to monitor early changes in a cell that correlate with
levels of a disease state
or therapy and which precede detectable changes in actual protein function or
activity.
[172] Moreover, microarrays of genomic DNA from solid tumor stem cells can be
probed for
single nucleotide polymorphisms (SNP), to localize the sites of genetic
mutations that cause cells
to become precancerous or tumorigenic. Guidance for such methods are available
from the
commercial vendors described above and may be found in general genetic method
books, such as
those described herein.
[173] Vaccines. The solid tumor stem cells of the invention can be used to
raise anti-cancer cell
antibodies. In one embodiment, the method involves obtaining an enriched
population of solid
tumor stem cells or isolated solid tumor stem cells; treating the population
to prevent cell
replication (for example, by irradiation); and administering the treated cell
to a human or animal
subject in an amount effective for inducing an immune response to solid tumor
stem cells. For
guidance as to an effective dose of cells to be injected or orally
administered; see, U.S. Pat. No.
6,218,166, 6,207,147, and 6,156,305.
In another embodiment,
= the method involves obtaining an enriched population of solid tumor stem
cells or isolated solid
tumor stem cells; mixing the tumor stem cells in an in vitro culture with
immune effector cells
(according to immunological methods known in the art) from a human subject or
host animal in
which the antibody is to be raised; removing the immune effector cells from
the culture; and
transplanting the immune effector cells into a host animal in a dose that is
effective to stimulate
an immune response in the animal.
[174] Monoclonal antibodies to solid tumor stem cells may be prepared using
any technique
which provides for the production of antibody molecules by continuous cell
lines in culture.
CA 02417909 2010-11-01
46
These include, but are not limited to, the hybridoma technique, the human B-
cell hybridoma
technique, and the EBV-hybridoma technique (see, e.g., Kozbor, D. et al., J.
Immunot Methods
81:31-42 (1985); Cote RI et al. Proc. Natl. Acad. Sc!. 80:2026-2030 (1983);
and Cole SP et al.
MoL Cell Biol. 62:109-120 (1984)).
[175] In addition, techniques developed for the production of "chimeric
antibodies," such as the
splicing of mouse antibody genes to human antibody genes to obtain a molecule
with appropriate
antigen specificity and biological activity, can be used (see, e.g., Morrison
SL et al. Proc. Natl.
Acad. Sc!. 81:6851-6855 (1984); Neuberger MS et al. Nature 312:604-608 (1984);
and Takeda S
et al. Nature 314:452-454 (1985)).
[176] Various immunoassays may be used for screening to identify antibodies
having the
desired specificity. Numerous protocols for competitive binding or
immunoradiometric assays
using either polyclonal or monoclonal antibodies with established
specificities are well known in
the art.
[177] The antibody can also be a humanized antibody. The term "humanized
antibody," as used
herein, refers to antibody molecules in which the amino acid sequence in the
non-antigen binding
regions has been altered so that the antibody more closely resembles a human
antibody, and still
retains its original binding ability. Antibodies are humanized so that they
are less immunogenic
and therefore persist longer when administered therapeutically to a patient.
[178] Human antibodies can be generated using the XenoMousem technology from
Abgenix
(Fremont, Calif, USA), which enables the generation and selection of high
affinity, fully human
antibody product candidates to essentially any disease target appropriate for
antiboditherapy.
See, U.S. Pat. No. 6,235,883, 6,207,418, 6,162,963, 6,150,584, 6,130,364,
6,114,598, 6,091,001,
6,075,181, 5,998,209, 5,985,615, 5,939,598, and 5,916,771;
Yang X et al., Crit Rev Oneol Hemato 38(1): 17-23 (2001); Chadd HE & Chamow
SM. Curr
Opin Biotechnol 12(2):188-94 (2001); Green LL, Journal of Immunological
Methods 231 11-23
(1999); Yang X:-]J et al., Cancer Research 59(6): 1236-1243 (1999); and
Jakobovits A,
Advanced Drug Delivery Reviews 31: 33-42 (1998). Antibodies with fully human
protein
sequences are generated using genetically engineered strains of mice in which
mouse antibody
gene expression is suppressed and functionally replaced with human antibody
gene expression,
while leaving intact the rest of the mouse immune system.
[179] Moreover, the generation of antibodies directed against markers present
in or on the solid
tumor stem cells of the invention can. be used as a method of identifying
targets for drug
development The antibodies that are raised in an immune response to the solid
tumor stem cells
can be used to identify antigenic proteins on the solid tumor stem cells using
methods known in
CA 02417909 2010-11-01
47
the art (Harlow, Using Antibodies: A Laboratory Manual (Cold Spring Harbor
Press, Cold
Spring Harbor, New York, 1999)) and can further be used to identify
polynucleotides coding for
such proteins (Sambrook et al., Molecular Cloning: A Laboratory Manual (Cold
Spring Harbor
Press, Cold Spring Harbor, New York, 1989); Current Protocols in Molecular
Biology, Ausubel
et al., eds., (Wiley Interscience, New York, 1993)). Once identified, the
proteins and
polynucleotides can be compared with other proteins and polynucleotides
previously identified
to be involved in cancer. In one embodiment, the XenoMouseTm technology to
produce fully
human antibodies can be used to generate antibodies directed against drug
development targets
(see, Jeffrey Krasner, Boston Globe (July 25,2001) at F4). The present
invention provides an
improvement to these antibody-based methods of drug discovery by providing the
tumorigenic
solid tumor stem cells, to which the immune response is raised, for a more
precise drug
discovery program.
[180] The Microarray Network In addition to the cDNA libraries and DNA array
techniques
described above for systematically studying gene expression patterns, one of
skill in the
molecular biological art can obtain guidance for the use of microarray
technology from the
University of Michigan Microarray Network (see also, EXAMPLE 9). Furthermore,
the
University of Michigan has made a large commitment to bioinformatics, by
providing funding
specifically for microarray data management and analysis, as. well as by
founding a new
Bioinformatics Center for the University.
[181] Alternatively, methods for raising an immune response can take advantage
of the "stem
cell" qualities of the solid tumor stem cell of the invention. Solid tumor
stem cells, solid tumor
stem cell protein extracts, purified proteins from solid tumor stem cells, or
proteins derived from
the expression of cDNAs from solid tumor stem cells (see, above for genetic
modification of
solid tumor stem cells) to induce an immune response in an animal. The immune
response can be
directed against cancer cells, as shown by standard immunological methods. For
example, the
solid tumor stem cells (enriched populations of isolated cells) or proteins
can be contacted with o
dendritic cells in culture, antigen presenting cells in culture, or antigen
presenting cells and T
cells in culture. Then antigen-stimulated cells are infused back into the
patient.
[182] Alternatively, the solid tumor stem cells of the invention can be
genetically engineered to
promote an immune response against the tumor stem cells. For example,
hematopoietic stem
cells can be engineered to contain a T-cell receptor targeting a tumor stem
cell antigen. See, U.S.
Pat. Nos. 5,914,108 and 5,928,638. Thus T cell receptors that
recognize antigens expressed by tumor stem cells can be identified, then
cloned into
hematopoietic stem cells. The engineered hematopoietic stem cells can then be
transplanted into
CA 02417909 2010-11-01
48
a patient and allowed to engraft, giving rise to large numbers of T cells that
express receptors
recognizing the tumor stem cells. By increasing the numbers of tumor stem cell-
specific T cells
the anti-tumor immune response can be potentiated.
[183] Other means are also available for increasing the anti-tumor immune
response, including
using the tumor stem cells as the basis of a vaccine, using the tumor stem
cells to stimulate
antigen presenting dendritic cells, and using the tumor stem cells as an
irmoculum to generate
anti-tumor antibodies. Tumor stem cells can be used as a vaccine by killing a
patient's tumor
stem cells, such as by irradiation, and readministering the killed stem cells
back into the patient
in a physiological and immunologically acceptable carrier, for the purpose of
generating an
immune response against the tumor stem cells. See, U.S. Pat No. 4,960,716, in
which antibodies
were raised to membrane vesicle preparations of breast carcinoma cell cells;
U.S. Pat No.
4,584,268, in which anti-human mammary epithelial antibody was produced a
membrane
fraction of delipidated human milk fat globules.
[184] Dendritic cells from a patient can be cultured in vitro and killed tumor
stem cells from the
same patient can be added to the cultures to stimulate the dendritic cells.
The activated dendritic
cells, presenting tumor stem cell antigens, can then be re-administered to the
patient to stimulate
the patient's anti-tumor response. Finally, tumor stem cells can be
administered to an animal
such as a mouse, rat, hamster, goat, sheep, rabbit, or donkey to generate
antibodies against the
tumor stem cells. Preferably, monoclonal anti-tumor stem cell antibodies are
made in mouse, rat,
or hamster. Monoclonal antibodies that are made in this way can then be
administered to
patients, or first humanized (as described above) and then administered to
patients, to promote an
immune response against the tumor stem cells in the patient.
[185] Furthermore, adenoviral vectors have proven especially useful for gene
transfer into
eukaxyotic cells for vaccine development. Graham FL & Prevec L, In Vaccines:
New
Approaches to Immunological Problems, Ellis RV ed., 363-390 (Butterworth-
Heinemann,
Boston, 1992).
[186] Probe for scanning microarrays. The complete sequencing of the human
genome makes
possible the identification of the genes expressed by a particular population
of cells. Probes from
enriched populations of tumor stem cells can be made using methods known to
the art (see,
Wang et al., Nature Biotechnology 18: 457 (2000)). Analysis of gene expression
patterns and
protein expression patterns for tumor stem cells and tumor cell progeny
populations can be
preformed by comparing results to known Gene Pattern Databases or to known
Protein Pattern
Databases (for example, PROSITE, PRINTS: Protein Motif Fingerprint Database,
BLOCKS,
PFAM, DOMO, PRODOM, or other databases). Searches can be preformed, for
example, using
CA 02417909 2003-01-31
WO 02/12447 PCT/US01/24243
49
the BCM Search Launcher: General Protein Sequence/Pattern Searches (Baylor
College of
Medicine, Human Genome Sequencing Center, One Baylor Plaza, Houston, TX).
Commercially
available programs for gene and protein analysis are also available (such as
CGC (from Genetics
Computer Group, Inc.) and DNA STRIDER).
[187] The factors involved in the proliferation, differentiation, or survival
of tumor stem cells
and tumor stem cell progeny, or their responses to biological agents can be
isolated either by
constructing cDNA for libraries or to probe microarrays from tumor stem cells,
or tumor stem
cell, non-tumorigenic cancer cells, or normal tumor cells using techniques
known in the art.
cDNA can also be made from any of the different populations after exposure to
biological agents
or drugs to determine the response to such manipulations. The libraries from
cells of one
population are compared with those of cells of different populations to
determine the sequence of
gene expression during development and to reveal the effects of various
biological agents or to
reveal new biological agents that alter gene expression in cancer cells. When
the libraries are
prepared from neoplastic tissue, genetic factors may be identified that play a
role in the cause of
cancer cell growth, for example, by comparing the libraries from the cancerous
tissue with those
from normal tissue. This information can be used in the design of anti-cancer
therapies.
Additionally, probes can be identified for use in the diagnosis of various
cancers or for use in
identifying cells at a particular stage in tumor development.
[188] Diagnostic and prognostic evaluation of tumors. A variety of methods can
be employed
for the diagnostic and prognostic evaluation of tumor and metastasis, and for
the identification of
subjects having a predisposition to such conditions. Among the methods well
known in the art
are the use of bone scans, X-ray imaging, MRI tests, CAT scans, and blood
tests for tumor
associated antigens (see, American Cancer Society, Cancer Facts and Figures
1999: Selected
Cancers (1999); American Cancer Society, Breast Cancer Guidelines and
Statistics (1999);
Kopans Breast Imaging. 2" Edition (JB Lippincott, Philadelphia, Pennsylvania,
1998); Potter &
Partin, NCCN Practice Guidelines for Early Detection of Prostate Cancer
13(11A) Oncology
(November 1999). For additional methods of detection, see Franklin et al,
Breast Cancer
Research & Treatment 41(1): 1-13 (1996); Kufe et al., Cancer Research 43(2):
851-7 (1983).
For bone scans, nuclear medicine imaging can be used. Nuclear medicine may be
used in
addition to mammography to help identify certain abnormalities. Nuclear
medicine is also a good
tool for evaluating the metastasis of cancer into the lymphatic system, other
organs and skeletal
system. Tumor associated antigens include for example, BCA 225 (U.S. Pat. No.
5,681,860);
Bladder Tumor Associated Antigen (BTA stat test, ARUP Laboratories, Salt Lake
City, UT);
tumor-associated antigen CA125 (Wagner etal., Hybridoma 16(1): 33-40 (1997));
22-1-1 Ag,
CA 02417909 2003-01-31
WO 02/12447 PCT/US01/24243
YH 206, GA 733, CA 125, carcinoembryonic antigen, and sialyl Le' (Sonoda et
al., Cancer
77(8): 1501-1509 (1996)). For breast cancer prognosis, cancerous cells can be
looked for in the
patient's bone marrow. See, for example, Bruan et al., New Engl. J Med. (Feb.
24, 2000)).
[189] Such methods may, for example, utilize reagents such as VEGF nucleotide
sequences and
VEGF antibodies. Specifically, such reagents may be used, for example, for:
(1) the detection of
the presence or over-expression of VEGF rnRNA relative to the non-carcinogenic
tissue state;
(2) the detection of an over-abundance of VEGF protein relative to the non-
carcinogenic tissue
state; (3) the detection of hypoxic conditions in the tumor mass; (4) the
detection of the
expression of VEGF tyrosine kinase receptors and other angiogenic receptors in
adjacent
endothelial tissues; and (5) the detection of the expression of oncogenes. The
methods may be
performed, for example, by utilizing pre-packaged diagnostic kits comprising
at least one
specific VEGF nucleotide sequence or VEGF antibody reagent described herein,
which may be
conveniently used, e.g., in clinical settings, to diagnose patients at risk
for tumor angiogenesis
and metastasis.
[190] Further, the expression of different oncogene alleles may be assessed
using these
methods. The additional information obtained regarding the expression of other
markers provides
guidance for the design of appropriate therapies to inhibit angiogenesis or
tumor proliferation
tailored to the molecular stage of the cancer in a particular patient.
[191] Drug discovery. The invention provides a method for identifying a test
compound for
reducing solid tumors. The practice of the method can be further determined
using the guidance
provided in the EXAMPLES below. The steps of the method include assaying the
response of
tumor cells to biological agent and determining the effects of the biological
agent on the tumor
stem cell. In other words, the invention provides improved methods of drug
discovery by the use
of the solid tumor stem cells of the invention.
[192] Proof of principle of the use of the invention for drug discovery is
provided in drug
discovery in EXAMPLE 11 and FIG. 11, where the epidermal growth factor (EGF)
receptor
(EGF-R) and HER2/neu markers (known to be involved in cancers) were identified
on solid
tumor stem cells. Accordingly, therapies directed against the EGF-R (e.g.,
Yang X et al., Grit
Rev Oncol HematoL 38(1): 17-23 (2001)) and HER2/neu markers (see, Breast
Disease, Vol. 11,
HER2: Basic Research, Prognosis and Therapy, Y. Yarden, ed. (IOS Press,
Amsterdam, 2000))
can be effectively targeted to solid tumor stem cells.
[193] The identification of biological pathways is an important part of modern
drug discovery
process. Biological pathways in solid tumor stem cells and other cell
populations obtained from
solid tumors, particularly pathways involved in drug actions, i.e., pathways
that originate at a
CA 02417909 2010-11-01
51
drug target (e.g., proteins), can be identified for use as shown by U.S. Pat.
No. 5,965,352.
[194] In one set of methods, drugs are screened to determine the binding of
test compounds to
receptors, in which the binding activates a cell's biological pathway to cause
expression of
reporter polypeptides. Frequently the reporter polypeptides are coded for on
recombinant
polypeptides, in which the coding polynucleotide is in operable linkage with a
promoter.
[195] The terms "operably associated" or "operably linked," as used herein,
refer to
functionally related polynucleotides. A promoter is operably associated or
operably linked with a
coding sequence if the promoter controls the translation of the encoded
polypeptide. While
operably associated or operably linked nucleic acid sequences can be
contiguous and in the same
reading frame, certain genetic elements, e.g., repressor genes, are not
contiguously linked to the
sequence encoding the polypeptide but still bind to operator sequences that
control expression of
the polypeptide.
[196] The detectable signal can be fluorescence, absorbence, or luminescence,
depending on
the reporter polypeptide, which can be, for example, luciferase (firefly
luciferase, Vibrio fisceri
luciferase, or Xenorhabdus luminescens luciferase), green fluorescent protein,
green fluorescent
protein variant, chlorarnphenicol acetyltransferase, P-g1ucuronidase,13-
galactosidase, neomycin
phosphotransferase, guanine xanthine phosphoribosyltransferase, thymidine
ldnase, p-lactamase,
alkaline phosphata.se, invertase, amylase (for yeast based assays) human
growth hormone (for
activity based assays). The fluorescent detectable signal can be fluorescence
resonance energy
transfer (FRET), bioluminescence resonance energy transfer (BRET), time-
resolved fluorescence
(TRF) or fluorescence polarization (FP). Where appropriate, the detectable
signal is detected by
a machine such as a fluorometer, luminometer, fluorescence microplate reader,
dual-
monochromator microplate spectrofluorometer, spectrophotometer, confocal
microscope (laser
scanner), or a charge-coupled device (CCD). The detectable signal is
determined by comparing
the amount of signal produced when the reporter polypeptide is expressed in
the tumor stem cell
with the signal produced when the reporter polypeptide is not expressed in the
tumor stem cell.
[197] Another technique for drug screening provides for high throughput
screening of
compounds (see, e.g., PCT application WO 84/03564.) In this method, large
numbers of different
small test compounds are synthesized on a solid substrate, such as plastic
pins or some other
surface. The test compounds are reacted with solid tumor stem cells, or
portions thereof, and
washed. Bound solid tumor stem cells are then detected by methods well known
in the art, using
commercially available machinery and methods, for example, the Automated Assay
Optimization (AAO) software platforms (Beckman, USA) that interface with
liquid handlers to
CA 02417909 2003-01-31
WO 02/12447 PCT/US01/24243
52
enable direct statistical analysis that optimizes the assays; modular systems
from CRS Robotics
Corp. (Burlington, Ontario), liquid handling systems, readers, and incubators,
from various
companies using POLARATM (CRS), an open architecture laboratory automation
software for a
Ultra High Throughput Screening System; 3P (Plug&Play Peripherals) technology,
which is
designed to allow the user to reconfigure the automation platform by plugging
in new
instruments (ROBOCON, Vienna, Austria).; the AllegroTM system or StaccatoTM
workstation
(Zymark), which enables a wide range of discovery applications, including HTS,
ultra HTS, and
high-speed plate preparation; MICROLAB Vector software (Hamilton Co., Reno,
Nev., USA)
for laboratory automation programming and integration; and others.
[198] For any of these machines and methods, the assays measure a response the
target cells
(solid tumor stem cells or genetically modified solid tumor stern cells) that
provides detectable
evidence that the test compound may be efficacious. The detectable signal is
compared to control
cells and the detectable signal identified by subtraction analysis. The
relative abundance of the
differences between the "targeted" and "untargeted" aliquots are
simultaneously compared using
a "subtraction" analysis (differential analysis) technique such as
differential display,
representational difference analysis (RDA), GEM-Gene Expression Microarrays
(U.S. Pat. No.
5,545,531), suppressive subtraction hybridization (SSH) and direct sequencing
(PCT patent
application WO 96/17957). The subtraction analysis can include the methods of
differential
display, representational differential analysis (RDA), suppressive subtraction
hybridization
(SSH), serial analysis of gene expression (SAGE), gene expression microarray
(GEM), nucleic
acid chip technology, or direct sequencing.
[199] The solid tumor stem cell of the invention is particularly useful in the
drug development
process because solid tumor stem cells provide a limited and enriched set of
targets for drug
development. One of the most important steps in rational drug design is the
identification of a
target, the molecule with which the drug itself interacts. Frequently, the
target will be a receptor
on or in a tumorigenic solid tumor stem cell.
[200] Likewise, the genetically modified solid tumor stern cell of the
invention is particularly
useful in the drug development. For example, the genetically modified stem
cell can contain
polynucleotide with a promoter operably linked to the polynucleotide encoding
a reporter
polypeptide. The reporter polypeptide is expressed in the tumor stem cell
after a receptor of the
tumor stem cell is activated by binding to a test compound or inactivated by
binding to a test
compound. Such a detectable signal makes the genetically modified solid tumor
stem cell
appropriate for use in high throughput screening (HTS).
[201] The detectable signal can be a result of a positive selection or a
negative selection. The
CA 02417909 2003-01-31
WO 02/12447 PCT/US01/24243
53
positive selection includes manipulations that test the ability of cells to
survive under specific
culture conditions, ability to express a specific factor, changes in cell
structure, or differential
gene expression. The selection can be based on the ability of the solid tumor
stern cells or
genetically modified solid tumor stern cells to:
(a) Grow or survive under specific culture conditions, such as in vitro cell
culture.
(b) Express a specific factor that can be measured, the measurement adaptable
for a
selection. This factor can be anything that is accessible to measurement,
including but not limited
to, secreted molecules, cell surface molecules, soluble and insoluble
molecules, binding
activities, activities that induce activities on other cells or induce other
organic or inorganic
chemical reactions.
(c) Changes in cell structure, including morphological changes that are
measured by
physical methods such as differential sedimentation, differential light
scattering, differential
buoyant density, differential cell volume selected by sieving.
(d) Differences in gene expression that can be directly measured, including
changes in
cell surface markers, changes in biochemical activities, any changes that
would be re-selected in
changes in binding of fluorescent labeled probes that could be used in
conjunction with a
Fluorescence Activated Cell Sorter (FACS) or any property that can be used as
a basis for a
selection. Genetically modified solid tumor stem cells containing
polynucleotides that express
reporter polypeptides are particularly useful here.
(e) Differences in gene expression that can be indirectly measured, including
changes in
transcription factor activity that are measured by a synthetic gene construct
encoding a selective
marker (such as a drug resistance marker or a cell surface marker that could
be used in a FACS
selection). This category would also include changes in mRNA stability, mRNA
localization,
mRNA translation control. All of these changes could be the basis of a
selection because a
synthetic construct which is controlled by one of these regulatory events
could be constructed
which would drive the expression of an easily selected gene product.
[202] Pharmacogenomics. The invention provides an improved method of
ascertaining
propensity for malignancy, monitoring the progress of chemotherapy or other
anticancer therapy,
screening for re-occurrence of cancer, or other similar detection of present
or potential cancer,
where such method detects for the expression of at least one gene which is
over- or under-
expressed in a potential cancer cell, as compared with either a solid tumor
stem cell isolated from
the patient or a collection of solid tumor stem cells. In one embodiment, the
method is the
assaying of a biological sample (such as from the patient) to be tested for a
signal indicating the
transcription of a significant (by comparison with the solid tumor stem cell)
polynucleotide
CA 02417909 2010-11-01
54
transcript. In addition, screening assays of biological samples are
contemplated, where such
assays are conducted during the course of chemotherapy alone, or after
surgical intervention to
treat cancer, to monitor for the continued presence or return of cancerous
cells.
[203] Other embodiments of the invention. The invention provides an article of
manufacture (a
system or a kit), comprising packaging material and a primary reagent
contained within said
packaging material. The primary reagent is solid tumor stem cell preparation
as described above.
The packaging material includes a label that indicates that the primary
reagent can be used for
identifying an agent for reducing solid tumors.
Also, the invention provides a kit for determining the activity level of a
particular polynucleotide
or protein in a cell. Such kits contain arrays or microarrays containing a
solid phase, e.g., a
surface, to which are bound, either directly or indirectly, solid tumor stem
cells (enriched
populations of or isolated), polynucleotides extracted from such solid tumor
stem cells, or
proteins extracted from such solid tumor stem cells. The kit may also contain
probes that are
hybridized or bound to the solid tumor stem cell components at a known
location of the solid
phase. These probes consist of nucleic acids of known, different sequence,
with each nucleic acid
being capable of hybridizing to an RNA species or to a cDNA species derived
therefrom. In
particular, the probes contained in the kits of this invention are nucleic
acids capable of
hybridizing specifically to nucleic acid sequences derived from RNA species
which are known to
increase or decrease in response to perturbations correlated to the particular
diseases or therapies
to be monitored by the kit. The probes contained in the kits of this invention
preferably
substantially exclude nucleic acids which hybridize to RNA species that are
not increased or
decreased in response to perturbations correlated to the particular levels of
disease states or
therapeutic effects to be determined by the kit.
[204] The details of one or more embodiments of the invention have been set
forth in the
accompanying description above. Although any methods and materials similar or
equivalent to
those described herein can be used in the practice or testing of the present
invention, the
preferred methods and materials are now described. Other features, objects,
and advantages of
the invention will be apparent from the description and from the claims.
[205] In the specification and the appended claims, the singular forms include
plural referents.
Unless defined otherwise in this specification, all technical and scientific
terms used herein have
the same meaning as commonly understood by one of ordinary skill in the art to
which this
invention belongs.
CA 02417909 2010-11-01
[206] The following EXAMPLES are presented in order to more fully illustrate
the preferred
embodiments of the invention. These EXAMPLES should in no way be construed as
limiting the
scope of the invention, as defined by the appended claims.
EXAMPLE 1
ISOLATION OF BREAST CANCER STEM CELLS
[207] The purpose of this EXAMPLE is to show structural and cell functional
characterization
of breast cancer stem cells.
[208] We have developed both a tissue culture and a mouse model to identify
the breast tumor
clonogenic cell. In the mouse model, NOD/SCID mice Lapidot et al., Nature
367(6464): 645-8
(1994)) are treated with VP-16 (Etoposide) (available from commercial sources,
such as
Moravek Biochemicals, Brea, CA, USA), and implanted with primary human breast
cancer
tissue (obtained from mastectomy or lumpectomy specimens). Three of five
primary tumors
formed tumors in this system.
[209] The tumor cells isolated from malignant pleural effusions obtained from
two patients
(see, Zhang et al., Invasion & Metastasis 11(4): 204-15 (1991)) were suspended
in MatrigelTM
(available from Becton Dickinson, Franklin Lakes, NJ, USA), then were injected
into mice.
Tumors formed in the injected mice.
[210] By this method, we can generate enough tumor cells for analysis by FACS.
We also can
generate enough tumor cells to perform biological assays to characterize the
cells. (For
clonogenic assay for detecting rare tumor cells in hematopoietic samples, see
U.S. Pat. No.
5,674,694).
[211] Phenotypically distinct subsets of tumor cells can be isolated by any
suitable means
known in the art, including FACS using a fluorochrome conjugated marker-
binding reagent. Any
other suitable method including attachment to and disattachment from solid
phase, is also within
the scope of the invention. Procedures for separation may include magnetic
separation, using
antibody-coated magnetic beads, affinity chromatography and "panning" with
antibody attached
to a solid matrix, e.g. plate, or other convenient technique. Techniques
providing accurate
separation include fluorescence activated cell sorters, which can have varying
degrees of
sophistication, such as multiple color channels, low angle and obtuse light
scattering detecting
channels, impedance channels, etc. Dead cells may be eliminated by selection
with dyes that
bind dead cells (such as propidium iodide (PI), or 7-AAD). Any technique may
be employed that
is not unduly detrimental to the viability of the selected cells.
[212] The marker-binding reagent can be directly or indirectly conjugated to a
magnetic
CA 02417909 2003-01-31
WO 02/12447 PCT/US01/24243
56
reagent, such as a superparamagnetic microparticle (microparticle). Direct
conjugation to a
magnetic particle is achieved by use of various chemical linking groups, as
known in the art.
Antibody can be coupled to the microparticles through side chain amino or
sufhydryl groups and
heterofunctional cross-linking reagents. A large number of heterofunctional
compounds are
available for linking to entities. A preferred linking group is 3-(2-
pyridyidithio)propionic acid
N-hydroxysuccinimide ester (SPDP) or 4-(N-maleimidomethyl)-cyclohexane-1 -
carboxylic acid
N-hydroxysuccinimide ester (SMCC) with a reactive sulthydryl group on the
antibody and a
reactive amino group on the magnetic particle. Alternatively, the marker-
binding reagent is
indirectly coupled to the magnetic particles. The marker-binding reagent is
directly conjugated to
a hapten, and hapten-specific, second stage antibodies are conjugated to the
particles. Suitable
haptens include digoxin, digoxigenin, FITC, dinitrophenyl, nitrophenyl,
avidin, biotin, etc.
Methods for conjugation of the hapten to a protein, i.e. are known in the art,
and kits for such
conjugations are commercially available. Fluorochrome labeled antibodies are
useful for FACS
separation, magnetic particles for immunomagnetic selection, particularly high
gradient magnetic
selection (HGMS), etc. Exemplary magnetic separation devices are described in
PCT patent
applications WO 90/07380 and WO 96/09550 , and European patent 0 438 520.
[213] We have extensively studied the tumors formed by one of the primary
tumors and one of
the malignant pleural effusion cells. We have identified low serum tissue
culture conditions in
which primary breast cancer cells and cells isolated from a mouse xenograft
proliferates for at
least 1-3 weeks in tissue culture. Using the in vitro tissue culture model, we
found that
stimulation of a specific receptor can affect the growth and survival of
breast cancer cells.
[214] We have used the in vitro (tissue culture) and in vivo (mouse xenograft)
models of human
breast cancer. A human tumor growing in the mouse model was harvested and made
into a single
cell suspension and analyzed by FACS. We found a heterogeneity of expression
of cell surface
markers on tumor cells. Initially, breast cancer cells isolated from a
malignant pleural effusion
were separated into groups based upon CD44 expression. Cells were analyzed for
expression of
markers 520C9 and CD44 (see, FIG. 2). 520C9 is known to recognize c-erbB-2
(HER-2/neu).
Ring et al., Molecular Immunology 28:915 (1991). See also, U.S. Pat. No.
4,753,894, which
discloses murine monoclonal antibodies that bind selectively to human breast
cancer cells. Four
populations of cells were identifiable. There was a small population of cells
that expressed both
markers 520C9 and CD44, a population that expressed either marker alone, as
well as a
population that expressed neither marker. Cells were isolated with regard to
CD44 expression
(FIG. 2). CD44 + or CD44: cells were tested for their ability to proliferate.
Marker CD44+ tumor
cells, but not marker CD44" tumor cells, were able to form colonies in vitro
and tumors in vivo
CA 02417909 2003-01-31
WO 02/12447 PCT/US01/24243
57
(TABLE 1). Note that isolation of CD44 + cells results in at least a 2.5-fold
purification of the
turnorigenic cells.
TABLE 1
ISOLATED POPULATIONS OF BREAST CANCER STEM CELLS
CD44 + CD44
Colonies in vitro
Tumorigenicity in mice
Human breast cancer cells were collected using FACS. Analysis of in vitro
colonies was done i
2 separate wells using 5,000 cells of the respective phenotype. In vivo growth
of sorted cells wa
done by injecting mice with 2x10⁶ marker CD44 + or CD44- cells. Mice were
analyzed at week
in experiment 1 and week 4 in experiment 2. The injections of marker CD444-
cells, but not
marker CD44- cells, resulted in tumor formation and growth in vitro. The in
vitro experiments
have been replicated using frozen cells isolated from the patient and support
the in vitro
experiments. The in vivo experiments have been replicated twice.
[215] These results serve as a proof-of-principle of the stem cell model of
solid cancer and
demonstrate the following:
(a) solid tumor cells are phenotypically and functionally heterogeneous; some
tumor cells
are tumorigenic, while others have limited proliferative potential and do not
form tumors upon
transplantation;
(b) by separating cells by FACS, one can enrich for tumorigenic cells; and
(c) by studying the tumorigenic fractions one can isolate tumor stem cells and
more
carefully focus strategies for identifying therapeutic targets.
[216] This EXAMPLE shows that that the clonogenic breast cancer tumor cell
from two tumors
express CD44. Other markers also allow the further purification of the breast
cancer stem cell.
We have analyzed the tumor cells for expression of several antigens. Some
antigens with
heterogeneous expression patterns include MUC1, Notch-4, annexin V, 317G5,
CD9, CD24,
260F9, P-glycoprotein and CD49F. 260F9 binds to a 55 kilodalton glycoprotein
(mucin) B cell
surface antigen. Weiner LM et al., Cancer Res. 49:4062-4067 (1989); Gregg, EO.
et al
Immunol, 138:4502-4508 (1987). See also, U.S. Pat. No. 4,753,894, which
discloses murine
= monoclonal antibodies that bind selectively to human breast cancer cells.
Combinations of these
markers with CD44 permit increased enrichment of the tumor stem cells beyond
what was
achieved with CD44 alone.
[217] Remarkably, all of the CD44 + (tumorigenic) cells are also B3 8.1k. See,
Kufe et al.,
Cancer Research 43(2): 851-7 (1983) for description of B38.1 antibody.
Annexin, Notch-4, and
CD24 expression is heterogeneous by the B38.1+ cells. We can thus further
purify the breast
CA 02417909 2003-01-31
WO 02/12447 PCT/US01/24243
58
cancer stem cell from two tumors by analyzing various subpopulations of B381+
or CD44+ cells.
Indeed, we have isolated B38.1+CD24+, and B38.1+CD24" cells obtained from a
primary biopsy
and placed them in tissue culture. Only the B38.1+CD24- cells formed colonies.
In another
tumor, we isolated the 260F9+CD24, 260F9+CD24hi, and the 260F9+CD2410
populations of cells.
Only the CD24-40 population of cells formed tumors (TABLE 2). Note that there
is a 5-6 fold
enrichment of tumorigenic cells using B38.1 or 260F9 and CD24.
, TABLE 2
ANALYSIS OF TUMORIGENICITY OF CD24 + AND CD24/10 CELLS
Tumor formation CD24+ CD24110
Tumor Ti
Tumor T2
NOD/SCID mice were injected with either 50,000-200,000 CD24 + or CD24 -110
cells
and analyzed for tumor formation two weeks later.
EXAMPLE 2
ROLE FOR NOTCH IN BREAST CELL PROLIFERATION
[218] The purpose of this EXAMPLE is to provide preliminary evidence that in
at least two
different tumors, Notch 4 is expressed by a minority of the tumorigenic cells.
Cells from tumor
Ti and tumor T2 from EXAMPLE 1 were analyzed for expression of Notch 4. Cells
were
stained with an anti-Notch 4 polyclonal antibody and analyzed by FACS. 5-15%
of cells
expressed detectable levels of Notch 4. Furthermore, different populations of
non-tumorigenic
cells express different Notch ligands and members of the Fringe family. To
determine which
Notch RNAs are expressed by normal breast tissue and breast tumor tissue, we
performed
RT-PCR using primers specific for each Notch mRNA. Interestingly, Notch 1,
Notch 3 and
Notch 4, but not Notch 2, were expressed by both normal breast cells and
breast tumor cells.We
prepared RNA from 100,000 cells. RT-PCR of RNA from normal breast cells or
breast tumor
cells was performed using primers specific for Notch 1, Notch 2, Notch 3, and
Notch 4. A PCR
product of the predicted size was present for Notch 1, 3, and 4, showing the
presence of these
markers in these cells. The signal was lost if the RNA was pretreated with
Rnase.
[220] To determine the role of Notch in proliferation, a Notch recombinant
ligand or agonist
peptides of the ligand were added to the medium in cultures of normal mammary
epithelial cells.
Both Notch agonists stimulated the survival/proliferation of single cells: in
the presence of the
Notch agonists, 2-3 times more colonies formed and they included a higher
percentage of large,
mixed colonies (40% versus 20%). When single cells were plated at clonal
density, we obtained
CA 02417909 2003-01-31
WO 02/12447 PCT/US01/24243
59
two kinds of colonies. There were large colonies made up of hundreds to
thousands of cells,
presumably arising from solid tumor stem cells, that were of a mixture of
myoepithelial cells and
ductal epithelial cells. There were also smaller colonies of cells that
appeared to contain only a
single lineage and that probably represented the progeny of restricted
progenitors.
[221] From a normal breast epithelial cell grown in vitro, bilineage colonies
(containing both
myoepithelial and ductal epithelial cells) were generated by single cells.
Myoepithelial cells were
identified by staining with an anti-CALLA antibody. Ductal epithelial cells
were identified by
staining with an anti-ESA antibody. Organoids grown in MatrigelTM in the
presence or absence
of the Notch agonist peptide branched and proliferated more in the presence of
the Notch agonist
peptide. This agonist peptide also inhibited differentiation, as indicated by
the inhibition of
casein production. These results demonstrate that these assays also provide a
means for detecting
multipotent progenitors from normal breast epithelium. This assay may be used
for the
purification of normal breast stem cells. These results also demonstrate that
Notch has a function
in normal breast development.
[222] We then examined Notch 4 expression in breast cancer tumor cells. High
levels of Notch
4 were expressed on a minority of the tumor cells. When the B38.1 population,
which identifies
the tumorigenic population, was analyzed for Notch 4 expression, a distinct
minor population of
cells that were B38.1low, Notch 4+ became apparent.
[223] We sorted Notch 4+ and Notch 4" cells and analyzed them in vitro.
Surprisingly, neither
population grew in tissue culture. There were two possible explanations.
First, it was possible
that interaction between the two populations of cells was required for cell
growth. Next, the
antibody may be either an agonist or an antagonist of Notch 4 and may inhibit
tumor cell growth.
To distinguish between these possibilities, tumor cells were incubated with
the anti-Notch 4
antibody, and then assayed in vitro. Breast cancer cells were placed in tissue
culture after
exposure to an anti-Notch 4 antibody. Cells were incubated on ice for 1 hr. in
HBSS containing
no anti-Notch 4 antibody, anti-Notch 4 antibody, or anti-Notch 4 antibody that
had been
preincubated with the peptide used to generate the antibody. Cells were also
grown in the
presence of soluble Delta and without soluble Delta as a control.
[224] While control cells grew in tissue culture and formed colonies, cells
incubated with the
Notch 4 antibody did not. When the anti-Notch 4 antibody was incubated with
the peptide used
to generate the antibody before addition to the cells, growth was restored. To
confirm a role for
Notch for growth in vitro, cells were incubated in serum free conditions in
media that contained
soluble Delta, a Notch ligand, or a control culture without Delta. The
cultures with Delta formed
CA 02417909 2003-01-31
WO 02/12447 PCT/US01/24243
many colonies, whereas only a few small colonies formed without soluble Delta
or in cultures
using cells exposed to the anti-Notch 4 antibody. When the antibody was
preincubated with the
peptide, the antibody no longer blocked proliferation. Thus, the Notch 4
pathway is critical for
breast cancer cell growth in vitro.
[225] Tumor cells were exposed to the anti-Notch 4 antibody and then the cells
were injected
into mice to determine whether the antibody inhibits tumor formation. 35,000
tumor cells were
incubated with no antibody, the anti-Notch 4 antibody, or the anti-Notch 4
antibody that had
been preincubated with the peptide used to generate the antibody. After two
weeks, the diameter
of tumors formed by the cells exposed to the anti-Notch 4 antibody was 40%
smaller than the
control tumors. Thus the cells that were exposed to the anti-Notch 4 antibody
formed smaller
tumors than cells that were exposed to the anti-Notch 4 antibody that was
incubated with the
peptide used to generate the antibody.
[226] Expression of Notch, Notch ligands, and Fringe family members in
subpopulations of
breast cancer tumor cells. We examined the expression of members of the Notch
receptor
family, Notch ligands and Notch signal modifying proteins in populations of
breast tumor cells.
We initially focused on the markers in the Notch 4+ and Notch 4- populations.
One hundred
Notch 4 + or Notch 4- cells were isolated by FACS (see, FIG. 4). Forty rounds
of PCR were
performed to detect the indicated mRNA. The Notch 4+ population expressed
Notch 1, Notch 4,
and Jagged (a Notch ligand). The Notch 4: population expressed Notch 1 and
Notch 3 as well as
Jagged. Interestingly, Notch 3 (which may inhibit signaling through other
Notch receptors) was
not expressed by the Notch 4+ population.
[227] Summary. We have developed in vitro and in vivo assays for normal human
breast cells
and human breast tumor stem cells. In two different tumors arising in the
NOD/SCID mouse
model, the tumor cells were heterogeneous with respect to the expression of
several cell surface
markers. In both tumors, the phenotype of the clonogenic tumor stem cell was
B38.1+CD44+CD24-110. The same population was found to be the clonogenic in the
in vitro
assay. This B38.1+ population can be further subdivided using several
additional markers. In
vitro and in vivo evidence strongly implicates the Notch pathway, especially
Notch 4, as playing
a central pathway in tumorigenesis.
CA 02417909 2003-01-31
WO 02/12447 PCT/US01/24243
61
EXAMPLE 3
MOUSE XENOGRAFT MODEL
[228] We have developed a xenograft model in which we have been able to
establish tumors
from primary breast tumors via injection of tumors in the mammary gland of
severely
immunodeficient mice. Xenograft tumors have been established from mastectomy
specimens of
all five patients that have been tested to date. We have also been able to
establish tumors from
three malignant pleural effusions. NOD/SCID mice were treated with VP-16, and
implanted with
primary human breast cancer tissue. Tumor cells isolated from three malignant
pleural effusions
suspended in Matrigel were injected into mice and also formed a tumors. This
enabled us to
generate enough malignant tumor cells to facilitate analysis by flow-cytometry
and assay for the
ability of different subsets of cells to form tumors. We have extensively
studied the tumors
formed by one of the primary tumors and one of the malignant pleural effusion
cells.
Furthermore, in the three tumors that we have attempted to do so, we have been
able to make
single-cell suspensions and transfer the tumors. These improvements in the
xenograft assay have
allowed us to do biological and molecular tests to characterize the clonogenic
breast cancer cell.
In addition, we have found tissue culture conditions in which primary breast
cancer cells and
cells isolated from a mouse xenograft tumor have proliferated for a short
period of time (1-3
weeks) in tissue culture.
[229] A human tumor growing in the mouse model was harvested, made into a
single cell
suspension, and analyzed by FACS. There was heterogeneity of expression of
cell surface
markers by tumor cells. Initially, breast cancer cells isolated from a
malignant pleural effusion
were separated into groups based upon CD44 expression. Cells were analyzed for
expression of
markers 520C9 and CD44. Three populations of cells were identifiable. There
was a small
population of cells that expressed both markers 520C9 and CD44, a population
that expressed
either marker alone, as well as a population that expressed neither marker.
Cells were isolated
with regard to CD44 expression. CD44+ or CD44- cells were tested for their
ability to proliferate.
Marker CD44 + tumor cells, but not marker CD44:* tumor cells, were able to
form colonies in vitro
and tumors in vivo (TABLE 3). Note that isolation of CD44 + cells results in a
2-fold enrichment
of the tumorigenic cells.
CA 02417909 2003-01-31
WO 02/12447 PCT/US01/24243
62
TABLE 3
HUMAN BREAST CANCER CELLS COLLECTED USING FACS
CD44+ CD44"
Colonies in vitro
Tumorigenicity in mice
Analysis of in vitro colonies was done in 2 separate wells using 5,000 cells
of the
respective phenotype. In vivo growth of sorted cells was done by injecting
mice with
2x10⁶ marker CD44+ or CD44" cells. Mice were analyzed at week 3 in test 1 and
week 4
in test 2. The injections of marker CD44+ cells, but not marker CD44" cells,
resulted in
tumor formation and growth in vitro. The in vitro tests have been replicated
using frozen
cells isolated from the patient and support the in vitro tests. The in vivo
tests have been
replicated twice.
[230] These results show that the clonogenic breast cancer tumor cell
expresses CD44. We
have begun to search for other markers that might allow us to further purify
the breast cancer
stem cell. To do this, we have analyzed the tumor cells for expression of
several antigens.
[231] Surprisingly, all of the CD44+ (tumorigenic) cells were also B38.1+.
Indeed, we have
isolated B38.1+CD24+ cells and B38.1+CD24" cells obtained from a primary
biopsy and placed
them in tissue culture. Only the B38.1+CD24- cells formed colonies.
[232] We next isolated cells from two of the tumors based upon expression of
marker CD24. In
tumor T2, we isolated the CD24", the CD241 and the CD24 hi populations. In
both cases, only the
CD2441 populations formed tumors (TABLE 4). Note that there was a 5-6-fold
enrichment of
tumorigenic cells using B38.1 and CD24.
TABLE 4
FRACTIONS OF HUMAN BREAST CANCER CELLS
ISOLATED BY FLOW-CYTOMETRY
Mouse tumor formation CD24 + CD2441
Tumor Ti
Tumor T2
Mice were injected with 50,000 CD24 + or CD2441 cells. The formation of
tumors was
determined 4 weeks after injection.
[233] Analysis of tumors arising from the CD24- cell population. By the solid
tumor stem cell
model, CD24" cells give rise to tumors that contain both CD24 + and CD24-
cells. To test this
hypothesis, secondary transplants were performed using B38.1+CD24" cells.
[234] The resultant tumors were removed and the cells were re-analyzed with
respect to B38.1
and CD24 expression. As predicted by the stem cell model, cells obtained from
a tumor arising
from transplanted B38.1+CD24- cells were heterogeneous with respect to
expression of both
CA 02417909 2003-01-31
WO 02/12447 PCT/US01/24243
63
B38.1 and CD24. The marker expression pattern of the cells isolated from the
tumor initiated by
the B38.1+CD24" cells was similar to that of the original tumor.
[235] These results are a proof-of-principle of the solid tumor stem cell
model of solid cancer
and demonstrate the following:
(1) tumor cells are phenotypically and functionally heterogeneous;
(2) by separating cells by FACS, one can enrich for tumorigenic cells; and
(3) by testing the tumorigenic fractions, one can isolate tumor stem cells and
more
carefully focus strategies for identifying therapeutic targets.
EXAMPLE 4
ANALYSIS OF PRIMARY BREAST TUMOR CELLS IN A MOUSE MODEL
[236] We have established tumors from eight patients in our mouse model. We
also
characterize tumors established from three primary tumors and two pleural
effusions. Two are
fast growing tumors and three are slow growing tumors.
[237] The phenotype of the tumorigenic cell is determined for each different
tumor. For
analysis, a tumor is removed from the mice and made into a single cell
suspension. We first
confirm the solid tumor stem cell model of the invention and that the
phenotype of tumorigenic
cells is indeed B38.1+ CD44+ CD2441 . In all tumors, we do limiting dilution
analysis of cells
isolated by FACS based upon expression of these markers.
[238] Based on our preliminary data, the antibody cocktail that leads to the
greatest purification
of the putative tumorigenic cell follows: anti-38.1-APC, anti-CD44-FITC, and
anti-CD24-PE,
anti-CD3-cytochrome, anti-CD2-cytochrome, anti-CD10-cytochromeõ anti-CD14-
cytochrome,
anti-CD16-cytochrome, anti-CD31-cytochrome, CD45-cytochrome, CD140b-
cytochrome,
anti-CD64-cytochrome, anti-ESA-Phar-red and 7AAD (a viability marker). All
antibodies
labeled with cytochrome are considered to be part of a lineage cocktail
(LINEAGE). FACS is
used to isolate the putative breast cancer stem cell, which in xenograft tumor
Ti are the
CD44+CD2441 LINEAGE- population of cells ,the CD44+B38.1+CD2441 LINEAGE
population
of cells are more enriched, and the ESA+CD44+B38.1+CD2441 LINEAGE" population
of cells are
most enriched for the breast cancer stem cell. The different populations of
malignant cells are
tested in the in vivo and in vitro models to confirm that the phenotype of the
primary tumorigenic
cell does not change while growing in the mouse xenograft model. As we
progressively enrich
the tumorigenic cells, the number of cells and time needed to form a tumor
decreases.
CA 02417909 2003-01-31
WO 02/12447 PCT/US01/24243
64
EXAMPLE 5
ROLE FOR NOTCH IN BREAST CELL PROLIFERATION
[239] The Notch protein is a receptor for the growth/survival factors Delta
and Jagged (Panin et
al., Nature 387(6636): 908-912 (1997); Perron et al., Cellular & Molecular
Life Sciences 57(2):
215-23 (2000); Shimizu et al., Journal of Biological Chemistry 274(46): 32961-
9 (1999)). In
some normal stem cells, Notch is known to play a role in proliferation,
survival and
differentiation. Apelqvist et al., Nature 400(6747): 877-81 (1999); Berry et
al., Development
124(4): 925-36 (1997); Yasutomo et al., Nature 404(6777): 506-10 (2000);
Morrison, Cell 101:
499-510 (2000). In certain situations, stimulation of Notch can promote stem
cell self-renewal
while in other situations it can promote differentiation. Delta activates all
four Notch receptors.
[240] We examined Notch 4 expression in the breast cancer tumor cells. Notch 4
was expressed
on the minority of the tumor cells. When the B38.1 population, which
identifies the tumorigenic
population, was analyzed for Notch 4 expression, a distinct minor population
of cells that were
B38.11 and Notch 4+ became apparent.
[241] We sorted Notch 4+ and Notch 4" cells and analyzed their ability to form
colonies in vitro.
Surprisingly, neither population grew in tissue culture. There are two
possible explanations.
First, it is possible that interaction between the two populations of cells is
required for cell
growth. Alternately, the antibody may be either an agonist or antagonist of
Notch 4 and
inhibition or activation of the receptor may inhibit tumor cell growth.
[242] To distinguish between these possibilities, unseparated tumor cells were
incubated with
the anti-Notch 4 antibody, and then assayed for the ability to form colonies
in vitro. While
control cells grew in tissue culture and formed colonies (FIG. 5A), cells
incubated with the
Notch 4 antibody did not grow (FIG. 5B). When the anti-Notch 4 antibody was
pre-incubated
with the peptide used to generate the antibody (this peptide should
theoretically block binding of
the antibody to the cells), the ability of the tumor cells to form colonies
was restored (FIG. 8C).
To confirm that Notch regulates colony formation by tumor cells, cells were
incubated in
medium with or without soluble Delta (FIG. 5A and FIG. 5D, respectively). The
cultures with
Delta formed many colonies (FIG. 5A), whereas only a few small colonies formed
in medium
lacking soluble Delta or in cultures using cells exposed to the anti-Notch 4
antibody (FIG. 5B,
FIG. 5D, and FIG. 5E). Taken together, these results show that the Notch 4
pathway regulates
the proliferation/survival of breast cancer cells in cells and that the anti-
Notch 4 antibody blocks
activation in vitro.
[243] Next, tumor cells were incubated with the anti-Notch 4 antibody and then
the cells were
injected into mice to determine whether the antibody inhibits tumor formation.
The cells that
CA 02417909 2003-01-31
WO 02/12447 PCT/US01/24243
were exposed to the anti-Notch 4 antibody formed smaller tumors than cells
that were exposed to
the anti-Notch 4 antibody that was incubated with the peptide used to generate
the antibody
before addition to the cells. Approximately 350,000 tumor cells were incubated
with no
antibody, the anti-Notch 4 antibody, or the anti-Notch 4 antibody that had
been incubated with
the peptide used to generate the antibody. After two weeks, the diameter of
tumors formed by the
cells exposed to the anti-Notch 4 antibody was 40% smaller than either of the
control tumors.
The simplest explanation of the in vitro and in vivo assays is that Notch 4
activation promotes
proliferation/survival of stem cells and that the anti-Notch 4 antibody blocks
receptor activation.
EXAMPLE 6
FURTHER CHARACTERIZATION OF BREAST CANCER STEM CELLS
[244] Human breast cancer tumors have been established in NOD/SCID mice from
five tumors
(mastectomy specimens of three primary breast tumors and two malignant pleural
effusions from
metastatic breast cancer). The five tumors were initially used to understand
neoplastic cell
marker heterogeneity. Based upon these results, experiments using cells
isolated from primary
tumors directly after removal from a patient were done to confirm that the
mouse xenograft
model accurately reflects human breast cancer.
[245] CD44 expression and tumorigenicity. Cells obtained from the metastatic
breast cancer,
designated T1 , and one primary breast tumor, designated T2, were chosen to
expand in the mice
to obtain sufficient cells for analysis. To accomplish this, 106-107 pleural
effusion cells from Ti
(a frozen sample) or a 1-2 mm3 piece of T2 (fresh biopsy sample) were grown in
the mouse
mammary fat pad for 1 to 3 months. The resulting human tumors were then
harvested, made into
a single cell suspension and analyzed by flow-cytometry for expression of
several different
antigens. Contaminating mouse cells were gated out of the analysis by
eliminating cells
expressing mouse H-2K (major histocompatibility complex class I) and dead
cells were
eliminated using a viability dye.
[246] As predicted by the solid tumor stem cell model, cells displayed
heterogeneous
expression of a variety of cell surface-markers including CD44 and B38.1. To
determine whether
these markers could distinguish tumorigenic from non-tumorigenic cells, CD44 +
and CD44- cells
(FIG. 6) were isolated from these in vivo passaged Ti or T2 cells and NOD/SCID
mice were
injected with CD44 + or CD44- cells.
[247] Identification of other informative markers. Between 6 and 12 weeks
after injecting, mice
were examined for tumors by observation and palpation, then all mice were
necropsied to look
for growths at injection sites that might be too small to palpate. All of the
CD44 + injections gave
CA 02417909 2003-01-31
WO 02/12447 PCT/US01/24243
66
rise to visible tumors, but none of the CD44" injections formed detectable
tumors (TABLE 5).
Next, cells from first passage Ti and T2 were sorted based upon the expression
of B38.1 and
injected into mice. Tumors appeared from all injections of B38.1+ cells but no
tumor formation
was detected from B38.r cells (TABLE 5). Thus, tumorigenic cells from both
passaged tumors
were B38.1+CD44+.
TABLE 5
Tumorigenicity of different populations of tumor Ti and tumor T2 cells
# tumors/# of injections
Cells/injection 8x10⁵ 5x10⁵ 2x10⁵
Ti cells
CD44- 0/2 0/2
CD44" 2/2 2/2 '
B38.1- 0/2 0/2
B38.1 2/2 2/2
CD24 1/6
CD24- 6/6
T2 cells
CD44- 0/2 0/2
CD44 2/2 2/2
B38.1- 0/2 0/2 - ,
B38.1' 2/2 2/2
CD24 1/6
CD24- 6/6
Cells were isolated by flow cytometry as described in FIG. 2 based upon
expression of
the indicated marker and assayed for the ability to form tumors after
injection of 2-8x10⁵
cells into the mammary fat pad of NOD/SCID mice. The number of tumors that
formed/
the number of injections that were performed is indicated for each population
of cells.
[248] The tumors were also heterogeneous for CD24 expression. When 200,000
CD24+ or
CD24-/I0 cells were injected into NOD/SCID mice, all mice injected with CD2441
cells grew
tumors (TABLE 5). Although no tumors could be detected by palpation in the
locations injected
with CD24+ cells, two of twelve mice injected with CD24+ cells did contain
small growths at the
injection site that were detected only upon necropsy. The sites injected with
CD24-a cells, by
contrast, all had tumors greater than 1 cm in diameter that were readily
apparent visually and by
palpation. Since it is extremely difficult to completely eliminate CD24- cells
from the CD24+
fraction by flow-cytometry, the small growths likely represent contamination
by the 1-3% of
CD24- cells that are typically present in the sorted CD24+ population.
Alternately, the small
growths might have arisen from CD24+ cancer cells that had reduced
proliferative capacity. At
CA 02417909 2003-01-31
WO 02/12447 PCT/US01/24243
67
present we cannot distinguish between these possibilities. Nonetheless, all of
the cells that
produced palpable tumors in this xenograft model were B38.1+CD44+CD24J1 .
[249] Several antigens associated with normal cell types, to which we refer
collectively as
LINEAGE (CD2, CD3, CD10, CD14, CD16,CD19, CD31, -CD45, -CD64 and -CD140b)
markers, were found not to be expressed by the cancer cells based on analyses
of tumors that had
been passaged multiple times in mice. By eliminating LINEAGE + cells, normal
human
leukocytes, endothelial cells, and fibroblasts were eliminated, especially
from unpassaged or first
passage tumors.
[250] Flow-cytometric analysis of four of the tumors established in NOD/SCID
mice revealed
that all of these tumors were heterogeneous with respect to B38.1, CD44, and
CD24 expression
(see, for example, FIG. 7A, FIG. 7B). However, each of the tumors contained a
distinct
population of B38.1+CD44+CD24410 cells. In four independent tumors that were
analyzed after
one passage in NOD/SCID mice, the frequency of B38.1+CD44+CD2441 cells was
9.5 4.5 %
(mean standard deviation) of live human tumor cells. Seven weeks after
inoculation, the
injection sites of B38.1 CD44+CD244 LINEAGE- cells and
B38.1+CD44+CD24+LINEAGE"
cells were examined by histology. The B38.1+CD44+CD2441 LINEAGE- injection
sites
contained tumors greater than 1 cm in diameter while the
B38.1+CD44+CD24+LINEAGE"
injection sites contained no detectable tumors. Only normal mouse mammary
tissue was seen by
histology at the sites of the B38.1+CD44+CD24+LINEAGE- injections (FIG. 7K),
whereas the
tumors formed by B38.1+CD44+CD2441 LINEAGE" cells contained malignant cells as
judged
by morphology in hematoxylin and eosin stained sections (FIG. 7L). Even when
B38.1+CD44+CD24+LINEAGE- injection sites were examined after 11 weeks, no
tumors were
= detected.
[251] Enrichment of tumorigenic cells using B38.1, CD44, CD24, and LINEAGE
markers. Ti,
T2, and T3, a third tumor that had been passaged once in NOD/SCID mice, were
tested to
determine whether tumorigenic cells could be enriched based upon expression of
B38.1, CD44,
CD24 and LINEAGE markers. In all cases, the B38.1+CD44+CD2441 cells were
markedly
enriched for tumorigenic cells. When injecting unsorted Ti or T2 cells, 5x10⁴
cells consistently
gave rise to a tumor, but 104 cells gave rise to tumors in only a minority of
cases (TABLE 6). In
contrast when B38.1+CD44+CD2441 LINEAGE- cells were isolated from Ti or T2
(FIG. 7), as
few as 103 cells from this population were able to give rise to tumors in all
cases (TABLE 6,
FIG. 7J and FIG. 7L). Cells that were B38.1+CD44+LINEAGE- but CD24 + failed to
form
tumors. These data indicate that the B38.1+CD44+CD2441 LINEAGE" population is
at least 10-
CA 02417909 2003-01-31
WO 02/12447 PCT/US01/24243
68
fold enriched for the ability to form tumors in NOD/SCID mice relative to
unfractionated tumor
cells. This population accounted for 4-17% of the cells in Ti and T2 (5-23% of
cancer cells).
EXAMPLE 7
ANALYSIS OF PRIMARY HUMAN TUMOR CELLS
[252] To rule out the possibility that the tumorigenic activity in the
enriched population of
EXAMPLE 7 arose as a result of propagation in the xenograft model, we isolated
unfrozen
pleural effusion breast cancer cells based upon expression of CD44 and CD24.
Approximately
11% of the neoplastic cells were CD44+CD2441 LINEAGE" and 75%
CD44+CD24+L1NEAGE-.
All three injections of 100,000 CD44+CD2eLINEAGE-, but none of the
CD44+CD24+LINEAGE" cells, formed tumors (TABLE 6). We next tested whether the
B38.1+CD44 CD2441 population from unpassaged breast tumor specimens (FIG. 71)
was
tumorigenic. Of four independent tumors that were analyzed after being
passaged in mice, there
were only enough frozen unpassaged cells available of Ti to permit flow-
cytometry. In addition,
frozen unpassaged cells from a fifth patient (T5) were analyzed. Five percent
of unpassaged Ti
cells and 35% of unpassaged T5 cells were B38.1 CD44+CD2441 LINEAGE.
[253] All 40,000 B38.1+CD44+CD24-11 LINEAGE" cells or 40,000
B38.1+CD44+CD24+LINEAGE" cells that were isolated by flow-cytometry from
unpassaged Ti
were injected into a single mouse. From the unpassaged T5 cells, 60,000-
100,000 cells of the
B38.1+CD44+CD2441 LINEAGE" (FIG. 71) and B38.1+CD44+CD24+L1NEAGE- (FIG. 7F)
populations were isolated and injected into each of three NOD/SCID mice. The
CD2441
population formed tumors from the Ti cells and in 2 of 3 injections from T5
cells, but the CD24+
population never formed tumors, demonstrating that the tumorigenic population
identified in the
passaged tumors also existed in the unpassaged Ti and T5 samples. When tumors
that arose
from the unpassaged Ti cells were analyzed, the frequency of B38.1+CD44+CD2441
LINEAGE-
cells was similar in both passaged and unpassaged Ti samples.
CA 02417909 2003-01-31
WO 02/12447 PCT/US01/24243
69
TABLE 6
Tumorigenic breast cancer cells are highly enriched in the CD44+B38+CD24"
population
Number of tumors/number of injections for each cell dose
Cells/injection 5x10⁵ 1x10⁵ 5x10⁴ 2x10⁴ 1x10⁴ 5x10³ 1x10³ 5x10² 2x10²
Ti cells (xenograft)
Unsorted 4/4 4/4 6/6 - 2/6 -
0/6
B38.1+CD44+CD24+ - - 0/5 0/5 0/5 0/5
B38.1+CD44+CD24" - 5/5 5/5 5/5 5/5
ESA1338+CD24- - 8/8* 2/2 1/2
ESA-B38+CD24" - 0/8* 0/2 0/2
T2 cells (xenograft)
Unsorted 4/4 4/4 4/4 - 1/6 -
0/6
B38.1+CD44+CD24+ - - 0/5 0/5 0/5 0/5
B38.1+CD44+CD24" - - 5/5 5/5 5/5 5/5
T3 cells (xenograft)
B38.1+CD44+CD24+ - - 0/2 -
B38.1+CD44+CD24" - - 2/2 -
T5 cells (primary cells)
CD44+CD24+ 0/3
CD44+CD24" 3/3
Ti cells (primary cells)
B38.1+CD44CD24+ 0/1
B38.1+CD44+CD24- 1/1
T6 cells (primary cells)
B38.1FCD44+CD24+ 0/1 0/2
B38.1+CD44+CD24" 1/1 1/2
Cells were isolated from first passage tumor Tl, tumor T2, or tumor T3 cells.
B38.1+CD44+CD244 LINEAGE" and B38.1+CD44+CD24+LINEAGE cells were isolated by
flow-cytometry
as described in FIG. 3. The indicated number of cells of each phenotype was
injected into the mammary fat
pad of NOD/SCID mice. The number of tumors that formed from injections of each
group of cells is
indicated. Note that isolation of B38.1+CD44+CD244ITINEAGE" cells results in
more than a ten-fold
enrichment in tumorigenic cells and that no tumors arose from injection of
B38.1+CD44+CD24+LINEAGE
cells. When cells were sorted as ESA+ in addition to B38.1+CD24, injections of
as few as 200 cells gave rise
to a tumor, an approximately 50-fold enrichment in tumorigenicity relative to
unsorted cells.* for these
injections 2x10³ cells were used instead of 1x10³.
EXAMPLE 8
FURTHER CHARACTERIZATION OF THE CELL POPULATIONS FROM A BREAST
CANCER TUMOR
[254] In one tumor, tumorigenic cells were further enriched by selecting the
ESA+ subset of the
B38.1+CD44+CD2441 population. When ESA+CD44+CD244 LINEAGE" cells were
isolated
from Ti (FIG. 8A), as few as 200 cells from this population were able to give
rise to a tumor
while injection of 2,000 B38.1+CD2441 LINEAGE" but ESA" cells failed to form
tumors in any
case (TABLE 6). At least 10,000 unfractionated cells were required to form any
tumors. Thus,
the ESA+B38.1+CD2441 IINEAGE population was at least 50 fold enriched for the
ability to
CA 02417909 2003-01-31
WO 02/12447 PCT/US01/24243
form tumors relative to unsorted tumor cells. The ESA+B38.1+CD2441 LINEAGE-
population
accounted for 2-4% of Ti cells (2.5-5% of cancer cells). The ESA+1338.1+CD2441
LINEAGE"
and the non-tumorigenic cells were examined by cytology and both populations
consisted of
malignant cells that were virtually indistinguishable in appearance.
EXAMPLE 9
USE OF CANCER STEM CELLS TO IMPROVE TISSUE CULTURE CONDITIONS FOR
GROWTH OF BREAST CANCER CELLS
[255] In tissue culture, it has long been known that only a minority of
primary tumor cells are
capable of forming colonies. According to the solid tumor stem cell model,
while the
non-tumorigenic population of cells might retain some ability to proliferate,
the tumorigenic
population of cells would have a greater capacity to do so. Equal numbers of
the tumorigenic
phenotype and the non-tumorigenic cells, isolated either directly from a
primary tumor or from
tumor Ti and tumor T4 growing in mice, were seeded at clonal density in tissue
culture plates
and colony formation was measured. The primary patient cells were from an
aliquot of frozen
primary cells from a tumor that easily forms a breast cancer cell line and
proliferates well in
tissue culture.
[256] Cytology showed that each population contained cancer cells of
epithelial origin (FIG. 9).
[257] Initially, colonies formed from not only the tumorigenic cells but in
some tumors also
from the non-tumorigenic cells (FIG. 9). However, by day twelve, the colonies
formed by the
tumorigenic cells had grown while the non-tumorigenic cells had died (FIG. 9).
By day 14, only
B38.14-CD44+CD24+LINEAGE- cells formed numerous large colonies of cancer cells
(FIG. 9C).
[258] We have passed these cells in tissue culture over 3 passages, and the
epithelial neoplastic
cells continue to proliferate. By contrast, the non-tumorigenic cells were
capable of forming only
small colonies consisting of 2-4 cells that stopped proliferating after a few
days (FIG. 9C).
[259] These results illustrate two important points. First, the phenotype of
the stem cells is not
an artifact of the immune-deficient mouse assay. The fact that the
phenotypically identical
population of cells had increased proliferative ability in both the mouse
xenograft model and the
in vitro assays shows that this population is the tumorigenic population of
cells found in patients
with breast cancer.
[260] Second, at least some of the non-tumorigenic cells have the capacity for
limited
proliferation. This shows that the markers used to identify the non-
tumorigenic population were
not simply selecting for cells that lacked viability.
CA 02417909 2010-11-01
71
[261] These results of this EXAMPLE provides a solution to the problem that
the use of the in
vitro clonogenic assay to predict chemotherapy drug sensitivity frequently
does not predict a
particular patient's response to therapy. In one of the tumors used in this
EXAMPLE, the
non-tumorigenic population of cells formed colonies almost as efficiently as
the tumorigenic
cells (the solid tumor stem cells of the invention) on day 4. In using this
tumor for a drug-
screening assay, if the non-tumorigenic and tumorigenic cells that are
clonogenic in vitro
respond differently to a particular test compound, then the assay, especially
if scored early,
would not have reflected the ability of the test compound to eliminate breast
cancer stem cells in
vivo.
EXAMPLE 10
THE STEM CELL POPULATION REGENERATES BOTH THE STEM CELL AND THE
NON-TUMORIGENIC POPULATIONS OF CELLS
[262] According to the deterministic solid tumor stem cell model (FIG. 1B),
B38.1+CD44+CD2441 LINEAGE tumorigenic cells form tumors that contAin
additional
B38.14-CD44+CD2441 LINEAGE" tuinorigenic cells as well as phenotypically
heterogeneous
populations of non-tumorigenic cells. Classical models would suggest that
tumors that form from
B38.1+CD44+CD2441 LINEAGE cells consist solely of expanded numbers of
B38.1+CD44+CD2441 LINEAGE- cells.
[263] Tumors arising from 1,000 B38.1+CD44+CD2441 LINEAGE cells were
dissociated and
analyzed by flow-cytometry with respect to B38.1, CD44 and CD24 expression
(FIG. 10). As
expected from the deterministic solid tumor stem cell mode, cells obtained
from a tumor arising
from transplanted B38.1+CD44+CD2441 LINEAGE cells were heterogeneous with
respect to
expression of all markers (FIG. 10C and FIG. 10F). In both cases, the marker
expression pattern
of the cells isolated from the tumor initiated by the B38.1+CD44+CD2441
LINEAGE" cells was
similar to that of the original tumors (compare FIG. 10A and FIG. 10B with
FIG. 10C and FIG.
10F).
[264] We tested whether the tumors formed by B38.1+CD44+CD2441 LINEAGE" cells
contained
tutnorigenic B38.1+CD44 CD2441 LINEAGE cells in addition to other non-
tumorigenic cells.
B38.1+CD44+CD24411INEAGE cells or B38.1+CD44 CD24+LINEAGE cells were isolated
from second passage Ti tumors that had been initiated by injections of 1,000
B38.1+CD44+CD2441 LINEAGE cells seven weeks earlier. 1,000 cells were used per
injection
into each of four animals in an attempt to establish third passage tumors. As
with the original Ti
and T2 tumors, all four of the injections of B38.1+CD44+CD2441 LINEAGE-
population, but
CA 02417909 2003-01-31
WO 02/12447 PCT/US01/24243
72
none of the B38.1+CD44+CD24+LINEAGE- population, gave rise to new tumors.
[265] This EXAMPLE demonstrates that the B38.1+CD44+CD2441 LINEAGE- population
gives rise to both additional tumorigenic B38.1+CD44+CD2441 LINEAGE" cells and
phenotypically distinct non-tumorigenic cells.
EXAMPLE 11
EXPRESSION OF POTENTIAL THERAPEUTIC TARGETS BY THE DIFFERENT
POPULATIONS OF NEOPLASTIC CELLS
[266] In the deterministic solid tumor stem cell model (FIG. 1B), expression
of genes by the
tumorigenic and non-tumorigenic populations of tumor cells may differ.
Accordingly, the
inability of current cancer treatments to significantly improve outcome is due
to the tendency of
therapeutics to target non-tumorigenic cells but not the rare tumorigenic
solid tumor stem cells.
If only the non-tumorigenic populations are killed by particular therapies,
then tumors may
shrink, but the remaining tumorigenic solid tumor stem cells can drive
regrowth of the tumor.
[267] We examined first passage Ti cells for expression of either the EGF
receptor (EGF-R) or
HER2/neu. The EGF-R and HER2/neu are potential therapeutic targets that have
been implicated
in breast cancer cell proliferation. Tumorigenic Ti cells stained with lower
levels of anti-EGF-R
antibody than non-tumorigenic cells, and EGF-R expression could not be
detected at the single
cell level in tumorigenic cells (FIG. 11).
[268] To test whether cells that did not express detectable levels of the EGF-
R were
tumorigenic, 1,000-2,000 EGFR-B38.1+ CD24-LINEAGE- cells were injected into
NOD/SCID
mice. Tumors formed in four out of four cases, confirming that the EGF-R-
cells are tumorigenic.
By contrast, we could not detect a substantial difference in HER2/neu
expression between
tumorigenic and non-tumorigenic Ti cells (FIG. 11B and FIG. 11E).
[269] As expected from the solid tumor stem cell model, 1,000-2,000
HER2/neu+B38.1+CD24-LINEAGE- cells gave rise to tumors in four out of four
cases. This
EXAMPLE shows that there can be differences in the expression of therapeutic
targets between
the tumorigenic and non-tumorigenic populations.
[270] These experiments serve as a proof-of-principle of our stem cell model
of solid cancer
and demonstrate the following:
(a) tumor cells are phenotypically and functionally heterogeneous;
(b) by separating cells by FACS one can enrich for tumorigenic cells; and
(c) by studying the tumorigenic fractions, one can isolate solid tumor stern
cells to more
carefully focus molecular and biological assays.
CA 02417909 2003-01-31
WO 02/12447 PCT/US01/24243
73
EXAMPLE 12
FURTHER EVIDENCE FOR A ROLE FOR NOTCH IN BREAST CELL PROLIFERATION
[271] To determine whether Notch was a solid tumor stem cell marker, we sorted
Notch 4+ and
Notch 4- cells and analyzed their ability to form colonies in vitro.
Surprisingly, neither
population grew in tissue culture.
[272] There are two possible explanations for these results. First,
interaction between the two
populations of cells may be required for cell growth. Alternately, the
antibody may be either an
agonist or antagonist of Notch 4 and inhibition or activation of the receptor
may inhibit tumor
cell growth. To distinguish between these possibilities, unseparated tumor
cells were incubated
with the anti-Notch 4 antibody, and then assayed for the ability to form
colonies in vitro in tissue
culture medium_containing soluble Delta, a Notch ligand. Delta was essential
for colony
formation from cells isolated from this tumor. While control cells grew in
tissue culture and
formed colonies (FIG. 12A), cells incubated with the Notch 4 antibody did not
grow (FIG. 12B).
When the anti-Notch 4 antibody was pre-incubated with the peptide used to
generate the
antibody (this peptide should theoretically block binding of the antibody to
the cells), the ability
of the tumor cells to form colonies was restored (FIG. 12C). An anti-Notch 2
antibody did not
affect colony formation.
[273] To confirm that Notch regulates colony formation by tumor cells, cells
were incubated in
medium with or without soluble Delta (FIG. 12A and FIG. 12D, respectively).
The cultures with
Delta formed many colonies (FIG. 12A), whereas only a few small colonies
formed in medium
lacking soluble Delta or in cultures using cells exposed to the anti-Notch 4
antibody (FIG. 12B,
FIG. 12D, and FIG. 12E). Taken together, these data suggest that the Notch 4
pathway regulates
the proliferation/survival of breast cancer cells in cells and that the anti-
Notch 4 antibody blocks
activation 772 vitro.
[274] We also tested whether the anti-Notch 4 antibody inhibits breast cancer
tumor cell growth
in vivo. To do this, 20,000, 10,000 or 5,000 tumorigenic cells were incubated
with the anti-Notch
4 antibody or the anti-Notch 4 antibody and the blocking peptide. The antibody
delayed the
appearance of the tumors by one week when either 20,000 or 10,000 tumorigenic
cells were
injected, and by 13 days when 5,000 cells were injected. This suggests that
the antibody may
block tumor formation in vivo.
[275] We then tested four breast cancer cell lines for expression of Notch 4
and growth
inhibition by the anti-Notch 4 antibody. We found that the MCF-7 and the SKBR-
3 breast cancer
cell lines expressed Notch 4 and that the anti-Notch 4 antibody inhibited the
growth of these
CA 02417909 2003-01-31
WO 02/12447 PCT/US01/24243
74
cells. RT-PCR showed that both expressed Notch 4. To determine whether the
anti-Notch 4
antibody inhibits growth, 5,000 MCF-7 cells were incubated with the anti-Notch
4 antibody, the
anti-Notch 4 antibody and the peptide used to generate the antibody, or an
irrelevant control
antibody. The anti-Notch 4 antibody, inhibited colony formation of both cell
lines by more than
ten-fold.
[276] This EXAMPLE shows that Notch 4 activation promotes
proliferation/survival of solid
tumor stem cells and that the anti-Notch 4 antibody blocks receptor
activation.
EXAMPLE 13
TARGETING BREAST CANCER STEM CELLS WITH A GENE THERAPY SUICIDE
VECTOR
[277] The breast cancer stem cell comprises a minority of the tumor cells in a
breast tumor. It is
an object of the invention that gene therapy strategies target these cells
(FIG. 13).
[278] We targeted virus vectors to breast cancer stem cells using markers
expressed by stem
cells. To do this, we stained different cell lines with the B38.1 antibody and
analyzed them by
flow cytometry. MCF7, SKBR3, T47D and BT474 breast cancer cell lines were
highly positive.
We had the anti-fiber and the B38.1 antibodies conjugated with the Prolinx
(Prolinx, Inc.,
Bothell, WA, USA) method (FIG. 14, see Douglas JT et al., Nature
Biotechnology.
14(11):1574-8 (1996)). When we mixed the modified anti-knob and anti-B38.1
antibodies
together, they became cross-linked and generated the bi-specific conjugate
(FIG. 15). The
anti-fiber antibody part of the conjugate binds to the adenovirus, while the
anti-B38.1 moiety
binds to the breast cancer stem cell. Incubation of the AdLacZ virus with the
anti-fiber alone
blocks the infectivity of the virus (FIG. 16). If we incubate the virus with
the bi-specific
conjugate, the infectivity is restored only in the cells that express high
levels of the B38.1 antigen
(FIG. 18). The re-targeting is specific, because it can be inhibited by free
B38.1 antibody (FIG.
18).
[279] The conclusion is that the new bi-specific conjugate modifies the
infectivity of
Adenovirus, blocking its natural tropism and directing the infection to cells
that express the
breast cancer stem cell surface marker.
EXAMPLE 14
DOWNSTREAM TARGETS IN THE BREAST CANCER STEM CELLS
[280] The methods used in this EXAMPLE provide guidance for the development of
Notch-related and other anti-cancer therapies using the cancer stem cells of
the invention. We
CA 02417909 2003-01-31
WO 02/12447 PCT/US01/24243
use array technology to begin to understand the molecular pathways that might
be regulated by
Notch-signaling induced by specific Notch ligands. Sequence verified human
cDNAs from
Research Genetics, provided by the University of Michigan Microarray Network,
are arrayed by
the Cancer and Microarray Facility. Probes are prepared from self-renewing
breast cancer stem
cells or cells from the various populations of cells found in a tumor. Probes
are hybridized to the
arrays and the hybridization patterns are read by the Cancer and Microarray
Facility. We then
analyze the hybridization patterns to identify genes that hybridize to probe
from the breast cancer
stem cells stimulated with various Notch ligands and non-stimulated cells.
Such genes may
represent those that are involved in the regulation of breast cancer cell
survival or self-renewal.
[281] Preparation of microarrays. We have used the microarray technology to
analyze gene
expression of hematopoietic stem cells. We now extend this work to cancer stem
cells.
[282] The University of Michigan Microarray Network currently has 32,500
sequence verified
human cDNAs from Research Genetics. A "cancer" chip has been assembled in
collaboration
with the NCI. This chip contains a comprehensive constellation of 1,200 genes
involved in
proliferation and tumorigenesis. There is also an "apoptosis chip" developed
by the University of
Michigan that contains all genes known to be involved in programmed cell
death. Note that the
HES genes, known to be downstream targets of Notch, are included in the
arrays.
[283] Preparation of probe from breast cancer stem cells. Messenger RNA is
isolated either
from freshly purified breast cancer stem cells or from breast cancer stem
cells incubated in the
presence or absence of various Notch ligands. The RNA is amplified if
necessary, such as by
PCR or linear RNA amplification Wang et al., Nature Biotechnology. 18: 457-459
(April 2000).
Probe are prepared by reverse transcription from an oligo-dT primer, and
labeled by
incorporating CY3 orCY5 conjugated nucleotides. Gene expression profiles are
examined using
probe prepared from freshly isolated, uncultured breast cancer cells, as well
as from cultured
breast cancer cells, such as cells that have been exposed to the appropriate
Notch ligands
(including Fringe family members, either singly or in combination as
determined by which
ligands are expressed by the different populations of tumor cells. To do these
assays, we expose
the cells to a soluble form of Delta or Jagged family members in which the
transmembrane
region has been deleted, or one of the Fringes. The Fringes are secreted
proteins. We make
recombinant protein of each Notch ligand of the Delta, Jagged and Fringe
families from insect
cells or mammalian cells transfected with a baculovirus or mammalian
expression vector,
respectively.
[284] Comparisons of gene expression patterns between control breast cancer
tumorigenic cells
and tumorigenic cells exposed to various Notch ligands are made. Probe from
breast cancer stem
CA 02417909 2003-01-31
WO 02/12447 PCT/US01/24243
76
cells from each tumor is combined with probe labeled with a different fluor
made from cultured
breast cancer stem cells exposed to various Notch ligands to compare their
hybridization
patterns. To do this, breast cancer stem cells are isolated by FACS. Cells are
seeded at single cell
density to preclude Notch interactions between cells. Cells are exposed to
soluble forms of Delta
(see, EXAMPLE 6), Delta-like, Jagged 1, Jagged 2, or each of the Fringes.
Cells are exposed to
each protein both alone and in combinations suggested by the Notch-ligand
expression pattern of
individual cell populations. The microarrays hybridized with probe from each
test condition are
compared and analyzed to gain insights into molecular pathways affected by
Notch ligand
interactions. For example, if a particular population of cells expresses Delta
and Manic Fringe,
then one group of breast cancer stem cells is exposed to Delta alone, a second
to Delta and
Manic Fringe and a third to Manic Fringe alone. cDNA is made from each
population with Cy5
or Cy3 labeling, and used to probe a microarray chip. In addition, cDNA from
each population is
used with cDNA made from cells cultured in control medium and freshly isolated
breast cancer
cells to probe a microarray chip. Each group is compared 5 times to assure
that any differences in
expression profiles of the arrayed genes by each test groups are real.
[285] Preparation ofprobe from cells treated with the anti-Notch 4 antibody.
An antibody
against Notch 4 inhibits growth in vitro and tumorigenesis in vivo. This
effect could be explained
if the antibody acts as either a Notch-4 agonist or antagonist. Since soluble
Delta promotes
cancer cell growth in vitro, the antibody most likely is a Notch 4 antagonist.
To confirm the
mechanism by which the anti-Notch 4 antibody inhibits tumor growth, probe is
made from cells
incubated in the presence or absence of the anti-Notch 4 or control irrelevant
antibody and the
various combinations of the Notch ligands and used for microarray expression
analysis as
described above. Another control group includes cells incubated with the
antibodies and no
Notch ligand. Each comparison is performed in at least six independent tests
employing
independently prepared batches of probe. By comparing the gene expression
patterns of each
group, we should be able to determine how the anti-Notch 4 antibody affects
Notch signaling.
[286] Making the cDNA probe. 1-2 lig of mRNA is commonly used to synthesize
probe for
screening gene expression profiles on microarmys (Wang et al., Nature
Biotechnology. 18:
457-459 (April 2000)). Since we screen a set of three slides (containing a
total of 32,500 cDNAs)
in each test, 6 lug of mRNA is required per assay (reverse transcription of 6
lig of mRNA should
yield around 3 ug of cDNA probe, or 1 lig of probe per slide). Cancer cells
tend to have a high
RNA content. In past assays, 107 cancer cells yielded around 100 lig of total
RNA, which in turn
yielded around 3 ug of poly A+ RNA. Thus in order to generate 6 jig of mRNA,
around 2x10⁷
CA 02417909 2010-11-01
77
cells would be required. As described in the preliminary data, that number of
flow-cytometrically
purified breast cancer stem cells can be isolated from approximately five-ten
1 cm tumors.
[287] The breast cancer stem cells represent approximately 5% of the total
number of cells
within a tumor. It is not practical to isolate more than 106 freshly
dissociated (uncultured) breast
cancer stem cells by flow-cytometry in one day. This would yield less than 0.5
g of mRNA
from one day of sorting. While breast cancer stem can be combined from
multiple days of
sorting to pool enough mRNA to prepare probe from freshly isolated cells, it
may not be
practical to perform all assays in this manner. Some assays require brief
periods of tissue culture.
Plating efficiency of the sorted cells is approximately 10%. Thus it may be
necessary to
enzymatically amplify the template prior to synthesizing probe. This can be
done either by PCR
or by linear amplification of RNA using T7 RNA polymerase. Our protocol
employs 15-18
rounds of PCR to amplify eDNA from small numbers of stem cells. This protocol
was used to
construct a high quality hematopoietie stem cell (HSC) eDNA library and to
make probe from
hematopoietic stem cells. To produce probe from freshly isolated breast cancer
stem cells, we
test the same approach. Alternately, a number of groups have reported success
in using linear
RNA amplification to produce probe for microarray hybridization. Thus we
compare the two
methods by preparing probe both ways and examining the hybridization patterns
that result.
eDNA is primed using an oligo-dT primer that contains a T7 RNA polymerase
binding site and
TM TM
synthesized by Superscript reverse transcriptase (Gibco) and the Clontech 5's
switch oligomer
that allows the tagging of the 5' end of the eDNA. Second strand eDNA is
synthesized using E.
coil DNA polymerase. Then amplified RNA (aRNA) is produced using T7 RNA
polymerase or
PCR. Which of the two that amplification methods are used is determined by
comparing probe
made with standard eDNA synthesis. After preparing alINA, eDNA is re-
synthesized using
random hexamers. This eDNA can then be used for probe, or if necessary,
additional rounds of
amplification can be performed. Both approaches are used to prepare probe from
40,000 MCF-7
cells (a human breast cancer stem cell line). This probe is hybridized to
human cDNA
microarrays along with probe from unamplified MCF-7 cells. The amplification
approach that
most closely reproduces the hybridization pattern of the unamplified probe is
selected. Then
amplification conditions are modified until the amplified probe reproduces the
hybridization
pattern of the unamplified probe as closely as possible.
[288] Analysis of the hybridization pattern. Hybridization patterns are
analyzed in the Cancer
and Microarray Core facility using their laser scanning system. The use of an
integrated system
for arraying, hybridizing, scanning, and analyzing hybridization patterns in
which all
components are provided by Genomics Solutions permits a seamless and efficient
analysis of
CA 02417909 2003-01-31
WO 02/12447 PCT/US01/24243
78
hybridization patterns.
[289] A transcript is differentially expressed if there is at least a 3-fold
difference in normalized
hybridization levels between probes. Hybridization signals from Cy3 and Cy5
labeled probes
within a single test are normalized to each other to correct for potential
differences in the
effective concentration of each probe and replicates of each test are done
using the opposite fluor
for each group to correct for differences in the amounts or labeling
efficiencies of probes.
[290] Verification of differential expression. cDNAs that consistently
hybridize to probe from
groups of cells but not to probe from the control groups of cells are further
characterized. The
sequences of these cDNAs are obtained from the Microarray Network. Two
approaches are used
to confirm the differential expression of candidate genes between cell
populations. The first is to
prepare in situ hybridization probes against candidate genes, and then perform
in situ
hybridizations on breast cancer stem cells cultured in medium with or without
various Notch
ligands as described above. In situ hybridizations are then performed on
cultured cells. The
advantage of this approach would be that expression could be compared at the
level of individual
cells.
[291] An alternate approach is to design nested PCR primers against candidate
genes, and to
perform RT-PCR on multiple 1-10-cell aliquots of freshly purified breast
cancer stern cells
(isolated as described above). By performing RT-PCR on small numbers of cells
it is possible to
observe a difference in the ability to amplify particular transcripts, even if
the "non-expressing"
population contains rare expressing cells. We used this approach to
demonstrate the differential
expression of RGS18 between different subpopulations of multipotent
hematopoietic
progenitors.
[292] Differential expression can be confirmed by Northern analysis. Poly A+
RNA from 1-2 x
107 breast cancer stem cells cultured with or without the Notch ligands, are
hybridized to probes
of the differentially expressed cDNAs. Hybridization signals are
quantitatively compared
between these samples.
[293] We then confirm that genes are differentially expressed at the protein
level. In cases
where immunocytochemical staining is uninformative we also perform western
blots on protein
from the different cells.
[294] Certain molecular analyses are difficult using the primary breast cancer
cells that only
proliferate for prolonged periods of time in the xenografi model. These
analyses can be done in
cell lines. One can use any of a large number of breast cancer cell lines,
including early passages
of lines that we have studied in the past. Clarke et al., Proc. Natl. Acad.
Sci. USA. 92: 11024-28
(November 1995); Hernandez-Alcoceba et al., Human Gene Therapy. 11(11): 20
(September
CA 02417909 2003-01-31
WO 02/12447 PCT/US01/24243
79
2000). These cell lines are plated at single-cell density with and without
various Notch ligands,
as well as the anti-Notch 4 or control antibodies as described in the assays
with the primary
breast cancer cells. If clonogenicity is affected by Notch signaling, then
probe for the microarray
analysis is made using cDNA made form the cell line incubated in medium with
or without the
various Notch ligands or anti Notch 4 or control antibodies. Since a virtually
unlimited number
of cells can be analyzed, we can make probe that has not been amplified.
[295] Finally, cell lines are useful for confirming whether the anti-Notch 4
antibody is an
agonist or antagonist. If a cell line is identified that clonogenicity is
enhanced by soluble Delta
and inhibited by the anti-Notch 4 antibody, then it is used in these assays.
The cells are stably
transfected with a luciferase minigene under the control of the Notch-
inducible HET-1 promoter.
Jarriault et al., Molecular & Cellular Biology. 18(12): 7423-31 (Dec. 1998).
The cells are plated
at single cell density to prevent cell-cell Notch-Notch ligand interactions.
They are treated with
the various combinations of Notch ligands and either the anti-Notch 4 antibody
or a control
antibody. The cells are harvested and a luciferase assay is done to determine
how each condition
affects Notch signal transduction as reflected by transactivation of the HETI
promoter.
[296] A comprehensive functional analysis of candidate genes that emerge from
the microarray
analysis can be performed. Full-length cDNAs are isolated and cloned into a
retroviral
expression vector. Breast cancer cell lines and breast cancer stem cells
isolated from the five
xenograft tumors are infected in vitro and the effect of the retroviral
transgene on self-renewal
and tumorigenicity is assayed relative to clones infected with a control
vector. The transgene is
expressed as a bicistranic message that contains IRES-GFP. This allows
identification of
transduced cells via FACS or fluorescent microscopy. The effect of the
transgene on Notch
signaling is examined in vitro and in vivo. To do this, transduced cells are
tested for response to
the various combinations of Notch ligands found to affect colony formation in
tissue culture and
tumorigenicity in mice.
[297] The expression patterns of candidate genes are examined in detail in
vivo to determine
how widely the genes are expressed beyond the xenograft. In addition to
performing more
extensive in situ hybridizations of tissue sections from slices of primary
breast cancer, we make
antibodies against selected gene products being studied. The Hybridoma Core
facility at the
University of Michigan has extensive experience preparing monoclonal
antibodies using both
peptides, and expressed recombinant proteins.
[298] Ultimately, the functions of unknown genes are tested in vivo, using
gene targeting to
make knockout mice. The University of Michigan Transgenic Core has established
murine ES
=
CA 02417909 2003-01-31
WO 02/12447 PCT/US01/24243
cell technology, they provide ES cells that 'go germline' at a high rate and
assist with the
generation of homologous recombinant ES clones.
[299] The ability of microarray analysis to simultaneously compare the
expression of many
genes provides unparalleled power to screen for changes in gene expression
patterns. Combined
with the ability to purify stem cells and to regulate their self-renewal and
differentiation in vitro,
microarray analyses can be applied with great precision to screen for specific
types of regulatory
genes.
EXAMPLE 15
HOW NOTCH SIGNALING AFFECTS BREAST CANCER TUMORIGENESIS
[300] To verify the importance of Notch in normal mammary growth and
development, we test
the effects of Notch ligands or agonist peptides on the growth and tumor
formation of mammary
tumor stem cells.
[301] Effect of Notch activation on tumor formation in vivo. The effects of
the various
combinations of Notch ligands on tumor formation are correlated with the
microarray data
obtained in EXAMPLE 14. These assays are done using xenograft tumor cells
before and after
enrichment of populations of malignant breast cells, allowing us to
differentiate Notch effects on
both stem and progenitor cells respectively. The effects of Notch ligands on
growth and
differentiation of each population of cancer cells are determined utilizing
the in vivo assay.
[302] To determine the effect of Notch stimulation on tumor growth in vivo,
one thousand, ten
thousand, and one hundred thousand breast cancer tumor cells are incubated
with soluble Notch
ligands, alone or in combination, or control media and then injected (6
replicates of each) into
NOD/SCID mice. The soluble forms of Delta, Delta-like, Jagged 1, and Jagged 2
are used as
well as members of the Fringe family. The cells are incubated with each ligand
individually, as
well as combinations of different ligands, for two hours. The cells are
suspended in Matrigel
with the Notch ligands and then injected into the mice. The effects of each
ligand of Notch
stimulation on both the number of cells needed to form a tumor as well as the
time needed to
form a tumor are determined. This allows us to determine whether Notch affects
tumor growth in
vivo.
[303] In previous EXAMPLES, the anti-Notch 4 antibody retarded tumor formation
after a
single, brief incubation with cells. Next, one thousand, ten thousand, and one
hundred thousand
tumorigenic cells from each of the five xenograft tumors are incubated with
either a control
antibody or the anti-Notch 4 antibody alone, or with various combinations of
Delta, Jagged and
Fringe family proteins. Each group is then mixed in Matrigel containing the
same antibody or
CA 02417909 2003-01-31
WO 02/12447 PCT/US01/24243
81
Notch ligands and injected into mice. The effects of the anti-Notch 4 antibody
on the number of
cells and time needed to form a tumor are measured. The results are correlated
with the
microarray expression data, obtained in EXAMPLE 14.
[304] Stimulation of Notch should drive the proliferation of the normal breast
stem cells. Like
in normal stem cells, members of the Fringe family should modulate Delta or
Jagged signaling.
Notch should also play a role in the self-renewal of the breast cancer stem
cell.
EXAMPLE 15
HUMAN SUBJECTS
[305] The following human sources of material are obtained for use in the
methods of diagnosis
of the invention: (1) primary tumors from patients with breast cancer and (2)
pleural fluid from
patients with metastatic breast cancer. A portion of the tumor or the pleural
fluid is obtained
during routine treatment when the patient's physician deems removal of the
tumor or pleural
fluid to be clinically indicated.
[306] For example, at the University of Michigan Hospital, there is an IRB
approved protocol
to obtain the specimens. Patients are asked to sign an informed consent where
indicated. There
are no additional risks to patients.
EXAMPLE 16
VERTEBRATE ANIMALS
[307] The University of Michigan complies with the Animal Welfare Act as
amended (7 U.S.C.
2131 et seq.), and other Federal statutes and regulations relating to animals.
We use the
laboratory mouse strain NOD/SCID mice and other strains of immunocompromised
mice, such
as Beige/SCID mice.
[308] There should not be any discomfort from cancer cell growth, because mice
undergo
euthanasia prior to development of illness. If the mice do show evidence of
discomfort from
tumors (posture, appetite, or behavior changes, weight loss), they can be
immediately sacrificed.
Should the mice show evidence of more than mild discomfort (posture, appetite,
or behavior
changes) they are given analgesics such as oral morphine or codeine. Mice have
bone marrow
cells inoculated into their retro-orbital vein while anaesthetized with either
ether or a similar
general anesthetic agent.
[309] Mice are killed by the use of CO2, which is consistent with the
recommendations of the
Panel on Euthanasia of the American Veterinary Medical Association. This
method was chosen
because it is safe and humane.
CA 02417909 2003-01-31
WO 02/12447 PCT/US01/24243
82
EXAMPLE 17
CELL CYCLE ANALYSIS OF BREAST CANCER STEM CELLS AND
NON-TUMORIGENIC BREAST CANCER CELLS
[310] We tested cells from a mouse xenograft tumor. The cell cycle status of
the breast cancer
stem cell (FIG. 19A) and non-tumorigenic populations of cells (FIG. 19B) in
the tumor was
determined by flow cytometry. There was a similar distribution of cells in the
Gl, S, and G2/M
phases of the cell cycle in both populations. Thus, both the tumorigenic and
non-tumorigenic
populations exhibited similar cell-cycle distributions.
[311] This EXAMPLE rules out the possibility that all cells that expressed the
solid tumor stem
cell markers were at a particular stage of the cell cycle in the tumor that
was analyzed. By
selecting cells at a particular stage of the cell-cycle by flow-cytometric
sorting of Hoechst
stained tumor stem cells it may be possible to further enrich tumorigenic
activity, just as it has
been possible to enrich hematopoietic stem cell activity by selecting cells
with low levels of
Hoechst staining
EXAMPLE 18
RHODAMINE 123 STAINING OF BREAST CANCER STEM CELLS AND
NON-TUMORIGENIC BREAST CANCER CELLS
[312] The purpose of this EXAMPLE is to examine the activity of the multi-drug
resistance
pump in breast cancer stem cells and the non-tumorigenic cancer cells. We have
stained the
ESA+CD44+CD24"/I'LINEAGE- cells (breast cancer stem cells) and the non-
tumorigenic cells
obtained from one of the xenograft tumors with Rhodamine 123.
[313] One of the major factors that determines the intensity of Rhodamine 123
staining in a cell
is the MDR pump activity that eliminates this dye from the cells. Yumoto R. et
al., Drug
Metabolism & Disposition 29(2): 145-51 (2001); Daoud R. et al., Biochemistry
39(50): 15344-52
(2000). We found that some of the solid tumor stem cells from this tumor
stained less intensely
with Rhodamine 123 than did the non-tumorigenic cancer cells (FIG. 20).
[314] This EXAMPLE shows tumor cell heterogeneity and indicates that MDR pump
activity
may be higher in a solid tumor cells.
CA 02417909 2003-01-31
WO 02/12447 PCT/US01/24243
83
EXAMPLE19
A B38.1+CD44+CD2441 LINEAGE" POPULATION OF CELLS EXISTS IN OVARIAN
CANCER TUMORS
[315] We analyzed cancer cells obtained from both a tumor and ascites fluid
obtained from a
cyto-reduction surgery for a patient with ovarian cancer. Notably, B38.1 is
known to be
expressed by ovarian cancer cells. Surprisingly, the flow cytometry analysis
revealed multiple
cell populations, and there was a distinct B38.1+CD44+CD2441 LINEAGE"
population of cells
(FIG. 21).
[316] This distinct cell population phenotypically resembles the breast cancer
stem cell and
may represent an ovarian cancer stem cell.
EXAMPLE 20
A B38.1+CD44+CD2441 LINEAGE- POPULATION OF CELLS EXISTS IN SARCOMA
TUMORS/ COMPARISON TO BREAST CANCER STEM CELL DATA
[317] The B38.1 antigen had previously been described to be expressed only in
breast cancer
and ovarian cancer. We established two sarcomas by placing sarcoma cells in
the flanks of
NOD/SCID mice that had been treated with VP16. One of the tumors was excised
and examined
by flow cytometry. Surprisingly, the sarcoma cells expressed the B38.1
antigen. Furthermore,
there were three distinct cell populations with respect to CD44: high, low and
negative (FIG. 22).
[318] . Thus sarcoma cells include a CD44+ population that phenotypically
resembles breast
cancer stem cells and that may represent sarcoma stem cells.
CA 02417909 2003-01-31
WO 02/12447 PCT/US01/24243
84
TABLE 7
Tumorigenicity of Different Populations of Tumor Ti and T2 Cells
# tumors/# of injections
Cells/injection 8x10⁵ 5x10 2x10⁵
Ti cells
CD44" 0/2 0/2
CD44" 2/2 2/2
B38.1" 0/2 0/2
B38.1" 2/2 2/2
CD2zr 1/6
CD24" 6/6
T2 cells
CD44" 0/2 0/2
CD44+ 2/2 2/2
B38.1" 0/2 0/2
B38.1" 2/2 2/2
CD24 1/6
CD24" 6/6
Cells were isolated by flow cytometry as described in figure 2 based upon
expression of the indicated
marker and assayed for the ability to form tumors after injection of 2-8x10⁵
cells into the mammary fat
pad of NOD/SCID mice. The number of tumors that formed/ the number of
injections that were
performed is indicated for each population of cells.
EXAMPLE 21
PREPARATION OF POLYNUCLEOTIDE PROBES
[319] Single round RT labeling from total RNA source. The polynucleotides
isolated from
isolated solid tumor stem cells or enriched populations of solid tumor stem
cells can be RNA
extracted from the cells or complementary DNA (cDNA) made from the extracted
RNA.
[320] For some embodiments of the methods of the invention (such as those
involving
hybridization), labeled cDNA is useful. In one embodiment, we use the methods
of single round
RT labeling from total RNA source.
[321] The quality of the RNA coming into a labeling reaction will have a
marked effect on the
quality of the hybridization. RNA preparations that look good by the standard
molecular biology
criteria can give poor results. Typical problems include disperse, fine-grain
noise over the entire
hybridized surface and non-specific binding of fluor to the zones of DNA
immobilization on the
slide. These problems seem likely to have some roots in contaminating
carbohydrate, and as
would be expected with carbohydrate, the problems are exacerbated by ethanol
precipitations
before and after labeling. Very impure preparations frequently produce visible
aggregates if
precipitated after labeling and ethanol precipitation, which are essentially
resistant to
solubilization. It is well known that nucleic acids form strong aggregates
with carbohydrate
when either dried together or when co-precipitated. This interaction is the
basis for nucleic acid
"immobilization onto chromatography supports such as cellulose. To minimize
this sort of
CA 02417909 2010-11-01
problem, we recommend " preparative procedures which use few or preferably no
ethanol
precipitations during RNA preparation and labeling. We use at least the
volumes of extractant
and washing solutions suggested for" the number of cells being processed.
Appropriate or
slightly excessive extraction/wash volumes tend to minimize noise in a
hybridization assay.
[322] Methods that give satisfactory results are Triazol extraction (BRL) and
Rneasy
(Quiagen).
[323] Total RNA is prepared from tissue (from solid tumor or xenograft tumor),
tissue culture
or enriched populations of solid tumor stem cells obtained by flow cytometry.
. We resuspend the
prepared RNA in a volume that produces an RNA concentration of >6 mg/ml in
DEPC water. If
the RNA is recovered from a matrix as the final preparative step, and is still
too dilute, we
concentrate as needed for labeling, using a MicroConm30 (Amicon) determine the
concentration
of the RNA. We test by reading a small sample (A260) in 50 mM NaOH.
[324] For the nucleotide mix, we use 10X low T dNTPs (using 100mM dNTPs from
PharmaciaTM
(St. Louis, MO, USA) [27-2035-02])
TABLE 8
NUCLEOTIDE MIX
Nucleotide mM final (1/10) concentration
dGTP 25 0.5
dATP 25 0.5
dCTP 25 0.5
dTTP 10 0.2
water 415
total volume 500
[325] Fluorescent Nucleotides are from Amersham Life Sciences or Perkin Elmer
Applied
Biosystems Division. We use F1uoroLir1MCy3-dUTP (#401-896) or FluoroLinimCy5-
dUTP. The
Cy 3 and Cy 5 nucleotides come at concentration of 1 mM.
[326] The R110 nucleotide comes at concentration of 0.1 mM, and must be dried
and
resuspended at 0.1 x the initial volume to bring it to 1 mM. Currently, the
factors of labeling
efficiency, fluorescent yield, spectral separation, and tendency toward non-
specific binding make
the Cy3/Cy5 pair the most useful for the detection system.
[327] For the labeling reaction, the primer can be Pharmaciamoligo (dT) 12-18
(27-7858-01).
Unlabeled nucleotide mixes are prepared from Pharmaciaml 00 mM stocks. The
reverse
transriptase is BRL SuperScripitmll (18064-014). The 5X buffer is the buffer
supplied with the
polymerase.
CA 02417909 2010-11-01
86
[328] For use in microarrays, normalization in a two fluor labeling is
achieved by reference to
housekeeping genes distributed through the microarray.
[329] A cocktail of synthetic cDNAs produced using phage RNA polymerases on
cloned E. coli
genes in the pSP64 poly(A) vector as a mass standard and RNA quality standard.
If possible, we
also prepare a total RNA solution containing 100 ng of RNA in 17 pi of DEPC
water.
Otherwise, we ethanol precipitate 100 mg of total RNA to concentrate sample
for labeling
reaction. We take care to remove all residual 70% ethanol wash either by air
drying or vacuum,
as residual ethanol may impede the efficiency of labeling.
[330] We resuspend the pellet in DEPC water to give a fmal volume of 17 ml.
Any residual
precipitate is removed by centrifugation. The RNA is added to the reaction
last.
[331] Fluor nucleotide (NTP) RT labeling: We add the following:
TABLE 9
REVERSE TRANSCRIPTASE LABELING
Component ili
5X first strand buffer 8
Oligo (dT)12-18 (500 p..g/m1) 2
lOXlówdTNTPmix 4
Fluor dUTP (1 IBM) 4
0.1 M DTT 4
RNAsin 1
syn mRNA std (0.06 [ig) 0.5
100mg total RNA 17.0
total 40
[332] We vortex the sample after adding RNAsin. We minimize bubbles and
foaming during
the vortex or quick spin.
[333] Next, we hold at 65 C for 5 minutes, bring to 42 C (program RD. Then,
add 2 11.1 of SSII
enzyme. Make sure enzyme is well mixed into the reaction. Next, incubate 42 C
for 25 minutes.
Add 2 ill of SSII enzyme. Make sure enzyme is well mixed into the reaction.
Then, incubate
42 C for 35 minutes. Add 5 1.11 of 500 mM EDTA. Be sure to stop the reaction
with EDTA
before adding NaOH.
[334] Add 10 ml of 1M NaOH. Incubate at 65oC for 60 minutes to hydrolyze
residual RNA.
Cool to room temperature and add 25 pi of 1 M Tris-Ha (pH 7.5)
[335] For probe cleanup and analysis, we transfer to a Microcolid30,
concentrate to about 20
(approx 3.5 min at 14,000 rpm in Eppendorf 5415C). We wash by adding 200 pi of
TE (pH 7.5)
and concentrating to about 20 p.1(4-4.5 min @ 14,000 rpm). We recover the
product by inverting
CA 02417909 2010-11-01
87
the concentrator over a clean collection tube and spinning for 3 min @ 3000
rpm.
[336] In some cases, the Cy5 probe may produce a gelatinous blue precipitate
which is
recovered in the concentrated volume. The presence of this material signals
the presence of
contaminants. The more extreme the contamination, the greater the fraction of
probe which will
be captured in this gel. Even if heat solubilized, this material tends to
produce uniform, non-
specific binding to the DNA targets.
[337] When concentrating by centrifugal filtration, the times required to
achieve the desired
final volume are variable. Overly long spins can remove nearly all the water
from the solution
being filtered. Then, when fluor tagged nucleic acids are concentrated onto
the filter in this
fashion, they are very hard to remove. Thus, we approach the desired volume by
conservative
approximations of the required spin times.
[338] We take a 20 aliquot of Cy5 probe for analysis, leaving 17-18 pl for
hybridization, then
run this probe on a 2% agarose gel in TAE (gel size is 6 cm wide x 8.5cm long,
2 mm wide
teeth). For maximal sensitivity when running samples on a gel for fluor
analysis, we use loading
buffer with minimal dye and do add ethidium bromide to the gel or running
buffer.
[339] We scan the gel on a Molecular Dynamics Stormfluorescence scanner
(Settings - red
fluorescence, 200 micron resolution, 1000 volts on PMT). A successful labeling
produces a
dense smear of probe from 400 bp to >1000 bp, with little pile-up of low
molecular weight
transcripts. Weak labeling and significant levels of low molecular weight
material indicate a poor
labeling.
[340] Hybridization. The blocking species is poly(dA) from PharmaciEr(27-7988-
01)
(resuspended at 8 rag/m1); yeast tRNA from Sigma (R8759) (resuspended at 4
mg/ral); and CoT1
DNA from Life Technologies Inc. (concentrateed 10 fold to 10 mg/ml).
[341] The volume required for the hybridization is dependent on the size of
array used. For
hybridizations that require small volumes (20-25 pl), the probe volumes after
microconTM
concentration can be too large. If so, then we add the blockers to the Cy3
probe and precipitate
the Cy3 probe.
[342] We add 8 mg poly (dA); 4 mg tRNA; and 10 mg CoT1 DNA per 10 ml
hybridization.
TABLE 10
HYBRIDIZATION PROBE MIX
Cy3 labeled probe ¨20 pi
poly dA (8 mg/ml) 1 pi
yeast tRNA (4 mg/m1) 1 p.1
CoT1 DNA (10 mg/m1) 1 pi -
CA 02417909 2003-01-31
WO 02/12447 PCT/US01/24243
88
[343] We add 2 pi of 3 M sodium acetate (pH 5.5), then add 60 pi of ethanol,
centrifuge, dry
lightly, and resuspend in the ¨17 pl of Cy5 probe. If the array requires
approximately 40 pi of
probe, then the Cy3 and Cy5 concentrates are pooled and the blockers are added
directly, so no
precipitation is required.
[344] Then, we add 3 pi of 20X SSC per 20 p.1 of hybridization mix volume. At
this point, we
optionally add 1 1 of 50X Denhardt's blocking solution per 20 l of
hybridization mix. With
very clean probe, the Denhardt's does not make any visible difference.
[345] Then, we heat at 98 C for 2 minutes, cool to 45 C and add 0.2 ill of
10% SDS per 20 pd
of hybridization mix volume, then apply to the array, and hybridize (16-24)
hours at 65 C in a
sealed, humidified chamber.
[346] Washing. Residual unbound probe is removed from the slides by washing 2-
5 minutes
each at room temperature. The first wash is 0.5X SSC, 0.01%SDS. The second
wash is 0.06X
SSC. Air drying of the slides after this step can leave a fluorescent haze on
the slide surface, so
buffer is removed from the slides by a brief spin at low G. We place the
slides in a slide holder
and spin in a centrifuge equipped with a swinging carrier (horizontal) which
can hold the slide
holder. Most centrifuges that are adapatable to centrifuging microtiter plates
can be used for this
purpose
[347] The foregoing description has been presented only for the purposes of
illustration and is
not intended to limit the invention to the precise form disclosed, but by the
claims appended
hereto.
CA 02417909 2003-07-02
1
SEQUENCE LISTING
<110> Regents of the University of Michigan
<120> ISOLATION AND USE OF SOLID TUMOR STEM CELLS
<130> 940a-103
<140> 2,417,909
<141> 2001-08-02
<150> US 60/222,794
<151> 2000-08-03
<150> US 60/240,317
<151> 2000-10-13
<150> US 09/920,517
<151> 2001-08-01
<160> 1
<170> PatentIn version 3.1
<210> 1
<211> 19
<212> PRT
<213> Homo sapiens
<220>
<221> PEPTIDE
<222> (1)..(19)
<223>
<400> 1
Leu Leu Cys Val Ser Val Val Arg Pro Arg Gly Leu Leu Cys Gly Ser
1 5 10 15
Phe Pro Glu