Note: Descriptions are shown in the official language in which they were submitted.
CA 02435448 2003-07-18
WO 02/063876 PCT/US02/03472
System fox facilitating selection of investments
Cross references to related applications
The present patent application claims priority from U.S. provisional patent
application
60/266,705, Brian A. Hunter, et al., System for selecting poYtfolio fnanage~s,
filed
2/6/2001.
Background of the invention
1. Field of the invention
The invention relates generally to systems for presenting information to users
in a
manner which aids the user in selecting from among alternatives and more
specifically
to interactive systems which aid investors in selecting investments that best
meet the
investor's requirements.
2. Description of related art
The development of networked computing, and of the Internet in particular, has
made
life both easier and more difficult for the investor. Life has become easier
because it is
easier than ever before to find and retrieve the data that is needed to make
wise
investment decisions and to manipulate the data once it has been retrieved.
Life has
become harder because the very plethora of data and the number of ways of
manipulating it complicate the process of turning the data into the
information the
investor needs: namely, information which permits the investor to choose
wisely
2S among alternative investment possibilities.
The bases upon which a wise investor chooses his or her investments are
return, risk,
and diversity. The investor wants investments which offer a relatively good
return at a
relatively low risk and further wants diversity among the risks that his
investments are
exposed to, so that circumstances which produce a loss on one investment do
not
produce losses on others of the investments. Thus, what the investor needs to
choose
wisely is a way of looking at data about individual investment possibilities
which
reveals the following for each investment of interest with regard to a period
of time:
1
CA 02435448 2003-07-18
WO 02/063876 PCT/US02/03472
~ the overall return yielded by the investment over the period as compared to
a
benchmark of interest;
~ the volatility of the investment over the period, which provides a measure
of its risk;
and
~ the resiliency of the investment with regard to market shocks over the
period.
What an investor is of course looking for is investments which maximize return
and
resiliency while minimizing volatility.
Once the investor has found a number of investments of interest, the investor
needs to
look at groups of the possible investments to see how investments in the group
relate to
each other from the point of view of diversity of risk. Diversity of risk
measures the
degree to which the risks that affect the value of one investment are
independent of the
risks that affect another investment. In general, the greater the diversity of
risk in a set
of investments, the more secure the value of the entire set of investments is.
What is needed is a single easy-to-use tool which provides the above
information to the
investor and provides it in a fashion which makes it easy for the investor to
compare the
risks and returns of individual investment possibilities and to see how the
investment
possibilities relate to each other with regard to diversity of risk. It is an
object of the
invention disclosed herein to provide such a tool.
Summary of the invention
The tool of the invention analyzes the performance of a set of investment
opportunities.
The tool includes an analyzer that analyzes investment performance information
covering a period of tune for each investment opportunity of the set and a
graphical user
interface that is usable by a user of the apparatus to control operation of
the analyzer
and display results of the analysis. The analyzer operates in a screening mode
whose
displayed results permit the user to compare performance of the investment
opportunities and in a fitting mode whose displayed results permit the user to
compare
performance of pairs of the investment opportunities with regard to diversity
of risk.
In further aspects of the invention, the analyzer computes the Hunter Ratio, a
pseudo-
reliability metric, for each of the investment opportunities in the set and a
Blend
2
CA 02435448 2003-07-18
WO 02/063876 PCT/US02/03472
Anxiety metric fox pairs of the investment opportunities. In a preferred
embodiment,
the analyzer computes the Hunter Ratio in the screening mode and the Blend
Anxiety in
the fitting mode. In the preferred embodiment, the Blend Anxiety of a pair of
investment opportunities is the covariance of the pair's performance.
In another aspect of the invention, the tool can be used for a method of
investment
analysis in which the investment opportunities are first analyzed to determine
their
Hunter Ratios and pairs of the investment opportunities are then analyzed to
determine
their Blend Anxiety.
The tool's graphical user interface further permits the user to select a
subset of the
potential investment opportunities and to do so according to asset classes of
the
potential investment opportunities. The user can also select a set of
operations to be
performed on the investment performance information by the analyzer and a
portion of
the period of time for which the investment performance information is
available. The
operations will be performed on the investment performance information for the
selected portion of the period of time. The user can further select subsets of
the
investors from which the pairs for which the Blend Anxiety is computed are
taken.
Results of the analysis are output to spreadsheets which can be manipulated in
the
customary fashion by the user.
Other objects and advantages will be apparent to those skilled in the arts to
which the
invention pertains upon perusal of the following Detailed Description and
drawing,
wherein:
Brief description of the drawing
FIG. 1 is a flowchart showing operation of the tool for facilitating selection
of
investments;
FIG. 2 shows the initial window of the tool's user interface;
FIG. 3 shows details of period tab 209;
FIG. 4 shows details of screening tab 211;
FIG. 5 shows subwindows used in setting up screening;
FIG. 6 shows a spreadsheet with the output of the screening operation;
3
CA 02435448 2003-07-18
WO 02/063876 PCT/US02/03472
FIG. 7 shows details of fitting tab 213;
FIG. 8 shows a spreadsheet with the output of the fitting operation; and
FIG. 9 is a block diagram of a computer system in which the tool may be
embodied.
Reference numbers in the drawing have three or more digits: the two right-hand
digits
are reference numbers in the drawing indicated by the remaining digits. Thus,
an item
with the reference number 203 first appears as item 203 in FIG. 2.
Detailed Description
The following Detailed Descr°iption will begin with an overview of the
tool as it appears
to the user and will then describe an implementation of the tool.
Functional overview of the tool: FIG. 1
The tool is implemented in a standard computer system, with a standard
graphical user
interface (GUI) in which the output is a display on a display device such as a
CRT and
inputs to active areas on the display are made using a keyboard and a pointing
and
selection device such as a mouse. The user can do three things with the tool:
~ select asset classes and investment opportunities belonging to the asset
classes to be
investigated and benchmarks and time periods to be used in the investigation;
an
asset class is to be understood in the present context as any set of
investment
opportunities which share a common characteristic, including belonging to a
particular investment strategy; befachf~aanks are measures such as the rate of
return
on U.S. bonds against which other investments are compared;
~ screen the investment opportunities by seeing how they compare according to
various measures of investment value for the selected benchmarks and time
periods;
and
~ fit investment opportunities to see the extent to which they increase the
diversity of
risk in a set of investment possibilities and therefore reduce the overall
risk of the
set.
FIG. 1 is a flowchart 101 which shows operation of the tool at the level just
described.
A user starts using the tool at 103, and the tool executes loop 105 until the
user desires
4
CA 02435448 2003-07-18
WO 02/063876 PCT/US02/03472
to stop. At any point in his or her use of the tool, the user has the choice
to perform
activities belonging to one of three general classes, as shown by case
statement 107:
~ In selection branch 109, editing the general parameters which determine the
asset
classes and investment opportunities to be investigated, the benchmarks, and
the
time period (111).
~ In screening branch 113, the following activities:
- editing screening parameters including output gelds, output calculations to
be
performed to produce additional output fields, and time periods for the output
calculations (117);
- doing the output calculations; and
- displaying the output fields.
In fitting branch 121, the following activities:
- editing fitting parameters that determine which investment opportunities are
compared which each other for diversity of risk (123);
- doing the fitting calculations (125); and
- displaying the fitting results (127).
In general, a user of the tool will proceed as follows: having selected asset
classes,
investments belonging to the asset classes, periods of time, and output
calculations of
interest in selection branch 109 and having used screening branch 113 to see
the
performance of the selected investment opportunities, the user will select a
promising
subset of the investment opportunities that were screened in screening branch
113 for
fitting in fitting branch 121 to see what the diversity of risk offered by the
investments
in the promising subset is. The user may then use the diversity of risk in
making his or
her final selections from among the investments originally selected in
selection branch
109.
Details of the tool as seen by the user
In a preferred embodiment, the investment opportzxnities that the user is
comparing are
managed investment funds; in the user interface, these managed investment
funds are
termed r3aanage~s. It is, however, important to note that the operations
performed by the
tool could be performed with regard to any investment opportunity for which
data is
available which is analogous to that used in the present invention to analyze
fund
managers.
5
CA 02435448 2003-07-18
WO 02/063876 PCT/US02/03472
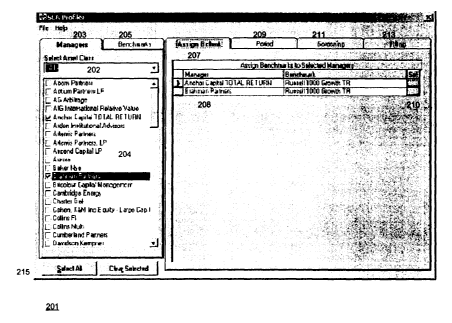
Wizzdows for select brazzclz 109 Figs. 2 arzd 3
When a user begins using the tool, the first window encountered is window 201
shown
in FIG. 2. In terms of FIG. l, window 201 belongs to branch 109. Window 201
permits
the user to specify managers and benchmarks to be used in evaluating the
selected
managers. Tab control 203 allows the user to switch between manager and
benclnnark
views (205). Manager view 203 includes a list 204 of managers; individual
managers in
the list may be selected using the check boxes to the left of the list
entries. The buttons
at 215 permit the user to select all managers in list 204 or to clear all
managers in list
204. "Select Asset Class" dropdown 202 allows the user to alter the list by
asset class;
when an asset class is selected, only the managers who manage investments
belonging
to that asset class appear in list 204. The "All" option shows all managers
for which the
tool has performance data. Tab 207 is the Assign Benchmark tab. When a manager
is
selected from list 204, it is added to list 208 of manager-benchmark pairs.
The manager
will then be screened against the selected benchmark. Clicking "Set" button
210 in a
list entry in list 208 will update all managers selected for the benchmark
with the
information for the benchmark defined in that row. As will be explained in
more detail
later, period tab 209 permits the user to specify an analysis period for the
screening
and/or fitting, tab 211 selects the window for the screening operation, and
tab 213
selects the window for the fitting operation.
FIG. 3 shows window 301 of branch 109 with a detailed view of tab 209 which
the user
employs to determine the period of time to be used in the screening and/or
fitting
analyses of the managers selected in tab 203 with regard to the benchmarks
selected
with regard to tab 207. The available options are:
~ All 303 - all reported periods for each selected manager;
~ Maximum common periods across selected managers 305 - the timeframe is
limited
to the maximum intervals that all selected managers share
~ Last 307 - The time period is limited to the most recent entered
years/months (e.g. 6
months, 3 years, etc.)
6
CA 02435448 2003-07-18
WO 02/063876 PCT/US02/03472
~ Custom Period 311 - User may enter any time period. A start date for the
period
can be specified, or the user may choose "From Inception" (313). Similarly,
the
user may also specify an ending date, or choose "Last Reported" (315).
Windows for screening brazzch 113: Figs. 4-G
FIG. 4 shows window 401 that appears when the user selects screening tab 211.
This
tab corresponds to block 115 in flowchart 101. It permits the user to further
define a
screening operation that uses the managers, benchmark, and time period
selected using
screens 201 and 301. Using tab 211, the user may define the fields he or she
wishes to
appear in the display produced for the results of the screening operation and
may also
specify that the screening operation be performed. Beginning at 403, that
portion of tab
211 provides checkboxes which permit the user to select a number of fields to
appear in
the output. Portion 405 permits the user to select operations from a list 407
of
operations. When an operation is selected, a field containing the results of
the operation
appears in the display produced for the results of the screening operation.
When the
user has finished setting up the scan using screen 401, the user clicks on
button 417 to
start the scan.
Continuing with details of portion 403, the start date, end date, and # of
znontlzs check
boxes cause fields to be produced with time expressions as determined by the
settings of
time tab 209. The values that appear in the remaining fields are defined
relative to the
value of the benchmark that was assigned using tab 207. The values are
calculated as
follows:
I
~ % Benchmark Upside - Calculated as (Total Positive Returns)/(Total Positive
Benchmark Returns)
~ % Benchmark Downside - Calculated as (Total Negative Returns) / (Total
Negative Benchmark Returns)
~ Benclimark Up/Down Ratio - Calculated as (% Benchmark Upside) / (%
Benchmark Downside)
~ % Periods w/ Gain - Calculated as (Number of periods w/ positive returns) /
(Total
number of periods)
7
CA 02435448 2003-07-18
WO 02/063876 PCT/US02/03472
~ Average Gain To Loss - Calculated as (Sum of positive returns/Number of
positive
returns)
Output calculations portion 405 permits the user to specify calculations that
are to be
performed using the data for the selected managers and benchmarks. The output
calculations are selected using subwindow 407, which permits selection of the
calculation (409), the period over which it is to run (411), and the format
413 in which it
is to be displayed. Button 415 permits the user to customize the calculation
period.
Only a single output calculation, the Hunter Ratio, is specified at 407;
however, the
output calculations which may be specified using window portion 405 include
the
following in the preferred embodiment: the Sharpe ratio, rolling returns,
drawdown,
standard deviation, and the Hunter ratio. More than one such calculation may
be
specified for a given screening. With the exception of the Hunter ratio, these
calculations are well known. All of these calculations employ rolling returns
for the
manager and/or the benchmark. The rolling return is calculated as follows:
Rolling Returns - the rolling return for the analysis period:
For each return in series
Rolling Return = Rolling Return * (l + Period Return)
Total Return = Rolling Return - 1
Next
25
In summary, the calculations are performed as follows:
~ Drawdown - Ratio of the series to the series benchmark over a defined period
of
market volatility: (Rolling Rettun for period) / (Rolling Benclnnark Return
for
period)
~ Sharpe Ratio - Calculated as:
Period Rolling Return - Period T-Bill Rolling ReW rn
Standard Deviation(Period Returns)
~ Hunter Ratio - The average of all n-period Sharpe ratios divided by the
standard
deviation of all n-period Sharpe ratios for a series. Calculated as: .
Average(Sharpe Ratio over n periods)/StdDev(Sharpe Ratio over n periods)
Computation of the standard deviation is too well lcnomn to require further
explanation.
8
CA 02435448 2003-07-18
WO 02/063876 PCT/US02/03472
The Hunter Ratio is a novel metric. It reflects a manager's performance
persistence over
time while minimizing period selection bias. It thus provides a notion of the
manager's
reliability without the computational requirements of reliability measurements
such as
those described in PCT/IJSO1/00636, Hunter, et al., Resom°ce allocation
techniques,
filed 9 January 2001. For this reason, the Hunter Ratio is termed a pseudo-
reliability
measure. The Hunter Ratio is measured over a minimum of 3 year rolling periods
from
inception of a manager's performance and becomes more statistically valid at 5
and 7
year rolling periods.
Coupling the Hunter Ratio with the other statistics produced in screening adds
still more
perspective. For example, we can screen over shorter term convulsive periods
pertinent
to the asset class of the managers being screened and use drawdown to take a
snapshot
of how each manager looks under the microscope of disaster periods. The Hunter
Ratio
and drawdown together give a unique picture of the likelihood of a manager to
weather
both the worst market storms and more moderate intermittent market pressures
and at
the same time deliver an absolute upside at a margin above both competitors
and a
relevant benchmark for the asset class in question.
FIG. 5 shows a number of subwindows that are used with window 401 to fuxther
configure screening. Subwindow 501 appears when button 415 is clicked on for
the
Hunter Ratio entry in list 407; it permits the user to define one or more
periods over
which the Hunter Ratio is to be calculated. Subwindow 503 appears when button
415 is
clicked for any of the other output calculations; it permits the user to
specify that the
analysis period indicated on period tab 209 be used or to specify one or more
special
analysis periods for the computation. The special periods may be specified in
the same
way as time periods on period tab 209. The results of the calculation for each
of the
time periods selected for the Hunter Ratio or the other computations will
appear in a
separate field in the spreadsheet. Where the calculation involves a benchmark,
it is the
benchmarlc selected using tab 207. Subwindow 505 appears after the user clicks
on
start screening button 417. It permits the user to specify the order in which
the fields
will appear in the rows of the spreadsheet that is the result of the screening
operations.
9
CA 02435448 2003-07-18
WO 02/063876 PCT/US02/03472
The vertical order of the fields in subwindow 505 becomes the left-to-right
order of the
fields in the spreadsheet row.
In a preferred embodiment, the results of the calculations specified using
screening tab
211 on the managers and benchmark specified using tabs 203 and 205 for the
period
specified using tab 209 are output to a spreadsheet. FIG. 6 shows the
spreadsheet as it
appears where the user has specified a benchmarlc and four managers.
Spreadsheet 601
has two worksheets, one, identified by tab 609, which shows the results of
screening,
and one, identified by tab 611, which shows the results of fitting. In
spreadsheet 601,
the user has selected tab 609. The spreadsheet has a row 605 in table 603 for
each of
the selected managers. The fields in the row correspond to those selected
using tab 211;
they are ordered as the user species in subwindow 505 (note, however, that the
order
actually shown in subwindow 505 was not used for spreadsheet 601). Header 607
has
the titles of the fields. Any of the usual spreadsheet operations can of
course be
performed on table 603, including sorting the rows according to the values in
a selected
field. Here, as shown at 613, the rows have been sorted by the value of the
Hunter
Ratio.
Windows fof° fitting b~a~zcla 121: Figs. 7 and 8
The fitting operation compares pairs of managers from the point of view of
diversity of
risk. This is done by computing the correlation and the covariance for the
returns of the
pair. The greater the diversity of rislc, the lower the correlation and
covariance for the
pair. The advantage of computing the covariance in addition to the correlation
is that
covariance is a more powerful indicator of diversification. It is more
powerful because
it measures diversification and the impact of the blenading of the
volatilities of the
two managers. Mathematically, the covariance is the product of the correlation
coefficients of the two managers multiplied by their respective standard
deviations. So,
you can have two highly volatile managers in two very different asset classes
and if the
correlation is near zero then they may very well be an excellent fit or, vice
versa, a high
correlation where the managers are less volatile can result in a very poox
combination
that yields a lot of investor anxiety when both deliver large negative returns
at the same
time. It is this relationship between the covariance and investor anxiety
which has lead
CA 02435448 2003-07-18
WO 02/063876 PCT/US02/03472
the developers of the present invention to use the term Blend Anxiety in their
user
interface. Other measures of Blend Anxiety may be used in other embodiments of
the
tool. One such measure is provided by the investment allocation techniques
described
in PCT/USO1/00636, cited above.
FIG. 7 shows window 701, in which the details of fitting tab 213 can be seen.
Fitting
tab 213 permits the user to select two groups of managers upon which the
fitting
operation will be perfonned. One group is termed the x axis group and the
other is
termed the y axis group. Each member of the x axis group is fitted to each
member of
the y axis group. The fitting operation is done over a period that is
specified using tab
209.
The groups of managers are selected fiom the set of managers that was
previously
specified using tab 203. When the user selects fitting tab 213, the managers
that were
previously selected at 204 appear in selected items field 703. Buttons 709 and
711 can
be used to move the managers in field 703 between that field and x-axis field
705,
which lists the managers currently selected for the x-axis group. The
equivalent buttons
for y-axis field 707 can be used to move managers between field 703 and y-axis
field
707, which lists the managers currently selected for the y-axis group.
Managers can be
ordered within field 705 by using buttons 713, and the same can be done within
field
707 using the equivalent buttons there. Clicking on preview button 715
provides a
preview of the arrangement of the spreadsheet that will be produced by the
fitting
operation, while clicking on start fitting button 717 begins the fitting
operation on the
selected X axis group and Y axis group.
FIG. 8 shows the spreadsheet worksheet 801 that results from the fitting
operation.
Worksheet 801 appears when the user selects tab 611. In this case, worksheet
801
shows the result of applying the fitting operation to an X-axis group 806 of
three
managers and a Y-axis group 802 of six managers. The fitting operation is for
the time
period specified at 811. In general, each member of the Y axis group has a row
803 in
the spreadsheet; each member of the X axis group has two fields 805 in each of
the
rows. The contents of the fields for a given X axis manager in the row
belonging to a
given Y axis manager are the correlation coefficient and the covariance values
for the
11
CA 02435448 2003-07-18
WO 02/063876 PCT/US02/03472
pair made up of the given X axis manager and the given Y axis manager. In row
803,
field 807 contains the correlation coefficient and field 809 contains the
covariance
value. In the display, they are tenned "Diversity" (Div) and "Blend Anxiety"
(BA).
The arrangement shown in window 801 makes it easy for users of the tool to
understand
how two investment possibilities relate to each other with regard to diversity
of risk.
Measuring reliability of combinations of potential investments
Together, the Hunter Ration and Blend Anxiety provide users of the tool with a
way of
measuring the reliability of combinations of potential investments. As
indicated above,
the Hunter Ratio reflects a manager's performance persistence over time, and
thus
measures reliability of a manager. Thus, in order to find reliable
combinations of
managers, the user can first screen the managers in question to determine
their Hunter
Ratios, and then fit pairs of managers with acceptable Hunter Ratios. The
paixs with
the best fits make up a set of managers which can then be further analyzed
using the
resource allocation techniques described in PCT/USOl/00636, cited above.
Implementation of the tool in a computer system: FIG. 9
FIG. 9 shows a computer system 901 in which a preferred embodiment of the tool
is
embodied. In the preferred embodiment, the tool is termed the ProFiler. System
901
has two main components: a server processor 909 and one or more client
processors
925 connected to the server processor. Server processor 909 further has a
connection to
Internet 907 and via that connection to databases containing benchmark data
903 and
manager data 905.
Continuing with the details of server processor 909, server processor 909
further
includes copy databases 917 and 919. Copy database 917 contains a copy of data
from
benchmark data 903 and copy database 919 contains a copy of data from manager
data
905. The copies 917 and 919 are obtained by downloading via Internet 907 from
databases 903 and 905. In a preferred embodiment, benchmark database 903 is a
commercial database provided by Ibbotson Associates and manager data 905 is
the
12
CA 02435448 2003-07-18
WO 02/063876 PCT/US02/03472
commercial Plan Sponsor Network database provided by Effron. ProFiler database
921
is a MicrosoftOO Access database made by Microsoft Corporation.
When the ProFiler is operating, profiler database 921 contains benchmark
information
from database 917 and manager information from database 919 and may also
contain
further manager information provided by users of the ProFiler. In a preferred
embodiment, data base 921 is implemented in a Microsoft~ Access database
system.
Server processor 909 further includes ProFiler server side application program
911,
which performs those parts of the operation of the ProFiler which are done on
server
processor 909 and analysis engine 913, which is the part of application
program 911
which does the calculations necessary to produce the output spread sheets.
Server-side
application program 911 is hosted in OS host services program 915, which
provides
application program 911 with middleware services such as connection pooling,
instance
management, and threading. In a preferred embodiment, server processor 909 is
running under the Microsoft Windows 2000 Server operating system and OS host
services 915 is embodied as Windows Component Services.
Client processor 925 is a standard PC runlnng a Microsoft Windows operating
system.
The operating system provides a GUI which is displayed on monitor 929 and
receives
inputs from mouse 931 and keyboard 933. Also included in client processor 925
is an
Excel spreadsheet program which manipulates profiler spreadsheets 923.
ProFiler
client-side application 927 receives inputs from and provides outputs to the
GUI and
also provides result data received from server-side application 911 to
profiler
spreadsheets 923.
Prior to commencing operation of the profiler, a manager of server processor
909
downloads copy 917 of benchmark data from database 903 and copy 919 of manager
data from database 905. When a user at client processor 925 begins execution
of
proftler client-side application 927, server-side application 911 provides
initial window
201; after the user has selected managers, a benclmnarlc, a period, and the
screening
operation, and for the screening operation, the results fields to be output
and the
operations to be performed, server-side application 911 responds to these
inputs when
13
CA 02435448 2003-07-18
WO 02/063876 PCT/US02/03472
the user clicks on start screening button 417 by copying the data for the
selected
managers and benchmark for the selected period from databases 917 and 919 to
database 921. Analysis engine 913 then performs the specified operations and
outputs
the results to client-side application program 927, which incorporates them
into the
screening worksheet of the ProFiler spreadsheet in spreadsheets 923. The user
of client
processor 925 can then use Excel to manipulate the spreadsheet in the usual
fashion.
If the user instead selects the fitting operation, the user may again select
managers and a
time period and can also assign managers to either the X-axis group or the Y-
axis group.
When the user has done these things using window 701 and clicks on start
fitting button
717, analysis engine 913 computes the correlation coefficient and the
covariance for
each possible pairing of a manager from the X-axis group with a manager from
the Y-
axis group and outputs the results to client-side application program 927,
which
incorporates them into the fitting workshop of the ProFiler spreadsheet in
spreadsheets
923. Again, the user of client processor 925 can then use Excel to manipulate
the
spreadsheet in the usual fashion.
Conclusion
The foregoing Detailed DescYiptio~a has disclosed to those skilled in the
relevant
technologies the best mode presently laiown to the inventor of making and
using his
tool for analyzing investment opportunities and has further disclosed the best
modes
presently known to the inventor of computing the Hunter Ratio and Blend
Anxiety and
using these metrics to analyze investment opportunities.
While the tool provides a particularly good environment for the application of
the
Hunter Ratio and Blend Anxiety to the problem of analyzing investment
opportunities,
the Hunter Ration and Blend Anxiety are useful in many other investment
analysis
contexts and with many other investment analysis tools. The user interface
disclosed
herein is further optimal for users of the tool, but many other kinds of user
interfaces are
possible, including ones which offer subsets of the functionality provided by
the
disclosed user interface and ones which use different graphical user
interfaces or even
character-based user interfaces. Similarly, it is particularly advantageous to
output the
results of operations performed by the tool to spreadsheets, where user of the
tool can
easily further manipulate the results, but in other embodiments, any kind of
graphical or
14
CA 02435448 2003-07-18
WO 02/063876 PCT/US02/03472
character display device may be used to display the results. Finally, the
particular
hardware embodiment disclosed herein is particularly advantageous when the
investment performance information is available on the Internet and is being
shared by a
group of users, but implementations of the tool may range across the spectrum
from an
implementation in which the user interface for the tool is implemented in a
browser,
with all computation and display creation being done by a server that is
connected by a
network to the system in which the browser is operating to an implementation
in which
the tool is implemented in a stand-alone PC or other computer system. The
investment
performance data may be obtained via the Internet, as in the preferred
embodiment, by
means of portable media such as CD-Rom or magnetic disks, or may be input by
the
user.
For all of the foregoing reasons, the Detailed Descr~iptiorr is to be regarded
as being in
all respects exemplary and not restrictive, and the breadth of the invention
disclosed
here in is to be determined not from the Detailed Descriptioia, but rather
from the claims
as interpreted with the full breadth permitted by the patent laws.
15