Note: Descriptions are shown in the official language in which they were submitted.
CA 02442317 2003-09-26
WO 02/101721 PCT/EP02/05556
Improved method for determining the quality of a speech
signal.
A. BACKGROUND OF THE INVENTION
The invention lies in the area of quality measurement
of sound signals, such as audio, speech and voice signals.
More in particular, it relates to a method and a device
for determining, according to an objective measurement
technique, the speech quality of an output signal as
received from a speech signal processing system, with
respect to a reference signal. Methods and devices of such
a type are generally known. More particularly methods and
corresponding devices, which follow the recently accepted
ITU-T Recommendation P.862 (see Reference [1]), are of
such a type. According to the present known technique, an
output signal from a speech signals-processing and/or
transporting system, such as wireless telecommunications
systems, Voice over Internet Protocol transmission
systems, and speech codecs, which is generally a degraded
signal and whose signal quality is to be determined, and a
reference signal, are mapped on representation signals
according to a psycho-physical perception model of the
human hearing. As a reference signal, an input signal of
the system applied with the output signal obtained may be
used, as in the cited references. Subsequently, a
differential signal is determined from said representation
signals, which, according to the perception model used, is
representative of a disturbance sustained in the system
present in the output signal. The differential or
disturbance signal constitutes an expression for the
extent to which, according to the representation model,
the output signal deviates from the reference signal. Then
the disturbance signal is processed in accordance with a
cognitive model, in which certain properties of human
testees have been modelled, in order to obtain a time-
independent quality signal, which is a measure of the
quality of the auditive perception of the output signal.
The known technique has, however, the disadvantage
that for severe timbre differences between the reference
signal and the degraded signal the predicted speech
CA 02442317 2003-09-26
WO 02/101721 PCT/EP02/05556
2
quality of the degraded signal is not correct, or at least
unreliable.
B. SUMMARY OF THE INVENTION
An object of the present invention is to provide for
an improved method and an improved device for determining
the quality of a speech signal, which do not possess said
disadvantage.
Among other things the present invention has been
based on the following observation. From the basics of
human perception it is known that the human auditory
system follows the rule of constancy in perception, e.g.
constancy of size, of pitch, of timbre etc. This means
that the human auditory system in principle compensates,
to a certain extend, for differences in size, or pitch, or
timbre, etc.
A perceptual modelling of a kind as e.g. used in
methods and devices as known from Reference [1] takes into
account a partial compensation for some severe effects by
means of a partial compensation of the pitch power density
of the original (i.c. the reference) signal. Such a
compensation is carried out by multiplying, in the
frequency domain, using a compensation factor. In that the
compensation factor is calculated from the ratio of the
(time-averaged) power spectrum of the pitch power
densities of original and degraded signals. The
compensation factor is never more than (i.e. clipped at) a
certain pre-defined constant value, i.c. 20 dB. However in
case of severe timbre differences (e.g. > 20dB in power
density) such a compensation which uses a partial
compensation factor between certain pre-defined constant
limit values is found to result in unreliable predictions
of the speech signal quality. Then it was realized that,
e.g. as to timbre, the human auditory system compensates
severe differences in a frequency-dependent way. More in
particular, low frequencies are often more compensated
than high frequencies, e.g. in normal listening rooms, due
to exposure of low frequency coloration, consequently
leading to the above-mentioned low correlation between the
objectively predicted and subjectively experienced speech
qualities. An aim of the present invention is to improve a
CA 02442317 2008-01-17
25890-176
3
perceptual modelling of the human auditory system in this
sense.
According to one aspect of the invention a method of
the above kind comprises a step of compensating power
differences of the output and reference signals in the
frequency domain. The compensation step is carried out by
applying a compensation factor derived from a ratio of
signal values of said output and reference signals thereby
using a clipping value determined by using a frequency-
dependent function.
In some embodiments, the frequency-dependent
function is a monotonic function, which, in some embodiments
is proportional to a power, more particularly to a third
power of the frequency.
According to a further aspect of the invention a
device of the above kind comprises compensation means for
compensating power differences of the output and reference
signals in the frequency domain. The compensation mean.s
include means for deriving a compensation factor from a
ratio of signal values of said output and reference
signals have been arranged for using an at least partially
frequency-dependent clipping function.
C. REFERENCE
[1] ITU-T Recommendation P.862 (02/2001), Series P:
Telephone Transmission Quality, Telephone
Installations, Local Line Networks; Methods for
objective and subjective assessment of quality --
Perceptual evaluation of speech quality (PESQ), an
objective method for end-to-end speech quality
assessment of narrow-band telephone networks and
speech codecs.
D_ BRIEF DESCRIPTION OF THE DRAWING
The invention will be further explained by means of
the description of exemplary embodiments, reference being
made to a drawing comprising the following figures:
CA 02442317 2003-09-26
WO 02/101721 PCT/EP02/05556
4
FIG. 1 schematically shows a known system set-up
including a device for determining the quality
of a speech signal;
FIG. 2 shows in a block diagram, more in detail, a part
of the device included in the system as shown in
FIG. 1, in which a compensation operation is
carried out;
FIG. 3 shows a graphical diagram for illustrating an
essential difference in determining a
compensation factor for a compensation operation
between the prior art using constant upper and
lower clipping values, and the present invention
using a first set of frequency-dependent upper
and lower clipping values;
FIG. 4 shows a graphical diagram picturing a second set
of frequency-dependent upper and lower clipping
values;
FIG. 5 shows a graphical diagram picturing a third set
of frequency-dependent upper and lower clipping
values.
E. DESCRIPTION OF EXEMPLARY EMBODIMENTS
FIG. 1 shows schematically a known set-up of an
application of an objective measurement technique which is
based on a model of human auditory perception and
cognition, and which follows e.g. the ITU-T Recommendation
P.862 for estimating the perceptual quality of speech
links or codecs. It comprises a system or
telecommunications network under test 10, hereinafter
referred to as system 10 for briefness' sake, and a
quality measurement device 11 for the perceptual analysis
of speech signals offered. A speech signal Xo(t) is used,
on the one hand, as an input signal of the system 10 and,
on the other hand, as a first input signal X(t) of the
device 11. An output signal Y(t) of the system 10, which
in fact is the speech signal Xo (t) affected by the system
10, is used as a second input signal of the device 11. An
output signal Q of the device 11 represents an estimate of
the perceptual quality of the speech link through the
system 10. Since the input end and the output end of a
speech link, particularly in the event it runs through a
CA 02442317 2003-09-26
WO 02/101721 PCT/EP02/05556
telecommunications network, are remote, for the input
signals of the quality measurement device use is made in
most cases of speech signals X(t) stored on data bases.
Here, as is customary, speech signal is understood to mean
5 each sound basically perceptible to the human hearing,
such as speech and tones. The system under test may of
course also be a simulation system, which simulates e.g. a
telecommunications network or certain parts of such a
network. The device 11 carries out a main processing step
which comprises successively, in a pre-processing section
11.1, a step of pre-processing carried out by pre-
processing means 12, in a processing section 11.2, a
further processing step carried out by first and second
signal processing means 13 and 14, and, in a signal
combining section 11.3, a combined signal processing step
carried out by signal differentiating means 15 and
modelling means 16. In the pre-processing step the signals
X(t) and Y(t) are prepared for the step of further
processing in the means 13 and 14, the pre-processing
including power level scaling and time alignment
operations, thereby outputting pre-processed signals Xp(t)
and YP(t), which are e.g. scaled versions of the reference
and output signals. The further processing step implies
mapping of the (degraded) output signal Y(t) and the
reference signal X(t) on representation signals R(Y) and
R(X) according to a psycho-physical perception model of
the human auditory system. During the combined signal
processing step a differential or disturbance signal D is
determined by means of the differentiating means 15 from
said representation signals. The differential signal D is
then processed by modelling means 16 in accordance with a
model, in which certain, e.g. cognitive, properties, of
human testees have been modelled, in order to obtain the
quality signal Q.
Recently it has been experienced that current
objective measurement techniques, may have a serious
shortcoming in that for severe timbre differences between
the reference signal and the degraded signal the speech
quality of the degraded signal can not correctly be
predicted. Consequently the objectively obtained quality
signals Q for such cases possess poor correlations with
CA 02442317 2003-09-26
WO 02/101721 PCT/EP02/05556
6
subjectively determined quality measurements, such as mean
opinion scores (MOS) of human testees. Such severe timbre
differences may occur as a consequence of the used
technique for recording the original speech signal. A
validated recording technique is e.g. the technique known
as "close miking bass boost", which involves a
considerable filtering out in the low-frequency range. A
further cause of severe timbre differences may be in
differences in conditions such as with respect to
reverberation between the room or area, in which the
original speech signal is generated, and the room or area,
in which the degraded speech signal is assessed. Room
transfer functions, however, show, especially in the low
frequency-domain, larger irregularities in the frequency
response function than in the middle and high frequencies.
The disturbances caused by such irregularities, however,
are perceived less disturbing by human beings than current
objective models predict.
From the basics of human perception it is known that
the human auditory system follows the rule of constancy in
perception, e.g. constancy of size, of pitch, of timbre
etc. This means that the human auditory system in
principle can compensate, to a certain extend, for
differences in size, or pitch, or timbre, etc.
Current perceptual modelling takes into account a
partial compensation for some severe effects by means of a
partial compensation of the pitch power density of the
original (i.c. the reference) signal. Multiplying, in the
frequency domain, the pitch power density of the original
signal with a compensation factor (CF) carries out such
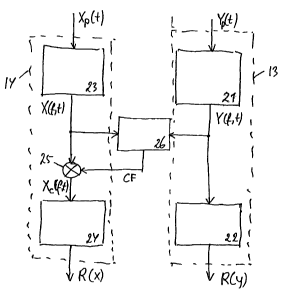
compensation. FIG. 2 shows in a block diagram, more in
detail, the part of the device 11 as shown in FIG. 1, i.c.
the processing section 11.2, in which the compensation is
carried out. The signal processing of the first signal
processing means 13 includes, in a first stage,
transformation means 21 in which the pre-processed
degraded signal YP(t) is transformed from a signal in the
time domain into a time and frequency dependent output
signal Y(f,t) in the time frequency domain, e.g. by means
of an FFT (Fast Fourier Transformation), and, in a second
stage, compression means 22 in which the thus transformed
CA 02442317 2003-09-26
WO 02/101721 PCT/EP02/05556
7
signal Y(f,t) is subjected to a signal compression,
resulting in the representation signal R(Y) . In a similar
way, the signal processing of the second signal processing
means 14 includes, in a first stage, transformation means
23 in which the pre-processed original signal XP(t) is
transformed into a time and frequency dependent output
signal X(f,t), and, a second stage, compression means 24
in which the thus transformed signal X(f,t) is subjected
to a signal compression, in order to obtain the
representation signal R(X). Between the two stages 23 and
24, previous to the signal compression, the transformed
signal X(f,t) is subjected to a compensation operation by
compensation means 25, which operation results in a
compensated transformed signal Xc(f,t).
The transformation of the pre-processed degraded and
reference signals is preferably, as usual, followed by a
so-called warping function which transforms a frequency
scale in Herz to a frequency scale in Bark (also known as
pitch power density scale).
The compensation operation is carried out by means of
a multiplication with a compensation factor CF, which in a
calculation operation, carried out by calculation means
26, is derived from a frequency response FR(f) of the time
and frequency dependent signals Y(f,t) and X(f,t), i.e.
the ratio of the (time-averaged) power spectrum of the
pitch power densities of the two signals. The frequency
response FR(f) may be expressed by:
FR(f) = JY(f, t)/ JX(f, t) { 1 }
Then the compensation factor CF is calculated from this
ratio, in such a way that:
( i) CF = FR ( f) for CL- <_ FR ( f) 5 CL+,
( ii ) CF = CL- for FR ( f) < CL-, and
(iii) CF = CL+ for FR(f) > CL+,
in which CL- and CL+, respectively called lower and upper
clipping values, are certain predefined constant values,
at which the frequency response is clipped for getting the
compensation factor CF for the above indicated partial
CA 02442317 2003-09-26
WO 02/101721 PCT/EP02/05556
8
compensation. Such clipping values are predefined, e.g.
during an initialisation phase of the measurement
technique. For methods in accordance with Reference [1]
these predefined clipping values CL- and CL+ are 0,01 (-
20dB) and 100 (+20dB), respectively. However in case of
severe timbre differences (e.g. > 20dB in power density)
such a partial compensation which uses a compensation
factor which is clipped at certain pre-defined constant
values, was found to result in unreliable predictions of
the speech signal quality. Then it was found that an
improvement of the perceptual modelling of the human
auditory system could be achieved by carrying out the
compensation using a compensation factor which is clipped
no longer at constant values, but at frequency-dependent
values, at least over a part, preferably the lower part,
of the frequency range of the auditory system. Such
frequency-dependent clipping values are hereinafter
indicated by frequency-dependent functions c1-(f) and
c1+(f), called lower and upper clipping function,
respectively.
The compensation factor CF is again calculated from
the frequency-response according to formula {1}, but
clipped by using the frequency-dependent lower and upper
clipping functions, in such a way that:
( i ) CF = FR ( f ) for c1- (f) <_ FR ( f ) <_ c1+ (f) ,
(ii) CF = c1-(f) for FR(f) < c1-(f), and
( iii ) CF = cl+ (f) for FR ( f ) > c1+ (f) .
In principle the upper and lower clipping functions
may be chosen independently of each other. However, as a
consequence of the reciprocal character of the frequency
response function, the upper clipping function c1+(f) is
preferably chosen to be equal, at least approximately (see
below), to the inverse (reciprocal) of the lower clipping
function c1-(f), or vice versa.
A clipping function, e.g. the lower clipping function
cl-(f), is, at least over the part or parts which are
frequency dependent, preferably monotonic either
increasing or monotonic decreasing with increasing
frequency, whereas in a corresponding way the other
CA 02442317 2003-09-26
WO 02/101721 PCT/EP02/05556
9
clipping function is monotonic decreasing or increasing.
The clipping functions are preferably pre-defined, e.g.
during an initialising phase of the measurement system.
By means of a suitable choice of the upper and lower
clipping functions the partial compensation can be brought
in a better harmony with the above mentioned rule of
constancy in perception. Experimentally it appeared that a
monotonic increasing function which is proportional to the
a power p of the frequency, i.c fP (with p# 0),
especially in the low frequency range, is such a suitable
choice for the lower clipping function. Preferably p=3.
Hereinafter, the difference in choice of such frequency-
dependent clipping functions, cl-(f) and c1+(f), instead
of constant clipping values CL- and CL+ is illustrated
with reference to figure FIG. 3.
FIG. 3 shows in a graphical diagram as an example the
frequency response function for a first and a second,
mutually different speech signals, indicated by FR1(f) and
FR2(f), respectively, the frequency response values (in
dB) being put along the vertical axis as a function of the
frequency (in Bark) being put along the horizontal axis.
The horizontal broken dashed lines 31 and 32 at -20dB and
+20dB indicate the constant clipping values CL- and CL+,
respectively. The curved lines 33 and 34 indicate the
frequency-dependent lower and upper clipping functions c1-
(f) and c1+(f), respectively. The frequency response
functions FR1 ( f) and FR2 ( f) have no significant values for
frequencies above a certain fmax, which is about 30 Bark
for the human auditory system.
As an example the plotted lower and upper clipping
functions, indicated by the curved lines 33 and 34, are
chosen as:
c1- (f) = CL- { f / fmax } 3 and c1+ (f) = { cl - (f) + 0 } -1
in which A is a small number (e.g. 0.015) in order to
avoid too large values for c1+ (f) in cases where c1- (f) ,-_0
for any value of f.
In this example the frequency response function FR1(f)
lies completely in between of both the constant clipping
values CL- and CL+ and the clipping functions. The
CA 02442317 2003-09-26
WO 02/101721 PCT/EP02/05556
function FR2(f) however has, in addition to points between
the constant clipping values CL- and CL+, a first lob 35
in the upward direction, which between points A and D
increases above the horizontal line 32, and between points
5 B and C increases even above the curved line 34. It has
moreover a second lob 36 in the downward direction, which
between points E and F decreases below the horizontal line
31.
For speech signals having a frequency response
10 function completely lying in between of both the set of
clipping values and the set of clipping functions, such as
the function FR1(f), there will be no difference in
determining the compensation factor CF, since there is no
need for clipping. For speech signals having a frequency
response function which partially lies in between of the
set of clipping values, and which has one or more lobs
such as the function FR1 (f) , there will be a considerable
difference in determining the compensation factor CF. For
calculating the compensation factor CF according to the
prior art method the values of the frequency response
function FR2(f) between the points A and D are clipped to
the upper clipping value CL+, whereas according to the new
method only the values of the frequency response function
FR2(f) between the points B and C are clipped, not only to
the locally much larger values according to the upper
clipping function c1}(f), but moreover in a frequency-
dependent way. In a similar way the values of the
frequency response function FR2(f) between the points E
and F are clipped to the lower clipping value CL-, whereas
according to the new method the values of the frequency
response function FR2(f) between the points E and F are
not clipped at all.
Another choice for c1-(f) may be:
c1-(f) ={f/fc}3 for f<_ fA ={CL-}1/3fc and
c1- (f) = CL" for f? fA ={ CL- } 1/3fc =
fc is a centre frequency (i.e. fmax/2 ;z~ 15 Bark) of the
frequency range of the human auditory system. This choice
for c1- (f) with corresponding c1+ (f) is pictured in figure
FIG. 4. The lower and upper clipping functions are
indicated by numerals 43 and 44, respectively, each having
a frequency-dependent part 43.1 (44.1), and a constant
CA 02442317 2003-09-26
WO 02/101721 PCT/EP02/05556
11
value part 43.2 (44.2) . In particular this choice showed,
for speech signals with large timbre differences,
experimentally an increase in correlation of more than 5%
between the predicted quality and the subjectively
measured quality.
More generally the lower clipping function may be a
concatenation of frequency-dependent parts over successive
frequency ranges in the direction of increasing frequency,
each part being a monotonic increasing function which has
a still lower frequency-dependency over the successive
frequency ranges. For example the parts are functions
proportional with a power of the frequency, which power
decreases for each following frequency range in the
direction of increasing frequency. E.g. a first part
proportional with the already mentioned function f3 in the
lowest frequency range, followed by a second part
proportional f2 in a second next frequency range, followed
by a third part proportional with f213 in a third next
range, etc.
Still another choice reckons with symmetry in
frequency spectrum of the auditory system:
c1- (f) ={ f/fC} 3 for f 5 fA ={ CL- } 1/3 fc,
cl-(f) ={(fmax-f)/fc}3 for f? fB = fmax-{CL-}1/3fc, and
c1- (f) = CL- for fA <_ f<_ fB.
This choice for c1-(f) with corresponding c1}(f) is
pictured in figure FIG. 5. The lower and upper clipping
functions are indicated by numerals 53 and 54,
respectively, each having successively a first frequency-
dependent part 43.1 (44.1) in the low frequency range, an
intermediate constant value part 43.2 (44.2), and a second
frequency-dependent part 43.3 (44.3) in the high frequency
range.
Instead of the transformed signal X(f,t) the
transformed signal Y(f,t) may be subjected to the
compensation operation, the compensation factor being
calculated from a frequency response function which in
fact is the reciprocal of the frequency response FR(f) as
expressed by formula {1},