Note: Descriptions are shown in the official language in which they were submitted.
CA 02445101 2003-10-22
WO 02/086500 PCT/GB02/01854
METHODS FOR ANALYSIS OF SPECTRAL DATA AND THEIR APPLICATIONS:
ATHEROSCLEROSIS/CORONARY HEART DISEASE
RELATED APPLICATIONS
This application is related to (and where permitted by law, claims priority
to);
(a) United Kingdom patent application GB 0109930.8 filed 23 April 2001;
(b) United Kingdom patent application GB 0117428.3 filed 17 July 2001;
(c) United States Provisional patent application USSN 60/307,015 filed 20 July
2001;
the contents of each of which are incorporated herein by reference in their
entirety.
This application is one of five applications filed on even date naming the
same applicant:
(1) attorney reference numberWJW/LP5995600 (PCT/GB02/._ );
(2) attorney reference number WJW/LP5995618 (PCT/GB02/_. );
(3) attorney reference number WJW/LP5995626 (PCT/GB02/~;
(4) attorney reference number WJW/LP5995634 (PCT/GB02/__ );
(5) attorney reference number WJW/LP5995642 (PCT/GB02/~;
the contents of each of which are incorporated herein by reference in their
entirety.
TECHNICAL FIELD
This invention pertains generally to the field of metabonomics, and, more
particularly, to
chemometric methods for the analysis of chemical, biochemical, and biological
data, for
example, spectral data, for example, nuclear magnetic resonance (NMR) spectra,
and
their applications, including, e.g., classification, diagnosis, prognosis,
etc., especially in
the context of atherosclerosis/coronary heart disease.
BACKG ROU N D
Throughout this specification, including the claims which follow, unless the
context
requires otherwise, the word "comprise," and variations such as "comprises"
and
"comprising," will be understood to imply the inclusion of a stated integer or
step or group
of integers or steps but not the exclusion of any other integer or step or
group of integers
or steps.
CA 02445101 2003-10-22
WO 02/086500 PCT/GB02/01854
-2-
It must be noted that, as used in the specification and the appended claims,
the singular
forms "a," "an," and "the" include plural referents unless the context clearly
dictates
otherwise.
Ranges are often expressed herein as from "about" one particular value, andlor
to
"about" another particular value. When such a range is expressed, another
embodiment
includes from the one particular value and/or to the other particular value.
Similarly,
when values are expressed as approximations, by the use of the antecedent
"about," it
will be understood that the particular value forms another embodiment.
Bios sty ems
Biosystems can conveniently be viewed at several levels of bio-molecular
organisation
based on biochemistry, i.e., genetic and gene expression (genomic and
transcriptomic),
protein and signalling (proteomic) and metabolic control and regulation
(metabonomic).
There are also important cellular ionic regulation variations that relate to
genetic,
proteomic and metabolic activities, and systematic studies on these even at
the cellular
and sub-cellular level should also be investigated to complete the full
description of the
bio-molecular organisation of a bio-system.
Significant progress has been made in developing methods to determine and
quantify
the biochemical processes occurring in living systems. Such methods are
valuable in
the diagnosis, prognosis and treatment of disease, the development of drugs,
for
improving therapeutic regimes for current drugs, and the like.
Many diseases of the human or animal body (such as cancers, degenerative
diseases,
autoimmune diseases and the like) have an underlying basis in alterations in
the
expression of certain genes. The expressed gene products, proteins, mediate
effects
such as abnormal cell growth, cell death or inflammation. Some of these
effects are
caused directly by protein-protein interactions; other are caused by proteins
acting on
small molecules (e.g. "second messengers") which trigger effects including
further gene
expression.
Likewise, disease states caused by external agents such as viruses and
bacteria
provoke a multitude of complex responses in infected host.
CA 02445101 2003-10-22
WO 02/086500 PCT/GB02/01854
-3-
In a similar manner, the treatment of disease through the administration of
drugs can
result in a wide range of desired effects and unwanted side effects in a
patient.
In recent years, it has been appreciated that the reaction of human and animal
subjects
to disease and treatments for them can vary according to the genomic makeup of
an
individual. This has ied to the development of the field of
"pharmacogenomics." A fuller
understanding of how an individual's own genome reacts to a particular disease
and/or
drug treatment will allow the development of new therapies, as well as the
refinement of
existing ones.
At the genetic level, methods for examining gene expression in response to
these types
of events are often referred to as "genomic methods," and are concerned with
the
detection and quantification of the expression of an organism's genes,
collectively
referred to as its "genome," usually by detecting and/or quantifying genetic
molecules,
such as DNA and RNA. Genomic studies often exploit proprietary "gene chips,"
which
are small disposable devices encoded with an array of genes that respond to
extracted
mRNAs produced by cells (see, for example, Klenk et al., 1997). Many genes can
be
placed on a chip array and patterns of gene expression, or changes therein,
can be
monitored rapidly, although at some considerable cost.
However, the biological consequences of gene expression, or altered gene
expression
following perturbation, are extremely complex. This has led to the development
of
"proteomic methods" which are concerned with the semi-quantitative measurement
of
the production of cellular proteins of an organism, collectively referred to
as its
"proteome" (see, for example, Geisow, 1998). Proteomic measurements utilise a
variety
of technologies, but all involve a protein separation method, e.g., 2D gel-
electrophoresis,
allied to a chemical characterisation method, usually, some form of mass
spectrometry.
At present, genomic methods have a high associated operational cost and
proteomic
methods require investment in expensive capital cost equipment and are labour
intensive, but both have the potential to be powerful tools for studying
biological
response. The choice of method is still uncertain since careful studies have
sometimes
shown a low correlation between the pattern of gene expression and the pattern
of
protein expression, probably due to sampling for the two technologies at
inappropriate
time points. See, e.g., Gygi et al., 1999. Even in combination, genomic and
proteomic
methods still do not provide the range of information needed for understanding
CA 02445101 2003-10-22
WO 02/086500 PCT/GB02/01854
-4-
integrated cellular function in a living system, since they do not take
account of the
dynamic metabolic status of the whole organism.
For example, genomic and proteomic studies may implicate a particular gene or
protein
in a disease or a xenobiotic response because the level of expression is
altered, but the
change in gene or protein level may be transitory or may be counteracted
downstream
and as a result there may be no effect at the cellular and/or biochemical
level.
Conversely, sampling tissue for genomic and proteomic studies at inappropriate
time
points may result in a relevant gene or protein being overlooked.
Gene-based prognosis has yet to become a clinical reality for any major
prevalent
disease, almost all of which have multi-gene modes of inheritance and
significant
environmental impact making it difficult to identify the gene panels
responsible for
susceptibility.
While genomic and proteomic methods may be useful aids, for example, in drug
development, they do suffer from substantial limitations. For example, while
genomic
and proteomic methods may ultimately give profound insights into toxicological
mechanisms and provide new surrogate biomarkers of disease, at present it is
very
difficult to relate genomic and proteomic findings to classical cellular or
biochemical
indices or endpoints. One simple reason for this is that with current
technology and
approach, the correlation of the time-response to drug exposure is difficult.
Further
difficulties arise with in vitro cell-based studies. These difficulties are
particularly
important for the many known cases where the metabolism of the compound is a
prerequisite for a toxic effect and especially true where the target organ is
not the site of
primary metabolism. This is particularly true for pro-drugs, where some aspect
of in situ
chemical (e.g., enzymatic) modification is required for activity.
Metabonomics
A new "metabonomic" approach has been developed which is aimed at augmenting
and
complementing the information provided by genomics and proteomics.
"Metabonomics"
is conventionally defined as "the quantitative measuremenfi of the
multiparametric
metabolic response of living systems to pathophysiological stimuli or genetic
modification" (see, for example, Nicholson et al., 1999). This concept has
arisen
primarily from the application of'H NMR spectroscopy to study the metabolic
CA 02445101 2003-10-22
WO 02/086500 PCT/GB02/01854
-5-
composition of biofluids, cells, and tissues and from studies utilising
pattern recognition
(PR), expert systems and other chemoinformatic tools to interpret and classify
complex
NMR-generated metabolic data sets. Metabonomic methods have the potential,
ultimately, to determine the entire dynamic metabolic make-up of an organism.
As outlined above, each level of bio-molecular organisation requires a series
of analytical
bio-technologies appropriate to the recovery of the individual types of bio-
molecular data.
Genomic, proteomic and metabonomic technologies by definition generate massive
data
sets which require appropriate multi-variate statistical tools (chemometrics,
bio-
informatics) for data mining and to extract useful biological information.
These data
exploration tools also allow the inter-relationships between multivariate data
sets from
the different technologies to be investigated, they facilitate dimension
reduction and
extraction of latent properties and allow multidimensional visualization.
This leads to the concept of "bionomics", the quantitative measurement and
understanding of the integrated function (and dysfunction)of biological
systems at all
major levels of bio-molecular organisation. In the study of altered gene
expression,
(known as transcriptomics), the variables are mRNA responses measured using
gene
chips, in proteomics, protein synthesis and asociated post-translational
modifications are
typically measured using (mainly) gel-electrophoresis coupled to mass
spectrometry. In
both cases, thousands of variables can be measured and related to biological
end-points
using statistical methods. In metabolic (metabonomic) studies, only NMR
(especially'H)
and mass spectrometry has been used to provide this level of data density on
bio-
materials although these data can be supplemented by conventional biochemical
assays.
For in vivo mammalian studies, the ability to perform metabonomic studies on
biofluids
such as plasma, CSF and urine is very important because it gives integrated
systems-
based information on the whole organism. Furthermore, in clinical settings,
for the full
utilization of functional genomic knowledge in patient screening, diagnostics
and
prognostics, it is much more practical and ethically-acceptable to analyze
biofluid
samples than to perform human tissue biopsies and measure gene responses.
A pathological condition or a xenobiotic may act at the pharmacological level
only and
hence may not affect gene regulation or expression directly. Alternatively
significant
disease or toxicological effects may be completely unrelated to gene
switching. For
CA 02445101 2003-10-22
WO 02/086500 PCT/GB02/01854
-6-
example, exposure to ethanol in vivo may cause many changes in gene expression
but
none of these events explains drunkenness. In cases such as these, genomic and
proteomic methods are likely to be ineffective. However, all disease or drug-
induced
pathophysiological perturbations result in disturbances in the ratios and
concentrations,
binding or fluxes of endogenous biochemicals, either by direct chemical
reaction or by
binding to key enzymes or nucleic acids that control metabolism. If these
disturbances
are of sufficient magnitude, effects will result which will affect the
efficient functioning of
the whole organism. In body fluids, metabolites are in dynamic equilibrium
with those
inside cells and tissues and, consequently, abnormal cellular processes in
tissues of the
whole organism following a toxic insult or as a consequence of disease will be
reflected
in altered biofluid compositions.
Fluids secreted, excreted, or otherwise derived from an organism ("biofluids")
provide a
unique window into its biochemical status since the composition of a given
biofluid is a
consequence of the function of the cells that are intimately concerned with
the fluid's
manufacture and secretion. For example, the composition of a particular fluid
(e.g.,
urine, blood plasma, milk, etc.) can carry biochemical information on details
of organ
function (or dysfunction), for example, as a result of xenobiotics, disease,
and/or genetic
modification. Similarly, the composition and condition of an organism's
tissues are also
indicators of the organism's biochemical status.
In general, a xenobiotic is a substance (e.g., compound, composition) which is
administered to an organism, or to which the organism is exposed. In general,
xenobiotics are chemical, biochemical or biological species (e.g., compounds)
which are
not normally present in that organism, or are normally present in that
organism, but not
at the level obtained following administration/ exposure. Examples of
xenobiotics include
drugs, formulated medicines and their components (e.g., vaccines,
immunological
stimulants, inert carrier vehicles), infectious agents, pesticides,
herbicides, substances
present in foods (e.g. plant compounds administered to animals), and
substances
present in the environment.
In general, a disease state pertains to a deviation from the normal healthy
state of the
organism. Examples of disease states include, but are not limited to,
bacterial, viral, and
parasitic infections; cancer in all its forms; degenerative diseases (e.g.,
arthritis, multiple
sclerosis); trauma (e.g., as a result of injury); organ failure (including
diabetes);
CA 02445101 2003-10-22
WO 02/086500 PCT/GB02/01854
-7-
cardiovascular disease (e.g., atherosclerosis, thrombosis); and, inherited
diseases
caused by genetic composition (e.g., sickle-cell anaemia).
In general, a genetic modification pertains to alteration of the genetic
composition of an
organism. Examples of genetic modifications include, but are not limited to:
the
incorporation of a gene or genes into an organism from another species;
increasing the
number of copies of an existing gene or genes in an organism; removal of a
gene or
genes from an organism; and, rendering a gene or genes in an organism non-
functional.
Biofluids often exhibit very subtle changes in metabolite profile in response
to external
stimuli. This is because the body's cellular systems attempt to maintain
homeostasis
(constancy of internal environment), for example, in the face of cytotoxic
challenge. One
means of achieving this is to modulate the composition of biofluids. Hence,
even when
cellular homeostasis is maintained, subtle responses to disease or toxicity
are expressed
in altered biofluid composition. However, dietary, diurnal and hormonal
variations may
also influence biofluid compositions, and it is clearly important to
differentiate these
effects if correct biochemical inferences are to be drawn from their analysis.
Metabonomics offers a number of distinct advantages (over genomics and
proteomics) in
a clinical setting: firstly, it can often be performed on standard
preparations (e.g., of
serum, plasma, urine, etc.), circumventing the need for specialist
preparations of cellular
RNA and protein required for genomics and proteomics, respectively. Secondly,
many of
the risk factors already identified (e.g., levels of various lipids in blood)
are small
molecule metabolites which will contribute to the metabonomic dataset.
Application of NMR to Metabonomics
One of the most successful approaches to biofluid analysis has been the use of
NMR
spectroscopy (see, for example, Nicholson et al., 1989); similarly, intact
tissues have
been successfully analysed using magic-angle-spinning'H NMR spectroscopy (see,
for
example, Moka et al., 1998; Tomlins et al., 1998).
The NMR spectrum of a biofluid provides a metabolic fingerprint or profile of
the
organism from which the biofluid was obtained, and this metabolic fingerprint
or profile is
characteristically changed by a disease, toxic process, or genetic
modification. For
example, NMR spectra may be collected for various states of an organism (e.g.,
pre-
CA 02445101 2003-10-22
WO 02/086500 PCT/GB02/01854
-$_
dose and various times post-dose, for one or more xenobiotics, separately or
in
combination; healthy (control) and diseased animal; unmodified (control) and
genetically
modified animal).
For example, in the evaluation of undesired toxic side-effects of drugs, each
compound
or class of compound produces characteristic changes in the concentrations and
patterns of endogenous metabolites in biofluids that provide information on
the sites and
basic mechanisms of the toxic process. 'H NMR analysis of biofluids has
successfully
uncovered novel metabolic markers of organ-specific toxicity in the laboratory
rat, and it
is in this "exploratory" role that NMR as an analytical biochemistry technique
excels.
However, the biomarker information in NMR spectra of biofluids is very subtle,
as
hundreds of compounds representing many pathways can often be measured
simultaneously, and it is this overall metabonomic response to toxic insult
that so well
characterises the lesion.
Another important advantage of NMR-based metabonomics over genomics or
proteomics is the intrinsic analytical accuracy of NMR spectroscopy.
Reanalysis of the
same sample by 1 H NMR spectroscopy results in a typical coefficient of
variation for the
measurement of peak intensities in a spectrum of less than 5% across the whole
range
20 of peaks. Thus if the appropriate experiments are undertaken, on average
the value of
each peak intensity will lie in the range 0.95 to 1.05 of the true value. In
addition, it is
possible using NMR spectroscopy to measure absolute amounts or concentrations
of a
number of analytes whereas using gene chip technology only fold changes can be
determined. The best available accuracy achieved using gene chips is a two
fold
25 change, i.e., the value for each parameter lies in the range 0.50 to 2.00
fold of the "true"
value) and proteomic technology is even less intrinsically accurate. A similar
limitation
also applies to proteomic studies.
Although, undoubtedly, technology is improving at a rapid rate the gap between
the
30 intrinsic accuracies of NMR spectroscopy and gene chip technology is so
wide that it will
require a revolutionary rather than evolutionary improvement in gene
expression
quantification methodology before it can rival the accuracy of NMR
spectroscopy.
The intrinsic accuracy of NMR provides a distinct advantage when applying
pattern
35 recognition techniques. The multivariate nature of the NMR data means that
CA 02445101 2003-10-22
WO 02/086500 PCT/GB02/01854
_g_
classification of samples is possible using a combination of descriptors even
when one
descriptor is not sufficient, because of the inherently low analytical
variation in the data.
All biological fluids and tissues have their own characteristic physico-
chemical
properties, and these affect the types of NMR experiment that may be usefully
employed. One major advantage of using NMR spectroscopy to study complex
biomixtures is that measurements can often be made with minimal sample
preparation
(usually with only the addition of 5-10% D20) and a detailed analytical
profile can be
obtained on the whole biological sample. Sample volumes are small, typically
0.3 to 0.5
m!_ for standard probes, and as low as 3 pf. for microprobes. Acquisition of
simple NMR
spectra is rapid and efficient using flow-injection technology. It is usually
necessary to
suppress the water NMR resonance.
Many biofluids are not chemically stable and for this reason care should be
taken in their
collection and storage. For example, cell lysis in erythrocytes can easily
occur. If a
substantial amount of DSO has been added, then it is possible that certain'H
NMR
resonances will be lost by H/D exchange. Freeze-drying of biofluid samples
also causes
the loss of volatile components such as acetone. Biofluids are also very prone
to
microbiological contamination, especially fluids, such as urine, which are
difficult to
collect under sterile conditions. Many biofluids contain significant amounts
of active
enzymes, either normally or due to a disease state or organ damage, and these
enzymes may alter the composition of the biofluid following sampling. Samples
should
be stored deep frozen to minimise the effects of such contamination. Sodium
azide is
usually added to urine at the collection point to act as an antimicrobial
agent. Metal ions
and or chelating agents (e.g., EDTA) may be added to bind to endogenous metal
ions
(e.g., Ca2+, Mg~+ and Zn2+) and chelating agents (e.g., free amino acids,
especially
glutamate, cysteine, histidine and aspartate; citrate) to intentionally alter
and/or enhance
the NMR spectrum.
In all cases the analytical problem usually involves the detection of "trace"
amounts of
analytes in a very complex matrix of potential interferences. It is,
therefore, critical to
choose a suitable analytical technique for the particular class of analyte of
interest in the
particular biomatrix which could be, for example, a biofluid or a tissue. High
resolution
NMR spectroscopy (in particular'H NMR) appears to be particularly appropriate.
The
main advantages of using'H NMR spectroscopy in this area are the speed of the
method (with spectra being obtained in 5 to 10 minutes), the requirement for
minimal
CA 02445101 2003-10-22
WO 02/086500 PCT/GB02/01854
-10-
sample preparation, and the fact that it provides a non-selective detector for
all
metabolites in the biofluid regardless of their structural type, provided only
that they are
present above the detection limit of the NMR experiment and that they contain
non-
exchangeable hydrogen atoms. The speed advantage is of crucial importance in
this
area of work as the clinical condition of a patient may require rapid
diagnosis, and can
change very rapidly and so correspondingly rapid changes must be made to the
therapy
provided.
NMR studies of body fluids should ideally be performed at the highest magnetic
field
available to obtain maximal dispersion and sensitivity and most'H NMR studies
have
been performed at 400 MHz or greater. With every new increase in available
spectrometer frequency the number of resonances that can be resolved in a
biofluid
increases and although this has the effect of solving some assignment
problems, it also
poses new ones. Furthermore, there are still important problems of spectral
interpretation that arise due to compartmentation and binding of small
molecules in the
organised macromolecular domains that exist in some biofluids such as blood
plasma
and bile. All this complexity need not reduce the diagnostic capabilities and
potential of
the technique, but demonstrates the problems of biological variation and the
influence of
variation on diagnostic certainty.
The information content of biofluid spectra is very high and the complete
assignment of
the'H NMR spectrum of most biofluids is usually not possible (even using 900
MHz
NMR spectroscopy). However, the assignment problems vary considerably between
biofluid types. Some fluids have near constant composition and concentrations
and in
these the majority of the NMR signals have been assigned. In contrast, urine
composition can be very variable and there is enormous variation in the
concentration
range of NMR-detectable metabolites; consequently, complete analysis is much
more
difficult. Those metabolites present close to the limits of detection for 1-
dimensional (1D)
NMR spectroscopy (typically ca. 100 nM at 800 MHz) pose severe NMR spectral
assignment problems. (In absolute terms, the detection limit may be ca. 4
nmol, e.g., 1
pg of a 250 g/mol compound in a 0.5 mL sample volume.) Even at the present
level of
technology in NMR, it is not yet possible to detect many important biochemical
substances (e.g. hormones, some proteins, nucleic acids) in body fluids
because of
problems with sensitivity, line widths, dispersion and dynamic range and this
area of
research will continue to be technology-limited. In addition, the collection
of NMR
CA 02445101 2003-10-22
WO 02/086500 PCT/GB02/01854
-11-
spectra of biofluids may be complicated by the relative water intensity,
sample viscosity,
protein content, lipid content, and low molecular weight peak overlap.
Usually in order to assign'H NMR spectra, comparison is made with spectra of
authentic
materials and/or by standard addition of an authentic reference standard to
the sample.
Additional confirmation of assignments is usually sought from the application
of other
NMR methods, including, for example, 2-dimensional (2D) NMR methods,
particularly
COSY (correlation spectroscopy), TOCSY (total correlation spectroscopy),
inverse-detected heteronuclear correlation methods such as HMBC (heteronuclear
multiple bond correlation), HSQC (heteronuclear single quantum coherence), and
HMQC
(heteronuclear multiple quantum coherence), 2D J-resolved (JRES) methods, spin-
echo
methods, relaxation editing, diffusion editing (e.g., both 1 D NMR and 2D NMR
such as
diffusion-edited TOCSY), and multiple quantum filtering. Detailed'H NMR
spectroscopic
data for a wide range of metabolites and biomolecules found in biofluids have
been
published (see, for example, Lindon et al., 1999) and supplementary
information is
available in several literature compilations of data (see, for example, Fan,
1996; Sze et
al., 1994).
For example, the successful application of'H NMR spectroscopy of biofluids to
study a
variety of metabolic diseases and toxic processes has now been well
established and
many novel metabolic markers of organ-specific toxicity have been discovered
(see, for
example, Nicholson et al., 1989; Lindon et a!., 1999). For example, NMR
spectra of
urine is identifiably altered in situations where damage has occurred to the
kidney or
liver. It has been shown that specific and identifiable changes can be
observed which
distinguish the organ that is the site of a toxic lesion. Also it is possible
to focus in on
particular parts of an organ such as the cortex of the kidney and even in
favourable
cases to very localised parts of the cortex.
It is also possible to deduce the biochemical mechanism of the xenobiotic
toxicity, based
on a biochemical interpretation of the changes in the urine. A wide range of
toxins has
now been investigated including mostly kidney toxins and liver toxins, but
also testicular
toxins, mitochondria) toxins and muscle toxins.
CA 02445101 2003-10-22
WO 02/086500 PCT/GB02/01854
-12-
Pattern Recognition
However, a limiting factor in understanding the biochemical information from
both 1 D and
2D-NMR spectra of tissues and biofluids is their complexity. The most
efficient way to
investigate these complex multiparametric data is employ the 1 D and 2D NMR
metabonomic approach in combination with computer-based "pattern recognition"
(PR)
methods and expert systems. These statistical tools are similar to those
currently being
explored by workers in the fields of genomics and proteomics.
Pattern recognition (PR) methods can be used to reduce the complexity of data
sets, to
generate scientific hypotheses and to test hypotheses. In general, the use of
pattern
recognition algorithms allows the identification, and, with some methods, the
.
interpretation of some non-random behaviour in a complex system which can be
obscured by noise or random variations in the parameters defining the system.
Also, the
number of parameters used can be very large such that visualisation of the
regularities,
which for the human brain is best in no more than three dimensions, can be
difficult.
Usually the number of measured descriptors is much greater than three and so
simple
scatter plots cannot be used to visualise any similarity between samples.
Pattern
recognition methods have been used widely to characterise many different types
of
problem ranging for example over linguistics, fingerprinting, chemistry and
psychology.
In the context of the methods described herein, pattern recognition is the use
of
multivariate statistics, both parametric and non-parametric, to analyse
spectroscopic
data, and hence to classify samples and to predict the value of some dependent
variable
based on a range of observed measurements. There are two main approaches. One
set of methods is termed "unsupervised" and these simply reduce data
complexity in a
rational way and also produce display plots which can be interpreted by the
human eye.
The other approach is termed "supervised" whereby a training set of samples
with known
class or outcome is used to produce a mathematical model and this is then
evaluated
with independent validation data sets.
Unsupervised PR methods are used to analyse data without reference to any
other
independent knowledge, for example, without regard to the identity or nature
of a
xenobiotic or its mode of action. Examples of unsupervised pattern recognition
methods
include principal component analysis (PCA), hierarchical cluster analysis
(HCA), and
non-linear mapping (NLM).
CA 02445101 2003-10-22
WO 02/086500 PCT/GB02/01854
-13-
One of the most useful and easily applied unsupervised PR techniques is
principal
components analysis (PCA) (see, for example, Kowalski et al, 1986). Principal
components (PCs) are new variables created from linear combinations of the
starting
variables with appropriate weighting coefficients. The properties of these PCs
are such
that: (i) each PC is orthogonal to (uncorrelated with) all other PCs, and (ii)
the first PC
contains the largest part of the variance of the data set (information
content) with
subsequent PCs containing correspondingly smaller amounts of variance.
PCA, a dimension reduction technique, takes m objects or samples, each
described by
values in K dimensions (descriptor vectors), and extracts a set of
eigenvectors, which
are linear combinations of the descriptor vectors. The eigenvectors and
eigenvalues are
obtained by diagonalisation of the covariance matrix of the data. The
eigenvectors can
be thought of as a new set of orthogonal plotting axes, called principal
components
(PCs). The extraction of the systematic variations in the data is accomplished
by
projection and modelling of variance and covariance structure of the data
matrix. The
primary axis is a single eigenvector describing the largest variation in the
data, and is
termed principal component one (PC1). Subsequent PCs, ranked by decreasing
eigenvalue, describe successively less variability. The variation in the data
that has not
been described by the PCs is called residual variance and signifies how well
the model
fits the data. The projections of the descriptor vectors onto the PCs are
defined as
scores, which reveal the relationships between the samples or objects. In a
graphical
representation (a "scores plot" or eigenvector projection), objects or samples
having
similar descriptor vectors will group together in clusters. Another graphical
representation
is called a loadings plot, and this connects the PCs to the individual
descriptor vectors,
and displays both the importance of each descriptor vector to the
interpretation of a PC
and the relationship among descriptor vectors in that PC. In fact, a loading
value is
simply the cosine of the angle which the original descriptor vector makes with
the PC.
Descriptor vectors which fall close to the origin in this plot carry little
information in the
PC, while descriptor vectors distant from the origin (high loading) are
important in
interpretation.
Thus a plot of the first two or three PC scores gives the "best"
representation, in terms of
information content, of the data set in two or three dimensions, respectively.
A plot of the
first two principal component scores, PC1 and PC2 provides the maximum
information
content of the data in two dimensions. Such PC maps can be used to visualise
inherent
clustering behaviour, for example, for drugs and toxins based on similarity of
their
CA 02445101 2003-10-22
WO 02/086500 PCT/GB02/01854
-14-
metabonomic responses and hence mechanism of action. Of course, the clustering
information might be in lower PCs and these have also to be examined.
Hierarchical Cluster Analysis, another unsupervised pattern recognition
method, permits
the grouping of data points which are similar by virtue of being "near" to one
another in
some multidimensional space. Individual data points may be, for example, the
signal
intensities for particular assigned peaks in an NMR spectrum. A "similarity
matrix," S, is
constructed with elements s;~ = 1 - rj/rj"'ax, where r;~ is the interpoint
distance between
points i and j (e.g., Euclidean interpoint distance), and r~~max is the
largest interpoint
distance for all points. The most distant pair of points will have s;~ equal
to 0, since r;~
then equals r;~maX. Conversely, the closest pair of points will have the
largest s;~. For two
identical points, s;~ is 1.
The similarity matrix is scanned for the closest pair of points. The pair of
points are
reported with their separation distance, and then the two points are deleted
and replaced
with a single combined point. The process is then repeated iteratively until
only one
point remains. A number of different methods may be used to determine how two
clusters will be joined, including the nearest neighbour method (also known as
the single
fink method), the furthest neighbour method, and the centroid method
(including centroid
link, incremental link, median link, group average link, and flexible link
variations).
The reported connectivities are then plotted as a dendrogram (a tree-like
chart which
allows visualisation of clustering), showing sample-sample connectivities
versus
increasing separation distance (or equivalently, versus decreasing
similarity). The
dendrogram has the property in which the branch lengths are proportional to
the
distances between the various clusters and hence the length of the branches
linking one
sample to the next is a measure of their similarity. In this way, similar data
points may
be identified algorithmically.
Non-linear mapping (NLM) is a simple concept which involves calculation of the
distances between all of the points in the original K dimensions. This is
followed by
construction of a map of points in 2 or 3 dimensions where the sample points
are placed
in random positions or at values determined by a prior principal components
analysis.
The least squares criterion is used to move the sample points in the lower
dimension
map to fit the inter-point distances in the lower dimension space to those in
the K
dimensional space. Non-linear mapping is therefore an approximation to the
true inter-
CA 02445101 2003-10-22
WO 02/086500 PCT/GB02/01854
-15-
point distances, but points close in K-dimensional space should also be close
in 2 or 3
dimensional space (see, for example, Brown et al., 1996; Farrant et al.,
1992).
In this simple metabonomic approach, a sample from an animal treated with a
compound
of unknown toxicity is compared with a database of NMR-generated metabolic
data from
control and toxin-treated animals. By observing its position on the PR map
relative to
samples of known effect, the unknown toxin can often be classified. The same
approach
can be used for human samples for classification according to disease.
However, such
data are often more complex, with time-related biochemical changes detected by
NMR.
Also, it is more rigorous to compare effects of xenobiotics in the original K-
dimensional
NMR metabonomic space.
Alternatively, and in order to develop automatic classification methods, it
has proved
efficient to use a "supervised" approach to NMR data analysis. Here, a
"training set" of
NMR metabonomic data is used to construct a statistical model that predicts
correctly the
"class" of each sample. This training set is then tested with independent data
(referred
to as a test or validation set) to determine the robustness of the computer-
based model.
These models are sometimes termed "expert systems," but may be based on a
range of
different mathematical procedures. Supervised methods can use a data set with
reduced dimensionality (for example, the first few principal components), but
typically
use unreduced data, with all dimensionality. In all cases the methods allow
the
quantitative description of the multivariate boundaries that characterise and
separate
each class, for example, each class of xenobiotic in terms of its metabolic
effects. It is
also possible to obtain confidence limits on any predictions, for example, a
level of
probability to be placed on the goodness of fit (see, for example, Kowalski et
al., 1986).
The robustness of the predictive models can also be checked using cross-
validation, by
leaving out selected samples from the analysis.
Expert systems may operate to generate a variety of useful outputs, for
example,
(i) classification of the sample as "normal" or "abnormal" (this is a useful
tool in the
control of spectrometer automation, e.g., using sequential flow injection NMR
spectroscopy); (ii) classification of the target organ for toxicity and site
of action within
the tissue where in certain cases, mechanism of toxic action may also be
classified; and,
(iii) identification of the biomarkers of a pathological disease condition or
toxic effect for
the particular compound under study. For example, a sample can be classified
as
belonging to a single class of toxicity, to multiple classes of toxicity (more
than one target
CA 02445101 2003-10-22
WO 02/086500 PCT/GB02/01854
-16-
organ), or to no class. The latter case would indicate deviation from
normality (control)
based on the training set model but having a dissimilar metabolic effect to
any toxicity
class modelled in the training set (unknown toxicity type). Under (ii), a
system could also
be generated to support decisions in clinical medicine (e.g., for efficacy of
drugs) rather
than toxicity.
Examples of supervised pattern recognition methods include the following:
soft independent modelling of class analysis (SIMCA) (see, for example, Wold,
1976);
partial least squares analysis (PLS) (see, for example, Wold, 1966; Joreskog,
1982; Frank, 1984; Bro, R., 1997);
linear descriminant analysis (LDA) (see, for example, Nillson, 1965);
K-nearest neighbour analysis (KNN) (see, for example, Brown et al., 1996);
artificial neural networks (ANN) (see, for example, Wasserman, 1989; Anker et
al., 1992; Hare, 1994);
probabilistic neural networks (PNNs) (see, for example, Parzen, 1962; Bishop,
1995; Speckt, 1990; Broomhead et al., 1988; Patterson, 1996);
rule induction (RI) (see, for example, Quinlan, 1986); and,
Bayesian methods (see, for example, Bretthorst, 1990a, 1990b, 1988).
As the size of metabonomic databases increases together with improvements in
rapid
throughput of NMR samples (> 300 samples per day per spectrometer is now
possible
with the first generation of flow injection systems), more subtle expert
systems may be
necessary, for example, using techniques such as "fuzzy logic" which permit
greater
flexibility in decision boundaries.
Application to Metabonomics
Pattern recognition methods have been applied to the analysis of metabonomic
data.
See, for example, Lindon et al., 2001. A number of spectroscopic techniques
have been
used to generate the data, including NMR spectroscopy and mass spectrometry.
Pattern
recognition analysis of such data sets has been succesful in some cases. The
successful studies include, for example, complex NMR data from biofluids,
(see, for
example, Anthony et al., 1994; Anthony et al., 1995; Beckwith-Hall et al.,
1998; Gartland
et al., 1990a; Gartland et al., 1990b; Gartland et al., 1991; Holmes et al.,
1998a; Holmes
et al., 1998b; Holmes et al., 1992; Holmes et al., 1994; Spraul et al., 1994;
Tranter et al.,
CA 02445101 2003-10-22
WO 02/086500 PCT/GB02/01854
-17-
1999) conventional NMR spectra from tissue samples (Somorjai et al., 1995),
magic-
angle-spinning (MAS) NMR spectra of tissues (Garrod et al., 2001), in vivo NMR
spectra
(Morvan et al., 1990; Howells et al., 1993; Stoyanova et al., 1995; Kuesel et
al., 1996;
Confort-Gouny et al., 1992; Weber et al., 1998), wines (Martin et al., 1998,
1999) and
plant tissues (Kopka et al., 2000).
Although the utility of the metabonomic approach is well established, its full
potential has
not yet been exploited. The metabolic variation is often subtle, and powerful
analysis
methods are required for detection of particular analytes, especially when the
data (e.g.,
NMR spectra) are so complex. For example, all that has been previously
proposed is
still not generally sufficient to achieve clinically useful diagnosis of
disease. New
methods to extract useful metabolic information from biofluids are needed.
The inventors have developed novel methods (which employ multivariate
statistical
analysis and pattern recognition (PR) techniques, and optionally data
filtering
techniques) of analysing data (e.g., NMR spectra) from a test population which
yield
accurate mathematical models which may subsequently be used to classify a test
sample or subject, and/or in diagnosis.
Unlike methods previously described, the methods described herein have the
power to
provide clinically useful and accurate diagnostic and prognostic information
in a medical
setting.
The methods described herein represent a significant advance over chemometric
methodologies described previously. Although chemometrics has been able to
provide
some classification of types previously, the studies have required that the
classification
be done under a series of restrictions which limit the ability to apply the
method to
analysis of complex datasets as would be required to apply the method for the
practical
diagnosis/prognosis of diseases that could be useful clinically.
For example, several studies have reported on the classification of animals on
the basis
of an NMR spectrum of urine or plasma. Although these studies clearly
demonstrate the
potential of the technique, they are limited because the animals which compose
each
class are genetically homogenous (in-bred populations). As a result, these
methods
have been demonstrated to be able to detect patterns but only against "low
noise"
backgrounds. Application of metabonomics to "real" populations (e.g., in human
clinical
CA 02445101 2003-10-22
WO 02/086500 PCT/GB02/01854
-18-
practice) requires the ability to detect patterns against the substantial
noise due to the
genetic variation of out-bred populations and also due to dietary and hormonal
differences.
Similarly, many of the studies described to date have examined relatively
major
differences between groups, for example, the ability to differentiate renally
acting toxins
from liver acting toxins. The two groups under study differed in a broad
spectrum of
metabolites making the pattern relatively easy to detect. In conjugation with
the
restriction of using in-bred populations of animals, most studies published to
date have
only demonstrated metabonomics to be practicable under conditions of high
"signal to
noise" ratio, conditions which are very different from the human clinical
environment.
Some studies have begun to attempt classifications of out-bred human
populations
where the data variation is high. However, to date, all these studies have
simplified the
system substantially to focus in on specific molecules: for example, some
studies have
looked specifically at the resonances associated with lipoproteins. Since
lipoproteins are
major constituents of plasma, the variance they contribute readily exceeds the
background variance due to genetic and environmental differences between
individuals.
Unfortunately, such an approach is insufficiently powerful to identify weak
patterns
against the background biochemical noise, and could not be used, for example,
to
determine the extent of coronary heart disease or to distinguish identical
from non-
identical twins. Identification of such low "signal to noise" ratio patterns
requires the
application of the methods of this invention, which represent a significant
advance over
what has been previously reported.
CA 02445101 2003-10-22
WO 02/086500 PCT/GB02/01854
-19-
SUMMARY OF THE INVENTION
One aspect of the present invention pertains to a method of classifying a
sample, as
described herein.
One aspect of the present invention pertains to a method of classifying a
subject as
described herein.
One aspect of the present invention pertains to a method of diagnosing a
subject as
described herein.
One aspect of the present invention pertains to a method of identifying a
diagnostic
species, or a combination of a plurality of diagnostic species, for a
predetermined
condition, as described herein.
One aspect of the present invention pertains to a diagnostic species
identified by a
method as described herein.
One aspect of the present invention pertains to a diagnostic species
identified by a
method as described herein, for use in a method of classification.
One aspect of the present invention pertains to a method of classification
which employs
or relies upon one or more diagnostic species identified by a method as
described herein
One aspect of the present invention pertains to use of one or more diagnostic
species
identified by a method of classification as described herein.
One aspect of the present invention pertains to an assay for use in a method
of
classification, which assay relies upon one or more diagnostic species
identified by a
method as described herein.
One aspect of the present invention pertains to use of an assay in a method of
classification, which assay relies upon one or more diagnostic species
identified by a
method as described herein.
CA 02445101 2003-10-22
WO 02/086500 PCT/GB02/01854
-20-
One aspect of the present invention pertains to a method of therapeutic
monitoring of a
subject undergoing therapy which employs a method of classification as
described
herein.
One aspect of the present invention pertains to a method of evaluating drug
therapy
and/or drug efficacy which employs a method of classification, as described
herein.
One aspect of the present invention pertains to a computer system or device,
such as a
computer or linked computers, operatively configured to implement a method as
described herein; and related computer code computer programs, data carriers
carrying
such code and programs, and the like.
These and other aspects of the present invention are described herein.
As will be appreciated by one of skill in the art, features and preferred
embodiments of
one aspect of the present invention will also pertain to other aspects of the
present
invention.
CA 02445101 2003-10-22
WO 02/086500 PCT/GB02/01854
-21 -
BRIEF DESCRIPTION OF THE DRAWINGS
Figure 1-CHD is a 600 MHz 1-D'H NMR spectrum for serum obtained from (A) a
patient
with normal coronary arteries (NCA); and (B) a patient with triple vessel
disease patient
(TVD). The spectra were recorded at a temperature of 300 K, corrected for
phase and
baseline distortions, and chemical shifts were referenced to that of lacfiate
(CH3; ~ 1.33).
Figure 2A-CHD is a scores scatter plot for PC3 and PC2 (t3 vs. t2) for the
principal
components analysis (PCA) model derived from 1-D'H NMR spectra from serum
samples from NCA (circles, ~) and TVD (squares, ~) patients.
Figure 2B-CHD is the corresponding loadings scatter plot (p3 vs. p2) for the
PCA shown
in Figure 2A-CHD.
Figure 2C-CHD is a scores scatter plot for PCZ and PC1 (t2 vs. t1) for the PCA
model
derived from 1-D'H NMR spectra from serum samples from NCA (circles, ~) and
TVD
(squares, r) patients. Prior to PCA, the data were filtered (in this case,
using orthogonal
signal correction, OSC).
Figure 2D-CHD is the corresponding loadings scatter plot (p2 vs. p1) for the
PCA shown
in Figure 2C-CHD.
Figure 2E-CHD is a scores scatter plot for PC2 and PC1 (t2 vs. t1) for the PLS-
DA model
derived from 1-D'H NMR spectra from serum samples from NCA (circles, ~) and
TVD
(squares, ~) patients. Prior to PCA, the data were filtered (in this case,
using orthogonal
signal correction, OSC).
Figure 2F-CHD is the corresponding loadings scatter plot (w*c2 vs. w*c1 ) for
the PLS-DA
shown in Figure 2E-CHD.
Figure 3A-CHD shows a section of the variable importance plot (VIP) for the
OSC-PLS-DA model, showing the calculated importance of the 13 most important
variables.
CA 02445101 2003-10-22
WO 02/086500 PCT/GB02/01854
-22-
Figure 3B-CHD is a plot of the regression coefficients of the 1-D'H NMR
variables for
the TVD serum samples, derived from the OSC-PLS-DA. Each bar represents a
spectral
region covering S 0.04.
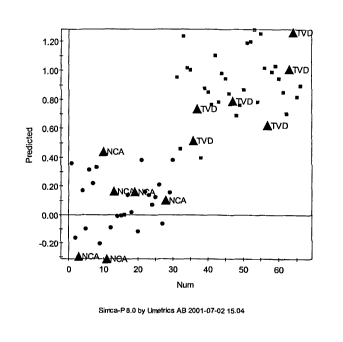
Figure 4-CHD is a y-predicted scatter plot, showing NCA (circles, ~) and l'VD
(squares,
~) samples and validation samples (triangle, ~, NCA or TVA as marked), for an
OSC-PLS-DA model.
Figure 5A-CHD is the scores scatter plot for PC2 and PC1 (t2 vs. t1) for the
PCA model
calculated from 1-D'H NMR data for all three classes of serum sample: type "1"
vessel
disease (triangles, ~), type "2" vessel disease (circles, ~), and type "3"
vessel disease
(squares, ~).
Figure 5B-CHD is the corresponding loadings scatter plot (p2 vs. p1) for the
PCA shown
in Figure 5A-CHD.
Figure 5C-CHD shows three pairs of plots (a scores scatter plot for PC2 and
PC1
(t2 vs. t1) for a PLS-DA model calculated from 1-D'H NMR data for pairs of
classes of
serum samples, and the corresponding w*c loadings plot (wc2 vs. wc1)). In the
scores
plots, type "1" samples are denoted by triangles (~); type "2" samples are
denoted by
circles (~); and type "3" samples are denoted by squares (~).
Figure 5C-(1)-CHD: type "1" and "2" scores scatter plot.
Figure 5C-(2)-CHD: type "1" and "2" loadings w*c scatter plot.
Figure 5C-(3)-CHD: type "2" and "3" scores scatter plot.
Figure 5C-(4)-CHD: type "2" and "3" loadings w*c scatter plot.
Figure 5C-(5)-CHD: type "1" and "3" scores scatter plot.
Figure 5C-(6)-CHD: type "1" and "3" loadings w*c scatter plot.
Figure 6A-CHD is a scores scatter plot for PC2 and PC1 (t2 vs. t1) calculated
for a PCA
model calculated using filtered 1-D'H NMR data (in this case, filtered using
orthogonal
signal correction, OSC), for all three classes of serum sample: type "1"
vessel disease
(triangles, ~); type "2" vessel disease (circles, ~); and type "3" vessel
disease (squares,
).
Figure 6B-CHD is the corresponding loadings scatter plot (p2 vs. p1) for PCA
shown in
Figure 5A-CHD.
CA 02445101 2003-10-22
WO 02/086500 PCT/GB02/01854
-23-
Figure 6C-CHD shows three pairs of plots (a scores scatter plot for PC2 and
PC1
(t2 vs. t1) for a PLS-DA model calculated from 1-D'H NMR data for pairs of
classes of
serum samples, following OSC, and the corresponding w*c loadings plot (wc2 vs.
wc1)).
In the scores plots, type "1" samples are denoted by triangles (1); type "2"
samples are
denoted by circles (.); and type "3" samples are denoted by squares (~).
Figure 6C-(1)-CHD: type "1" and "2" scores scatter plot.
Figure 6C-(2)-CHD: type "1" and "2" loadings w*c scatter plot.
Figure 6C-(3)-CHD: type "2" and "3" scores scatter plot.
Figure 6C-(4)-CHD: type "2" and "3" loadings w*c scatter plot.
Figure 6C-(5)-CHD: type "1" and "3" scores scatter plot.
Figure 6C-(6)-CHD: type "1" and "3" loadings w*c scatter plot.
Figure 7-CHD shows, for each of the three models described in Figure 6C, both
a
section of the variable importance plot (VIP) and a plot of the regression
coefficients for
the respective OSC-PLS-DA model. Each bar represents a spectral region
covering 5
0.04.
Figure 7-(1)-CHD: VIP for "1" and "2" vessel disease samples.
Figure 7-(2)-CHD: Regression coefficients, "1" with respect to "2" vessel
disease.
Figure 7-(3)-CHD: VIP for "2" and "3" vessel disease samples.
Figure 7-(4)-CHD: Regression coefficients, "2" with respect to "3" vessel
disease.
Figure 7-(5)-CHD: VIP for "1" and "3" vessel disease samples.
Figure 7-(6)-CHD: Regression coefficients, "1" with respect to "3" vessel
disease.
Figure 8-CHD shows three y-predicted scatter plots, showing type "1"
(triangles, ~), type
"2" (circles, ~), type "3" (squares, ~) and validation samples (diamonds), for
PLS-DA
models calculated for the same data, following OSC.
Figure 8A-CHD: type "1" and "2".
Figure 8B-CHD: type "2" and "3".
Figure 8C-CHD: type "1" and "3".
Figure 9A-CHD is a scores scatter plot for PC2 and PC1 (t2 vs. t1) for a PCA
model
calculated from established clinical parameters for subjects with type "1"
(triangles, 1),
type "2" (circles, ~), type "3" (squares, ~) vessel disease.
CA 02445101 2003-10-22
WO 02/086500 PCT/GB02/01854
-24-
Figure 9B-CHD is the corresponding loadings scatter plot (p2 vs. p1) for the
PCA shown
in Figure 9A-CHD.
Figure 9C-CHD shows three pairs of plots (a scores scatter plot for PC2 and
PC1
(t2 vs. t1) for a PLS-DA model calculated using established clinical
parameters, and the
corresponding loadings w*c plot (w*c2 vs. w*c1)). In the scores plots, type
"1" samples
are denoted by triangles (~); type "2" samples are denoted by circles (~); and
type "3"
samples are denoted by squares (~).
Figure 9C-(1)-CHD: type "1" and "2" scores scatter plot.
Figure 9C-(2)-CHD: type "1" and "2" loadings w*c scatter plot.
Figure 9C-(3)-CHD: type "2" and "3" scores scatter plot.
Figure 9C-(4)-CHD: type "2" and "3" loadings w*c scatter plofi.
Figure 9C-(5)-CHD: type "1" and "3" scores scatter plot.
Figure 9C-(6)-CHD: type "1" and "3" loadings w*c scatter plot.
Figure 10-CHD shows, for each of the three models described in Figure 9C, both
a
section of the variable importance plot (VIP) and a plot of the regression
coefficients for
the respective OSC-PLS-DA models. Each bar represents a spectral region
covering b
0.04.
Figure 10-(1)-CHD: VIP for "1" and "2" vessel disease samples.
Figure 10-(2)-CHD: Regres. coefs., "1" with respect to "2" vessel disease.
Figure 10-(3)-CHD: VIP for "2" and "3" vessel disease samples.
Figure 10-(4)-CHD: Regres. coefs., "2" with respect to "3" vessel disease.
Figure 10-(5)-CHD: VIP for "1" and "3" vessel disease samples.
Figure 10-(6)-CHD: Regres. coefs., "1" with respect to "3" vessel disease.
CA 02445101 2003-10-22
WO 02/086500 PCT/GB02/01854
-25-
DETAILED DESCRIPTION OF THE INVENTION
Introduction
The inventors have developed novel methods (which employ multivariate
statistical
analysis and pattern recognition (PR) techniques, and optionally data
filtering
techniques) of analysing data (e.g., NMR spectra) from a test population which
yield
accurate mathematical models which may subsequently be used to classify a test
sample or subject, and/or in diagnosis.
An NMR spectrum provides a fingerprint or profile for the sample to which it
pertains.
Such spectra represent a measure of all NMR detectable species present in the
sample
(rather than a select few) and also, to some extent, interactions between
these species.
As such, these spectra are characterised by a high data density which,
heretofore, has
not been fully exploited.
The methods described herein facilitate the analysis of such spectra, and the
subsequent use of the results of that analysis to classify test spectra (and
therefore the
associated samples and subjects, if applicable) according to one or more
distinguishing
criteria, at a discrimination level never before achieved.
These methods find particular application in the field of medicine. For
example, analysis
of NMR spectra for samples taken from a population characterised by a certain
condition
yields a mathematical model which can be used to classify an NMR spectrum for
a
sample from a test subject as positive (also having the condition) or negative
(not having
the condition) with a high degree of confidence.
In effect, these methods facilitate the identification of the particular
combination of
amounts of (e.g., endogenous) species which are invariably associated with the
presence of the condition. These combinations (patterns), which typically
comprise
many (often small) uncorrelated variances which together are diagnostic, are
encoded
within the high data density of the NMR spectra. The methods described herein
permit
their identification and subsequent use for classification.
CA 02445101 2003-10-22
WO 02/086500 PCT/GB02/01854
-26-
However, it must be stressed that metabonomic analysis based on NMR spectra is
much
more powerful than simply using a high technology analytical tool (the NMR
spectrometer) to measure the levels of known metabolites. That is, the methods
described herein are distinct from methods which simply carry out multiple
independent
measures of discrete chemical entitities (e.g., LDL cholesterol
concentration).
For example, considering the variance in NMR spectral intensity (total peak
intensity) in
any particular defined chemical shift region (known as a bucket or bin), a
part of that
variance may be associated with a given molecule (a biomarker), the level of
which
varies consistently as a result of the condition under study. The remainder of
the
variance may be due to differences in the levels of other molecules which give
peaks in
that integral region but which are unrelated to the condition under study
(e.g., individual
to individual differences such as dietary factors, age, gender, etc.).
The methods described herein, which employ pattern recognition techniques,
permit
identification of that NMR peak intensity which is related to the condition
under study,
even though only a small part of the variance in a spectral region (bucket)
may be
related to the condition under study. The identification power is enhanced by
the
application of data filtering techniques (e.g., orthogonal signal correction,
OSC) which
can lower the influence of buckets with variance unrelated to the condition of
interest.
Actual identification of the molecular biomarkers contributing to significant
buckets is
carried out by reexamination of the original NMR spectra by NMR experts, and
could
involve additional NMR spectroscopic experiments such as 2-dimensional NMR
spectroscopy; separation of putative substances and their identification using
HPLC-NMR-MS; addition of authentic substance to the sample and re-measuring
the
NMR spectrum, checking for coincidence of NMR peaks; etc.
For example, in NMR spectra of blood plasma, in the region around 5 1.2-1.3, a
number
of peaks appear, all of which will contribute to the intensity in those
buckets labelled
i5 1.30 (e.g., the chemical shift region b 1.32-1.28), b 1.26 (e.g., the
region b 1.28-1.24),
and 6 1.22 (e.g., the region b 1.24-1.20). Given the bucket width of 0.04 ppm
(i.e., 24 Hz
at 600 MHz), the wings of the lorentzian lines of the NMR resonances will have
contributions in most or all of these buckets even though the peak maximum
appears in
a single bucket. The two main broad NMR peak envelopes in this region of the
spectrum
have been assigned to the long chain methylene groups of the fatty acyl chains
of
lipoproteins, and in addition there are a number of small molecule metabolites
which
CA 02445101 2003-10-22
WO 02/086500 PCT/GB02/01854
-27-
have NMR resonances in this region, some of which have been assigned. See,
e.g.,
Nicholson et al, 1995. These include the methyl resonances of lactate (a
doublet at 5
1.33), threonine (a doublet at 5 1.32), fucose (a doublet at S 1.31 ), in some
cases
3-hydroxybutyrate (a doublet at S 1.20) and part of the methylene resonance of
isoleucine (a multiplet at b 1.28). The two overlapping lipoprotein peaks have
been
assigned as mainly VLDL at S 1.29 and mainly LDL at b 1.25. However both of
these
signals are asymmetric in appearance and are comprised of a number of
overlapping
resonances. By examination of the'H NMR spectra of individual lipoprotein
fractions, it
has been possible to use mathematical deconvolution techniques to show that
this
composite envelope in the S 1.3-1.2 region is comprised of two bands from
VLDL, 3
bands from LDL and 2 bands from HDL. See, e.g., M. Ala-ICorpela, Progress in
NMR
Spectroscopy, 27, 475-554 (1995)). in fact, the inventors have shown that the
variance
in the spectral intensity in the bucket at b 1.30 is only weakly correlated
with the LDL
level measured independently for a panel of 100 patients. The correlation
coefficient (r)
between the level of LDL as measured by a conventional method and the bucket
intensity at b 1.30 in the NMR spectra of the same samples, is only 0.45.
Therefore, the
changes in the concentration of LDL over the samples in this panel of 100
patients only
accounts for about 20% of the variance in this bucket intensity, since
variance is
proportional to rz. Thus the variance in the intensity in the b 1.30 bucket,
over the
sample population, contains much more information than solely the variance in
the LDL
concentration. The methods the present invention permit the determination and
exploitation of such of the additional, until now hidden, information.
Furthermore, the methods can be applied to achieve classification into
multiple
categories on the basis of a single dataset (e.g., an NMR spectrum for a
single sample).
Due to the very high data density of the input dataset, the analysis method
can
separately (i.e., in parallel) or sequentially (i.e., in series) perform
multiple classifications.
For example, a single blood sample could be used to determine (e.g., diagnose)
the
presence or absence of several, or indeed, many, (e.g., unrelated) conditions
or
diseases.
Thus, one aspect of the present invention pertains to improved methods for the
analysis
of chemical, biochemical, and biological data, for example spectra, for
example, nuclear
magnetic resonance (NMR) and other types of spectra.
CA 02445101 2003-10-22
WO 02/086500 PCT/GB02/01854
-28-
Atherosclerosis/Coronary Heart Disease
These techniques have been applied to the analysis of blood serum in the
context of
atherosclerosis/coronary heart disease. For example, the metabonomic analysis
can
distinguish between individuals with and without atherosclerosis/coronary
heart disease.
Novel diagnostic biomarkers for atherosclerosis/coronary heart disease have
been
identified, and associated methods for diagnosis have been described.
Methods of Classifying, Diagnosing
One aspect of the present invention pertains to a method of classifying a
sample, as
described herein.
One aspect of the present invention pertains to a method of classifying a
subject by
15 classifying a sample from said subject, wherein said method of classifying
a sample is as
described herein.
One aspect of the present invention pertains to a method of diagnosing a
subject by
classifying a sample from said subject, wherein said method of classifying a
sample is as
20 described herein.
Classifying a Sample: By NMR Saectral Intensity
One aspect of the present invention pertains to a method of classifying a
sample, said
25 method comprising the step of relating NMR spectral intensity at one or
more
predetermined diagnostic spectral windows for said sample with a predetermined
condition.
One aspect of the present invention pertains to a method of classifying a
sample from a
30 subject, said method comprising the step of relating NMR spectral intensity
at one or
more predetermined diagnostic spectral windows for said sample with a
predetermined
condition of said subject.
One aspect of the present invention pertains to a method of classifying a
sample, said
35 method comprising the step of relating NMR spectra! intensity at one or
more
CA 02445101 2003-10-22
WO 02/086500 PCT/GB02/01854
-29-
predetermined diagnostic spectral windows for said sample with the presence or
absence of a predetermined condition.
One aspect of the present invention pertains to a method of classifying a
sample from a
subject, said method comprising the step of relating NMR spectral intensity at
one or
more predetermined diagnostic spectral windows for said sample with the
presence or
absence of a predetermined condition of said subject.
One aspect of the present invention pertains to a method of classifying a
sample, said
method comprising the step of relating a modulation of NMR spectral intensity,
relative to
a control value, at one or more predetermined diagnostic spectral windows for
said
sample with a predetermined condition.
One aspect of the present invention pertains to a method of classifying a
sample from a
subject, said method comprising the step of relating a modulation of NMR
spectral
intensity, relative to a control value, at one or more predetermined
diagnostic spectral
windows for said sample with a predetermined condition of said subject.
One aspect of the present invention pertains to a method of classifying a
sample, said
method comprising the step of relating a modulation of NMR spectral intensity,
relative to
a control value, at one or more predetermined diagnostic spectral windows for
said
sample with the presence or absence of a predetermined condition.
One aspect of the present invention pertains to a method of classifying a
sample from a
subject, said method comprising the step of relating a modulation of NMR
spectral
intensity, relative to a control value, at one or more predetermined
diagnostic spectral
windows for said sample with the presence or absence of a predetermined
condition of
said subject.
Classifying a Subject: By NMR Spectral Intensi~
One aspect of the present invention pertains to a method of classifying a
subject, said
method comprising the step of relating NMR spectral intensity at one or more
predetermined diagnostic spectral windows for a sample from said subject with
a
predetermined condition of said subject.
CA 02445101 2003-10-22
WO 02/086500 PCT/GB02/01854
-30-
One aspect of the present invention pertains to a method of classifying a
subject, said
method comprising the step of relating NMR spectral intensity at one or more
predetermined diagnostic spectral windows for a sample from said subject wifih
the
presence or absence of a predetermined condition of said subject.
One aspect of the present invention pertains to a method of classifying a
subject, said
method comprising the step of relating a modulation of NMR spectral intensity,
relative to
a control value, at one or more predetermined diagnostic spectral windows for
a sample
from said subject with a predetermined condition of said subject.
One aspect of the present invention pertains to a method of classifying a
subject, said
method comprising the step of relating a modulation of NMR spectral intensity,
relative to
a control value, at one or more predetermined diagnostic spectral windows for
a sample
from said subject with the presence or absence of a predetermined condition of
said
subject.
Diagnosing a Subject: By NMR Spectral Intensity
One aspect of the present invention pertains to a method of diagnosing a
predetermined
condition of a subject, said method comprising the step of relating NMR
spectral intensity
at one or more predetermined diagnostic spectral windows for a sample from
said
subject with said predetermined condition of said subject.
One aspect of the present invention pertains to a method of diagnosing a
predetermined
condition of a subject, said method comprising the step of relating NMR
spectral intensity
at one or more predetermined diagnostic spectral windows for a sample from
said
subject with the presence or absence of said predetermined condition of said
subject.
One aspect of the present invention pertains to a method of diagnosing a
predetermined
condition of a subject, said method comprising the step of relating a
modulation of NMR
spectral intensity, relative to a control value, at one or more predetermined
diagnostic
spectral windows for a sample from said subject with said predetermined
condition of
said subject.
One aspect of the present invention pertains to a method of diagnosing a
predetermined
condition of a subject, said method comprising the step of relating a
modulation of NMR
CA 02445101 2003-10-22
WO 02/086500 PCT/GB02/01854
-31 -
spectral intensity, relative to a control value, at one or more predetermined
diagnostic
spectral windows for a sample from said subject with the presence or absence
of said
predetermined condition of said subject.
Classifyina a Sample: By Amount of Diagnostic Species
One aspect of the present invention pertains to a method of classifying a
sample, said
method comprising the step of relating the amount of, or relative amount of
one or more
diagnostic species present in said sample with a predetermined condition.
One aspect of the present invention pertains to a method of classifying a
sample from a
subject, said method comprising the step of relating the amount of, or
relative amount of
one or more diagnostic species present in said sample with a predetermined
condition of
said subject.
One aspect of the present invention pertains to a method of classifying a
sample, said
method comprising the step of relating the amount of, or relative amount of
one or more
diagnostic species present in said sample with the presence or absence of a
predetermined condition.
One aspect of the present invention pertains to a method of classifying a
sample from a
subject, said method comprising the step of relating the amount of, or the
relative
amount of, one or more diagnostic species present in said sample with the
presence or
absence of a predetermined condition of said subject.
One aspect of the present invention pertains to a method of classifying a
sample, said
method comprising the step of relating a modulation of the amount of, or
relative amount
of one or more diagnostic species present in said sample, as compared to a
control
sample, with a predetermined condition.
One aspect of the present invention pertains to a method of classifying a
sample from a
subject, said method comprising the step of relating a modulation of the
amount of, or
relative amount of one or more diagnostic species present in said sample, as
compared
to a control sample, with a predetermined condition of said subject.
CA 02445101 2003-10-22
WO 02/086500 PCT/GB02/01854
-32-
One aspect of the present invention pertains to a method of classifying a
sample, said
method comprising the step of relating a modulation of the amount of, or
relative amount
of one or more diagnostic species present in said sample, as compared to a
control
sample, with the presence or absence of a predetermined condition.
One aspect of the present invention pertains to a method of classifying a
sample from a
subject, said method comprising the step of relating a modulation of the
amount of, or
relative amount of one or more diagnostic species present in said sample, as
compared
to a control sample, with the presence or absence of a predetermined condition
of said
subject.
Classifying a Subject: By Amount of Diagnostic Species
One aspect of the present invention pertains to a method of classifying a
subject, said
method comprising the step of relating the amount of, or relative amount of
one or more
diagnostic species present in a sample from said subject with a predetermined
condition
of said subject.
One aspect of the present invention pertains to a method of classifying a
subject, said
method comprising the step of relating the amount of, or relative amount of
one or more
diagnostic species present in a sample from said subject with the presence or
absence
of a predetermined condition of said subject.
One aspect of the present invention pertains to a method of classifying a
subject, said
method comprising the step of relating a modulation of the amount of, or
relative amount
of one or more diagnostic species present in a sample from said subject, as
compared to
a control sample, with a predetermined condition of said subject.
One aspect of the present invention pertains to a method of classifying a
subject, said
method comprising the step of relating a modulation of the amount of, or
relative amount
of one or more diagnostic species present in a sample from said subject, as
compared to
a confirol sample, with the presence or absence of a predetermined condition
of said
subject.
CA 02445101 2003-10-22
WO 02/086500 PCT/GB02/01854
-33-
Diagnosing a Sub'eI ct: B.y Amount of Diagnostic Species
One aspect of the present invention pertains to a method of diagnosing a
predetermined
condition of a subject, said method comprising the step of relating the amount
of, or
relative amount of one or more diagnostic species present in a sample from
said subject
with said predetermined condition of said subject.
One aspect of the present invention pertains to a method of diagnosing a
predetermined
condition of a subject, said method comprising the step of relating the amount
of, or
relative amount of one or more diagnostic species present in a sample from
said subject
with the presence or absence of said predetermined condition of said subject.
One aspect of the present invention pertains to a method of diagnosing a
predetermined
condition of a subject, said method comprising the step of relating a
modulation of the
amount of, or relative amount of one or more diagnostic species present in a
sample
from said subject, as compared to a control sample, with said predetermined
condition of
said subject.
One aspect of the present invention pertains to a method of diagnosing a
predetermined
condition of a subject, said method comprising the step of relating a
modulation of the
amount of, or relative amount of one or more diagnostic species present in a
sample
from said subject, as compared to a control sample, with the presence or
absence of
said predetermined condition of said subject.
Classifying a Sample: By Mathematical Modelling
One aspect of the present invention pertains to a method of classification,
said method
comprising the steps of:
(a) forming a predictive mathematical model by applying a modelling method to
modelling data;
(b) using said model to classify a test sample.
One aspect of the present invention pertains to a method of classifying a test
sample,
said method comprising the steps of:
(a) forming a predictive mathematical model by applying a modelling method to
modelling data;
CA 02445101 2003-10-22
WO 02/086500 PCT/GB02/01854
-34-
wherein said modelling data comprises a plurality of data sets for modelling
samples of known class;
(b) using said model to classify said test sample as being a member of one of
said known classes.
One aspect of the present invention pertains to a method of classifying a test
sample,
said method comprising the steps of:
(a) forming a predictive mathematical model by applying a modelling method to
modelling data;
wherein said modelling data comprises at least one data set for each of a
plurality
of modelling samples;
wherein said modelling samples define a class group consisting of a plurality
of
classes;
wherein each of said modelling samples is of a known class selected from said
class group; and,
(b) using said model with a data set for said test sample to classify said
test
sample as being a member of one class selected from said class group.
One aspect of the present invention pertains to a method of classification,
said method
comprising the step of:
using a predictive mathematical model;
wherein said model is formed by applying a modelling method to modelling data;
to classify a test sample.
One aspect of the present invention pertains to a method of classifying a test
sample,
said method comprising the step of:
using a predictive mathematical model;
wherein said model is formed by applying a modelling method to modelling data;
wherein said modelling data comprises a plurality of data sets for modelling
samples of known class;
to classify said test sample as being a member of one of said known classes.
One aspect of the present invention pertains to a method of classifying a test
sample,
said method comprising the step of:
using a predictive mathematical model;
wherein said model is formed by applying a modelling method to modelling data;
CA 02445101 2003-10-22
WO 02/086500 PCT/GB02/01854
-35-
wherein said modelling data comprises at least one data set for each of a
plurality
of modelling samples;
wherein said modelling samples define a class group consisting of a plurality
of
classes;
wherein each of said modelling samples is of a known class selected from said
class group;
with a data set for said test sample to classify said test sample as being a
member of one class selected from said class group.
Classifyinct a Subject: By Mathematical Modelling
One aspect of the present invention pertains to a method of classification,
said method
comprising the steps of:
(a) forming a predictive mathematical model by applying a modelling method to
modelling data;
(b) using said model to classify a subject.
One aspect of the present invention pertains to a method of classifying a
subject, said
method comprising the steps of:
(a) forming a predictive mathematical model by applying a modelling method to
modelling data;
wherein said modelling data comprises a plurality of data sets for modelling
samples of known class;
(b) using said model to classify a test sample from said subject as being a
member of one of said known classes, and thereby classify said subject.
One aspect of the present invention pertains to a method of classifying a
subject, said
method comprising the steps of:
(a) forming a predictive mathematical model by applying a modelling method to
modelling data;
wherein said modelling data comprises at least one data set for each of a
plurality
of modelling samples;
wherein said modelling samples define a class group consisting of a plurality
of
classes;
wherein each of said modelling samples is of a known class selected from said
class group; and,
CA 02445101 2003-10-22
WO 02/086500 PCT/GB02/01854
-36-
(b) using said model with a data set for a test sample from said subject to
classify
said test sample as being a member of one class selected from said class
group, and
thereby classify said subject.
One aspect of the present invention pertains to a method of classification,
said method
comprising the step of:
using a predictive mathematical model;
wherein said model is formed by applying a modelling method to modelling data;
to classify a subject.
One aspect of the present invention pertains to a method of classifying a
subject, said
method comprising the step of:
using a predictive mathematical model
wherein said model is formed by applying a modelling method to modelling data;
wherein said modelling data comprises a plurality of data sets for modelling
samples of known class;
to classify a test sample from said subject as being a member of one of said
known classes, and thereby classify said subject.
One aspect of the present invention pertains to a method of classifying a
subject, said
method comprising the step of:
using a predictive mathematical model,
wherein said model is formed by applying a modelling method to modelling data;
wherein said modelling data comprises at least one data set for each of a
plurality
of modelling samples;
wherein said modelling samples define a class group consisting of a plurality
of
classes;
wherein each of said modelling samples is of a known class selected from said
class group;
with a data set for a test sample from said subject to classify said test
sample as
being a member of one class selected from said class group, and thereby
classify said
subject.
CA 02445101 2003-10-22
WO 02/086500 PCT/GB02/01854
-37-
Diagnosing a Subject: Bar Mathematical Modelling
One aspect of the present invention pertains to a method of diagnosis, said
method
comprising the steps of:
(a) forming a predictive mathematical model by applying a modelling method to
modelling data;
(b) using said model to diagnose a subject.
One aspect of the present invention pertains to a method of diagnosing a
predetermined
condition of a subject, said method comprising the steps of:
(a) forming a predictive mathematical model by applying a modelling method to
modelling data;
wherein said modelling data comprises a plurality of data sets for modelling
samples of known class;
(b) using said model to classify a test sample from said subject as being a
member of one of said known classes, and thereby diagnose said subject.
One aspect of the present invention pertains to a method of diagnosing a
predetermined
condition of a subject, said method comprising the steps of:
(a) forming a predictive mathematical model by applying a modelling method to
modelling data;
viiherein said modelling data comprises at least one data set for each of a
plurality
of modelling samples;
wherein said modelling samples define a class group consisting of a plurality
of
classes;
wherein each of said modelling samples is of a known class selected from said
class group; and,
(b) using said model with a data set for a test sample from said subject to
classify
said test sample as being a member of one class selected from said class
group, and
thereby diagnose said subject.
One aspect of the present invention pertains to a method of diagnosis, said
method
comprising the step of:
using a predictive mathematical model;
wherein said model is formed by applying a modelling method to modelling data;
to diagnose a subject.
CA 02445101 2003-10-22
WO 02/086500 PCT/GB02/01854
-38-
One aspect of the present invention pertains to a method of diagnosing a
predetermined
condition of a subject, said method comprising the step of:
using a predictive mathematical model;
wherein said model is formed by applying a modelling method to modelling data;
wherein said modelling data comprises a plurality of data sets for modelling
samples of known class;
to classify a test sample from said subject as being a member of one of said
known classes, and thereby diagnose said subject.
One aspect of the present invention pertains to a method of diagnosing a
predetermined
condition of a subject, said method comprising the step of:
using a predictive mathematical model;
wherein said model is formed by applying a modelling method to modelling data;
wherein said modelling data comprises at least one data set for each of a
plurality
of modelling samples;
wherein said modelling samples define a class group consisting of a plurality
of
classes;
wherein each of said modelling samples is of a known class selected from said
class group;
with a data set for a test sample from said subject to classify said test
sample as
being a member of one class selected from said class group, and thereby
diagnose said
subject.
Certain Preferred Embodiments
In one embodiment, said sample is a sample from a subject, and said
predetermined
condition is a predetermined condition of said subject.
In one embodiment, said test sample is a test sample from a subject, and said
predetermined condition is a predetermined condition of said subject.
In one embodiment, said one or more predetermined diagnostic spectral windows
are
associated with one or more diagnostic species.
CA 02445101 2003-10-22
WO 02/086500 PCT/GB02/01854
-39-
In one embodiment, said relating step involves the use of a predictive
mathematical
model; for example, as described herein.
The nature of a predictive mathematical model is determined primarily by the
modelling
method employed when forming that model.
In one embodiment, said modelling method is a multivariate statistical
analysis modelling
method.
In one embodiment, said modelling method is a multivariate statistical
analysis modelling
method which employs a pattern recognition method.
In one embodiment, said modelling method is, or employs PCA.
In one embodiment, said modelling method is, or employs PLS.
In one embodiment, said modelling method is, or employs PLS-DA.
In one embodiment, said modelling method includes a step of data filtering.
In one embodiment, said modelling method includes a step of orthogonal data
filtering.
In one embodiment, said modelling method includes a step of OSC.
In one embodiment, said model takes account of one or more diagnostic species.
The precise details of the predictive mathematical model are determined
primarily by the
modelling data (e.g., modelling data sets).
In one embodiment, said modelling data comprise spectral data.
In one embodiment, said modelling data comprise both spectral data and non-
spectral
data (and is referred to as a "composite data").
In one embodiment, said modelling data comprise NMR spectral data.
CA 02445101 2003-10-22
WO 02/086500 PCT/GB02/01854
-40-
In one embodiment, said modelling data comprise both NMR spectral data and non-
NMR
spectral data.
In one embodiment, said NMR spectral data comprises'H NMR spectral data
and/or'3C
NMR spectral data.
In one embodiment, said NMR spectral data comprises'H NMR spectra( data.
In one embodiment, said modelling data comprise spectra.
In one embodiment, said modelling data are spectra.
In one embodiment, said modelling data comprises a plurality of data sets for
modelling
samples of known class.
In one embodiment, said modelling data comprises at least one data set for
each of a
plurality of modelling samples.
In one embodiment, said modelling data comprises exactly one da a set for each
of a
plurality of modelling samples.
In one embodiment, said using step is: using said model with a data set for
said test
sample to classify said test sample as being a member of one class selected
from said
class group.
In one embodiment, each of said data sets comprises spectral data.
In one embodiment, each of said data sets comprises both spectral data and non-
spectral data (and is referred to as a "composite data set").
In one embodiment, each of said data sets comprises NMR spectral data.
In one embodiment, each of said data sets comprises both NMR spectral data and
non-
NMR spectral data.
CA 02445101 2003-10-22
WO 02/086500 PCT/GB02/01854
-41 -
In one embodiment, said NMR spectral data comprises'H NMR spectral data
and/or'3C
NMR spectral data.
In one embodiment, said NMR spectral data comprises'H NMR spectral data.
In one embodiment, each of said data sets comprises a spectrum.
In one embodiment, each of said data sets comprises a'H NMR spectrum and/or
'3C NMR spectrum.
In one embodiment, each of said data sets comprises a'H NMR spectrum.
In one embodiment, each of said data sets is a spectrum.
15 In one embodiment, each of said data sets is a ~H NMR spectrum and/or'3C
NMR
spectrum.
In one embodiment, each of said data sets is a'H NMR spectrum.
20 in one embodiment, said non-spectral data is non-spectral clinical data.
In one embodiment, said non-NMR spectral data is non-spectral clinical data.
In one embodiment, said class group comprises classes associated with said
25 predetermined condition (e.g., presence, absence, degree, etc.).
In one embodiment, said class group comprises exactly two classes.
In one embodiment, said class group comprises exactly two classes: presence of
said
30 predetermined condition; and absence of said predetermined condition.
Classification, Classifyina, and Classes
As discussed above, many aspects of the present invention pertain to methods
of
35 classifying things, for example, a sample, a subject, etc. In such methods,
the thing is
classified, that is, it is associated with an outcome, or, more specifically,
it is assigned
CA 02445101 2003-10-22
WO 02/086500 PCT/GB02/01854
-42-
membership to a particular class (i.e., it is assigned class membership), and
is said "to
be of," "to belong to," "to be a member of," a particular class.
Classification is made (i.e., class membership is assigned) on the basis of
diagnostic
criteria. The step of considering such diagnostic criteria, and assigning
class
membership, is described by the word "relating," for example, in the phrase
"relating
NMR spectral intensity at one or more predetermined diagnostic spectral
windows for
said sample (i.e., diagnostic criteria) with the presence or absence of a
predetermined
condition (i.e., class membership)."
For example, "presence of a predetermined condition" is one class, and
"absence of a
predetermined condition" is another class; in such cases, classification
(i.e., assignment
to one of these classes) is equivalent to diagnosis.
Samples
As discussed above, many aspects of the present invention pertain to methods
which
involve a sample, e.g., a particular sample under study ("study sample").
In general, a sample may be in any suitable form. For methods which involve
spectra
obtained or recorded for a sample, the sample may be in any form which is
compatible
with the particular type of spectroscopy, and therefore may be, as
appropriate,
homogeneous or heterogeneous, comprising one or a combination of, for example,
a
gas, a liquid, a liquid crystal, a gel, and a solid.
Samples which originate from an organism (e.g., subject, patient) may be in
vivo; that is,
not removed from or separated from the organism. Thus, in one embodiment, said
sample is an in vivo sample. For example, the sample may be circulating blood,
which is
"probed" in situ, in vivo, for example, using NMR methods.
Samples which originate from an organism may be ex vivo; that is, removed from
or
separated from the organism (e.g., an ex vivo blood sample, an ex vivo urine
sample).
Thus, in one embodiment, said sample is an ex vivo sample.
In one embodiment, said sample is an ex vivo blood or blood-derived sample.
In one embodiment, said sample is an ex vivo blood sample.
CA 02445101 2003-10-22
WO 02/086500 PCT/GB02/01854
-43-
In one embodiment, said sample is an ex vivo plasma sample.
In one embodiment, said sample is an ex vivo serum sample.
In one embodiment, said sample is an ex vivo urine sample.
In one embodiment, said sample is removed from or separated from an/said
organism,
and is not returned to said organism (e.g., an ex vivo blood sample, an ex
vivo urine
sample).
In one embodiment, said sample is removed from or separated from an/said
organism,
and is returned to said organism (i.e., "in transit") (e.g., as with dialysis
methods). Thus,
in one embodiment, said sample is an ex vivo in transit sample.
Examples of samples include:
a whole organism (living or dead, e.g., a living human);
a part or parts of an organism (e.g., a tissue sample, an organ);
a pathological tissue such as a tumour;
a tissue homogenate (e.g. a liver microsome fraction);
an extract prepared from a organism or a part of an organism (e.g., a tissue
sample extract, such as perchloric acid extract);
an infusion prepared from a organism or a part of an organism (e.g,, tea,
Chinese
traditional herbal medicines);
an in vitro tissue such as a spheroid;
a suspension of a particular cell type (e.g. hepatocytes);
an excretion, secretion, or emission from an organism (especially a fluid);
material which is administered and collected (e.g., dialysis fluid);
material which develops as a function of pathology (e.g., a cyst, blisters);
and,
supernatant from a cell culture.
Examples of fluid samples include, for example, blood plasma, blood serum,
whole
blood, urine, (gall bladder) bile, cerebrospinal fluid, milk, saliva, mucus,
sweat, gastric
juice, pancreatic juice, seminal fluid, prostatic fluid, seminal vesicle
fluid, seminal plasma,
amniotic fluid, foetal fluid, follicular fluid, synovial fluid, aqueous
humour, ascite fluid,
cystic fluid, blister fluid, and cell suspensions; and extracts thereof.
Examples of tissue samples include liver, kidney, prostate, brain, gut, blood,
blood cells,
skeletal muscle, heart muscle, lymphoid, bone, cartilage, and reproductive
tissues.
CA 02445101 2003-10-22
WO 02/086500 PCT/GB02/01854
-44-
Still other examples of samples include air (e.g., exhaust), water (e.g.,
seawater,
groundwater, wastewater, e.g., from factories), liquids from the food industry
(e.g. juices,
wines, beers, other alcoholic drinks, tea, milk), solid-like food samples
(e.g. chocolate,
pastes, fruit peel, fruit and vegetable flesh such as banana, leaves, meats,
whether
cooked or raw, etc.).
A few preferred samples are discussed below.
Blood. Plasma, Serum
Blood is the fluid that circulates in the blood vessels of the body, that is,
the fluid that is
circulated through the heart, arteries, veins, and capillaries. The function
of the blood
and the circulation is to service the needs of other tissues: to transport
oxygen and
nutrients to the tissues, to transport carbon dioxide and various metabolic
waste
products away, to conduct hormones from one part of the body to another, and
in
general to maintain an appropriate environment in all tissue fluids for
optimal survival
and function of the cells.
Blood consists of a liquid component, plasma, and a solid component, cells and
formed
elements (e.g., erythrocytes, leukocytes, and platelets), suspended within it.
Erythrocytes, or red blood cells account for about 99.9% of the cells
suspended in
human blood. They contain hemoglobin which is involved in the transport of
oxygen and
carbon dioxide. Leukocytes, or white blood cells, account for about 0.1 % of
the cells
suspended in human blood. They play a role in the body's defense mechanism and
repair mechanism, and may be classified as agranular or granular. Agranular
leukocytes
include monocytes and small, medium and large lymphocytes, with small
lymphocytes
accounting for about 20-25% of the leukocytes in human blood. T cells and B
cells are
important examples of lymphocytes. Three classes of granular leukocytes are
known,
neutrophils, eosinophils, and basophils, with neutrophils accounting for about
60% of the
leukocytes in human blood. Platelets (i.e., thrombocytes) are not cells but
small spindle-
shaped or rodlike bodies about 3 microns in length which occur in large
numbers in
circulating blood. Platelets play a major role in clot formation.
Plasma is the liquid component of blood. It serves as the primary medium for
the
transport of materials among cellular, tissue, and organ systems and their
various
CA 02445101 2003-10-22
WO 02/086500 PCT/GB02/01854
- 45 -
external environments, and it is essential for the maintenance of normal
hemostasis.
One of the most important functions of many of the major tissue and organ
systems is to
maintain specific components of plasma within acceptable physiological limits.
Plasma is the residual fluid of blood which remains after removal of suspended
cells and
formed elements. Whole blood is typically processed to removed suspended cells
and
formed elements (e.g., by centrifugation) to yield blood plasma. Serum is the
fluid which
is obtained after blood has been allowed to clot and the clot removed. Blood
serum may
be obtained by forming a blood clot (e.g., optionally initiated by the
addition of thrombin
and calcium ion) and subsequently removing the clot (e.g., by centrifugation).
Serum
and plasma differ primarily in their content of fibrinogen and several
components which
are removed in the clotting process. Plasma may be effectively prevented from
clotting
by the addition of an anti-coagulant (e.g., sodium citrate, heparin, lithium
heparin) to
permit handling or storage. Plasma is composed primarily of water
(approximately 90%),
with approximately 7% proteins, 0.9% inorganic salts, and smaller amounts of
carbohydrates, lipids, and organic salts.
The term "blood sample," as used herein, pertains to a sample of whole blood.
The term "blood-derived sample," as used herein, pertains to an ex vivo sample
derived
from the blood of the subject under study.
Examples of blood and blood-derived samples include, but are not limited to,
whole
blood (V11B), blood plasma (including, e.g., fresh frozen plasma (FFP)), blood
serum,
blood fractions, plasma fractions, serum fractions, blood fractions comprising
red blood
cells (RBC), platelets (PLT), leukocytes, etc., and cell lysates including
fractions thereof
(for example, cells, such as red blood cells, white blood cells, etc., may be
harvested and
lysed to obtain a cell lysate).
Methods for obtaining, preparing, handling, and storing blood and blood-
derived samples
(e.g., plasma, serum) are well known in the art. Typically, blood is collected
from
subjects using conventional techniques (e.g., from the ante-cubital fossa),
typically pre-
prandially.
For use in the methods described herein, the method used to prepare the blood
fraction
(e.g., serum) should be reproduced as carefully as possible from one subject
to the next.
CA 02445101 2003-10-22
WO 02/086500 PCT/GB02/01854
-46-
It is important that the same or similar procedure be used for all subjects.
It may be
preferable to prepare serum (as opposed to plasma or other blood fractions)
for two
reasons: (a) the preparation of serum is more reproducible from individual to
individual
than the preparation of plasma, and (b) the preparation of plasma requires the
addition of
anticoagulants (e.g., EDTA, citrate, or heparin) which will be visible in the
NMR
metabonomic profile and may reduce the data density available.
A typical method for the preparation of serum suitable for analysis by the
methods
described herein is as follows: 10 mL of blood is drawn from the antecubital
fossa of an
individual who had fasted overnight, using an 18 gauge butterfly needle. The
blood is
immediately dispensed into a polypropylene tube and allowed to clot at room
temperature for 3 hours. The clotted blood is then subjected to centrifugation
(e.g.,
4,500 x g for 5 minutes) and the serum supernatant removed to a clean tube. If
necessary, the centrifugation step can be repeated to ensure the serum is
efficiently
separated from the clot. The serum supernatant may be analysed "fresh" or it
may be
stored frozen for later analysis.
A typical method for the preparation of plasma suitable for analysis by the
methods
described herein is as follows: High quality platelet-poor plasma is made by
drawing the
blood using a 19 gauge butterfly needle without the use of a tourniquet from
the
anetcubital fossa. The first 2 mL of blood drawn is discarded and the
remainder is
rapidly mixed and aliquoted info Diatube H anticoagulant fiubes (Becton
Dickinson). After
gentle mixing by inversion the anticoagulated blood is cooled on ice for 15
minutes then
subjected to centrifugation to pellet the cells and platelets (approximately
1,200 x g for
15 minutes). The platelet poor plasma supernantant is carefully removed,
drawing off
the middle third of the supernatant and discarding the upper third (which may
contain
floating platelets) and the lower third which is too close to the readily
disturbed platelet
layer on the top of the cell pellet. The plasma may then be aliquoted and
stored frozen
at -20°C or colder, and then thawed when required for assay.
Samples may be analysed immediately ("fresh"), or may be frozen and stored
(e.g., at -
80°C) ("fresh frozen") for future analysis. If frozen, samples are
completely thawed prior
to NMR analysis.
In one embodiment, said sample is a blood sample or a blood-derived sample.
In one embodiment, said sample is a blood sample.
CA 02445101 2003-10-22
WO 02/086500 PCT/GB02/01854
-47-
In one embodiment, said sample is a blood plasma sample.
In one embodiment, said sample is a blood serum sample.
Urine
The composition of urine is complex and highly variable both between species
and within
species according to lifestyle. A wide range of organic acids and bases,
simple sugars
and polysaccharides, heterocycles, polyols, low molecular weight proteins and
polypeptides are present together with inorganic species such as Na+, K+,
Caa+, Mg2+,
HC03 , S042' and phosphates.
The term "urine," as used herein, pertains to whole (or intact) urine, whether
in vivo (e.g.,
foetal urine) or ex vivo, e.g., by excretion or catheterisation.
The term "urine-derived sample," as used herein, pertains to an ex vivo sample
derived
from the urine of the subject under study (e.g., obtained by dilution,
concentration,
addition of additives, solvent- or solid-phase extraction, etc.). Analysis may
be
performed using, for example, fresh urine; urine which has been frozen and
then thawed;
urine which has been dried (e.g., freeze-dried) and then reconstituted, e.g.,
with water or
DSO.
Methods for the collection, handling, storage, and pre-analysis preparation of
many
classes of sample, especially biological samples (e.g., biofluids) are well
known in the
art. See, for example, Lindon et al., 1999.
In one embodiment, said sample is a urine sample or a urine-derived sample.
In one embodiment, said sample is a urine sample.
Organisms. Subjects. Patients
As discussed above, in many cases, samples are, or originate from, or are
drawn or
derived from, an organism (e.g., subject, patient). In such cases, the
organism may be
as defined below.
In one embodiment, the organism is a prokaryote (e.g., bacteria) or a
eukaryote (e.g.,
protoctista, fungi, plants, animals).
CA 02445101 2003-10-22
WO 02/086500 PCT/GB02/01854
-48-
In one embodiment, the organism is a prokaryote (e.g., bacteria) or a
eukaryote
(e.g., protoctista, fungi, plants, animals).
In one embodiment, the organism is a protoctista, an alga, or a protozoan.
In one embodiment, the organism is a plant, an angiosperm, a dicotyledon, a
monocotyledon, a gymnosperm, a conifer, a ginkgo, a cycad, a fern, a
horsetail, a
clubmoss, a liverwort, or a moss.
In one embodiment, the organism is an animal.
In one embodiment, the organism is a chordate, an invertebrate, an echinoderm
(e.g.,
starfish, sea urchins, brittlestars), an arthropod, an annelid (segmented
worms)
(e.g., earthworms, lugworms, leeches), a mollusk (cephalopods (e.g., squids,
octopi),
pelecypods (e.g., oysters, mussels, clams), gastropods (e.g., snails, slugs)),
a nematode
(round worms), a platyhelminthes (flatworms) (e.g., planarians, flukes,
tapeworms), a
cnidaria (e.g., jelly fish, sea anemones, corals), or a porifera (e.g.,
sponges).
In one embodiment, the organism is an arthropod, an insect (e.g., beetles,
butterflies,
moths), a chilopoda (centipedes), a diplopoda (millipedes), a crustacean
(e.g., shrimps,
crabs, lobsters), or an arachnid (e.g., spiders, scorpions, mites).
In one embodiment, the organism is a chordate, a vertebrate, a mammal, a bird,
a reptile
(e.g., snakes, lizards, crocodiles), an amphibian (e.g., frogs, toads), a bony
fish (e.g.,
salmon, plaice, eel, lungfish), a cartilaginous fish (e.g., sharks, rays), or
a jawless fish
(e.g., lampreys, hagfish).
In one embodiment, the organism (e.g., subject, patient) is a mammal.
In one embodiment, the organism (e.g., subject, patient) is a placental
mammal,
a marsupial (e.g., kangaroo, wombat), a monotreme (e.g., duckbilled platypus),
a rodent
(e.g., a guinea pig, a hamster, a rat, a mouse), murine (e.g., a mouse), a
lagomorph
(e.g., a rabbit), avian (e.g., a bird), canine (e.g., a dog), feline (e.g., a
cat), equine (e.g., a
horse), porcine (e.g., a pig), ovine (e.g., a sheep), bovine (e.g., a cow), a
primate, simian
CA 02445101 2003-10-22
WO 02/086500 PCT/GB02/01854
-49-
(e.g., a monkey or ape), a monkey (e.g., marmoset, baboon), an ape (e.g.,
gorilla,
chimpanzee, orangutang, gibbon), or a human.
Furthermore, the organism may be any of its forms of development, for example,
a
spore, a seed, an egg, a larva, a pupa, or a foetus.
fn one embodiment, the organism (e.g., subject, patient) is a human.
The subject (e.g., a human) may be characterised by one or more criteria, for
example,
sex, age (e.g., 40 years or more, 50 years or more, 60 years or more, etc.),
ethnicity,
medical history, lifestyle (e.g., smoker, non-smoker), hormonal status (e.g.,
pre
menopausal, post-menopausal), etc.
The term "population," as used herein, refers to a group of organisms (e.g.,
subjects,
patients). If desired, a population (e.g., of humans) may be selected
according to one or
more of the criteria listed above.
Conditions
As discussed above, many methods of the present invention involve assigning
class
membership, for example, to one of one or more classes, for example, to one of
the two
classes: (i) presence of a predetermined condition, or (ii) absence of a
predetermined
condition.
A condition is "predetermined" in the sense that it is the condition in
respect to which the
invention is practised; a condition is predetermined by a step of selecting a
condition for
considering, study, etc.
As used herein, the term "condition" relates to a state which is, in at least
one respect,
distinct from the state of normality, as determined by a suitable control
population.
A condition may be pathological (e.g., a disease) or physiological (e.g.,
phenotype,
genotype, fasting, water load, exercise, hormonal cycles, e.g., oestrus,
etc.).
Included among conditions is the state of "at risk of a condition,
"predisposition towards
a" condition, and the like, again as compared to the state of normality, as
determined by
CA 02445101 2003-10-22
WO 02/086500 PCT/GB02/01854
-50-
a suitable control population. In this way, osteoporosis, at risk of
osteoporosis, and
predisposition towards osteoporosis are all conditions (and are also
conditions
associated with osteoporosis).
Where fihe condition is the state of "at risk of," "predisposition towards,"
and the Pike, a
method of diagnosis may be considered to be a method of prognosis.
In this context, the phrases "at risk of," "predisposition towards," and the
like, indicate a
probability of being classified/diagnosed (or being able to be
classified/diagnosed) with
the predetermined condition which is greater (e.g., 1.5x, 2x, 5x, 10x, etc.)
than for the
corresponding control. Often, a time period (e.g., within the next 5 years, 10
years, 20
years, etc.) is associated with the probability. For example, a subject who is
2x more
likely to be diagnosed with the predetermined condition within the next 5
years, as
compared to a suitable control, is "at risk of that condition.
Included among conditions is the degree of a condition, for example, the
progress or
phase of a disease, or a recovery therefrom. For example, each of different
states in the
progress of a disease, or in the recovery from a disease, are themselves
conditions. In
this way, the degree of a condition may refer to how temporally advanced the
condition
is. Another example of a degree of a condition relates to its maximum
severity, e.g., a
disease can be classified as mild, moderate or severe). Yet another example of
a
degree of a condition relates to the nature of the condition (e.g., anatomical
site, extent
of tissue involvement, etc.).
Atherosclerosis/Coronar)r heart disease
In the present invention, said predetermined condition is associated with
atherosclerosis/coronary heart disease.
Coronary heart disease (CHD) is a major cause of mortality and morbidity in
developed
countries, affecting as many as 1 in 3 individuals before the age of 70 years
(see, e.g.,
ICannel et al., 1974).
Atherosclerosis (commonly called "hardening of the arteries"), is a vascular
condition in
which arteries narrow. It is associated with deposits of oxidised lipid on the
walls of
arteries, which accumulate and eventually harden into plaques. The arteries
become
CA 02445101 2003-10-22
WO 02/086500 PCT/GB02/01854
-51 -
calcified and lose elasticity, and as this process continues, blood flow
slows. It can affect
any artery, including, e.g., the coronary arteries.
In order to perform the arduous task of pumping blood, the heart muscle needs
a
plentiful supply of oxygen-rich blood, which is provided through a network of
coronary
arteries. Coronary artery disease is the end result of atherosclerosis,
preventing
sufficient oxygen-rich blood from reaching the heart. Oxygen deprivation in
vital cells
(called ischaemia) causes injury to the tissues of the heart. If the artery
becomes
completely blocked, damage becomes so extensive that cell death, a heart
attack,
occurs. A heart attack usually occurs when a blood clot forms completely
sealing off the
passage of blood in a coronary artery. This typically happens when the plaque
itself
develops fissures or tears; blood platelets adhere to the site to seal off the
plaque and a
blood clot (thrombus) forms.
Angina is not a disease itself but is the primary symptom of coronary artery
disease. It is
typically experienced as chest pain, which can be mild, moderate, or severe,
but is often
reported as a dull, heavy pressure that may resemble a crushing object on the
chest.
Pain often radiates to the neck, jaw, or left shoulder and arm. Less commonly,
patients
report mild burning chest discomfort, sharp chest pain, or pain that radiates
to the right
arm or back. Sometimes a patient experiences shortness of breath, fatigue, or
palpitations instead of pain. Classic angina is precipitated by exertion,
stress, or
exposure to cold and is relieved by rest or administration of nitroglycerin.
Angina can
also be precipitated by large meals, which place an immediate demand upon the
heart
for more oxygen. The intensity of the pain does not always relate to the
severity of the
medical problem. Some people may feel a crushing pain from mild ischemia,
while
others might experience only mild discomfort from severe ischemia. Some people
have
also reported a higher sensitivity to heat on the skin with the onset of
angina.
Although atherosclerosis is far and away the leading cause of angina, other
conditions
can impair the delivery of oxygen to the heart muscle and cause pain. Such
conditions
include: spasm in the coronary artery, abnormalities of the heart muscle
itself,
hyperthyroidism, anaemia, vasculitis (a group of disorders that cause
inflammation of the
blood vessels), and, in rare cases, exposure to high altitudes. Many
conditions may
cause chest pains unrelated to heart or blood vessel abnormalities. High on
the list are
anxiety attacks, gastrointestinal disorders (gallstone attacks, peptic ulcer
disease, hiatal
hernia, heartburn), lung disorders (asthma, blood clots, bronchitis,
pneumonia, collapsed
CA 02445101 2003-10-22
WO 02/086500 PCT/GB02/01854
-52-
lung), and problems affecting the ribs and chest muscles (injured muscles,
fractures,
arthritis, spasms, infections).
Stable angina can be extremely painful, but its occurrence is predictable; it
is usually
triggered by exertion or stress and relieved by rest. Stable angina responds
well to
medical treatment. Any event that increases oxygen demand can cause angina,
including exercise, cold weather, emotional tension, and even large meals.
Angina
attacks can occur at any time during the day, but a high proportion seems to
take place
between the hours of 6:00 AM and noon.
Unstable angina is a much more serious situation and is often an intermediate
stage
between stable angina and a heart attack. A patient is usually diagnosed with
unstable
angina under the following conditions: pain awakens a patient or occurs during
rest, a
patient who has never experienced angina has severe or moderate pain during
mild
exertion (walking two level blocks or climbing one flight of stairs), or
stable angina has
progressed in severity and frequency within a two-month period. Medications
are less
effective in relieving pain of unstable angina.
Another type of angina, called variant or Prinzmetal's angina, is caused by a
spasm of a
coronary artery. It almost always occurs when the patient is at rest.
Irregular heartbeats
are common, but the pain is generally relieved immediately with treatment.
Some people with severe coronary artery disease do not experience angina pain,
a
condition known as silent ischaemia, which some experts attribute to abnormal
processing of heart pain by the brain.
Coronary artery disease (premature blockage of one or more of the coronary
arteries) is
the leading killer in the USA of both men and women, responsible for over
475,000
deaths in 1996. On the positive side, mortality rates from coronary artery
disease have
significantly declined in industrialised countries over the past few decades,
although they
are on the rise in developing nations. When the necessary lifestyle changes
are enacted
in combination with appropriate medical or surgical treatments, a person
suffering angina
and heart disease has a good chance of living a normal life. Experts have
believed, for
example, that unstable angina indicates a very high risk for death after a
heart attack, but
a recent study indicated that after the first year of treatment, such a
patient's risk for
death is only 1.2% above the risk in the normal population. Much evidence
exists, in
CA 02445101 2003-10-22
WO 02/086500 PCT/GB02/01854
-53-
fact, that onset of angina less than 48 hours before a heart attack is
actually protective,
possibly by conditioning the heart to resist the damage resulting from the
attack. In one
study, people without chest pain experienced much higher complication and
mortality
rates than those with pain.
Angiographic x-ray imaging ("angiography") has grown into its own
classification of x-ray
imaging over time. The basic principal is the same as a conventional x-ray
scan: x-rays
are generated by an x-ray tube and as ti5ey pass through the body part being
imaged,
they are attenuated (weakened) at different levels. These differences in x-ray
attenuation are then measured by an image intensifier and the resulting image
is picked
up by a TV camera. In modern angiography systems, each frame of the analogue
TV
signal is then converted to a digital frame and stored by a computer in memory
and/or on
hard magnetic disk. These x-ray "movies" can be viewed in real time as the
angiography
is being performed, or they can be reviewed later using recall from digital
memory.
During angiography, physicians inject streams of contrast agents or dyes into
the area of
interest using catheters to create detailed images of the blood vessels in
real time.
During the angiographic procedure, physicians can guide a catheter into the
area of
interest to remove stenoses (blockages) of blood vessels. Patients with
blockages of the
major leg vessels, for instance, can have nearly total recovery after such
angioplasty is
performed to remove the constriction.
X-ray angiography is performed to specifically image and diagnose diseases of
the blood
vessels of the body, including the brain and heart. Traditionally, angiography
was used
to diagnose pathology of these vessels such as blockage caused by plaque build-
up.
However in recent decades, radiologists, cardiologists and vascular surgeons
have used
the x-ray angiography procedure to guide minimally invasive surgery of the
blood vessels
and arteries of the heart. In the last several years, diagnostic vascular
images are often
made using magnetic resonance imaging, computed x-ray tomography or ultrasound
and
whilst x-ray angiography is reserved for therapy. Conventional x-ray
angiography has a
lead role in the detection, diagnosis and treatment of heart disease, heart
attack, acute
stroke and vascular disease which can lead to stroke.
Most conventional x-ray angiography procedures are similar. Patient
preparation
involves removing clothing and jewellery and wearing a patient gown. In all
cases,
angiography requires that an intravenous contrast agent is administered. For
CA 02445101 2003-10-22
WO 02/086500 PCT/GB02/01854
-54-
interventional or therapeutic angiography, a small incision is made in the
groin or arm so
that a catheter can be inserted during the study. The patient is positioned on
the
examination table by the technologist so that the anatomy of interest (e.g.
coronary
arteries) is in the proper field of view between the x-ray tube and image
intensifier. The
technologist and radiologist remain at table-side during the procedure to
operate the
angiography system and work with the catheters, contrast injectors and related
devices.
Typically the patient simply needs to relax and stay calm during angiography.
Some
angiography procedures can take up to two hours while other procedures take
less than
an hour. Once the procedure is finished, the patient will be given a period of
time to
recover. During this period, the patient's case is reviewed on film or
monitor. Depending
on the type of angiographic procedure and the patient's medical condition, an
inpatient
recovery may be required or the patient may be released after a short time. In
some
cases, more images may need to be taken.
Using angiography to see inside the body, doctors can repair blood vessels
without the
use of a scalpel and fully invasive surgical methods. Advances in the design
and use of
catheters (small tubes that are guided into the blood vessels through tiny
incisions in the
groin area or upper arm) allow physicians to perform very complex therapeutic
procedures from within the blood vessel. Pathology of the blood vessels such
as plaque
build up in the arms and legs, neck and brain, and heart can be treated using
a variety of
interventional angiographic surgery (e.g. coronary angioplasty).
Although coronary angiography is the gold standard for CHD (including
detection,
diagnosis, and treatment), this technique is not without its problems.
Coronary
angiography is an extremely invasive technique and is associated with a
morbidity rate of
1 % and a mortality rate of 0.1 %. in addition to the invasive nature of
angiography, the
technique is also very expensive and time-consuming. In the UK, the average
cost for
coronary angiography is approximately ~8,000 - ~10,000 per case. The
disadvantages
associated with coronary angiography make the technique unsuitable as a
routine
screening procedure.
Over the past three decades a range of environmental and biochemical risk
factors for
the development of CHD have been identified in cross-sectional studies (see,
e.g.,
Kjelsberg et al., 1997). Examples are listed in Table 1-CHD. For example,
tobacco
smoking is associated with an approximately 2-fold increased risk of CHD (see,
e.g.,
Kuller et al., 1991). Similarly, high levels of cholesterol in large,
triglyceride-rich
CA 02445101 2003-10-22
WO 02/086500 PCT/GB02/01854
-55-
lipoprotein particles (mainly VLDL and LDL) and lower levels of cholesterol in
HDL
particles is well known to be associated with increased risk of CHD (see,
e.g., MRFIT
Research Group, 1986; Despres et al., 2000).
Table 1-CHD
Risk Factors for Coronary
Heart Disease
Fixed Risk Factors Potentially Changeable
Risk Factors
Strong Association Weak Association
age hyperlipidaemia personality
male sex cigarette smoking obesity
positive family historyhypertension gout
diabetes mellitus soft water
lack of exercise
contraceptive pill
heavy alcohol intake
These epidemiological studies have been tremendously useful in a number of
ways.
Firstly, they have underpinned public health policy on a range of issues,
discouraging
tobacco smoking and promoting low cholesterol diets (see, e.g., Mcllvain et
al., 1992;
Dolecek et al., 1986). Secondly, they have provided vital clues as to the
underlying
molecular mechanisms which cause atherosclerosis and CHD (see, e.g., Ross,
1999).
For example, once the association between elevated levels of LDL-cholesterol
and CHD
had been identified, it was possible to demonstrate that increased LDL-
cholesterol
actually causes atherosclerosis by reverse genetic techniques in mice (see,
e.g., Plump
et al., 1992; Yokode et al., 1990; Breslow, 1993). Extending these studies,
therapies
were then designed on the basis of their ability to lower LDL-cholesterol.
These lipid
lowering therapies have now been shown to be broadly effective in reducing the
risk of
myocardial infarction, even among people with normal levels of LDL-
cholesterol.
However, the risk factors identified to date from cross-sectional
epidemiological studies
are insufficiently powerful to provide a clinically useful diagnosis of CHD.
Although
algorithms have been designed based on a range of risk factors, such as age,
sex,
lipoprotein levels and blood pressure, which can identify sub-populations at
very
significant excess risk of CHD, even the best of these based on the excellent
PROCAM
study in Munster, Germany, cannot diagnose the presence of CHD on an
individual by
individual basis (see, e.g., Cullen et al., 1998). It is likely that CHD is
weakly associated
CA 02445101 2003-10-22
WO 02/086500 PCT/GB02/01854
-56-
with a very large number of environmental, physiological and biochemical
variables, and
as a result even the full range of risk factors discovered to date comprise
insufficient
density of data to accurately discriminate CHD patients from healthy controls
on an
individual basis (see, e.g., Isles et al., 2000).
Recently, there have been technical advances which have allowed datasets to be
constructed from individuals which have extremely high data densities.
Techniques such
as genomics (examining the cellular gene expression pattern of thousands of
genes
simultaneously, see, e.g., Collins et al., 2001), proteomics (examining the
cellular
contents of multiple proteins simultaneously, see, e.g., Dutt et al., 2000)
and
metabonomics (examining the changes in hundreds or thousands of low molecular
weight metabolites in an intact tissue or biofluid) offer the prospect of
efficiently
distinguishing individuals with particular disease or toxic states (see, e.g.,
Nicholson et
al., 1999).
Whereas currently, a firm diagnosis of CHD can only be made through
application of
angiography, which is both expensive and invasive, the introduction of
metabonomic
screening, as described herein, would allow diagnosis to be made simply and
cheaply on
the basis of a single blood sample, e.g., a non-invasive diagnosis of CHD.
Such
changes would revolutionize the provision of health care for CHD, allowing
both
widespread population screening and efficient targeting of drugs such as
statins which,
while being broadly effective in reducing the risk of myocardial infarction,
are difficult to
target to those most in need of treatment.
Atherosclerotic Load and Atherosclerotic Conditions
In one embodiment, the predetermined condition is related to atherosclerotic
load, for
example, a state of abnormally high atherosclerotic load.
The terms "atherosclerotic load" and "atherosclerotic burden," as used herein,
pertain to
the total volume of atherosclerotic plaque tissue found throughout the
vascular tree of a
subject. Although most direct diagnostic procedures, such as angiography,
examine
only a particular site (e.g., the coronary arteries), most biochemical tests
which depend
on analysis of the blood are associated with the total atherosclerotic load
throughout the
vascular tree. In most cases, however, the presence of atherosclerosis in one
organ
system is indicative of its presence in others. Thus, subjects with coronary
artery
CA 02445101 2003-10-22
WO 02/086500 PCT/GB02/01854
-57-
atherosclerosis will, in general, have higher total atherosclerotic load than
subjects
without coronary artery atherosclerosis. The converse is also true:
individuals with high
total atherosclerotic loads are much more likely to have coronary artery
disease than
individuals with low atherosclerotic loads. Different conditions are
associated with the
presence of atherosclerosis in particular arteries, for example, coronary
heart disease is
associated with atherosclerosis, at least in part, in the coronary arteries;
stroke is
associated with atherosclerosis, at least in part, in the carotid arteries.
In one embodiment, the predetermined condition is related to an
atherosclerotic
~ condition.
The term "atherosclerotic condition," as used herein, pertains to a condition
associated
with an abnormally high atherosclerotic load, as compared to a suitable
control
population.
Examples of atherosclerotic conditions include, but are not limited to, the
following, which
are organised by the artery system affected or most affected or most relevant:
Peripheral vascular disease (PVD). This can lead to ischemia in the
extremities, leading
to pain, morbidity and in severe cases to amputation.
Deep vein thrombosis (DVT). This is a common cause of ischemia, often
secondary to
PVD, but may have other causes (e.g., long periods of inactivity on long-haul
flights).
Diabetes macrovascular atherosclerosis. This is one of the most common
complications
of diabetes. It may also include complications at specific vascular beds, most
commonly
diabetic retinopathy and diabetic nephropathy, where the vascular beds of the
eye and
kidney, respectively, are particularly badly affected.
Coronary artery disease (CAD). This is the most common cause of heart attacks,
and is
atherosclerosis of one or more major coronary artery.
Angina. This describes the specific symptoms of CAD, and can be stable or
unstable.
CA 02445101 2003-10-22
WO 02/086500 PCT/GB02/01854
-58-
Ischemic stroke. The most common cause of stroke is ischemia secondary to
atherosclerosis of the major arteries supplying the brain. This includes all
forms of
stroke except haemorrhagic stroke.
Transient ischemic attack syndrome (TIA). This is the brain equivalent of
angina, in
which the blood supply to the brain is reduced - not sufficiently to cause
infarction (tissue
death), but sufficiently to lead to symptoms resembling epilepsy.
Renal hypertension. One of the most common causes of hypertension is
atherosclerosis
of the renal artery, which reduces kidney perfusion and upsets the blood
volume
regulatory mechanisms.
Marfan Syndrome. A relatively common inherited monogenic disorder due to
mutation in
the fibrillin genes, which results in vascular changes which can resemble
atherosclerosis.
MoyaMoya disease. This condition is similar to Marfan syndrome, but affects
predominantly the brain vasculature.
Monkeburg Syndrome. A rare monogenic disorder in which vascular calcification,
similar
to that seen in atherosclerosis, affects the aorta. This condition resembles
Marfan
syndrome and can lead to dissection of the vessel and death.
NMR Spectroscopy
As discussed above, many aspects of the present invention pertain to methods
which
employ NMR spectra, or data obtained or derived from NMR spectra.
The principal nucleus studied in biomedical NMR spectroscopy is the proton
or'H
nucleus. This is the most sensitive of all naturally occurring nuclei. The
chemical shift
range is about 10 ppm for organic molecules. In addition'3C NMR spectroscopy
using
either the naturally abundant 1.1 %'3C nuclei or employing isotopic enrichment
is useful
for identifying metabolites. The'3C chemical shift range is about 200 ppm.
Other nuclei
find special application. These include'5N (in natural abundance or enriched),
'9F for
studies of drug metabolism, and 3'P for studies of endogenous phosphate
biochemistry
either in vitro or in vivo.
CA 02445101 2003-10-22
WO 02/086500 PCT/GB02/01854
-59-
In order to obtain an NMR spectrum, it is necessary to define a "pulse
program". At its
simplest, this is application of a radio-frequency (RF) pulse followed by
acquisition of a
free induction decay (FID) - a time-dependent oscillating, decaying voltage
which is
digitised in an analog-digital converter (ADC). At equilibrium, the nuclear
spins are
present in a number of quantum states and the RF pulse disturbs this
equilibrium. The
FID is the result of the spins returning towards the equilibrium state. It is
necessary to
choose the length of the pulse (usually a few microseconds) to give the
optimum
response.
This, and other experimental parameters are chosen on the basis of knowledge
and
experience on the part of the spectroscopist. See, for example, T.D.W.
Claridge, High-
Resolution NMR Techniques in Orctanic Chemistry: A Practical Guide to Modern
NMR
for Chemists,Oxford University Press, 2000. These are based on the observation
frequency to be used, the known properties of the nucleus under study (i.e.,
the
expected chemical shift range will determine the spectral width, the desired
peak
resolution determines the number of data points, the relaxation times
determine the
recycle time between scans, etc.). The number of scans to be added is
determined by
the concentration of the analyte, the inherent sensitivity of the nucleus
under study and
its abundance (either natural or enhanced by isotopic enrichment).
After data acquisition, a number of possible manipulations are possible. The
FID can be
multiplied by a mathematical function to improve the signal-to-noise ratio or
reduce the
peak line widths. The expert operator has choice over such parameters. The FID
is
then often filled by a number of zeros and then subjected to Fourier
transformation. After
this conversion from time-dependent data to frequency dependent data, it is
necessary
to phase the spectrum so that all peaks appear upright - this is done using
two
parameters by visual inspection on screen (now automatic routines are
available with
reasonable success). At this point the spectrum baseline can be curved. To
remedy
this, one defines points in the spectrum where no peaks appear and these are
taken to
be baseline. Usually, a polynorriial function is fitted to these points, but
other methods
are available, and this function subtracted from the spectrum to provide a
flat baseline.
This can also be done in an automatic fashion. Other manipulations are also
possible. It
is possible to extend the FID forwards or backwards by "linear prediction" to
improve
resolution or to remove so-called truncation artefacts which occur if data
acquisition of a
scan is stopped before the FID has decayed into the noise. All of these
decisions are
also applicable to 2- and 3-dimensional NMR spectroscopy.
CA 02445101 2003-10-22
WO 02/086500 PCT/GB02/01854
-60-
An NMR spectrum consists of a series of digital data points with a y value
(relating to
signal strength) as a function of equally spaced x-values (frequency). These
data point
values run over the whole of the spectrum. Individual peaks in the spectrum
are
identified by the spectroscopist or automatically by software and the area
under each
peak is determined either by integration (summation of the y values of all
points over the
peak) or by curve fitting. A peak can be a single resonance or a multiplet of
resonances
corresponding to a single type of nucleus in a particular chemical environment
(e.g., the
two protons ortho to the carboxyl group in benzoic acid). Integration is also
possible of
the three dimensional peak volumes in 2-dimensional NMR spectra. The intensity
of a
peak in an NMR spectrum is proportional to the number of nuclei giving rise to
that peak
(if the experiment is conducted under conditions where each successive
accumulated
free induction decay (FID) is taken starting at equilibrium). Also, the
relative intensity of
peaks from different analytes in the same sample is proportional to the
concentration of
that analyte (again if equilibrium prevails at the start of each scan).
Thus, the term "NMR spectral intensity," as used herein, pertains to some
measure
related to the NMR peak area, and may be absolute or relative. NMR spectral
intensity
may be, for example, a combination of a plurality of NMR spectral intensities,
e.g., a
linear combination of a plurality of NMR spectral intensities.
In the context of NMR spectral intensity, the term "NMR" refers to any type of
NMR
spectroscopy.
NMR spectroscopic techniques can be classified according to the number of
frequency
axes and these include 1D-, 2D-, and 3D-NMR. 1D spectra include, for example,
single
pulse; water-peak eliminated either by saturation or non-excitation; spin-
echo, such as
CPMG (i.e., edited on the basis of spin-spin relaxation); diffusion-edited,
selective
excitation of specific spectra regions. 2D spectra include for example J-
resolved (JRES);
1 H-1 H correlation methods, such as NOESY, COSY, TOCSY and variants thereof;
heteronuclear correlation including direct detection methods, such as HETCOR,
and
inverse-detected methods, such as 1 H-13C HMQC, HSQC, HMBC. 3D spectra,
include
many variants, all of which are combinations of 2D methods, e.g. HMQC-TOCSY,
NOESY-TOCSY, etc. All of these NMR spectroscopic techniques can also be
combined
with magic-angle-spinning (MAS) in order to study samples other than isotropic
liquids,
such as tissues, which are characterised by anisotropic composition.
CA 02445101 2003-10-22
WO 02/086500 PCT/GB02/01854
-61 -
Preferred nuclei include'H and'3C. Preferred techniques for use in the present
invention include water-peak eliminated, spin-echo such as CPMG, diffusion
edited,
JRES, COSY, TOCSY, HMQC, HSQC, and HMBC.
NMR analysis (especially of biofluids) is carried out at as high a field
strength as is
practical, according to availability (very high field machines are not
widespread), cost (a
600 MHz instrument costs about ~500,000 but a shielded 800 MHz instrument can
cost
more than ~3,500,000, depending on the nature of accessory equipment
purchased),
and ability to accommodate the physical size of the instrument.
Maintenance/operational
costs do not vary greatly and are small compared to the capital cost of the
machine and
the personnel costs.
Typically, the'H observation frequency is from about 200 MHz to about 900 MHz,
more
typically from about 400 MHz to about 900 MHz, yet more typically from about
500 MHz
to about 750 MHz. 'H observation frequencies of 500 and 600 MHz may be
particularly
preferred. Instruments with the following'H observation frequencies are/were
commercially available: 200, 250, 270 (discontinued), 300, 360 (discontinued),
400, 500,
600, 700, 750, 800, and 900 MHz.
Higher frequencies are used to obtain better signal-to-noise ratio and for
greater spectral
dispersion of resonances. This gives a better chance of identifying the
molecules giving
rise to the peaks. The benefit is not linear because in addition to the better
dispersion,
the detailed spectral peaks can move from being "second-order" - where
analysis by
inspection is not possible, towards "first-order," where it is. Both peak
positions and
intensities within multiplets change in a non-linear fashion as this
progression occurs.
Lower observation frequencies would be used where cost is an issue, but this
is likely to
lead to reduced effectiveness for classification and identification of
biomarkers.
NMR Spectroscopy: Sample Preparation
NMR spectra can be measured in solid, liquid, liquid crystal or gas states
over a range of
temperatures from 120 K to 420 K and outside this range with specialised
equipment.
Typically, NMR analysis of biofluids is performed in the liquid state with a
sample
temperature of from about 274 K to about 328 K, but more typically from about
283 K to
about 321 K. An example of a typical temperature is about 300 K.
CA 02445101 2003-10-22
WO 02/086500 PCT/GB02/01854
-62-
Lower temperatures would be used to ensure that the biofluid did not suffer
from any
decomposition or show any effects of chemical or enzymatic reactions during
the data
acquisition. Higher temperatures may be used to improve detection of certain
species.
For example, for plasma or serum, lipoproteins undergo a series of phase
changes as
the temperature is increased; in particular, the low density lipoprotein (LDL)
peak
intensities are rather temperature dependent and the lines sharpen and broader
more-
difficult-to-detect components become visible as the lipoprotein becomes more
"liquid."
Typically, biofluid samples are diluted with solvent prior to NMR analysis.
This is done
for a variety of reasons, including: to lessen solution viscosity, to control
the pH of the
solution, and to allow addition of reagents and reference materials.
An example of a typical dilution solvent is a solution of 0.9% by weight of
sodium chloride
in D20. The DSO lessens the overall concentration of H20 and eases the
technical
requirements in the suppression of the solvent water NMR resonance, necessary
for
optimum detection of metabolite NMR signals. The deuterium nuclei of the DSO
also
provides an NMR signal for locking the magnetic field enabling the exact co-
registration
of successive scans.
Depending on the available amount of the biofluid, typically, the dilution
ratio is from
about 1:50 to about 5:1 by volume, but more typically from about 1:20 to about
1:1 by
volume. An example of a typical dilution ratio is 3:7 by volume (e.g., 150 p,L
sample,
350 p,L solvent), typical for conventional 5 mm NMR tubes and for flow-
injection NMR
spectroscopy.
Typical sample volumes for NMR analysis are from about 50 pL (e.g., for
microprobes) to
about 2 mL. An example of a typical sample volume is about 500 p,L.
NMR peak positions (chemical shifts) are measured relative to that of a known
standard
compound usually added directly to the sample. For biofluids such as urine
this is
commonly a partially deuterated form of TSP, i.e., 3-trimethylsilyl-
[2,2,3,3?H4]-propionate
sodium salt. For biofluids containing high levels of proteins, this substance
is not
suitable since it binds to proteins and shows a broadened NMR line. Added
formate
anion (e.g., as a salt) can be used in such cases as for blood plasma.
CA 02445101 2003-10-22
WO 02/086500 PCT/GB02/01854
-63-
NMR Spectroscopy: Manipulation of NMR Spectra
NMR spectra are typically acquired, and subsequently, handled in digitised
form.
Conventional methods of spectral pre-processing of (digital) spectra are well
known, and
include, where applicable, signal averaging, Fourier transformation (and other
transformation methods), phase correction, baseline correction, smoothing, and
the like
(see, for example, Lindon et al., 1980).
Modern spectroscopic methods often permit the collection of high or very high
resolution
spectra. In digital form, even a simple spectrum (e.g., signal versus
spectroscopic
parameter) may have many thousands, if not tens of thousands of data points.
It is often
desirable to reduce or compress the data to give fewer data points, for both
practical
computing methods and also to effect some degree of signal averaging to
compensate
for physical effects, such as pH variation, compartmentalisation, and the
like. The
resulting data may be referred to as "spectral data."
For example, a typical'H NMR spectrum is recorded as signal intensity versus
chemical
shift (5) which ranges from about i5 0 to b 10. At a typical chemical shift
resolution of
about b 10~'-103 ppm, the spectrum in digital form comprises about 10,000 to
100,000
data points. As discussed above, it is often desirable to compress this data,
for example,
by a factor of about 10 to 100, to about 1000 data points.
For example, in one approach, the chemical shift axis, b, is "segmented" into
"buckets"
or "bins" of a specific length. For a 1-D'H NMR spectrum which spans the range
from b
0 to 5 10, using a bucket length, DiS, of 0.04 yields 250 buckets, for
example, S 10.0-
9.96, b 9.96-9.92, b 9.92-9.88, etc., usually reported by their midpoint, for
example, b
9.98, i5 9.94, i5 9.90, etc. The signal intensity within a given bucket may be
averaged or
integrated, and the resulting value reported. In this way, a spectrum with,
for example,
100,000 original data points can be compressed to an equivalent spectrum with,
for
example, 250 data points.
A similar approach can be applied to 2-D spectra, 3-D spectra, and the like.
For 2-D
spectra, the "bucket" approach may be extended to a "patch." For 3-D spectra,
the
"bucket" approach may be extended to a "volume." For example, a 2-D °H
NMR
spectrum which spans the range from b 0 to b 10 on both axes, using a patch of
~S 0.1 x
CA 02445101 2003-10-22
WO 02/086500 PCT/GB02/01854
-64-
~S 0.1 yields 10,000 patches. In this way, a spectrum with perhaps 108
original data
points can be compressed to an equivalent spectrum of 104 data points.
In this context, the equivalent spectrum may be referred to as "a spectral
data set," "a
data set comprising spectral data," etc.
Software for such processing of NMR spectra, for example AMIX (Analysis of
MIXture, V
2.5, Bruker Analytik, Rheinstetten, Germany) is commercially available.
Often, certain spectral regions carry no real diagnostic information, or carry
conflicting
biochemical information, and it is often useful to remove these "redundant"
regions
before performing detailed analysis. In the simplest approach, the data points
are
deleted. In another simple approach, the data in the redundant regions are
replaced with
zero values.
For example, due to the dynamic range problem with water in comparison with
other
molecules, the water resonance (around S 4.7) is suppressed. However, small
variations
in water suppression remain, and these variations can undesirably complicate
analysis.
Similarly, variations in water suppression may also affect the urea signal
(around b 6.0),
by cross saturation. Therefore, it is often useful to delete certain spectral
regions, for
example, from about b 4.5 to 6.0 (e.g., b 4.52 to 6.00).
In general, NMR data is handled as a data matrix. Typically, each row in the
matrix
corresponds to an individual sample (often referred to as a "data vector"),
and the entries
in the columns are, for example, spectral intensity of a particular data
point, at a
particular 5 or AS (often referred to as "descriptors").
It is often useful to pre-process data, for example, by addressing missing
data,
translation, scaling, weighting, etc.
Multivariate projection methods, such as principal component analysis (PCA)
and partial
least squares analysis (PLS), are so-called scaling sensitive methods. By
using prior
knowledge and experience about the type of data studied, the quality of the
data prior to
multivariate modelling can be enhanced by scaling and/or weighting. Adequate
scaling
and/or weighting can reveal the important and interesting variation hidden
within in the
data, and therefore make subsequent multivariate modelling more efficient.
Scaling and
CA 02445101 2003-10-22
WO 02/086500 PCT/GB02/01854
-65-
weighting may be used to place the data in the correct metric, based on
knowledge and
experience of the studied system, and therefore reveal patterns already
inherently
present in the data.
If at all possible, missing data, for example, gaps in column values, should
be avoided.
However, if necessary, such missing data may replaced or "filled" with, for
example, the
mean value of a column ("mean fill"); a random value ("random fill"); or a
value based on
a principal component analysis ("principal component fill"). Each of these
different
approaches will have a dift'erent effect on subsequent PR analysis.
"Translation" of the descriptor coordinate axes can be useful. Examples of
such
translation include normalisation and mean centring.
"Normalisation" may be used to remove sample-to-sample variation. Many
normalisation
approaches are possible, and they can often be applied at any of several
points in the
analysis. Usually, normalisation is applied after redundant spectral regions
have been
removed. In one approach, each spectrum is normalised (scaled) by a factor of
1/A,
where A is the sum of the absolute values of all of the descriptors for that
spectrum. In
this way, each data vector has the same length, specifically, 1. For example,
if the sum
of the absolute values of intensities for each bucket in a particular spectrum
is 1067, then
the intensity for each bucket for this particular spectrum is scaled by
1!1067.
"Mean centring" may be used to simplify interpretation. Usually, for each
descriptor, the
average value of that descriptor for all samples is subtracted. In this way,
the mean of a
descriptor coincides with the origin, and all descriptors are "centred" at
zero. For
example, if the average intensity at b 10.0-9.96, for all spectra, is 1.2
units, then the
intensity at S 10.0-9.96, for all spectra, is reduced by 1.2 units.
In "unit variance scaling," data can be scaled to equal variance. Usually, the
value of
each descriptor is scaled by 1/StDev, where StDev is the standard deviation
for that
descriptor for all samples. For example, if the standard deviation at 5 10.0-
9.96, for all
spectra, is 2.5 units, then the intensity at i5 10.0-9.96, for all spectra, is
scaled by 1/2.5 or
0.4. Unit variance scaling may be used to reduce the impact of "noisy" data.
For
example, some metabolites in biofluids show a strong degree of physiological
variation
(e.g., diurnal variation, dietary-related variation) that is unrelated to any
CA 02445101 2003-10-22
WO 02/086500 PCT/GB02/01854
-66-
pathophysiological process. Without unit variance scaling, these noisy
metabolites may
dominate subsequent analysis.
"Pareto scaling" is, in some sense, intermediate between mean centering and
unit
variance scaling. In effect, smaller peaks in the spectra can influence the
model to a
higher degree than for the mean centered case. Also, the loadings are, in
general, more
interpretable than for unit variance based models. In pareto scaling, the
value of each
descriptor is scaled by 1/sqrt(StDev), where StDev is the standard deviation
for that
descriptor for all samples. In this way, each descriptor has a variance
numerically equal
to its initial standard deviation. The pareto scaling may be performed, for
example, on
raw data or mean centered data.
"Logarithmic scaling" may be used to assist interpretation when data have a
positive
skew and/or when data spans a large range, e.g., several orders of magnitude.
Usually,
for each descriptor, the value is replaced by the logarithm of that value. For
example,
the intensity at i5 10.0-9.96 is replaced the logarithm of the intensity at 5
10.0-9.96, for all
spectra.
In "equal range scaling," each descriptor is divided by the range of that
descriptor for all
samples. In this way, all descriptors have the same range, that is, 1. For
example, if, at
S 10.0-9.96, for all spectra, the largest value is 87 units and the smallest
value is 1, then
the range is 86 units, and the intensity at S 10.0-9.96, for all spectra, is
divided by 86
units. However, this method is sensitive to presence of outlier points.
In "autoscaling," each data vector is mean centred and unit variance scaled.
This
technique is a very useful because each descriptor is then weighted equally
and, in the
case of NMR descriptors, large and small peaks are treated with equal
emphasis. This
can be important for metabolites present at very low, but still detectable,
levels.
Several supervised methods of scaling data are also known. Some of these can
provide
a measure of the ability of a parameter (e.g., a descriptor) to discriminate
between
classes, and can be used to improve classification by stretching a separation.
For example, in "variance weighting," the variance weight of a single
parameter (e.g., a
descriptor) is calculated as the ratio of the inter-class variances to the sum
of the intra-
class variances. A large value means that this variable is discriminating
between the
CA 02445101 2003-10-22
WO 02/086500 PCT/GB02/01854
-67-
classes. For example, if the samples are known to fall into two classes (e.g.,
a training
set), it is possible to examine the mean and variance of each descriptor. If a
descriptor
has very different mean values and a small variance, then it will be good at
separating
the classes.
"Feature weighting" is a more general description of variance weighting, where
not only
the mean and standard deviation of each descriptor is calculated, but other
well known
weighting factors, such as the Fisher weight, are used.
Multivariate Statistical Analysis
As discussed above, multivariate statistics analysis methods, including
pattern
recognition methods, are often the most convenient and efficient way to
analyse complex
data, such as NMR spectra.
For example, such analysis methods may be used to identify, for example
diagnostic
spectral windows andlor diagnostic species, for a particular condition under
study.
Also, such analysis methods may be used to form a predictive model, and then
use that
model to classify test data. For example, one convenient and particularly
effective
method of classification employs multivariate statistical analysis modelling,
first to form a
model (a "predictive mathematical model") using data ("modelling data") from
samples of
known class (e.g., from subjects known to have, or not have, a particular
condition), and
second to classify an unknown sample (e.g., "test data"), as having, or not
having, that
condition.
Examples of pattern recognition methods include, but are not limited to,
Principal
Component Analysis (PCA) and Partial Least Squares-Discriminant Analysis (PLS-
DA).
PCA is a bilinear decomposition method used for overviewing "clusters" within
multivariate data. The data are represented in K-dimensional space (where K is
equal to
the number of variables) and reduced to a few principal components (or latent
variables)
which describe the maximum variation within the data, independent of any
knowledge of
class membership (i.e., "unsupervised"). The principal components are
displayed as a
set of "scores" (t) which highlight clustering, trends, or outliers, and a set
of "loadings" (p)
CA 02445101 2003-10-22
WO 02/086500 PCT/GB02/01854
-68-
which highlight the influence of input variables on t. See, for example,
Kowalski et al.,
1986).
The PCA decomposition can be described by the following equation:
X=TP'+E
where T is the set of scores explaining the systematic variation between the
observations in X and P is the set of loadings explaining the between variable
variation
and provides the explanation to clusters, trends, and outliers in the score
space. The
non-systematic part of the variation not explained by the model forms the
residuals, E.
PLS-DA is a supervised multivariate method yielding latent variables
describing
maximum separation between known classes of samples. PLS-DA is based on PLS
which is the regression extension of the PCA method explained earlier. When
PCA
works to explain maximum variation between the studied samples PLS-DA suffices
to
explain maximum separation between known classes of samples in the data (X).
This is
done by a PLS regression against a "dummy vector or matrix" (Y) carrying the
class
separating information. The calculated PLS components will thereby be more
focused
on describing the variation separating the classes in X if this information is
present in the
data. From an interpretation point of view all the features of PLS can be
used, which
means that the variation can be interpreted in terms of scores (t,u), loadings
(p,c), PLS
weights (w) and regression coefficients (b). The fact that a regression is
carried out
against a known class separation means that the PLS-DA is a supervised method
and
that the class membership has to be known prior to the actual modelling. Once
a model
is calculated and validated it can be used for prediction of class membership
for "new"
unknown samples. Judgement of class membership is done on basis of predicted
class
membership (Ypred), predicted scores (tpred) and predicted residuals
(DmodXpred)
using statistical significance limits for the decision. See, for example,
Sjostrom et al.,
1986; Stahle et al., 1987.
In PLS, the variation between the objects in X is described by the X-scores,
T, and the
variation in the Y-block regressed against is described in the Y-scores, U. In
PLS-DA
the Y-block is a "dummy vector or matrix" describing the class membership of
each
observation. Basically, what PLS does is to maximize the covariance between T
and U.
For each component, a PLS weight vector, w, is calculated, containing the
influence of
each X-variable on the explanation of the variation in Y. Together the weight
vectors will
CA 02445101 2003-10-22
WO 02/086500 PCT/GB02/01854
-69-
form a matrix, W, containing the variation in X that maximizes the covariance
between
the scores T and U for each calculated component. For PLS-DA this means that
the
weights, W, contain the variation in X that is correlated to the class
separation described
in Y. The Y-block matrix of weights is designated C. A matrix of X-loadings,
P, is also
calculated. These loadings are apart from interpretation used to perform the
proper
decomposition of X.
The PLS decomposition of X and Y can hence be described as follows:
X=TP'+E
Y=TC'+F
The PLS regression coefficients, B, are then given by:
B = W(P~W)_~ C
The estimate of Y, Y,,at, can then be calculated according to the following
formula:
Ynat = XW(P'W)'~C' = XB
Both of the pattern recognition algorithms exemplified herein (PCA, PLS-DA)
rely on
extraction of linear associations between the input variables. When such
linear
relationships are insufficient, neural network-based pattern recognition
techniques can in
some cases improve the ability to classify individuals on the basis of the
many inter-
related input variables (see, e.g., Ala-Korpela et al., 1995; Hiltunen et al.,
1995).
Nevertheless, the methods applied herein are sufficiently powerful to allow
classification
of the individuals studied, and they provide an additional benefit over neural
network
methods in that they allow some information to be gained as to what aspects of
the input
dataset were particularly important in allowing classification to be made.
Spurious or irregular data in spectra ("outliers"), which are not
representative, are
preferably identified and removed. Common reasons for irregular data
("outliers")
include spectral artefacts such as poor phase correction, poor baseline
correction, poor
chemical shift referencing, poor water suppression, and biological effects
such as
bacterial contamination, shifts in the pH of the biofluid, toxin- or disease-
induced
biochemical response, and other conditions, e.g., pathological conditions,
which have
metabolic consequences, e.g., diabetes.
CA 02445101 2003-10-22
WO 02/086500 PCT/GB02/01854
-70-
Outliers are identified in different ways depending on the method of analysis
used. For
example, when using principal component analysis (PCA), small numbers of
samples
lying far from the rest of the replicate group can be identified by eye as
outliers. A more
objective means of identification for PCA is to use the Hotelling's T Test
which is the
multivariate version of the well known Student's T test used in univariate
statistics. For
any given sample, the T2 value can be calculated and this is compared with a
standard
value within which a chosen fraction (e.g., 95%) of the samples would normally
lie.
Samples with T2 values substantially outside this limit can then be flagged as
outliers.
Also, when using more sophisticated supervised methods, such as SIMCA or PNNs,
a
similar method is used. A confidence level (e.g., 95%) is selected and the
region of
multivariate space corresponding to confidence values above this limit is
determined.
This region can be displayed graphically in several different ways (for
example by
plotting the critical T2 ellipse on a PCA scores plot). Any samples falling
outside the high
confidence region are flagged as potential outliers.
Confidence Limits for outlier detection are also calculated in the residual
direction
expressed as the distance to model in X (DModX).
Briefly, DModX is the perpendicular distance of an object to the principal
component (or
to the plane or hyper plane made up by two or more principal components). In
the
SIMCA software, DModX is calculated as:
DModX = v * sqrt(e2/K-A)
wherein a is the residual for a single observation;
K is the number of original variables in the data set;
A is the number of principal components in the model;
v is a correction factor, based on the number of observations (N) and the
number of
principal components (A), and is slightly larger than one.
The outliers in this direction are not as severe as those occurring in the
score direction
but should always be carefully examined before making a decision whether to
include
them in the modelling or not. In general, all outliers are thoroughly
investigated, for
example, by examining the contributing loadings and distance to model (DModX)
as well
as visually inspecting the original NMR spectrum for deviating features,
before removing
CA 02445101 2003-10-22
WO 02/086500 PCT/GB02/01854
-71 -
them from the model. Outlier detection by automatic algorithm is a possibility
using the
features of scores and residual distance to model (DModX) described above.
When using PLS methods, the distance to the model in Y (DmodY) can also be
calculated in the same way.
Data Filtering
Although pattern recognition methods may be applied to "unfiltered" data, it
is often
preferable to first filter data to removed irrelevant variation.
In one method, latent variables which are of no interest may be removed by
"filtering."
Examples of filtering methods include the regression of descriptor variables
against an
index based on sample class to eliminate variables with low correlation to the
predefined
classes. Related methods include target rotation (see, e.g., Kvalheim et al.,
1989) and
PCT filtering (see, e.g., Sun, 1997). In these methods, the removed variation
is not
necessarily completely uncorrelated with sample class (i.e., orthogonal).
In another method, latent variables which are orthogonal to some variation or
class index
of interest are removed by "orthogonal filtering." Here, variation in the data
which is not
correlated to (i.e., is orthogonal to) the class separating variation of
interest may be
removed. Such methods are, in general, more efficient than non-orthogonal
filtering
methods.
Various orthogonal filtering methods have been described (see, e.g., Wold et
al., 1998a;
Fearn, 2000; Anderson, 1999; Westerhuis et al., 2001; Wise et al., 2001).
One preferred orthogonal filtering method is conventionally referred to as
Orthogonal
Signal Correction (OSC), wherein latent variables orthogonal to the variation
of interest
are removed. See, for example, Wold et al., 1998a.
The class identity is used as a response vector, Y, to describe the variation
between the
sample classes. The OSC method then locates the longest vector describing the
variation between the samples which is not correlated with the Y-vector, and
removes it
from the data matrix. The resultant dataset has been filtered to allow pattern
recognition
CA 02445101 2003-10-22
WO 02/086500 PCT/GB02/01854
-72-
focused on the variation correlated to features of interest within the sample
population,
rather than non-correlated, orthogonal variation.
OSC is a method for spectral filtering that solves the problem of unwanted
systematic
variation in the spectra by removing components, latent variables, orthogonal
to the
response calibrated against. In PLS, the weights, w, are calculated to
maximise the
covariance between X and Y. In OSC, in contrast, the weights, w, are
calculated to
minimize the covariance between X and Y, which is the same as calculating
components
as close to orthogonal to Y as possible. These components, orthogonal to Y,
containing
unwanted systematic variation are then subtracted from the spectral data, X,
to produce
a filtered predictor matrix describing the variation of interest. Briefly, OSC
can be
described as a bilinear decomposition of the spectral matrix, X, in a set of
scores, T**,
and a set of corresponding loadings, P**, containing varition orthogonal to
the response,
Y. The unexplained part or the residuals, E, is equal to the filtered X-
matrix, Xos~,
containing less unwanted variation. The decomposition is described by the
following
equation:
X=T**P**'+E
Xosc = E
The OSC procedure starts by calculation of the first latent variable or
principal
component describing the variation in the data, X. The calculation is done
according to
the NIPALS algorithm.
X=tp'+E
The first score vector, t, which is a summary of the between sample variation
in X, is
then orthogonalized against response (Y), giving the orthogonalized score
vector t*.
t* _ (I - Y (Y'Y)-' Y') t
After orthogonalization, the PLS weights, w, are calculated with the aim of
making Xw =
t*. By doing this, the weights, w, are set to minimize the covariance between
X and Y.
The weights, w, are given by:
w=x-t*
CA 02445101 2003-10-22
WO 02/086500 PCT/GB02/01854
-73-
An estimate of the orthogonal score t** is calculated from:
t**=Xw
The estimate or updated score vector t** is then again orthogonalized to Y,
and the
iteration proceeds until t** has converged. This will ensure that t** will
converge towards
the longest vector orthogonal to response Y, still giving a good description
of the
variation in X. The data, X, can then be described as the score, t**,
orthogonal to Y,
times the corresponding loading vector p**, plus the unexplained part, the
residual, E.
X = t** p**. + E
The residual, E, equals the filtered X, Xos~, after subtraction of the first
component
orthogonal to the response Y.
E = X - t** p**'
Xosc = E
If more than one component needs to be removed, the same procedure is repeated
using the residual, E, as the starting data matrix, X.
New external data not present in the model calculation must be treated
according to
filtering of the modelling data. This is done by using the calculated weights,
w, from the
filtering to calculate a score vector, tnew, for the new data, Xnew
tnew -'- Xnew W
By subtracting tnew times the loading vector from the calibration, p**, from
the new
external data, Xnew, the residual, Enew, will be the resulting OSC filtered
matrix for the
new external data.
Enew ' Xnew - tnew P**.
If PCA suggests separation between the classes under investigation, orthogonal
signal
correction (OSC) can be used to optimize the separation, thus improving the
CA 02445101 2003-10-22
WO 02/086500 PCT/GB02/01854
-74-
performance of subsequent multivariate pattern recognition analysis and
enhancing the
predictive power of the model, In the examples described herein, both PCA and
PLS-DA
analyses were improved by prior application of OSC.
An example of a typical OSC process includes the following steps:
(a)'H NMR data are segmented using AMIX, normalised, and optionally scaled
and/or mean centered. The default for orthogonal filtering of spectral data is
to use only
mean centered data, which means that the mean for each variable (spectral
bucket) is
subtracted from each single variable in the data matrix.
(b) a response vector (y) describing the class separating variation is created
by
assigning class membership to each sample.
(c) one latent variable orthogonal to the response vector (y) is removed
according
to the OSC algorithm.
(d) if desired, the removed orthogonal variation can be viewed and interpreted
in
terms of scores (T) and loadings (P).
(e) the filtered data matrix, which contains less variation not correlated to
class
separation, is next used for further multivariate modelling after optional
scaling and/or
mean centering.
Any particular model is only as good as the data used to formulate it.
Therefore, it is
preferable that all modelling data and test data are obtained under the same
(or similar)
conditions and using the same (or similar) experimental parameters. Such
conditions
and parameters include, for example, sample type (e.g., plasma, serum), sample
collection and handling protocol, sample dilution, NMR analysis (e.g., type,
field
strength/frequency, temperature), and data-processing (e.g., referencing,
baseline
correction, normalisation). If appropriate, it may be desirable to formulate
models for a
particular sub-group of cases, e.g., according to any of the parameters
mentioned above
(e.g., field strength/frequency), or others, such as sex, age, ethnicity,
medical history,
lifestyle (e.g., smoker, nonsmoker), hormonal status (e.g., pre-menopausal,
post-
menopausal).
In general, the quality of the model improves as the amount of modelling data
increases.
Nonetheless, as shown in the examples below, even relatively small sets of
modelling
data (e.g., about 50-100 subjects) is sufficient to achieve a confident
classification (e.g.,
diagnosis).
CA 02445101 2003-10-22
WO 02/086500 PCT/GB02/01854
-75-
A typical unsupervised modelling process includes the following steps:
(a) optionally scaling and/or mean centering modelling data;
(b) classifying data (e.g., as control or positive, e.g., diseased);
(c) fitting the model (e.g., using PCA, PLS-DA);
(d) identifying and removing outliers, if any;
(e) re-fitting the model;
(f) optionally repeating (c), (d), and (e) as necessary.
Optionally (and preferably), data filtering is perFormed following step (d)
and before
step (e). Optionally (and preferably), orthogonal filtering (e.g., OSC) is
performed
following step (d) and before step (e).
An example of a typical PLS-DA modelling process, using OSC filtered data,
includes the
following steps:
(a) OSC filtered data is optionally scaled and/or mean centered.
(b) a response vector (y) describing the class separating variation is created
by
assigning class membership to all samples.
(c) a PLS regression model is calculated between the OSC filtered data and the
response vector (y). The calculated latent variables or PLS components will be
focused
on describing maximum separation between the known classes.
(d) the model is interpreted by viewing scores (T), loadings (P), PLS weights
(W),
PLS coefficients (B) and residuals (E). Together they will function as a means
for
describing the separation between the classes as well as provide an
explanation to the
observed separation.
Once the model has been calculated, it may be verified using data for samples
of known
class which were not used to calculate the model. In this way, the ability of
the model to
accurately predict classes may be tested. This may be achieved, for example,
in the
method above, with the following additional step:
(e) a set of external samples, with known class belonging, which were not used
in
the (e.g., PLS) model calculation is used for validation of the model's
predictive ability.
The prediction results are investigated, fore example, in terms of predicted
response
(Ypred)~ predicted scores (TP~ed), and predicted residuals described as
predicted distance
to model (DmodXp~ea).
CA 02445101 2003-10-22
WO 02/086500 PCT/GB02/01854
-76-
The model may then be used to classify test data, of unknown class. Before
classification, the test data are numerically pre-processed in the same manner
as the
modelling data.
Interpreting the output from the pattern recognition (PR) analysis provides
useful
information on the biomarkers responsible for the separation of the biological
classes.
Of course, the PR output differs somewhat depending on the data analysis
method used.
As mentioned above, methods for PR and interpretation of the results are known
in the
art. Interpretation methods for two PR techniques (PCA and PLS-DA) are
discussed
briefly herein.
Interpreting PCA Results
The data matrix (X) is built up by N observations (samples, rats, patients,
etc.) and K
variables (spectral buckets carrying the biomarker information in terms of'H-
NMR
resonances).
In PCA, the N*K matrix (X) is decomposed into a few latent variables or
principal
components (PCs) describing the systematic variation in the data. Since PCA is
a
bilinear decomposition method, each PC can be divided into two vectors, scores
(t) and
loadings (p). The scores can be described as the projection of each
observation on to
each PC and the loadings as the contribution of each variable (spectral
bucket) to the PC
expressed in terms of direction.
Any clustering of observations (samples) along a direction found in scores
plots (e.g.,
PC1 versus PC2) can be explained by identifying which variables (spectral
buckets)
have high loadings for this particular direction in the scores. A high loading
is defined as
a variable (spectral bucket) that changes between the observations in a
systematic way
showing a trend which matches the sample positions in the scores plot. Each
spectral
bucket with a high loading, or a combination thereof, is defined by its'H NMR
chemical
shift position; this is its diagnostic spectral window. These chemical shift
values then
allow the skilled NMR spectroscopist to examine the original NMR spectra and
identify
the molecules giving rise to the peaks in the relevant buckets; these are the
biomarkers.
This is typically done using a combination of standard 1- and 2-dimensional
NMR
methods.
CA 02445101 2003-10-22
WO 02/086500 PCT/GB02/01854
-77-
If, in a scores plot, separation of two classes of sample can be seen in a
particular
direction, then examination of those loadings which are in the same direction
as in the
scores plots indicates which loadings are important for the class
identification. The
(oadings plot shows points which are labelled according to the bucket chemical
shift.
This is the'H NMR spectroscopic chemical shift which corresponds to the centre
of the
bucket. This bucket defines a diagnostic spectral window. Given a list of
these bucket
identifiers, the skilled NMR spectroscopist then re-examines the'H NMR spectra
and
identifies, within the bucket width, which of several possible NMR resonances
are
changed between the two classes. The important resonance is characterised in
terms of
exact chemical shift, intensity, and peak multiplicity. Using other NMR
experiments,
such as 2-D NMR spectroscopy and/or separation of the specific molecule using
HPLC-NMR-MS for example, other resonances from the same molecule are
identified
and ultimately, on the basis of ail of the NMR data and other data if
appropriate, an
identification of the molecule (biomarker) is made.
In a classification situation as described herein, one procedure for finding
relevant
biomarkers using PCA is as follows:
(a) PCA of the data matrix (X) containing N observations belonging to either
of two
known classes (healthy or diseased). The description of the observations lies
in the K
variables (spectral buckets) containing the biomarker information in terms
of'H NMR
resonances,
(b) Interpretation of the scores (t) to find the direction for the separation
between the two
known classes in X.
(c) Interpretation of loadings (p) reveals which variables (spectral buckets)
have the
largest impact on the direction for separation described in the scores (t).
This identifies
the relevant diagnostic spectral windows.
(d) Assignment of the spectra( buckets or combinations (hereof to certain
biomarkers.
This is done, for example, by interpretation of the resonances in'H NMR
spectra and by
using previously assigned spectra of the same type as a library for
assignments.
CA 02445101 2003-10-22
WO 02/086500 PCT/GB02/01854
-78-
Interpreting PLS-DA Results
In PLS-DA, which is a regression extension of the PCA method, the options for
interpretation are more extensive compared to the PCA case. PLS-DA performs a
regression between the data matrix (X) and a "dummy matrix" (Y) containing the
class
membership information (e.g., samples may be assigned the value 1 for healthy
and 2
for diseased classes). The calculated PLS components will describe the maximum
covariance between X and Y which in this case is the same as maximum
separation
between the known classes in X. The interpretation of scores (t) and loadings
(p) is the
same in PLS-DA as in PCA. Interpretation of the PLS weights (w) for each
component
provides an explanation of the variables in X correlated to the variation in
Y. This will
give biomarker information for the separation between the classes.
Since PLS-DA is a regression method, the features of regression coefficients
(b) can
95 also be used for discovery and interpretation of biomarkers. The regression
coefficients
(b) in PLS-DA provide a summary of which variables in X (spectral buckets)
that are
most important in terms of both describing variation in X and correlating to
Y. This means
that variables (spectral buckets) with high regression coefficients are
important for
separating the known classes in X since the Y matrix against which it is
correlated only
contains information on the class identity of each sample.
Again, as discussed above, the scores plot is examined to identify important
loadings,
diagnostic spectral windows, relevant NMR resonances, and ultimately the
associated
biomarkers.
In a classification situation as described herein, one procedure for finding
relevant
biomarkers using PLS-DA is as follows:
(a) A PLS model between the N*K data matrix (X) against a "dummy matrix" Y,
containing information on class membership for the observations in X, is
calculated
yielding a few latent variables (PLS components) describing maximum separation
between the two classes in X (e.g., healthy and diseased).
(b) Interpretation of the scores (t) to find the direction for the separation
between the two
known classes in X.
CA 02445101 2003-10-22
WO 02/086500 PCT/GB02/01854
-79-
(c) Interpretation of loadings (p) revealing which variables (spectral
buckets) have the
largest impact on the direction for separation described in the scores (t);
these are
diagnostic spectral windows.
In PLS-DA, a variable importance plot (VIP) is another method of evaluating
the
significance of loadings in causing a separation of class of sample in a
scores plot.
Typically, the VIP is a squared function of PLS weights, and therefore only
positive
numerical values are encountered; in addition, for a given model, there is
only one set of
ViP-values. Variables with a VIP value of greater than 1 are considered most
influential
for the model. The VIP shows each loading in a decreasing order of importance
for class
separation based on the PLS regression against class variable.
A (w*c) plot is another diagnostic plot obtained from a PLS-DA analysis. It
shows which
descriptors are mainly responsible for class separation. The (w*c) parameters
are an
attempt to describe the total variable correlations in the model, i.e.,
between the
descriptors (e.g., NMR intensities in buckets), between the NMR descriptors
and the
class variables, and between class variables if they exist (in the present two
class case,
where samples are assigned by definition to class 1 and class 2 there is no
correlation).
Thus for a situation in a scores plot (e.g., t1 vs. t2), if class 1 samples
are clustered in
the upper right hand quadrant and class 2 samples are clustered in the lower
left hand
quadrant, then the (w*c) plot will show descriptors also in these quadrants.
Descriptors in
the upper right hand quadrant are increased in class 1 compared to class 2 and
vice
versa for the lower left hand quadrant.
(d) Interpretation of PLS weights (w) reveals which variables (spectral
buckets) in X are
important for correlation to Y (class separation); these, too, are diagnostic
spectral
windows.
(e) Interpretation of the PLS regression coefficients (b) reveals an overall
summary of
which variables (spectral buckets) have the largest impact on the direction
for separation
described in the scores; these, too, are diagnostic spectral windows.
fn a typical regression coefficient plot for'H NMR, each bar represents a
spectral region
(e.g., 0.04 ppm) and shows how the'H NMR profile of one class of samples
differs from
the'H NMR profile of a second class of samples. A positive value on the x-axis
indicates there is a relatively greater concentration of metabolite (assigned
using NMR
CA 02445101 2003-10-22
WO 02/086500 PCT/GB02/01854
-80-
chemical shift assignment tables) in one class as compared to the other class,
and a
negative value on the x-axis indicates a relatively lower concentration in one
class as
compared to the other class.
(f) Assignment of the spectral buckets or combinations thereof to certain
biomarkers.
This is done, for example, by interpretation of the resonances in'H NMR
spectra and by
using previously assigned spectra of the same type as a library for
assignments.
Timed Sampling
The analysis methods described herein can be applied to a single sample, or
alternatively, to a timed series of samples. These samples may be taken
relatively close
together in time (e.g., daily) or less frequently (e.g., monthly or yearly).
The timed series of samples may be used for one or more purposes, e.g., to
make
sequential diagnoses, applying the same classification method as if each
sample were a
single sample. This will allow greater confidence in the diagnosis compared to
obtaining
a single sample for the patient, or alternatively to monitor temporal changes
in the
subject (e.g., changes in the underlying condition being diagnosed, treated,
etc.).
Alternatively, the timed series of samples can be collectively treated as a
single dataset
increasing the information density of the input dataset and hence increasing
the power of
the analysis method to identify weaker patterns.
As yet another alternative, the timed series of samples can be collectively
processed to
yield a single dataset in which the temporal changes (e.g., in each bin) is
included as an
extra list of variables (e.g., as in composite data sets). Temporal changes in
the amount
of (e.g., endogenous) diagnostic species may greatly improve the ability of
the analysis
method to accurate classify patterns (especially when patterns are weak).
Batch Modelling
The methods described herein, including their applications (e.g., diagnosis,
prognosis),
may be further improved by employing batch modelling.
CA 02445101 2003-10-22
WO 02/086500 PCT/GB02/01854
-81 -
Statistical batch processing can be divided into two levels of multivariate
modelling. The
lower or the observation level is usually based on Partial Least Squares (PLS)
regression against time (or any other index describing process maturity),
whereas the
upper or batch level consists of a PCA based on the scores from the lower
level PLS
model. PLS can also be used in the upper level to correlate the matrix based
on the
lower level scores with the end properties of the separate batches. This is
common in
industrial applications where properties of the end product are used as a
description of
quality.
At the lower level of the Batch modelling the evolution of the studied process
with time
(maturity) can be monitored and interpreted in terms of PLS scores and
loadings. Since
the PLS performs a regression against sampling time (maturity), the calculated
components will be focused on the evolution with time. The fact that the
calculated PLS
components are orthogonal to each other means that it is possible to detect
independent
time (maturity) profiles and also to interpret which measured variables are
causing these
profiles. Confidence limits are used for detection of deviating behaviour of
any spectra at
any time point for some optional significance level, usually 95% and/or 99%.
The residuals expressed as distance to model (DModX) is, at the lower level,
another
important tool for detecting outlying batches or deviating behaviour for a
specific batch at
a specific time point. The upper level or batch level provides the possibility
to just look at
the difference between the separate batches. This is done by using the lower
level
scores including all time points for each batch as new variables describing
each single
batch and then performing a PCA on this new data matrix. The features of
scores,
loadings and DmodX are used in the same way as for ordinary PCA analysis, with
the
exception that the upper level loadings can be traced back down to the lower
level for a
more detailed explanation in the original loadings.
Predictions for "new" batches can be done on both levels of the batch model.
On the
lower level monitoring of evolution with time using scores and DmodX is a
powerful tool
for detecting deviating behaviour from normality for batch at any time point.
On the
upper level prediction of single batch behaviour can be done in terms of
scores and
DmodX.
The definition of a batch process, and also a requirement for batch modelling,
is a
process where all batches have equal duration and are synchronised according
to
CA 02445101 2003-10-22
WO 02/086500 PCT/GB02/01854
-82-
sample collection. For example, samples taken from a cohort of animals at
identical
fixed time points to monitor the effects of an administered xenobiotic
substance.
The advantage of using batch modelling for such studies is the possibility of
detecting
known, or discovering new, metabolic processes which evolve with time in the
lower
level scores, and also the identification of the actual metabolites involved
in the different
processes from the contributing tower level loadings. The lower level analysis
also
makes it possible to differentiate between single observations (e.g.,
individual animals at
specific time points).
Applications for the lower level modelling include, for example,
distinguishing between
undosed controls and dosed animals in terms of metabolic effects of dosing in
certain
time points; and creating models for normality and using the models as a
classification
tool for new samples, e.g., as normal or abnormal. This may be achieved using
a PLS
95 prediction of the new sample's class using the model describing normality.
Decisions
can then be made on basis of the combination of the predicted scores and
residuals
(DmodX).
An automated expert system can be used for early fault detection in the lower
level batch
modelling, and this can be used to further enhance the analysis procedure and
improve
efficiency.
The upper level provides the possibility of making predictions of new animals
using the
existing model. Abnormal animals can then be detected by judging predicted
scores and
residuals (DmodX) together. Since the upper level model is based on the lower
level
scores, the interpretation of an animal predicted to be abnormal can be traced
back to
the original lower level scores and loadings as well as the original raw
variables making
up the NMR spectra. Combining the upper and lower level for prediction of the
status of
a new animal, the classification can be based on four parameters: upper level
scores
and residuals (DmodX) and lover level scores and residuals (DModX). This
demonstrates that batch modelling is an efficient fiool for determining if an
animal is
normal or abnormal, and if the fatter, why and when they are deviating from
normality.
See, for example, Wold et al, 1998b and Eriksson et al., 1999.
CA 02445101 2003-10-22
WO 02/086500 PCT/GB02/01854
-83-
Integrated Metabonomics
As discussed above, many of the methods of the present invention may also be
applied
to composite data or composite data sets. The term "composite data set," as
used
herein, pertains to a spectrum (or data vector) which comprises spectral data
(e.g., NMR
spectral data, e.g., an NMR spectrum) as well as at feast one other datum or
data vector.
Examples of other data vectors include, e.g., one or more other NMR spectral
data, e.g.,
NMR spectra, e.g., obtained for the same sample using a different NMR
technique; other
types of spectra, e.g., mass spectra, numerical representations of images,
etc.; obtained
for the another sample, of the same sample type (e.g., blood, urine, tissue,
tissue
extract), but obtained from the subject at a different timepoint; obtained for
another
sample of different sample type (e.g., blood, urine, tissue, tissue extract)
for the same
subject; and the like.
Examples of other data including, e.g., one or more clinical parameters.
Clinical
parameters which are suitable for use in composite methods include, but are
not limited
to, the following:
(a) established clinical parameters routinely measured in hospital clincal
labs: age; sex;
body mass index; height; weight; family history; medication history; cigarette
smoking;
alcohol intake; blood pressure; full blood cell count (FBCs); red blood cells;
white blood
cells; monocytes; lymphocytes; neutrophils; eosinophils; basophils; platelets;
haematocrit; haemoglobin; mean corpuscular volume and related haemodilution
indicators; fibrinogen; functional clotting parameters (thromoboplastin and
partial
thromboplastin); electrolytes (sodium, potassium, calcium, phosphate); urea;
creatinine;
total protein; albumin; globulin; bilirubin; protein markers of liver function
(alanine
aminotransferase, alkaline phosphatase, gamma glutamyl transferase); glucose;
Hba1c
(a measure of glucose-Haemoglobin conjugates used to monitor diabetes);
lipoprotein
profile; total cholesterol; LDL; HDL; triglycerides; blood group.
(b) established research parameters routinely measured in research
laboratories but not
usually measured in hospitals: hormonal status; testosterone; estrogen;
progesterone;
follicle stimulating hormone; inhibin; transforming growth factor-beta1;
Transforming
growth factor-beta2; chemokines; MCP-1; eotaxin; plasminogen activator
inhibitor-1;
cystatin C.
CA 02445101 2003-10-22
WO 02/086500 PCT/GB02/01854
-84-
(c) early-stage research parameters measured in one or a small number of
specialist
labs: antibodies to sRll; antibodies to blood group A antigen; antibodies to
blood group B
antigen; immunoglobulin (IgD) against alpha-gal; immunoglobulin (IgD) against
penta-
gai.
Diagnostic Spectral Windows
As discussed above, many of the methods of the present invention involve
relating NMR
spectral intensity at one or more predetermined diagnostic spectral windows
with a
predetermined condition.
Examples of methods for identifying one or more suitable diagnostic spectral
windows for
a given condition, using, for example, pattern recognition methods, are
described herein.
The term "diagnostic spectral window," as used herein, pertains to narrow
range of
chemical shift (0b) values encompassing an index value, S~ (that is, 5~ falls
within the
range ~S). Each index value, and its associated spectral window, define a
range of
chemical shift (~s) in which the NMR spectral intensity is indicative of the
presence of
one or more chemical species.
For 2D NMR methods, the diagnostic spectral window refers to a chemical shift
patch
(ABA, Ab2) which encompasses an index value, [8~~, b~j. For 3D NMR methods,
the
diagnostic spectral window refers to a chemical shift volume (~b~, X52, ~b3)
which
encompasses an index value, (b~~, b,~, b~].
In one embodiment, the spectral window is centred with respect to its index
value (e.g.,
b~ = 1.30; ~~ = b 0.04, and A~ 1.28-1.32).
The breadth of the range, W~, is determined largely by the spectroscopic
parameters,
such as field strength/frequency, temperature, sample viscosity, etc. The
breadth of the
range is often chosen to encompass a typical spin-coupled multiplet pattern.
For peaks
whose position varies with sample pH, the breadth of the range is may be
widened to
encompass the expected range of positions.
Typically, the breadth of the range, ~~, is from about S 0.001 to about b 0.2.
In one embodiment, the breadth is from about b 0.005 to about S 0.1.
CA 02445101 2003-10-22
WO 02/086500 PCT/GB02/01854
-85-
In one embodiment, the breadth is from about S 0.005 to about b 0.08.
In one embodiment, the breadth is from about S 0.01 to about S 0.08.
In one embodiment, the breadth is from about b 0.02 to about i5 0.08.
In one embodiment, the breadth is from about b 0.005 to about b 0.06.
In one embodiment, the breadth is from about 5 0.01 to about b 0.06.
In one embodiment, the breadth is from about b 0.02 to about s 0.06.
In one embodiment, the breadth is about b 0.04.
In one embodiment, the breadth is equal to the "bucket" or "bin" width. In one
embodiment, the breadth is equal to an integer multiple of the "bucket" or
"bin" width.
Although the diagnostic spectral windows are determined in relation to the
condition
under study, the precise index values for such windows may vary in accordance
with the
experimental parameters employed, for example, the digital resolution in the
original
spectra, the width of the buckets used, the temperature of the spectral data
acquisition,
etc. The exact composition of the sample (e.g., biofluid, tissue, etc.) can
affect peak
positrons by compartmentation, metal complexation, protein-small molecule
binding, etc.
The observation frequency will have an effect because of different degrees of
peak
overlap and of first/second order nature of spectra.
In one embodiment, said one or more predetermined diagnostic spectral windows
is: a
single predetermined diagnostic spectral window.
In one embodiment, said one or more predetermined diagnostic spectral windows
is: a
plurality of predetermined diagnostic spectral windows. In practice, this may
be
preferred.
Although the theoretical limit on the number of predetermined diagnostic
spectral
windows is a function of the data density (e.g., the number of variables,
e.g., buckets),
typically the number of predetermined diagnostic spectral windows is from 1 to
about 30.
It is possible for the actual number to be in any sub-range within these
general limits.
Examples of lower limits include 1, 2, 3, 4, 5, 6, 8, 10, and 15. Examples of
upper limits
include 3, 4, 5, 6, 8, 10, 15, 20, 25, and 30.
In one embodiment, the number is from 1 to about 20.
In one embodiment, the number is from 1 to about 15.
CA 02445101 2003-10-22
WO 02/086500 PCT/GB02/01854
-86-
In one embodiment, the number is from 1 to about 10.
In one embodiment, the number is from 1 to about 8.
In one embodiment, the number is from 1 to about 6.
In one embodiment, the number is from 1 to about 5.
In one embodiment, the number is from 1 to about 4.
In one embodiment, the number is from 1 to about 3.
In one embodiment, the number is 1 or 2.
In one embodiment, said one or more predetermined diagnostic spectral windows
is: a
plurality of diagnostic spectral windows; and, said NMR spectral intensity at
one or more
predetermined diagnostic spectral windows is: a combination of a plurality of
NMR
spectral intensities, each of which is NMR spectral intensity for one of said
plurality of
predetermined diagnostic spectral windows.
In one embodiment, said combination is a linear combination.
In one embodiment, at least one of said one or more predetermined diagnostic
spectral
windows encompasses a chemical shift value for an NMR resonance of a
diagnostic
species (e.g., a'H NMR resonance of a diagnostic species).
In one embodiment, each of a plurality of said one or more predetermined
diagnostic
spectral windows encompasses a chemical shift value for an NMR resonance of a
diagnostic species (e.g., a'H NMR resonance of a diagnostic species).
In one embodiment, each of said one or more predetermined diagnostic spectral
windows encompasses a chemical shift value for an NMR resonance of a
diagnostic
species (e.g., a'H NMR resonance of a diagnostic species).
Diagnostic Spectral Windows - AtherosclerosislCHD
It is believed that the index values, and the associated diagnostic spectral
windows,
primarily reflect the species described in Table 4-CHD.
In one embodiment, said predetermined diagnostic spectral windows are defined
by one
or more index values, 5~, corresponding to the bucket regions listed in Table
4-CHD.
CA 02445101 2003-10-22
WO 02/086500 PCT/GB02/01854
-87-
In one embodiment, said predetermined diagnostic spectral windows are defined
by one
or more index values, S~, corresponding to the bucket regions listed in Table
4-CHD, and
breadth of the range value, ~~ about 0.04.
In one embodiment, said predetermined diagnostic spectral windows are defined
by one
or more index values, ~~, corresponding to the bucket regions listed in Table
4-CHD, and
which are determined using the conditions set forth in the section entitled
"NMR Experimental Parameters."
Diagnostic Species and Biomarkers
The index values, and the associated diagnostic spectral windows, define
ranges of
chemical shift in which NMR spectral intensity is indicative of the presence
of one or
more chemical species, one or more of which are diagnostic species (e.g.,
biomarkers),
for example, for a condition (e.g., indication) under study.
In one embodiment, said one or more diagnostic species are endogenous
diagnostic
species.
In one embodiment, said one or more diagnostic species are associated with NMR
spectral intensity at predetermined diagnostic spectral windows.
In one embodiment, said one or more diagnostic species are a plurality of
diagnostic
species (i.e., a combination of diagnostic species).
In one embodiment, said one or more diagnostic species is a single diagnostic
species.
The term "endogenous species," as used herein, pertains to chemical species
which
originated from the subject under study, for example, which were present in
the sample
of the subject.
Once an index value, and its associated diagnostic spectral window, is
identified (e.g., by
the application of modelling methods as described herein), it is often
possible to identify
one or more putative biomarkers which give rise to NMR spectral intensity in
that
particular window.
CA 02445101 2003-10-22
WO 02/086500 PCT/GB02/01854
_ 88 -
The (e.g., integrated) NMR spectral intensity in a particular spectral window
(e.g., bucket) is the sum of the spectral intensity for all of the NMR peaks
in that window.
Usually for small molecules which give sharp NMR peaks, it is possible to
examine the
raw NMR data and determine which of the peaks is responsible for that
particular
spectral window being selected as significant by the applied pattern
recognition method.
The relevant peaks) are then assigned.
Such assignments may be made, for example, by reference to published data; by
comparison with spectra of authentic materials; by standard addition of an
authentic
reference standard to the sample; by separating the individual component,
e.g., by using
HPLC-NMR and identifying it using NMR and mass spectrometry. Additional
confirmation of assignments is usually sought from the application of other
NMR
methods, including, for example, 2-dimensional (2D) NMR methods.
In another approach, concentrations of candidate chemical species are measured
by
another specific method (e.g., ELISA, chromatography, RIA, etc.) and compared
with the
spectral intensity observed in the relevant diagnostic spectral window, and
any
correlation noted. This will reveal how much of the variance in the diagnostic
spectral
window is contributed by the candidate chemical species. This may also reveal
that
suspected diagnostic species are, in fact, not highly correlated with the
condition under
examination.
Methods of Identifying Diagnostic Species
Thus, the methods described herein also facilitate the identification of
species (often
referred to as biomarkers or diagnostic species) which are indicative (e.g.,
diagnostic) of
a particular condition. For example, particular metabolites (e.g., in blood,
urine, etc.)
may be diagnostic of a particular condition.
One aspect of the present invention pertains to a method of identifying such
diagnostic
species (e.g., biomarkers), as described herein.
One aspect of the present invention pertains to a method of identifying a
diagnostic
species, or a combination of a plurality of diagnostic species, for a
predetermined
condition, said method comprising the steps of:
(a) applying a multivariate statistical analysis method to experimental data;
CA 02445101 2003-10-22
WO 02/086500 PCT/GB02/01854
_89_
wherein said experimental data comprises at least one data comprising
experimental parameters measured for each of a plurality of experimental
samples;
wherein said experimental samples define a class group consisting of a
plurality
of classes;
wherein at least one of said plurality of classes is a class associated with
said
predetermined condition, e.g., a class associated with the presence of said
predetermined condition;
wherein at least one of said plurality of classes is a class not associated
with said
predetermined condition, e.g., a class associated with the absence of said
predetermined condition;
wherein each of said experimental samples is of known class selected from said
class group;
and:
(b) identifying one or more critical experimental parameters;
wherein each of said critical experimental parameters is statistically
significantly
different for classes of said class group, e.g., is statistically significant
for discriminating
between classes of said class group; and,
(c) matching each of one or more of said one or more critical experimental
parameters with said diagnostic species;
or:
(b) identifying a combination of a plurality of critical experimental
parameters;
wherein said combination of a plurality of critical experimental parameters is
statistically significantly different for classes of said class group, e.g.,
is statistically
significant for discriminating between classes of said class group; and,
(c) matching each of one or more of said plurality of critical experimental
parameters with said combination of a plurality of diagnostic species.
In one embodiment, one or more of said critical experimental parameters is a
spectral
parameter (i.e., a critical experimental spectral parameter); and said
identifying and
matching steps are:
(b) identifying one or more critical experimental spectral parameters; and,
CA 02445101 2003-10-22
WO 02/086500 PCT/GB02/01854
-90-
(c) matching each of one or more of said one or more critical experimental
spectral parameters with a spectral feature, e.g., a spectral peak; and
matching one or more of said spectral peaks with said diagnostic species;
or:
(b) identifying a combination of a plurality of critical experimental spectral
parameters; and,
(c) matching each of a plurality of said plurality of critical experimental
spectral
parameters with a spectral feature, e.g., a spectral peak; and
matching one or more of said spectral peaks with said combination of a
plurality
of diagnostic species.
In one embodiment, said multivariate statistical analysis method is a
multivariate
statistical analysis method which employs a pattern recognition method.
In one embodiment, said multivariate statistical analysis method is, or
employs PCA.
In one embodiment, said multivariate statistical analysis method is, or
employs PLS.
In one embodiment, said multivariate statistical analysis method is, or
employs PLS-DA.
In one embodiment, said multivariate statistical analysis method includes a
step of data
filtering.
In one embodiment, said multivariate statistical analysis method includes a
step of
orthogonal data filtering.
In one embodiment, said multivariate statistical analysis method includes a
step of OSC.
In one embodiment, said experimental parameters comprise spectral data.
In one embodiment, said experimental parameters comprise both spectral data
and
non-spectral data (and is referred to as a "composite experimental data").
In one embodiment, said experimental parameters comprise NMR spectral data.
CA 02445101 2003-10-22
WO 02/086500 PCT/GB02/01854
-91 -
In one embodiment, said experimental parameters comprise both NMR spectral
data and
non-NMR spectral data.
In one embodiment, said NMR spectral data comprises'H NMR spectral data
andlor'3C
NMR spectral data.
In one embodiment, said NMR spectral data comprises'H NMR spectral data.
90 in one embodiment, said non-spectral data is non-spectral clinical data.
In one embodiment, said non-NMR spectral data is non-spectral clinical data.
In one embodiment, said critical experimental parameters are spectral
parameters.
In one embodiment, said class group comprises classes associated with said
predetermined condition (e.g., presence, absence, degree, etc.).
In one embodiment, said class group comprises exactly two classes.
In one embodiment, said class group comprises exactly two classes: presence of
said
predetermined condition; and absence of said predetermined condition.
In one embodiment, said class associated with said predetermined condition is
a class
associated with the presence of said predetermined condition.
In one embodiment, said class not associated with said predetermined condition
is a
class associated with the absence of said predetermined condition.
In one embodiment, said method further comprises the additional step of:
(d) confirming the identity of said diagnostic species.
One aspect of the present invention pertain to novel diagnostic species (e.g.,
biomarker)
which are identified by such a method.
CA 02445101 2003-10-22
WO 02/086500 PCT/GB02/01854
_92_
One aspect of the present invention pertains to one or more diagnostic species
(e.g., biomarkers) which are identified by such a method for use in a method
of
classification (e.g., diagnosis).
One aspect of the present invention pertains to a method of classification
(e.g., diagnosis) which employs or relies upon one or more diagnostic species
(e.g., biomarkers) which are identified by such a method.
One aspect of the present invention pertains to use of one or more diagnostic
species
(e.g., biomarkers) which are identified by such a method in a method of
classification
(e.g., diagnosis).
One aspect of the present invention pertains to an assay for use in a method
of
classification (e.g., diagnosis), which assay relies upon one or more
diagnostic species
(e.g., biomarkers) which are identified by such a method.
One aspect of the present invention pertains to use of an assay in a method of
classification (e.g., diagnosis), which assay relies upon one or more
diagnostic species
(e.g., biomarkers) which are identified by such a method.
Diagnostic Species - Atherosclerosis/CHD
In one embodiment, at least one of said one or more predetermined diagnostic
species is
a species described in Table 4-CHD.
In one embodiment, each of a plurality of said one or more predetermined
diagnostic
species is a species described in Table 4-CHD.
In one embodiment, each of said one or more predetermined diagnostic species
is a
species described in Table 4-CHD.
Amount or Relative Amount
As discussed above, many of the methods of the present invention involve
classification
on the basis of an amount, or a relative amount, of one or more diagnostic
species.
CA 02445101 2003-10-22
WO 02/086500 PCT/GB02/01854
-93-
In one embodiment, said classification is performed on the basis of an amount,
or a
relative amount, of a single diagnostic species.
In one embodiment, said classification is performed on the basis of an amount,
or a
relative amount, of a plurality of diagnostic species.
In one embodiment, said classification is performed on the basis of an amount,
or a
relative amount, of each of a plurality of diagnostic species.
In one embodiment, said classification is performed on the basis of a total
amount, or a
relative total amount, of a plurality of diagnostic species.
In one embodiment (wherein said one or more diagnostic species is: a plurality
of
diagnostic species), said amount of, or relative amount of one or more
diagnostic
species is: a combination of a plurality of amounts, or relative amounts, each
of which is
the amount of, or relative amount of one of said plurality of diagnostic
species.
!n one embodiment, said combination is a linear combination.
The term "amount," as used in this context, pertains to the amount regardless
of the
terms of expression.
The term "amount," as used herein in the context of " amount of, or relative
amount of
(e.g., diagnostic) species," pertains to the amount regardless of the terms of
expression.
Absolute amounts may be expressed, for example, in terms of mass (e.g., pg),
moles
(e.g., pmol), volume (i.e., pL), concentration (molarity, pg/mL, pg/g, wt%,
vol%, etc.), etc.
Relative amounts may be expressed, for example, as ratios of absolute amounts
(e.g.,
as a fraction, as a multiple, as a %) with respect to another chemical
species. For
example, the amount may expressed as a relative amount, relative to an
internal
standard, for example, another chemical species which is endogenous or added.
The amount may be indicated indirectly, in terms of another quantity (possibly
a
precursor quantity) which is indicative of the amount. For example, the other
quantity
may be a spectrometric or spectroscopic quantity (e.g., signal, intensity,
absorbance,
CA 02445101 2003-10-22
WO 02/086500 PCT/GB02/01854
-94-
transmittance, extinction coefficient, conductivity, etc.; optionally
processed, e.g.,
integrated) which itself indicative of the amount.
The amount may be indicated, directly or indirectly, in regard to a different
chemical
species (e.g., a metabolic precursor, a metabolic product, etc.), which is
indicative the
amount.
Diagnostic Shift
As discussed above, many of the methods of the present invention involve
classification
on the basis of a modulation, e.g., of NMR spectral intensity at one or more
predetermined diagnostic spectral windows; of the amount, or a relative
amount, of
diagnostic species; etc. In this context, "modulation" perfiains to a change,
and may be,
for example, an increase or a decrease. In one embodiment, said "a modulation
of is
"an increase or decrease in."
In one embodiment, the modulation (e.g., increase, decrease) is at least 10%,
as
compared to a suitable control. In one embodiment, the modulation (e.g.,
increase,
decrease) is at least 20%, as compared to a suitable control. In one
embodiment, the
modulation is a decrease of at least 50% (i.e., a factor of 0.5). In one
embodiment, the
modulation is a increase of at least 100% (i.e., a factor of 2).
Each of a plurality of predetermined diagnostic spectral windows, and each of
a plurality
of diagnostic species, may have independent modulations, which may be the same
or
different. For example, if there are two predetermined diagnostic spectral
windows,
NMR spectral intensity may increase in one window and decrease in the other
window.
In this way, combinations of modulations of NMR spectral intensity in
different diagnostic
spectra! windows may be diagnostic. Similarly, it there are two diagnostic
species, the
amount of one may increase, and the amount of the other may decrease. Again,
combinations of modulations of amounts, or relative amounts of, different
diagnostic
species may be diagnostic. See, for example, the data in the Examples below,
which
illustrate cases where different species have different modulations.
The term "diagnostic shift," as used herein, pertains a modulation (e.g.,
increase,
decrease), as compared to a suitable control.
CA 02445101 2003-10-22
WO 02/086500 PCT/GB02/01854
-95-
A diagnostic shift may be in regard to, for example, NMR spectral intensity at
one or
more predetermined diagnostic spectral windows; or the amount of, or relative
amount
of, diagnostic species.
Control Samples, Control Su Jects, Control Data
Suitable controls are usually selected on the basis of the organism (e.g.,
subject, patient)
under study (test subject, study subject, etc.), and the nature of the study
(e.g., type of
sample, type of spectra, etc.). Usually, controls are selected to represent
the state of
"normality." As described herein, deviations from normality (e.g., higher than
normal,
lower than normal) in test data, test samples, test subjects, etc. are used in
classification,
diagnosis, etc.
For example, in most cases, control subjects are the same species as the test
subject
and are chosen to be representative of the equivalent normal (e.g., healthy)
organism. A
control population is a population of control subjects. If appropriate,
control subjects may
have characteristics in common (e.g., sex, ethnicity, age group, etc.) with
the test
subject. If appropriate, control subjects may have characteristics (e.g., age
group, etc.)
which differ from those of the test subject. For example, it may be desirable
to choose
healthy 20-year olds of the same sex and ethnicity as the study subject as
control
subjects.
In most cases, control samples are taken from control subjects. Usually,
control samples
are of the same sample type (e.g., serum), and are collected and handled
(e.g., treated,
processed, stored) under the same or similar conditions, as the sample under
study
(e.g., test sample, study sample).
In most cases, control data (e.g., control values) are obtained from control
samples
which are taken from control subjects. Usually, control data (e.g., control
data sets,
control spectral data, control spectra, etc.) are of the same type (e.g., 1-
D'H NMR, etc.),
and are collected and handled (e.g., recorded, processed) under the same or
similar
conditions (e.g., parameters), as the test data.
CA 02445101 2003-10-22
WO 02/086500 PCT/GB02/01854
-96-
Implementation
The methods of the present invention, or parts thereof, may be conveniently
performed
electronically, for example, using a suitably programmed computer system.
One aspect of the present invention pertains to a computer system or device,
such as a
computer or linked computers, operatively configured to implement a method of
the
present invention, as described herein.
One aspect of the present invention pertains to computer code suitable for
implementing
a method of the present invention, as described herein, on a suitable computer
system.
One aspect of the present invention pertains to a computer program comprising
computer program means adapted to perform a method according to the present
invention, as described herein, when said program is run on a computer.
One aspect of the present invention pertains to a computer program, as
described
above, embodied on a computer readable medium.
One aspect of the present invention pertains to a data carrier which carries
computer
code suitable for implementing a method of the present invention, as described
herein,
on a suitable computer.
In one embodiment, the above-mentioned computer code or computer program
includes,
or is accompanied by, computer code and/or computer readable data representing
a
predictive mathematical model, as described herein.
In one embodiment, the above-mentioned computer code or computer program
includes,
or is accompanied by, computer code and/or computer readable data representing
data
from which a predictive mathematical model, as described herein, may be
calculated.
One aspect of the present invention pertains to computer code and/or computer
readable
data representing a predictive mathematical model, as described herein.
CA 02445101 2003-10-22
WO 02/086500 PCT/GB02/01854
-97-
One aspect of the present invention pertains to a data carrier which carries
computer
code and/or computer readable data representing a predictive mathematical
model, as
described herein.
One aspect of the present invention pertains to a computer system or device,
such as a
computer or linked computers, programmed or loaded with computer code andlor
computer readable data representing a predictive mathematical model, as
described
herein.
Computers may be linked, for example, internally (e.g., on the same circuit
board, on
different circuit boards which are part of the same unit), by cabling (e.g.,
networking,
ethernet, Internet), using wireless technology (e.g., radio, microwave,
satellite link, cell-
phone), etc., or by a combination thereof.
Examples of data carriers and computer readable media include chip media
(e.g., ROM,
RAM, flash memory (e.g., Memory StickT"", Compact FIashT"", SmartmediaT""),
magnetic
disk media (e.g., floppy disks, hard drives), optical disk media (e.g.,
compact disks
(CDs), digital versatile disks (DVDs), magneto-optical (MO) disks), and
magnetic tape
media.
Although the'H-NMR spectra analysed here were generated using a conventional
(and
hence large and expensive) 600 MHz NMR spectrometer, on-going technological
advances suggest that spectrometers of similar resolving power may soon be
available
as desktop units (provided the sample to be analyzed is small, as is the case
with
plasma or serum samples). Such units, together with a personal computer to
perform
automated pattern recognition, may soon be available not only in large
hospitals but also
in the primary healthcare milieu.
One aspect of the present invention pertains to a system (e.g., an "integrated
analyser",
"diagnostic apparatus") which comprises:
(a) a first component comprising a device for obtaining NMR spectral intensity
data for a sample (e.g., a NMR spectrometer, e.g., a Bruker INCA 500 MHz);
and,
(b) a second component comprising computer system or device, such as a
computer or linked computers, operatively configured to implement a method of
the
present invention, as described herein, and operatively linked to said first
component.
CA 02445101 2003-10-22
WO 02/086500 PCT/GB02/01854
_98_
In one embodiment, the first and second components are in close proximity,
e.g., so as
to form a single console, unit, system, etc. In one embodiment, the first and
second
components are remote (e.g., in separate rooms, in separate buildings).
A simple process for the use of such a system is described below.
In a first step, a sample (e.g., blood, urine, etc.) is obtained from a
subject, for example,
by a suitably qualified medical technician, nurse, etc., and the sample is
processed as
required. For example, a blood sample may be drawn, and subsequently processed
to
yield a serum sample, within about three hours.
In a second step, the sample is appropriately processed (e.g., by dilution, as
described
herein), and an NMR spectrum is obtained for the sample, for example, by a
suitably
qualified NMR technician. Typically, this would require about fifteen minutes.
In a third step, the NMR spectrum is analysed and/or classified using a method
of the
present invention, as described herein. This may be performed, for example,
using a
computer system or device, such as a computer or linked computers, operatively
configured to implement the methods described herein. In one embodiment, this
step is
performed at a location remote from the previous step. For example, an NMR
spectrometer located in a hospital or clinic may be linked, for example, by
ethernet,
Internet, or wireless connection, to a remote computer which performs the
analysis/classification. If appropriate, the result is then forwarded to the
appropriate
destination, e.g., the attending physician. Typically, this would require
about fifteen
minutes.
Applications
The methods described herein can be used in the analysis of chemical,
biochemical, and
biological data.
The methods described herein provide powerful means for the diagnosis and
prognosis
of disease, for assisting medical practitioners in providing optimum therapy
for disease,
and for understanding the benefits and side-effects of xenobiotic compounds
thereby
aiding the drug development process.
CA 02445101 2003-10-22
WO 02/086500 PCT/GB02/01854
_99_
Furthermore, the mefihods described herein can be applied in a non-medical
setting,
such as in post mortem examinations, forensic science, and the analysis of
complex
chemical mixtures other than mammalian cells or biofluids.
Examples of these and other applications of the methods described herein
include, but
are not limited to, the following:
Medical Diagnostic Applications
(a) Early detection of abnormalityiproblem. For example, the technique can be
used to
identify subjects suffering from cerebral edema immediately on arrival in the
acute
emergency department of a hospital. At present, when patients present with
head
trauma, it is difficult to tell whether cerebral edema will be a problem: as a
result, it may
not be possible to intervene until clinical symptoms of cerebral edema become
evident,
which may be too late to save the patient.
In a similar example, patients arriving at acute emergency departments can be
screened
for internal bleeding and organ rupture, to facilitate early surgical
intervention.
In a third example, the methods described herein can be used to identify a
clinically
silent disease (e.g., low bone mineral density (e.g., osteoporosis); infection
with
Helicobacter Pylori) prior to the onset of clinical symptoms (e.g., fracture;
development of
ulcers).
(b) Diagnosis (identification of disease), especially cheap, rapid, and non-
invasive
diagnosis. For example, the methods described herein can be used to replace
treadmill
exercise tests, echiocardiograms, electrocardiograms, and invasive angiography
as the
collective method for the identification of coronary heart disease. Since the
current tests
for coronary heart disease are slow, expensive, and invasive (with associated
morbidity
and mortality), the methods described herein offer significant advantages.
(c) Differential diagnosis, e.g., classification of disease, severity of
disease, etc., for
example, the ability to distinguish patients with coronary artery disease
affecting 1,2, or
all 3 coronary arteries (see example below); the ability to distinguish
disease at different
anatomical sites, e.g., in the left coronary artery versus the circumflex
artery, or in the
carotid arteries as opposed to the coronary arteries.
CA 02445101 2003-10-22
WO 02/086500 PCT/GB02/01854
- 100 -
(d) Population targeting. A condition (e.g., coronary heart disease,
osteoporosis) may be
clinically silent for many years prior to an acute event (e.g., heart attack,
bone fracture),
which may have significant associated morbidity or mortality. Drugs may exist
to help
prevent the acute event (e.g., statins for heart disease, bisphosphonates for
osteoporosis), but often they cannot be efficiently targeted at the population
level. The
requirements for a test to be useful for population screening are that they
must be cheap
and non-invasive. The methods described herein are ideally suited to
population
screening. Screens for multiple diseases with a single blood sample (e.g.,
osteoporosis,
heart disease, and cancer) further improve the cost/benefit ratio for
screening.
(e) Classification, fingerprinting, and diagnosis of metabolic diseases (e.g.,
inborn errors
of metabolism).
(f) Identifying, classifying, determining the progress of, and monitoring the
treatment of,
infectious diseases.
(g) Characterization and identification of drugs used in overdose. For
example, a patient
may be unconscious following an overdose and/or the nature of the drug taken
in
overdose may not be known. The methods described herein can be used to
characterise the biological consequences of the overdose and to rapidly
identify
candidate agents, facilitating rapid intervention to reverse the effects. Thus
an overdose
of opioids could rapidly be countered with naloxone.
(h) Characterization and identification of poisons, and the metabolic or
biological
consequences of poisoning. Many victims of poisoning (e.g., children) are
unaware of
the nature of the substance they have taken. Furthermore, the subject may be
unconscious or unable to communicate. The methods described herein can be used
to
characterise the biological consequences of the poisoning and to rapidly
identify
candidate poisons. This would facilitate administration of appropriate
antidote, which
typically must be done as quickly as possible after exposure to (e.g.,
ingestion of) the
toxic substance.
CA 02445101 2003-10-22
WO 02/086500 PCT/GB02/01854
-101-
Medical Prognosis Applications
(a) Prognosis (prediction of future outcome), including, for example, analysis
of "old"
samples to effect retrospective prognosis. For example, a sample can be used
to
assess the risk of myocardial infarction among sufferers of angina, permitting
a more
aggressive therapeutic strategy to be applied to those at greatest risk of
progressing to a
heart attack.
(b) Risk assessment, to identify people at risk of suffering from a particular
indication.
The methods described herein can be used for population screening (as for
diagnosis)
but in this case to screen for the risk of developing a particular disease.
Such an
approach will be useful where an effective prophylaxis is known but must be
applied prior
to the development of the disease in order to be effective. For example,
bisphosphonates are effective at preventing bone loss in osteoporosis but they
do not
increase pathologically low bone mineral density. Ideally, therefore, these
drugs are
applied prior to any bone loss occurring. This can only be done with a
technique which
facilitates prediction of future disease (prognosis). The methods described
herein can be
used to identify those people at high risk of losing bone mineral density in
the future, so
that prophylaxis may begin prior to disease inception.
(c) Antenatal screening for a wide range of disease susceptibilities. The
methods
described herein can be used to analyse blood or tissue drawn from a pre-term
fetus
(e.g., during chorionic vilus sampling or amniocentesis) for the purposes of
antenatal
screening.
Aids to Theraputic Intervention
(a) Therapeutic monitoring, e.g., to monitor the progress of treatment. For
example, by
making serial diagnostic tests, it will be possible to determine whether and
to what extent
the subject is returning to normal following initiation of a therapeutic
regimen.
(b) Patient compliance, e.g., monitoring patient compliance with therapy.
Patient
compliance is often very poor, particularly with therapies that have
significant side-
effects. Patients often claim to comply with the therapeutic regimen, but this
may not
always be the case. The methods described herein permit the patient compliance
to be
monitored, both by directly measuring the drug concentration and also by
examining
CA 02445101 2003-10-22
WO 02/086500 PCT/GB02/01854
- 102 -
biological consequences of the drug. Thus, the methods described herein offer
significant advantages over existing methods of monitoring compliance (such as
measuring plasma concentrations of the drug) since the patient may take the
drug just
prior to the investigation, while having failed to comply for previous weeks
or months. By
monitoring the biological consequences of therapy, it is possible to assess
long-term
compliance.
(c) Toxicology, including sophisticated monitoring of any adverse reactions
suffered, e.g.,
on a patient-by-patient basis. This will facilitate investigation of
idiosyncratic toxicity.
Some patients may suffer real, clinically significant side-effects from a
therapy which
were not seen in the majority. Application of the methods described herein
facilitate
rapid identification of these rare, idiosyncratic toxicities so that the
therapy can be
discontinued or modified as appropriate. Such an approach allows the therapy
to be
tailored to the individual metabolism of each patient.
(d) The methods described herein can be used for "pharmacometabonomics," in
analogy
to pharmacogenomics, e.g., subjects could be divided into "responders" and
"nonresponders" using the metabonomic profile as evidence of "response," and
features
of the metabonomic profile could then be used to target future patients who
would likely
respond to a particular therapeutic course. For example, patients given
statins could be
monitored using the methods described herein for beneficial changes in the
subtle
composition of the lipoproteins which are associated with coronary heart
disease. On
this basis, the patients could be categorised into "statin responsive" or
"statin
unresponsive". In a second stage, the methods described herein could be re-
applied to
the untreated metabonomic fingerprint to identify pattern elements which
predict future
responses to statins. Thus, the clinician would know whether or other patients
should be
treated with statins, without having to wait weeks or months to assess the
outcome.
Tools for Drug Development
(a) Clinical evaluations of drug therapy and efficacy. As for therapeutic
monitoring, the
methods described herein can be used as one end-point in clinical trials for
efficacy of
new therapies. The extent to which sequential diagnostic fingerprints move
towards
normal can be used as one measure of the efficacy of the candidate therapy.
CA 02445101 2003-10-22
WO 02/086500 PCT/GB02/01854
- 103 -
(b) Detection of toxic side-effects of drugs and model compounds (e.g., in the
drug
development process and in clinical trials). For example, it will be possible
to identify the
major sites of toxic effects (e.g., liver, kidney, etc.) for new treatments
during Phase I
studies, as well as identifying idiosyncratic toxicities during later stage
clinical trials.
(c) Improvement in the quality control of transgenic animal models of disease;
aiding the
design of transgenic models of disease. Transgenic models of various diseases
have
been useful for the preclinical development of new therapies. Although the
transgenic
model may recapitulate many of the phenotypic markers of the human disease, it
is often
unclear whether similar biochemical mechanisms underlie the resulting
phenotype.
(d) Other animal models of disease. For example, injection of bovine type II
collagen
into mice has often been used as model of rheumatoid arthritis, resulting in
joint swelling
and autoantibodies, but the mechanisms resulting in the phenotype have little
in common
with the human disease. As a result, therapies which are effective in the
animal model
may be ineffective in man. The methods described herein can be used to examine
the
metabolic and phenotypic consequences of gene manipulation or other
interventions
used to yield an animal model of disease, and to compare those with the
metabolic and
phenotypic changes characteristic of the disease in man, and thereby validate
a range of
animal models of human diseases.
(e) Searching for new biochemical markers of disease and/or tissue or organ
damage.
For example, the NMR bin around b3.22 was identified as being particularly
associated
with coronary heart disease (see examples below), and the associated species
has been
identified as a novel metabolic marker of coronary heart disease which may be
amenable to therapeutic intervention.
Commercial and Other Non-Medical Applications
(a) Commercial classification for actuarial assessment, to address the
commercial need
for insurance companies to assess future risk of disease. Examples include the
provision of health insurance and general life cover. This application is
similar to
prognostic assessment and risk assessment in population screening, except that
the
purpose is to provide accurate actuarial information.
CA 02445101 2003-10-22
WO 02/086500 PCT/GB02/01854
- 104 -
(b) Clinical trial enrollment, to address the commercial need for the ability
to select
individuals suffering from, or at risk of suffering from, a particular
condition for enrolment
in clinical trials. For example, at present to perform a clinical trial to
assess efficacy of a
drug intended to prevent heart disease it would be necessary to enroll at
least 4,000
subjects and follow them for 4 years. If it were possible to select
individuals who were
suffering from heart disease, it is estimated that it would be possible to use
400 subjects
followed for 2 years reducing the cost by 25-fold or more.
(c) Characterization and identification of illicit drugs, and the metabolic or
biological
consequences of substance abuse. As for monitoring patient compliance with
desired
therapeutics, the methods described herein can be used to examine the
metabolic
consequences of illegal substance abuse, permitting confirmation of the use of
the
substance, even if none of the substance or its metabolites are present in the
system at
the time of investigation. This circumvents the ability to use proscribed
substances
chronically, but to temporally suspend their use to avoid being identified.
This
application could be applied to identification of habitual users of illegal
drugs (such as
heroin, cocaine, amphetamines, etc.) for police use, or for monitoring use of
banned
substances in sports (e.g., to detect use of anabolic steroids among athletes,
etc.).
(d) Application to pathology and post-mortem studies. For example, the methods
described herein could be used to identify the proximate cause of death in a
subject
undergoing post-mortem examination.
(e) Application to forensic science. For example, the methods described herein
can be
used to identify the metabolic consequences of a range of actions on a subject
(who may
be either dead or alive at the time of the investigation). For example, the
methods
described herein can be applied to identify metabolic consequences of
asphyxiation,
poisoning, sexual arousal, or fear.
(f) Analysis of samples other than mammalian cells or biofluids. For example,
the
methods described herein can be applied to a panel of wines, classified by
experts for
their quality. By recognising patterns associated with good quality, the
methods
described herein can be used by wine manufacturers during the preparation of
blends,
as well as by wine purchasers to facilitate a rapid and independent assessment
of the
quality of a given wine.
CA 02445101 2003-10-22
WO 02/086500 PCT/GB02/01854
- 105 -
(g) The methods described herein can also be used fio identify (known or
novel)
genotypes and/or phenotypes, and to determine an organism's phenotype or
genotype.
This may assist with the choice of a suitable treatment or facilitate
assessment of its
relevance in a drug development process. For example, the generation of
metabonomic
data in panels of individuals with disease states, infected states, or
undergoing treatment
may indicate response profiles of groups of individuals which can be
differentiated into
two or more subgroups, indicating that an allelic genetic basis for response
to the
disease, state, or treatment exists. For example, a particular phenotype may
not be
susceptible to treatment with a certain drug, while another phenotype may be
susceptible
to treatment. Conversely, one phenotype might show toxicity because of a
failure to
metabolise and hence excrete a drug, which drug might be safe in another
phenotype as
it does not exhibit this effect. For example, metabonomic methods can be used
to
determine the acetylator status of an organism: there are two phenotypes,
corresponding
to "fast" and "s(ow" acetylation of drug metabolites. Phenotyping can be
achieved on the
basis of the urine alone (i.e., without dosing a xenobiotic), or on the basis
of urine
following dosing with a xenobiotic which has the potential for acetylation
(e.g.,
galactosamine). Similar methods can also be used to determine other
differences, such
as other enzymatic polymorphisms, for example, cytochrome P450 polymorphism.
As shown below, the methods described herein can be used successfully to
discriminate
between twins, whether identical twins or non-identical twins.
The methods described herein may also be used in studies of the biochemical
consequences of genetic modification, for example, in "knock-out animals"
where one or
more genes have been removed or made non-functional; in "knock-in" animals
where
one or more genes have been incorporated from the same or a different species;
and in
animals where the number of copies of a gene has been increased, as in the
model
which results in the over-expression of the beta amyloid protein in mice
brains as a
model for Alzheimer's disease). Genes can be transferred between bacterial,
plant and
animal species.
The combination of genomic, profieomic, and metabonomic data sets into
comprehensive
"bionomic" systems may permit an holistic evaluation of perturbed in vivo
function.
The methods described herein may be used as an alternative or adjunct to other
methods, e.g., the various genomic, pharmacogenomic, and proteomic methods.
CA 02445101 2003-10-22
WO 02/086500 PCT/GB02/01854
-106 -
EXAMPLES
The following are examples are provided solely to illustrate the present
invention and are
not intended to limit the scope of the present invention, as described herein.
Examale 1
Diagnosis of Coronary Heart Disease (CHD)
As discussed above, the inventors have developed novel methods (which employ
multivariate statistical analysis and pattern recognition (PR) techniques, and
optionally
data filtering techniques) of analysing data (e.g., NMR spectra) from a test
population
which yield accurate mathematical models which may subsequently be used to
classify a
test sample or subject, and/or in diagnosis.
In the context of atherosclerosis/CHD, the inventors have applied these
techniques to
the analysis of either serum or plasma taken from individuals who have been
extensively
characterized, both for the presence of atherosclerosis/CHD by the gold-
standard
angiographic technique and also for a wide range of conventional risk factors.
The metabonomic analysis can distinguish between individuals with and without
atherosclerosis/CHD; and/or the degree of atherosclerosis/CHD. Novel
diagnostic
biomarkers for atherosclerosis/CHD have been identified, and methods for
associated
diagnosis have been developed.
Obtaining NMR Spectra
Patients were recruited to the TVD (triple vessel disease) group who had
significant
coronary artery disease (defined as a reduction of more than 50% in the
intralumenal
diameter) of al! three coronary arteries (left anterior descending, circumflex
and right
coronary arteries). The symptoms of angina had been stable for at least one
month and
no patient had suffered a myocardial infarction in the preceding three months.
Patients were recruited to the NCA (normal coronary artery) group who had
chest pain
and a positive exercise electrocardiogram (the Bruce protocol (see, e.g.,
Bruce, 1974;
Berman et al., 1978; Guyton, 1991 ) was used, where the presence of at least 1
mm of
horizontal or downward sloping ST segment depression at 80 ms after the J
point is
CA 02445101 2003-10-22
WO 02/086500 PCT/GB02/01854
107 -
considered positive), but normal coronary angiograms (judged by two
independent
observers). NCA patients with hypertension, diabetes mellitus and valvular
heart
disease or left ventricular hypertrophy were excluded.
Consecutive patients presenting at Papworth Hospital (Cambridgeshire, UK) who
met
the above criteria for either the TVD or NCA group were recruited to the
study.
36 patients with severe CHD (TVD patients) and 30 patients with
angiographically
normal coronary arteries (NCA patients) were enrolled. The clinical data for
these
patient groups is shown in Table 2-CHD, below. For each parameter, the average
value
is given together with one standard deviation.
Table 2-CHD
TVD NCA
Age (years) 64.1 t 7.2 57.2 + 9.0
Sex: Male (n) 34 7
Sex: Female (n) 2 23
Myocardial infarction 19 1
Systolic Blood Pressure (mmHg) 138 t 23 141 t 22
Diastolic Blood Pressure (mmHg) 75 t 12 78 12
Smokers (n) 1 2
Urea (mM) 5.6 1.6 5.0 1.2
Creatinine (pM) 108 t 18 93 t 14
Glucose (mM) 5.6 t 0.9 5.2 0.6
Total cholesterol (mM) 6.2 0.8 5.9 1.1
HDL-cholesterol (mM) 0.8 -~ 0.2 1.1 t 0.2
LDL-cholesterol (mM) 4.5 0.7 4.3 1.1
Total Chol : HDL-Chol ratio 8.3 t 1.9 5.8 1.8
PAI-1 (ng/dl) 49.1 16.6 37.9 17.4
Triglycerides (mM) 2.1 t 1.1 1.5 1.2
TGF-beta 1.6 t 1.4 4.4 4.8
Total protein (g) 69.4 4.0 70.4 6.3
Albumin (g) 37.4 2.6 38.6 3.2
Globulin 46 4 45 5
CA 02445101 2003-10-22
WO 02/086500 PCT/GB02/01854
- 108 -
Blood was drawn from each patient, allowed to clot in plastic tubes for 2
hours at room
temperature, and the serum was collected by centrifugation. Aliquots of serum
were
stored at -80°C until assayed.
Prior to NMR analysis, samples (150 p1) were diluted with solvent solution
(10% DZO v/v,
0.9% NaCI w/v) (350 p1). The diluted samples were then placed in 5 mm high
quality
NMR tubes (Goss Scientific Instruments Ltd).
Conventional 1-D'H NMR spectra of the blood serum samples were measured on a
Broker DRX-600 spectrometer using the conditions set forth in the section
entitled "NMR
Experimental Parameters."
NMR Experimental Parameters
(a) General:
Samples were NON-SPINNING in the spectrometer
Temperature: 300 K
Operating Frequency: 600.22 MHz
Spectral Width: 8389.3 Hz
Number of data points (TD): 32K
Number of scans: 64
Number of dummy scans: 4 (once only, before the start of the acquisition).
Acquisition time: 1.95 s
(b) Pulse Sequence:
noesypr1d (Broker standard noesypresat sequence, as listed in their manual):
RD - 90°
- t~ - 90° - tm - 90° - FID
Relaxation delay (RD): 1.5 s
Fixed interval (t~): 4 ps
Mixing time (tm): 150 ms
90° pulse length: 10.9 ps
Total recycle period: 3.6 s
Secondary irradiation at the water resonance during RD and tm
CA 02445101 2003-10-22
WO 02/086500 PCT/GB02/01854
- 109 -
(c) Phase Cycling
The phase of the RF pulses and the receiver was cycled on successive scans to
remove
artefacts according to the following scheme, where PH1 refers to the first
90° pulse, PH2
refers to the second, PH3 refers to the third and PH31 refers to the phase of
the
receiver. In the following scheme:
0 denotes 0° phase increment
1 denotes 90° phase increment
2 denotes 180° phase increment
3 denotes 270° phase increment
PH1 =02
PH2=0000000022222222
PH3=00221133
PH31 =02201 331 200231 1 3
(d) Processing of the FIDs:
This was done using using XWINNMR (version 2.1, Bruker GmbH, Germany).
Automatic zero fill x 2 at end of FID.
Line broadening by multiplying the FID by a negative exponential equivalent to
a line
broadening of +0.3 Hz.
Fourier transform.
(e) Processing of the NMR spectra:
This was done using using XWINNMR (version 2:1, Bruker GmbH, Germany).
Spectrum peak phase adjusted manually using the zero and first order
parameters
PHCO, PHC1.
Baseline corrected manually using the command "bast." This allows the
subtraction of
baselines of various degrees of polynomial. The simplest is to subtract a
constant to
remove a DC offset and this was sufficient in the present case. In other
cases, it can be
necessary to subtract a straight line of adjustable slope or to subtract a
baseline defined
by a quadratic function. The possibility exists within the software for
functions up to
quartic in nature.
CA 02445101 2003-10-22
WO 02/086500 PCT/GB02/01854
- 110 -
Once properly phased and baseline corrected, the full spectra showed a flat
featureless
baseline on both sides of the main set of signals (i.e., outside the range b 0
to 10), and
the peaks of interest showed a clear in-phase absorption profile.
'H NMR chemical shifts in the spectra were defined relative to that of the
lactate methyl
group (the middle of the doublet, taken to be at b 1.33).
(f) Reduction of the NMR spectra to descriptors
The'H NMR spectra in the region b 10 - b 0.2 were segmented into 245 regions
or
"buckets" of equal length (b 0.04) using AMIX (Analysis of MIXtures software,
version
2.5, Bruker, Germany). The integral of the spectrum in each segment was
calculated. In
order to remove the effects of variation in the suppression of the water
resonance, and
also the effects of variation in the urea signal caused by partial cross
solvent saturation
via solvent exchanging protons, the region 5 6.0 to 4.5 was set to zero
integral. The
following AMIX profile was used:
command=bucket 1 d table
input-file=<namesfile>
output file=<mydata.amix>
left_ppm=10
right-ppm=0.2
exclude1 left-ppm=6.0
exclude1 right_ppm=4.5
excfude2-left-ppm= (intentionally undefined)
exclude2-right_ppm= (intentionally undefined)
bucket width=0.04
bucket mode=0
bucket scale mode=3
bucket multiplier=0.01
bucket output format=2
normalization region left=10
normalization region right=0.2
The integral data were normalized to the total spectral area using Excel
(Microsoft,
USA). Intensity was integrated over all included regions, and each region was
then
CA 02445101 2003-10-22
WO 02/086500 PCT/GB02/01854
- 111 -
divided by the total integral and multiplied by a constant (i.e., 100, so that
fiinal integrated
intensities are expressed as percentages of the total intensity).
The normalized data were then exported to the SIMCA-P (version 8.0 Umetrics,
Sweden) software package and each descriptor was mean-centered. All subsequent
analysis was therefore performed on normalised mean-centered data.
Visual Analysis of Spectra
The 600 MHz'H NMR spectra of human sera from patients with severe CHD (TVD
patients) and patients with angiographically normal coronary arteries (NCA
patients)
were visually compared (see, e.g., Figure 1-CHD). Few systematic differences
could be
detected when the two groups were compared.
Chemical components visible in the spectra were assigned on the basis of
previously
published data (see, e.g., Nicholson et al., 1995; Lui et al., 1997; Ala-
ICorpela, 1995).
The features assigned in Figure 1-CHD are summarised in Table 3-CHD, below.
Table
3-CHD
No. Chemical Assignment
Shift
(s)
1 0.66 Lipid, HDL; C18 methyl group of HDL-C
2 0.84, 0.87 Lipid, mainly LDL and VLDL; CH3
3 0.97, 1.02 Valine
4 1.25, 1.29 Lipid, mainly LDL and VLDL; (CH2)~
5 1.33 Lactate
6 1.46 Alanine
7 1.57 Lipid; CHzCHZCO.
8 1.69 Lipid; CH2CH~C=C
9 1.97 Lipid; CHzC=C -
10 2.04 Acetyl signal from a-1 acid glycoprotein
11 2.23 Lipid; CHzCO
12 2.41 Glutamine
13 2.52, 2.69 Citrate
14 2.69 Lipid; -C=CCH C=C
CA 02445101 2003-10-22
WO 02/086500 PCT/GB02/01854
- 112 -
15 2.89 Albumin lysyl
16 3.05 Creatinine
17 3.21 Choline
18 3.24 H-2 of (32-glucose
19 3.3-4.0 CH protons from glycerol, glucose, and amino
acid
20 4.11 Lactate
21 4.64 H-9 of (3-glucose
22 4.7 Residual water
23 5.23 H-1 of a-glucose
24 5.26-5.33 Lipids; =CH
Data Analysis
To determine whether it was possible to distinguish TVD and NCA patients on
the basis
of the NMR spectra, principal component analysis (PCA) was performed.
The scores plot of PC2 and PC3 (Figure 2A-CHD) shows that, while there was
much
overlap between the two sample classes, some clustering was evident. Whilst
there is
overlap between NCA and TVD samples, some separation is evident, with NCA
samples
dominating in the upper right quadrant and TVD samples dominating in the lower
left
quadrant. Optimum separation was seen in PC2 and PC3, and hence t2 vs t3 is
shown
in Figure 2A-CHD.
The corresponding PCA loadings scatter plot (Figure 2B-CHD) shows which
regions of
the NMR spectrum are responsible for causing separation between NCA and TVD
samples; the most influential loadings are shown to be: regions b 1.30; 5
1.22; b 3.22; S
0.86; and S 1.26.
Following application of OSC, the TVD and NCA groups were well separated in
the
scores plot of PC1 and PC2 (Figure 2C-CHD, as compared to Figure 2A-CHD).
Here,
NCA samples (circles) dominate in the lower left quadrant; TVD samples
(squares)
dominate in the upper right quadrant. Optimum separation was observed in PC1
and
PC2, and hence t1 vs. t2 is shown in Figure 2C-CHD.
CA 02445101 2003-10-22
WO 02/086500 PCT/GB02/01854
- 113 -
The corresponding loadings plot (Figure 2D-CHD) shows which regions of the NMR
spectrum are responsible for causing separation between NCA and TVD samples.
Importantly, the same regions of the spectra that contributed to the
clustering in the
unfiltered data set (Figure 2B-CHD) also contributed to the clustering seen
after
application of OSC (Figure 2D-CHD): b 1.30; 8 1.34; b 1.22; b 3.22; ~ 0.86;
and b 1.26.
Partial (east square descriminant analysis (PLS-DA) performed using the same
data,
following application of OSC, yielded excellent separation. The resulting
scores plot of
PC2 and PC1 (see Figure 2E-CHD); here, NCA samples (circles) dominate the
right
hand side; TVD samples (squares) dominate the left hand side. The
corresponding
loadings plot (see Figure 2F-CHD) shows which regions of the NMR spectrum are
responsible for causing separation between NCA and TVD samples. Again, the
same
regions appear: S 1.30; S 1.22; b 1.26; b 1.34; 5 3.22; b 0.86; etc.
A section of the variable importance plot (VIP) for the PLS-DA model
calculated from
OSC-filtered NMR data is shown in Figure 3A-CHD.
The regression coefficients for the OSC filtered data are shown graphically in
Figure
3B-CHD. For the regression coefficients, a positive value indicates a
relatively greater
concentration of a metabolite (e.g., assigned using NMR chemical shift
assignment
tables) present in TVD samples and a negative value indicates a relatively
lower
concentration, both with respect to control samples.
The regression coefficients for the PLS-DA model (whether obtained using the
unfiltered
data or OSC-filtered data) again indicated that the same spectral regions
contributed
most strongly to the discrimination of the classes: lipid, mostly VLDL and
LDL, and
choline.
The loadings (variables) that are most influential in causing separation
between NCA
and TVD samples are summarised in Table 4-CHD, below, and are listed in order
of
decreasing importance. The assignments were made by comparing the loadings
with
published tables of NMR data.
CA 02445101 2003-10-22
WO 02/086500 PCT/GB02/01854
- 114-
Table
4-CHD
# Bucket Assignment Chem. Shift (ppm) NMR spectral
Region and intensity,
(ppm) Multiplicity in TVD
vs. NCA
1 1.30 lipid (CH2)" 1.29(m) increased
2 1.22 lipid (CH2)" 1.22(m) decreased
3 1.26 lipid (CH2)~ 1.26(m), 1.25(m) increased
4 1.34 lipid (CH2)~ 1.32(m) increased
3.22 choline N(CH3)3+ 3.21 (s) decreased
~
6 0.86 lipid (CH3) 0.84(t), 0.87(t) increased
7 0.90 lipid (CH3) 0.91 increased
8 0.82 lipid (CH3)/ cholesterol0.84 decreased
9 2.02 lipid (CHzC=C) 2.00(m) increased
1.58 lipid (CH2CH2C0) 1.57(m) increased
11 2.22 lipid (CHzCO) 2.23(m) increased
12 1.98 lipid (CHIC=C) 1.97(m) decreased
The region at i5 3.22 is assigned to -N(CH3)3+groups in molecules containing
the choline
moiety, principally phosphatidylcholine from lipoproteins, mainly HDL, based
on the
known phospholipid content of lipoproteins.
5
The regions as S 1.30, 1.22, 1.26, and 1.34 all arise from the (CH~)~ chains
of fatty acyl
groups, which are present in all lipoproteins as phosholipids, cholesteryl
esters, and
triacylglyerols. The proportions of all three three classes of compounds vary
across the
types of lipoprotein. There are two broad'H NMR peaks in the region 5 1.34-
1.22 which
10 are usually assigned as LDL and VLDL; however, both peaks will contribute
to all of
these regions because of the peak line widths.
Lipoproteins account for approximately 10% of total human blood protein.
Lipoproteins
are water soluble complexes comprising protein components (e.g.,
apolipoproteins) and
lipid components (e.g., cholesterol, cholesteryl esters, phospholipids, and
triglycerides).
Lipoproteins are often conveniently considered to comprise a hydrophobic core
(primarily
of cholesteryl esters and triglycerides) surrounded by a relatively more
hydrophilic shell
(primarily apolipoproteins, phospholipids, and unesterified cholesterol)
projecting its
hydrophilic domains into the aqueous environment. Lipoproteins presumably
serve as
CA 02445101 2003-10-22
WO 02/086500 PCT/GB02/01854
-115 -
transport proteins for lipids, such as triacylglyercols, cholesterol (and
cholesteryl esters),
and other lipids (e.g., phospholipids).
Several classes of lipoproteins (e.g., a, Vii, broad-(3, pre-Vii) can be
distinguished in human
blood, according to their electrophoretic behaviour. However, lipoproteins are
more
conveniently characterized by their ultracentrifugation behavior in high-salt
media, as
described by their flotation constants (densities), as follows: chylomicra,
less than 1.006
g/mL; very low density (VLDL), 1.006-1019 g/mL; low density (LDL), 1.019-1.063
g/mL;
high density (HDL), 1.063-1.21 g/mL; very high density (VHDL), >1.21 g/mL.
Lipoproteins are often approximately spherical in shape, and range in diameter
from
about 0.1 micron (for chylomicra) to about 5 nanometers (for VHDL).
Lipoproteins range
in molecular weight from 200 kd to 10,000 kd and from 4 to 95% lipid (the
higher the
density the lower the lipid content). Chylomicra and VLDLs are rich in
triglycerides
(~90% and ~60% of the total lipid content, respectively), while LDLs are rich
in
cholesterol (~60% of total lipid content) and HDLs are rich in phospholipids
(~50% of
total lipid content).
Choline (HO-CH2CH2-N(CH3)3+) is incorporated into many biologically important
species,
including phosphorylcholine, glycerophosphocholine and phosphatidylcholine
(e.g.,
phospholipids). Phospholipids are components of lipid membranes and also of
lipoproteins. The predominant choline-containing species in blood plasma are
phosphatidylcholines.
Validation
Having established the presence of "clusters" by PCA, the data were analysed
by PLS-
DA to test the predictive power of the model.
For cross-validation purposes, training sets comprising approximately 80% of
the
samples under study (selected randomly) were constructed, and used to predict
the
class of the remaining 20% of the samples. Approximately 80% of the samples
were
selected at random to construct a PLS-DA model which could then be used to
predict the
class membership of the remaining 20% of samples. Class membership was
predicted
using a 0.5 dividing line between the two classes and a class membership
probability
value > 0.01 (99% confidence interval).
CA 02445101 2003-10-22
WO 02/086500 PCT/GB02/01854
- 116 -
The PLS-DA model calculated for the OSC-filtered data was then used to predict
the
class membership of the samples not included in the training set (Figure 4-
CHD). Using
approximately 80% of the NCA (circles) and TVD (squares) samples, a PLS-DA
model
was calculated and used to predict the presence of TVD in the remaining 20% of
samples (the validation set) (triangles, NCA or TVA as marked). The y-
predicted scatter
plot assigns samples to either class 1 (in this case, corresponding to TVD) or
class 0 (in
this case, corresponding to NCA); 0.5 is the cut-off. The PLS-DA model
predicted the
presence and absence of TVD with a sensitivity of 92% and a specificity of 93%
based
on a 99% confidence limit for class membership.
This demonstrates that'H-NMR based metabonomic analysis of plasma samples, in
itself minimally invasive and non-destructive of sample, can achieve
clinically useful
diagnostic performance, when compared to invasive angiography.
This example demonstrates that it is possible to completely separate CHD
patients with
stenosis of all three major arteries from subjects with normal coronary
arteries using
principle component analysis (PCA).
Furthermore, using the supervised PLS-DA algorithm, it is possible to predict
the artery
status of unknown samples using a training set that composed only 24 NCA and
30 TVD
individuals. The small size of the training set required to achieve >90%
sensitivity and
specificity highlights the power of this technique. Substantially larger
training sets
obtained through application of this technique to clinical practice should
further improve
the diagnostic sensitivity and specificity of the technique.
While the peaks around b 1.30 are known to result predominantly from lipid CHI
resonances, the values of the NMR descriptors in this region only correlate
weakly with
the level of LDL-cholesterol (rz = 0.20). This means that there is
considerable NMR
signal intensity information in these windows which is uncorrelated with the
level of
LDL-cholesterol. This arises from the presence of some small molecule
metabolites
such as lactate and threonine and also contributions from other lipoproteins
(mainly
VLDL) present in the biofluid. The line widths of the LDL and VLDL CHZ peaks
are such
that the two peaks overlap considerably and both will contribute to all of the
windows in
this region to varying amounts. The remaining variance is likely to result
from subtle
chemical differences in the lipid composition of LDL particles between
individuals, for
example, degree of fatty acid side chain unsaturation and lipoprotein-protein
molecular
CA 02445101 2003-10-22
WO 02/086500 PCT/GB02/01854
- 117 -
interactions. Such observations will contribute to on-going studies using both
NMR and
other analytical techniques to understand the contribution of lipoprotein
particle
composition to the development of CHD. It does, however, emphasize an
important
facet of high data density metabolic analysis in that it is entirely
unnecessary to
understand fully the complex molecular differences that underlie the spectral
features
associated with CHD to be able to correctly classify individuals with very
high sensitivity
and specificity. Further analysis of the molecular basis of the spectral
differences,
however, will give insight into the mechanistic processes involved.
Examale 2
Determination of Severity of Coronary Heart Disease (CHD)
As discussed above, the inventors have developed novel methods (which employ
multivariate statistical analysis and pattern recognition (PR) techniques, and
optionally
data filtering techniques) of analysing data (e.g., NMR spectra) from a test
population
which yield accurate mathematical models which may subsequently be used to
classify a
test sample or subject, and/or in diagnosis.
In the context of atherosclerosis/GHD, the inventors have applied these
techniques to
the analysis of either serum or plasma taken from individuals who have been
extensively
characterized, both for the presence of atherosclerosis/CHD by the gold-
standard
angiographic technique and also for a wide range of conventional risk factors.
The metabonomic analysis can distinguish between individuals with and without
atherosclerosis/CHD; and/or the degree of atherosclerosis/CHD. Novel
diagnostic
biomarkers for atherosclerosis/CHD have been identified, and methods for
associated
diagnosis have been developed.
Obtaining NMR Spectra - Severity of CHD
To determine whether'H NMR based metabonomic analysis could distinguish the
severity of CHD present, samples were collected from individuals with stenosis
of one,
two or three major coronary arteries. Although this is a crude indicator of
disease
severity, it is plausible that the number of vessels stenosed correlated (at
least weakly)
with whole body atherosclerotic plaque load.
CA 02445101 2003-10-22
WO 02/086500 PCT/GB02/01854
- 118 -
Using plasma from 76 patients (28 with 1 vessel stenosed: type "1" vessel
disease; 20
with 2 vessels stenosed: type "2" vessel disease; 28 with 3 vessels stenosed:
type "3"
vessel disease),'H NMR spectral analysis was used to classify the severity of
CHD.
The methods for collection of samples; NMR spectroscopy; data processing; and
pattern
recognition methods were all as described above, unless specified otherwise.
Patients were recruited according to the same criteria as described above,
except that
patients with more than 50% stenosis of either one, two or all three coronary
arteries
(assessed by two independent observers) were recruited and females were
excluded.
The clinical data that were measured (conventionally) for these patient groups
are shown
in Table 5-CHD, below. For each parameter, the average value is given together
with
one standard deviation.
Table
5-CHD
# Parameter Type "1" Type "2" Type "3"
1 Number (n) (all male)28 20 28
2 Height (m) 1.76 t 0.07 1.80 0.05 1.78 0.06
3 Weight (kg) 83.5 14.7 91.1 t 10.0 86.7 9.6
4 BMI (kg/m~) 26.77 4.01 28.07 3.55 27.32 2.22
5 Erythrocytes 4.64 t 0.35 4.54 0.55 4.66 0.25
6 Haemoglobin (g d/L) 13.9 0.82 13.53 t 1.52 13.54 0.95
7 Hematocrit 0.418 0.026 0.410 0.053 0.409 0.025
8 MCV (fl) 90.2 t 4.3 90.2 4.3 87.7 5.3
9 MCHC (g d/L) 30.1 1.6 29.8 1.5 29.1 2.0
10 Platelets (10y/L) 210 t 45 210 t 27 214 57
11 Leukocytes 6.30 t 1.21 6.74 1.74 6.22 1.50
12 Neutrophils 10y/L 3.63 t 0.89 4.09 1.77 3.61 1.14
13 Lymphocytes (10~/L) 1.88 0.52 1.84 t 0.55 1.79 0.44
14 Monocytes (10y/L) 0.53 t 0.14 0.51 0.17 0.53 0.14
Eosinophils (10y1L) 0.21 t 0.12 0.19 t 0.12 0.16 0.10
16 Basophils (10y/L) 0.02 0.01 0.02 t 0.01 0.02 0.01
17 LUC 0.08 +_ 0.03 0.08 t 0.04 0.09 0.05
18 Fibrinogen 3.52 t 0.86 3.76 1.01 3.57 0.84.
19 PT test (s) 13.6 ~ 0.9 13.6 t 7.2 13.7 0.8
APTT test 29.0 t 2.9 30.1 t 4.0 30.2 3.1
CA 02445101 2003-10-22
WO 02/086500 PCT/GB02/01854
- 119 -
Table
5-CHD
# Parameter Type "1" Type "2" Type "3"
21 Sodium (mmol/L) 140 t 2 139 t 2 140 2
22 Potassium (mmol/L) 4.1 0.3 4.1 ~ 0.2 4.2 0.3
23 Urea (mmol/L) 6.1 1.7 6.6 +_ 1.4 6.1 1.3
24 Creatinine (pmol/L) 104 t 10 103 t 10 107 t 11
25 Protein (glL) 72 t 4 72 6 72 3
26 Albumin (g/L) 42 t 3 41 4 42 3
27 Immunoglogulins (g/L)31 t 4 30 5 30 3
28 Bilirubin (Nmol/L) 9 4 11 4 10 4
29 ALT (U/L) 19 t 6 23 10 22 8
30 ALP (U/L) 183 t 41 178 39 173 41
31 yGt (U/L) 12.1 7.0 14.0 10.3 12.9 7.5
32 Glucose (mmol/L) 5.8 1.3 5.9 1.4 6.1 2.3
33 HbA1c 5.610.5 5.91.3 6.30.6
34 Cholesterol (mmol/L)5.3 0.9 5.6 1.4 5.2 0.9
35 LDL-C (mmoI/L) 3.3 0.8 3.6 1.3 3.2 0.9
36 HDL-C (mmol/L) 1.01 0.23 0.97 0.17 1.04 0.34
37 Triglycerides (mmollL)2.0 1.1 2.2 t 1.0 2.1 0.8
Blood samples from these patients were drawn into Diatube H tubes, and
platelet-poor
,_ plasma was prepared as previously described. Aliquots of plasma were stored
at -80°C
until assayed.
Samples were obtained, and 1-D'H NMR spectra were collected using the same
methods and parameters as described in the NCA/TVD section.
Data Analysis
A principal components analysis (PCA) model was calculated using 1-D'H NMR
spectra
for serum samples from patients with either 1, 2, or 3 vessels stenosed (i.e.,
type "1 ",
type "2", and type "3" vessel disease, respectively).
The scores scatter plot for the PCA model is shown in Figure 5A-CHD. Whilst
there is
much overlap between the three classes of sample, some separation is evident
CA 02445101 2003-10-22
WO 02/086500 PCT/GB02/01854
- 120 -
particularly for the type "1" vessel disease samples which dominating the
lower left of the
plot. Optimum separation was observed in PC2 and PC1, hence t2 vs. t1 is
plotted in
the figure.
The corresponding loadings plot is shown in Figure 5B-CHD, which shows which
regions
of the NMR spectrum are responsible for causing separation between the three
different
degrees of severity of CHD. Due to the extent of overlap, the loadings plot is
difficult to
interpret, however, the most influential loadings are regions: 3.22; 1.38;
1.34; 1.30; 1.26;
1.22; 0.90; 0.86; and 0.82 ppm.
Improved separation is possible using PLS-DA (rather than the unsupervised
PCA). Due
to the fact that the pattern recognition software package (SIMCA) displays
data only in
2-dimensions, and in this example there are three sample classes, it is
necessary to plot
two classes at a time calculated for, e.g., PLS-DA models. A scores plot and
the
corresponding loadings for each pair ("1" and "2"; "1" and "3' ; "2" and "3")
is shown in
Figure 5C-CHD. There remains much overlap between the classes; however, some
separation is evident.
Another PCA model was calculated using the same data. However, prior to PCA,
the
NMR data were filtered by application of OSC which serves to remove variation
that is
not correlated to class and therefore improves subsequent multivariate
analysis.
The scores scatter plot for the resulting PCA model is shown in Figure 6A-CHD.
The
improved separation between the classes of different severity of CHD is
evident, with
type "1" vessel disease dominating in the lower left quadrant.
The corresponding loadings scatter plot is shown in Figure 6B-CHD, which shows
which
regions of the NMR spectrum are responsible for distinguishing severity of
CHD.
Importantly, it is the same regions as for distinguishing NCA from TVD that
are depicted
in Figure 5B-CHD, namely: 3.22; 1.38; 1.34; 1.30; 1.26; 1.22; 0.90; 0.86; and
0.82 ppm.
Again, improved separation is possible using PLS-DA (rather than the
unsupervised
PCA). A scores plot and the corresponding loadings for each pair ("1" and "2';
"1" and
"3' ; "2" and "3") is shown in Figure 6C-CHD. Most separation is observed
between types
"1" and "2" (Figure 6C-(1)-CHD) and types "1" and "3" (Figure 6C-(5)-CHD).
This
suggests that the metabolic profile (NMR spectrum) for type "1" vessel disease
differs
CA 02445101 2003-10-22
WO 02/086500 PCT/GB02/01854
-121 -
the most compared to the profiles for type "2" and type "3", which are more
similar to
each other.
Pairs of variable importance plots (VIPs) and regression coefficient plots for
each of the
three PLS-DA models described in Figure 6C-(1)-CHD through (6)-CHD are shown
in
Figure 7-(1)-CHD through (6)-CHD.
The regression coefficients in the loadings plots indicated that spectral
windows ca. 5
1.30 and S 1.26, dominated by lipid resonances, contributed to most of the
separation
between the severity classes, with the window at b 3.22 (choline) being
relatively less
important than in the comparison of TVD and NCA patients.
Validation
Y-predicted scatter plots for the OSC-PLS-DA models are shown in Figure 8A-
CHD,
Figure 8B-CHD, and Figure 8C-CHD, and these demonstrate the ability of'H NMR
based metabonomics to predict class membership (severity of CHD; 1, 2 or 3
vessels
affected) of unknown samples. For each plot, about 80 % of the total number of
samples
were used to calculate a PLS-DA model which was then used to predict the
severity in
the remaining 20% of the samples. The y -predicted scatter plots assign
samples to
either class 1 or class 0; and the cut-off is 0.5.
The type "1" and type "2" vessel disease PLS-DA model (Figure 8A-CHD)
predicted the
severity accurately in 88% of cases. Furthermore, for a two-component model,
severity
was predicted with a significance level >_90% using a 99% confidence limit.
The type "2" and type "3" vessel disease PLS-DA model (Figure 8B-CHD)
predicted the
severity accurately in 88% of cases. Furthermore, for a two-component model,
severity
was predicted with a significance level >_85% using a 99% confidence limit.
The Type "1" and type "3" vessel disease PLS-DA model (Figure 8C-CHD)
predicted the
severity accurately in 75% of cases. Furthermore, for a two-component model,
severity
was predicted with a significance level >92% using a 99% confidence limit.
This metabonomic analysis can distinguish individuals with different severity
of CHD.
Even using the crude parameter of number of major coronary vessels with >50%
CA 02445101 2003-10-22
WO 02/086500 PCT/GB02/01854
- 122 -
stenosis, this example demonstrates that both PCA and PLS-DA are capable of
categorizing CHD patients on the basis of severity. The failure to achieve
complete
separation of the classes is as likely to reflect the crude nature of the
severity
designations based solely on coronary angiography as on any lack of power in
the
metabonomic analysis to discriminate individuals.
Example 3 (Comparison Example)
Use of Established Clinical Risk Factors
In this example, multivariate data analysis was used to classify the severity
of CHD on
the basis of established clinical parameters.
This allows direct comparison of the performance of the metabonomic analysis
as a
diagnostic technique with algorithms based on conventional risk factors.
A PCA model was calculated using established clinical parameters measured for
patients with 1, 2 or 3 vessels~stenosed. The scores scatter plot for PC1 and
PC2 is
shown in Figure 9A-CHD. The PCA model shows there is much overlap between the
samples, and no separation is evident; compare this with Figure 5A-CHD and
Figure
6A-CHD. There is no evidence of separation in the PCA scores plot, suggesting
that
clinical parameters do not distinguish between "1 ", "2", or "3" vessel
disease.
The corresponding loadings plot is shown in Figure 9B-CHD, and shows which of
the
established clinical are responsible for causing separation between the three
different
degrees of severity of CHD. Due to the extent of overlap, the loadings plot is
difficult to
interpret.
Improved separation is possible using PLS-DA (rather than the unsupervised
PCA). Due
to the fact that the pattern recognition package (SIMCA) displays data only in
2-dimensions, and in this example there are three sample classes, it is
necessary to plot
two classes at a time calculate for, e.g., PLS-DA models. A scores plot and
the
corresponding loadings for each pair is shown in Figure 9C-CHD. As can be seen
from
the figures, the separation based on established clincial parameters is not as
evident as
it was based on NMR data.
CA 02445101 2003-10-22
WO 02/086500 PCT/GB02/01854
- 123 -
Pairs of variable importance plots (VIPs) and regression coefficient plots for
each of the
three PLS-DA models described in Figure 9C-(1)-CHD through (6)-CHD are shown
in
Figure 10-(1)-CHD through (6)-CHD.
None of the risk factors measured (including age, blood pressure, LDL and HDL
cholesterol, total cholesterol, total triglyceride, fibrinogen, PAI-1, white
blood cell count,
creatinine or history of cigarette smoking) were significantly different
between the three
groups (p>0.05 by ANOVA in each case).
This demonstrates that'H-NMR based metabonomic methods described above are
substantially better able to distinguish the severity of CHD based on a single
blood
sample than any of the conventional risk factors yet identified.
No other conventional risk factors measured in these subjects (including age,
blood
pressure, lipoprotein levels or clotting parameters) differed between the
severity classes,
even in a cross-sectional analysis, and hence were completely unable to
distinguish
individuals within the population on the basis of CHD severity. This
demonstrates the
extent to which metabonomics improves upon conventional risk factor analysis.
***
The foregoing has described the principles, preferred embodiments, and modes
of
operation of the present invention. However, the invention should not be
construed as
limited to the particular embodiments discussed. Instead, the above-described
embodiments should be regarded as illustrative rather than restrictive, and it
should be
appreciated that variations may be made in those embodiments by workers
skilled in the
art without departing from the scope of the present invention as defined by
the appended
claims.
CA 02445101 2003-10-22
WO 02/086500 PCT/GB02/01854
-124 -
REFERENCES
A number of patents and publications are cited herein in order to more fully
describe and
disclose the invention and the state of the art to which the invention
pertains. Full
citations for these references are provided herein. Each of these references
is
incorporated herein by reference in its entirety into the present disclosure,
to the same
extent as if each individual reference was specifically and individually
indicated to be
incorporated by reference.
Ala-Korpela, M., 1995, "H-1 NMR spectroscopy of human blood plasma," Progress
in
Nuclear Magnetic Resonance Spectroscopy, Vol. 27, pp. 475-554.
Ala-Korpela, M., Hiltunen, Y. and Bell, J.D., 1995, "Quantification of
biomedical NMR
data using artificial neural network analysis: Lipoprotein lipid profiles from
H-1
NMR data of human plasma," NMR Biomed., Vol. 8, pp. 235-244.
Andersen, C. A., 1999, "Direct orthogonalization," Chemometrics and
Intelligent
Laboratory Systems, Vol. 47, pp. 51-63.
Anker, L.S., and Jurs, P.C., 1992, "Prediction of C-13 nuclear magnetic
resonance
chemical shifts by artificial neural networks," Anal. Chem., Vol. 64, pp. 1157-
1164.
Anthony, M.L. et al., 1994, "Pattern recognition classification of the site of
nephrotoxicity
based on metabolic data derived from proton nuclear magnetic resonance
spectra of urine," Mol. Pharmacol., Vol. 46, pp. 199-211.
Anthony, M.L. et al., 1995, "Classification of toxin-induced changes in'H NMR
spectra of
urine using an artificial neural network," J. Pharm. Biomed. Anal., Vol. 13,
pp. 205-211 _
Beckwith-Hall, B.M, et al., 1998, "Nuclear magnetic spectroscopic and
principal
components analysis investigations into biochemical effects of three model
hepatotoxins," Chem. Res. Tox., Vol. 11, pp. 260-272.
Berman J.W., Guida M.P., Warren J., Amat J., and Brosnan C.F., 1996,
"Localization of
monocyte chemoattractant peptide-1 expression in the central nervous system in
experimental autoimmune encephalomyelitis and trauma in the rat", Journal of
Immunology, Vol. 156, pp 3017-3023.
Berman, J.L., Wynne, J., Cohn, P.F. (1978), "A multivariate approach for
interpreting
treadmill exercise tests in coronary artery disease," Circulation, Vol. 58,
pp. 505-
512.
CA 02445101 2003-10-22
WO 02/086500 PCT/GB02/01854
-125-
Bishop, C., 1995, Neural Networks for Pattern Recognition, University Press,
Oxford,
England, pp. 164-193.
Breslow, J.L., 1993, "Transgenic mouse models of lipoprotein metabolism and
atherosclerosis," Proc. Natl. Acad. Sci. USA, Vol. 90, pp. 8314-8318.
Bretthorst, G.L., 1990a, "Bayesian Analysis. 2. Signal-Detection and Model
Selection," J.
Magn. Reson., Vol. 88, pp. 552-570.
Bretthorst, G.L., 1990b, "Bayesian Analysis. 3. Applicants to NMR Signal-
Detection,
Model Selection, and Parameter-Estimation," J. Magn. Reson., Vol. 88,
pp. 571-595.
Bretthorst, G.L., Hung, C.C., Davignon, D.A., et al., 1988, "Bayesian-Analysis
of Time-
Domain Magnetic Resonance Signals," J. Magn. Reson., Vol. 79, pp. 369-376.
Bro, R., 1997, "PARAFAC. Tutorial and applications," in Chemometrics and
Intelligent
Laboratory S sty ems, Vol. 38, pp. 149-171.
Broomhead, D.S., and Lowe, D., 1988, "Multi-variable functional interpolation
and
adaptive networks," Complex Systems, Vol. 2, pp. 321-355.
Brown, T.R. and Stoyanova, R., 1996, "NMR spectral quantitation by principal-
component analysis .2. Determination of frequency and phase shifts," J. Maqn.
Reson., Series B, Vol. 112, pp. 32-43.
Bruce, R.A., 1974, "The value of the Balke protocol," Am. Heart J., Vol. 88,
pp. 533-534.
Claridge, T.D.W., Hicth-Resolution NMR Techniques in Orgianic Chemistry: A
Practical
Guide to Modern NMR for Chemists,Oxford University Press, 2000.
Collins, F.S. and McKusick, V.A., 2001, "Implications of the Human Genome
Project for
medical science," JAMA, Vol. 285, pp. 540-544.
Confort-Gouny, S., Vion-Dury, J., Nicoli, F., Dano, P., Gastaut, J.-L., and
Cozzone, P.J.,
1992, "Metabolic characterization of neurological diseases by proton localized
nmr-spectroscopy of the human brain," Comptes Rendus de fAcademie des
Sciences Serie III - Sciences de la Vie-Life Sciences, Vol. 315, pp. 287-293.
Cullen, P., Funke, H., Schulte, H. and Assmann, G., 1998, "Lipoproteins and
cardiovascular risk - from genetics to CHD prevention," European Heart
Journal,
Vol. 19, pp. C5-C11, Suppl. C.
Despres, J., Lemieux, I., Dagenais, G., Cantin, B. and Lamarche, B., 2000,
"HDL-cholesterol as a marker of coronary heart disease risk: the Quebec
cardiovascular study," Atherosclerosis, Vol. 153, pp. 263-272.
Dolecek, T.A., Milas, N.C., Van Horn, L.V., Farrand, M.E., Gorder, D.D.,
Duchene, A.G.,
Dyer, J.R., Stone, P.A. and Randall, B.L., 1986, "A long-term nutrition
CA 02445101 2003-10-22
WO 02/086500 PCT/GB02/01854
-126-
intervention experience - lipid responses and dietary adherence patterns in
the
multiple risk factor intervention trial," J. Am. Diet Assoc., Vol. 86, pp. 752-
758.
Dutt, M.J. and Lee, K.H., 2000, "Proteomic analysis," Curr. Opin. Biotechnol.,
Vol. 11,
pp. 176-179.
Dvorak A.M., Schroeder J.T., MacGlashan D.W., Bryan K.P., Morgan E.S.,
Lichtenstein
L.M. and MacDonald S.M., 1996, "Comparative ultrastructural morphology of
human basophils stimulated to release histamine by anti-Ige, recombinant IGE-
dependent histamine-releasing factor, or monocyte chemotactic protein-1 ",
Journal of Allergy and Clinical Immunology, Vol. 98, pp 355-370.
Eriksson, L., Johansson, E., Kettaneh-Wold, H., and Wold, S., 1999,
Introduction to Multi
and Meaavariate Analysis using Projection Methods (PCA & PLS), UMETRICS
Inc. (Box 7960, SE90719 Umea, SWEDEN), pp. 267-296.
Fan, T.W.-M., 1996, "Metabolite profiling by one- and two-dimensional NMR
analysis of
complex mixtures," Proa. NMR Spectrosc., Vol. 28, pp. 161-219.
Farrant, R.D., et al., 1992, "An automatic data reduction and transfer method
to aid
pattern-recognition analysis and classification of NMR spectra," J. Pharm.
Biomed. Anai., Vol. 10, pp. 141-144.
Fearn, T., 2000, "On orthogonal signal correction," Chemometrics and
Intelligent
Laboratory S std, Vol. 50, pp. 47-52.
Frank, LE., et al., 1984, "Prediction of product quality from spectral data
using the partial
least-squares method," J. Chem. Info. Coma., Vol. 24, p. 20-24.
Garrod, S., Humpher, E., Connor, S.C., Connelly, J.C., Spraul, M., Nicholson,
J.K., and
Holmes, E., 2001, "High-resolution H-1 NMR and magic angle spinning NMR
spectroscopic investigation of the biochemical effects of 2-bromoethanamine in
intact renal and hepatic tissue," Magn. Reson. Med., Vol. 45, pp. 781-790.
Gartland, K.P.R. et al., 1990a, "A pattern recognition approach to the
comparison of'H
NMR and clinical chemical data for classification of nephrotoxicity," J.
Pharm.
Biomed. Anal., Vol. 8, pp. 963-968.
Gartland, K.P.R. et al., 1990b, "Pattern recognition analysis of high
resolution'H NMR
spectra of urine. A nonlinear mapping approach to the classification of
toxicological data," NMR in Biomed., Vol. 3, pp. 166-172.
Gartland, K.P.R, et al., 1991, "The application of pattern recognition methods
to the
analysis and classification of toxicological data derived from proton NMR
spectroscopy of urine," Mol. Pharmacol., Vol. 39, pp. 629-642.
Geisow, M.J., 1998, "Proteomics: One small step for a digital computer, one
giant leap
for humankind," Nature Biotechnology, Vol. 16, p. 206.
CA 02445101 2003-10-22
WO 02/086500 PCT/GB02/01854
-127-
Ghirnikar R.S., Lee Y.L., He T.R., Eng L.F., 1996, "Chemokine expression in
rat stab
wound brain injury", Journal of Neuroscience Research, Vol. 46, pp 727-733.
Gong J.-H.,Ratkay L.G., Waterfield J.D., and Clark-lewis I., 1997, "An
antagonist of
monocyte chemoattractant protein 1 (mcp-1 ) inhibits arthritis in the mrl-Ipr
mouse
model", Journal of Experimental Medicine, Vol. 186, pp 131-137.
Guyton, A.C., 1991, "Chapter 12: Electrocardiographic interpretation of
cardiac muscle
and coronary abnormalities," In: A Textbook of Medical Ph sy'oloa_y, Eighth
Edition
(WB Saunders, London), pp. 124-137.
Gygi, S.P.; Rochon, Y.; Franza, B.R.; Aebersold, R, 1999, "Correlation between
protein
and mRNA abundance in yeast," Molecular and Cellular Biology, Vol. 19, pp.
1720-1730.
Hare, B.J., and Prestegard, J.H., 1994, "Application of neural networks to
automated
assignment of NMR spectra of proteins," J. Biomol. NMR, Vol. 4, pp. 35-46.
Hiltunen, Y., Heiniemi, E. and Ala-Korpela, M., 1995, "Lipoprotein lipid
quantification by
neural-network analysis of H-1 NMR data from human blood-plasma," J. Mag.
Res. Ser. B, Vol. 106, pp. 191-194.
Holmes, E. et al., 1998a, "Development of a model for classification of toxin-
induced
lesions using'H NMR spectroscopy of urine combined with pattern recognition,"
NMR in Biomed., Vol. 11, pp. 235-244.
Holmes, E. et al., 1998b, "The identification of novel biomarkers of renal
toxicity using
automatic data reduction techniques and PCA of proton NMR spectra of urine,"
Chemomet. & Intel. Lab Systems, Vol. 44, pp. 245-255.
Holmes, E., et al., 1992, "NMR spectroscopy and pattern recognition analysis
of the
biochemical processes associated with the progression and recovery from
nephrotoxic lesions in the rat induced by mercury(II)chloride and 2-bromo-
ethanamine," Mol. Pharmacol., Vol. 42, pp. 922-930.
Holmes, E., et al., 1994, "Automatic data reduction and pattern recognition
methods for
analysis of'H NMR spectra of human urine from normal and pathological states,"
Anal. Biochem., Vol. 220, pp. 284-296.
Howells, S.L., Maxwell, R.J., Howe, F.A., Peet, A.C., Stubbs, M., Rodrigues,
L.M.,
Robinson, S.P., Baluch, S., and Griffiths, J.R., 1993, "Pattern-recognition of
P-31
magnetic-resonance spectroscopy tumor spectra obtained in-vivo," NMR
Biomed., Vol. 6, pp. 237-241.
lida K, Kadota J., Kawakami K., Matsubara Y., Shirai R., and Kohno S., 1997,
"Aanalysis
of T cell subsets and beta chemokines in patients with pulmonary sarcoidosis",
Thorax, Vol. 52, pp 431-437.
CA 02445101 2003-10-22
WO 02/086500 PCT/GB02/01854
- 128 -
Isles, C.G. and Paterson, J.R., 2000, "Identifying patients at risk for
coronary heart
disease: implications from trials of lipid-lowering drug therapy," Q. J. Med.,
Monthl~i Journal of the Association of Physicians, Vol. 93, pp. 567-574.
Joreskog, K.G., and Wold, H., 1982 Systems under Indirect Observation, North
Holland,
Amsterdam.
Kannel, W.B, Gordon, T. (eds.), February 1974, The Framinaham Study. An
~idemioloqical investigation of cardiovascular disease, DHEW pub. no. (NIH)
74-599, Public Health Service, Washington, DC (U.S. Government Printing
Office).
Kjelsberg, M.O., Cutler, J.A. and Dolecek, T.A., 1997, "Brief description of
the Multiple
Risk Factor Intervention Trial," Amer. J. Clinical Nutrition, Vol. 65
(supplement),
pp. S191-S195.
Klenk, H.P., et al., 1997, "The complete genome sequence of the
hyperthermophilic,
sulphate-reducing archaeon Archaeoglobus fulgidus," Nature, Vol. 390, pp. 364-
370.
Kopka, P. Dormann, T. Altmann, R.N. Trethewey and L. Willmitzer, 2000,
"Metabolic
profiling for plant functional genomics," Nature Biotechnology, Vol. 18, pp.
1157-
1161.
Kowalski, B.R., Sharaf, M. and Illman D., Chemometrics (John Wiley & Sons,
Chichester, 1986).
Kuesel, A.C., Stoyanova, R., Aiken, N.R., Li, C.-W., Szwergold, B.S., Shaller,
C. and
Brown, T.R., 1996, "Quantitation of resonances in biological P-31 NMR spectra
via principal component analysis: Potential and limitations," NMR Biomed.,
Vol. 9,
pp. 93-104.
Kuller, L.H., Ockene, J.K., Meilahn, E., Wentworth, D.N., Svendsen, K.H. and
Neaton,
J.D., 1991, "Cigarette-smoking and mortality," Preventative Medicine, Vol. 20,
pp. 638-654.
Kvalheim, O. M., Karstang, T. V., 1989, "Interpretation of latent-variable
regression
models," Chemometrics and Intelligent Laboratory Systems, Vol. 7, pp. 39-51.
Lindon, J.C., et al., 1980, "Digitisation and Data Processing in Fourier
Transform NMR,"
Progress in NMR Spectroscopy, Vol. 14, pp. 27-66.
Lindon, J.C., et al., 1999, "NMR spectroscopy of biofluids," in Annual Reports
on NMR
S~~ectroscopy (Webb, G.A., ed.), Academic Press (London), Vol. 38, pp. 1-88.
Lindon, J.C.; Holmes, E.; Nichofson, J.K., 2001, "Pattern recognition methods
and
applications in biomedical magnetic resonance," Progress in NMR
Spectroscopy," Vol. 39, pp. 1-40.
CA 02445101 2003-10-22
WO 02/086500 PCT/GB02/01854
-129-
Martin, G.J., 1998, "Recent advances in site-specific natural isotope
fractionation studied
by nuclear magnetic resonance," Isotopes in Environmental and Health Studies,
Vol. 34, pp. 233-243.
Martin, M.L. and Martin, G.J., 1999, "Site-specific isotope effects and origin
inference,"
Analysis, Vol. 27, p. 209-213.
Martin T.R., Galli S.J., Katona I.M.and Drazen J.M., 1989, "Role of mast-cells
in
anaphylaxis - evidence for the importance of mast-cells in the cardiopulmonary
alterations and death induced by anti-IGE in mice", Journal of Clinical
Investigation, Vol. 83, pp 1375-1383.
Mazzucchelli L., Hauser C., Zgraggen K., Wagner H.E., Hess M.W., Laissue J.A.
and
Mueller C, 1996, "Differential in situ expression of the genes encoding the
chemokines mcp-1 and rantes in human inflammatory bowel disease", Journal of
Pathology Vol. 178, 201-206.
Mcllvain, H.E., McKinney, M.E., Thompson, A.V. and Todd, G.L., 1992,
"Application of
the MRFIT smoking cessation program to a healthy, mixed-sex sample," Am. J.
Prey. Med., Vol. 8, pp. 165-170.
Moka, D., et al., 1998, "Biochemical classification of kidney carcinoma biopsy
samples
using magic angle spinning NMR spectroscopy," J. Pharm. Biomed. Anal., Vol.
17, pp. 125-132.
Morvan, D., Jehenson, P., Duboc, D., and Syrota, A., 1990, "Discriminant
factor-analysis
of P-31 NMR spectroscopic data in myopathies," Magn. Reson. Med., Vol. 13,
pp. 216-227.
Multiple Risk Factor Intervention Trial (MRFIT) Research Group, 1986,
"Relationship
between baseline risk factors and coronary heart disease and total mortality
in
the Multiple Risk Factor Intervention Trial, " Prev. Med., Vol. 15, pp. 254-
273.
Nicholson, J.K. et al., 1989, "High resolution proton magnetic resonance
spectroscopy of
biological fluids," Prog. NMR Spectrosc., Vol. 21, pp. 449-501.
Nicholson, J.K. et al., 1995, "750 MHz'H and'H -'3C NMR spectroscopy of human
blood plasma," Anal tiy cal Chemistry, Vol. 67, pp. 793-811.
Nicholsori, J.K., et al., 1999, "Metabonomics - understanding the metabolic
responses of
living systems to pathophysiological stimuli via multivariate statistical
analysis of
biological NMR spectroscopic data," Xenobiotica, Vol. 29, pp. 1181-1189.
Nillson, N.J., 1965, Learning Machines, McGraw-Hill, New York.
Ogata H., Takeya M., Yoshimura T., Takagi K. and Takahashi K. 1997, "The role
of
monocyte chemoattractant protein-1 (mcp-1) in the pathogenesis of collagen-
induced arthritis in rats", Journal of Pathology Vol. 182, pp106-114.
CA 02445101 2003-10-22
WO 02/086500 PCT/GB02/01854
- 130 -
Parzen, E., 1962, "On estimation of a probability density function and mode,"
Ann.
Mathemat. Stat., Vol. 33, p. 1065-1076.
Patterson, D., 1996, Artificial Neural Networks, Prentice Hall, Singapore.
Plump, A.S., Smith, J.D., Hayek, T., Aalto-Setala, K., Walsh, A., Verstuft,
J.G., Rubin
E.M. & Breslow, J.L., 1992, "Severe hypercholesterolemia and atherosclerosis
in
apolipoproteinE deficient mice created by homologous recombination in ES
cells," Cell, Vol. 71, pp. 343-353.
Press, William H., Teukolsky, Saul A., Vetterling, William T., Flannery, Brian
P., January
1993, Numerical Recipes in C : The Art of Scientific Computing, 2nd edition,
Cambridge University Press.
Quinlan, J.R., 1986, "Induction of decision trees," Machine Learning, Vol. 1,
pp. 81-106.
Ross, R., 1999, "Mechanisms of disease - Atherosclerosis - An inflammatory
disease,"
The New England Journal of Medicine, Vol. 340, pp. 115-126.
Sach M., Bauermeister K., Burger J., Loetscher P., Elsner J., Schollmeyer P,
and Dobos
G., 1997, "Inverse mcp-llil-8 ration in effluents of CAPD patients with
peritonitis
and in isolated cultured human peritoneal macrophages", Nephrolog<y, Dialysis
and Transplantation, Vol. 12, pp 315-320.
Sjostrom, M., Wold, S., and Soderstrom, B., 1986, "PLS Discriminant Plots,"
Proceedings of PARC in Practice, Amsterdam, June 19-21, 1985, Elsevier
Science Publishers B.V., North Holland.
Somorjai, R.L., Nikulin, A.E., Pizzi, N., Jackson, D., Scarth, G., Dolenko,
B., Gordon, H.,
Russell, P., Lean, C.L., Delbridge, L., Mountford, C.E., and Smith, LC.P.,
1995,
"Computerized consensus diagnosis - a classification strategy for the robust
analysis of MR spectra .1. application to H-1 spectra of thyroid neoplasms,"
Maan. Reson. Med., Vol. 33, pp. 257-263.
Speckt, D.F., 1990, "Probabilistic Neural Networks," Neur. Networks, Vol. 3,
pp. 109-118.
Spraul, M. et al., 1994, "Automatic reduction of NMR spectroscopic data for
statistical
and pattern recognition classification of samples," J. Pharm. Biomed. Anal.,
Vol.
12, pp. 1215-1225.
Stahle, L., and Wold, S., 1987, "Partial Least Squares Analysis with Cross-
Validation for
the Two-Class Problem: A Monte Carlo Study," Journal of Chemometrics, Vol. 1,
pp. 185-196.
Stoyanova, R., Kuesel, A.C., and Brown, T.R., 1995, "Application of principal-
component
analysis for NMR spectral quantitation," J. Maan. Reson. Series A, Vol. 115,
pp.265-269.
CA 02445101 2003-10-22
WO 02/086500 PCT/GB02/01854
- 131 -
Sugiyama Y., Kasahara T., Mukaida N., Matsushima K. and Kitamura S., 1995,
"Chemokines in bronchoalveolar lavage fluid in summer-type hypersensitivity
pneumonitis", European Respirator r~J,ournal, Vol. 8, pp 1084-1090.
Sun, J., 1997, "Statistical analysis of NIR data: data pretreatment," Journal
of
Chemometrics, Vol. 11, pp. 525-532.
Sze, D.Y., et al., 1994, "High-resolution proton NMR studies of lymphocyte
extracts,"
Immunomethods, Vol. 4, pp. 113-126.
Tomlins, A.M. et al., 1998, "High resolution magic angle spinning'H NMR
analysis of
intact prostatic hyperplastic and tumour tissues," Anal. Comm., Vol. 35, pp.
113-
115.
Tranter, G.E., et al., 1999, "Metabonomic prediction of drug toxicity via
probabilistic
neural network analysis of NMR biofluid data," Abstr. 9t" North American ISSX
Meeting, Oct 24-28, 1999, p. 246.
Volejnikova S., Laskari M., Marks jr. S.C., and Graves D.T., 1997, "Monocyte
recruitment
and expression of monocyte chemoattractant protein- 1 are developmentally
regulated in remodeling bone in the mouse", American Journal of Pathology, Vol
150, pp 1711-1721.
Wasserman, P.D., 1989, Neural Computing: Theory and Practice, (Van Nostrand,
ed.)
Reinhold, New York, USA.
Weber, O.M., Duc, C.O., Meier, D., and Boesiger, P., 1998, "Heuristic
optimization
algorithms applied to the quantification of spectroscopic data," Magn. Reson.
Med., Vol. 39, pp. 723-730.
Westerhuis, J. A., de Jong, S., Smilde, A. K., 2001, "Direct orthogonal signal
correction,"
Chemometrics and Intelligent Laboratory S sty ems, Vol. 56, pp. 13-25.
Wise, B. M., Gallagher, N. B., 2001,
http:/lwww.eigenvector.com/MATLAB/OSC.html.
Wold, H., 1966, in Multivariate Anal~is (P.R. Krishnaiah, Ed.) Academic Press,
Nevi
York.
Wold, S., 1976, "Pattern recognition by means of disjoint principal components
models,"
Pattern Recog., Vol. 8, pp. 127-139.
Wold, S., Antti, H., Lindgren, F., and Ohman, J., 1998a, "Orthogonal Signal
Correction of
Near-Infrared Spectra," Chemometrics and Intelligent Laboratory Systems, Vol.
44, pp. 175-185.
Wold, S., Kettaneh, N., Friden, H., and Holmberg, A., 1998b, "Modelling and
Diagnostics
of Batch Processes and Analogous Kinetic Experiments," Chemometrics and
Intelligent Laboratory Systems, Vol. 44, pp. 331-340.
CA 02445101 2003-10-22
WO 02/086500 PCT/GB02/01854
- 132 -
Yokode, M., Hammer, R.E., Ishibashi, S., Brown, M.S. & Goldstein, J.L., 1990,
"Diet-
induced hypercholesterolemia in mice: prevention by over-expression of LDL
receptors," Science, Vol. 250, pp. 1273-1275.
Zeyneloglu H.B., Seli E., Senturk L.M.,Gutierrez L.S.,Olive D.L. and Arici A.,
1998, "The
effect of monocyte chemotactic protein 1 in intraperitoneal adhesion formation
in
a mouse model", American Journal of Obstetrics and G~mecoloay, Vol. 179, pp
438-443.
Zheng M.H., Fan Y, Smith A, Wysocki S., Papadimitriou J.M., Wood D.J., 1998,
"Gene
expression of monocyte chemoattractant protein-1 in giant cell tumors of bone
osteoclastoma: possible involvement in cd68+ macrophage-like cell migration",
Journal of Cellular Biochemistry, Vol 70, pp 121-129.