Note: Descriptions are shown in the official language in which they were submitted.
CA 02445868 2003-10-10
WO 02/082990 PCT/US02/09469
SYSTEM FOR NON-INVASIVE MEASUREMENT OF
GLUCOSE IN HUMANS
Related Applications
This application is related to U.S. Patent Application Serial No. 09/832,586,
entitled "Illumination Device and Method for Spectroscopic Analysis"; U.S.
Patent
Application Serial No. 09/832,608, entitled "Optically Similar Reference
Samples and
Related Methods for Multivariate Calibration Models Used in Optical
Spectroscopy";
and U.S. Patent Application Serial No. 09/832,631, entitled "Encoded Variable
Filter
Spectrometer", all filed on the same date herewith and assigned to the
assignee of the
present application. The disclosure of each of these related applications is
hereby
incorporated by reference.
Tar~,nino~ Fia~r~
The present invention generally relates to a quantitative spectroscopy system
for measuring analyte concentrations or other attributes of tissue utilizing
non-
invasive techniques in combination with multivariate analysis. More
specifically, the
present invention relates to a quantitative near-infrared spectroscopy system,
incorporating multiple subsystems in combination, providing precision and
accuracy
to measure analytes such as glucose at clinically relevant levels in human
tissue.
Background of the Invention
The non-invasive measurement of substances in the human body by
quantitative spectroscopy has been found to be highly desirable, yet very
difficult to
accomplish. Non-invasive measurements via quantitative spectroscopy are
desirable
because they are painless, do not require a fluid draw from the body, carry
little risk
of contamination or infection, do not generate any hazardous waste and have
short
measurement times. A prime example of a desirable application of such
technology is
the non-invasive measurement of blood glucose levels in diabetic patients,
which
would greatly improve diabetes treatment. U.S. Patent No. 5,379,764 to Barnes
et al.
discloses the necessity for diabetics to frequently monitor blood glucose
levels. The
more frequent the blood glucose levels are measured, the less likely the
occurrence of
large swings in blood glucose levels. These large swings are associated with
the very
undesirable short-term symptoms and long-term complications of diabetes. Such
long-term complications include heart disease, arteriosclerosis, blindness,
stroke,
hypertension, kidney failure and premature death.
CA 02445868 2003-10-10
WO 02/082990 PCT/US02/09469
Several systems have been proposed for the non-invasive measurement of
blood glucose levels. These systems have included technologies incorporating
polarimetry, mid-infrared spectroscopy, Raman spectroscopy, Kromoscopy,
fluorescence spectroscopy, nuclear magnetic resonance spectroscopy, radio-
frequency
spectroscopy, ultrasound, transdermal measurements, photoacoustic spectroscopy
and
near-infrared spectroscopy. However, despite these efforts, direct and
invasive
measurements (e.g., blood sampling by a lancet cut into the finger) are still
necessary
for most, if not all, presently FDA approved and commercially available
glucose
monitors. Because invasive measurements are painful, inconvenient and costly
to the
diabetic patient, sufficiently frequent blood glucose measurement, which is
necessary
to ensure effective diabetes management, is rarely achieved.
Of particular interest to the present invention are prior art systems which
incorporate or generally utilize quantitative infrared spectroscopy as a
theoretical
basis for the analysis. In general, these methods involve probing glucose-
containing
tissue using infrared radiation in absorption or diffuse reflectance mode. It
is known
that glucose absorbs at multiple frequencies in both the mid- and near-
infrared range.
There are, however, other infrared active analytes in the tissue and blood
that also
absorb at similar frequencies. Due to the overlapping nature of these
absorption
bands, no single or specific frequency can be used for reliable non-invasive
glucose
measurement. Analysis of spectral data for glucose measurement thus requires
evaluation of many intensities over a wide spectral range to achieve the
sensitivity,
precision, accuracy, and reliability necessary for quantitative determination.
For example, Robinson et al. in U.S. Patent No. 4,975,581 disclose a method
and apparatus for measuring a characteristic of unknown value in a biological
sample
using infrared spectroscopy in conjunction with a multivariate model that is
empirically derived from a set of spectra of biological samples of known
characteristic values. The above-mentioned characteristic is generally the
concentration of an analyte, such as glucose, but also may be any chemical or
physical
property of the sample. The method of Robinson et al. involves a two-step
process
that includes both calibration and prediction steps.
In the calibration step, the infrared light is coupled to calibration samples
of
known characteristic values so that there is attenuation of at least several
wavelengths
of the infrared radiation as a function of the various components and analytes
-2-
CA 02445868 2003-10-10
WO 02/082990 PCT/US02/09469
comprising the sample with known characteristic value. The infrared light is
coupled
to the sample by passing the light through the sample or by reflecting the
light off the
sample. Absorption of the infrared light by the sample causes intensity
variations of
the light that are a function of the wavelength of the light. The resulting
intensity
variations at a minimum of several wavelengths are measured for the set of
calibration
samples of known characteristic values. Original or transformed intensity
variations
are then empirically related to the known characteristics of the calibration
samples
using multivariate algorithms to obtain a multivariate calibration model. The
model
preferably accounts for subject variability, instrument variability and
environment
t0 variability.
In the prediction step, the infrared light is coupled to a sample of unknown
characteristic value, and a multivariate calibration model is applied to the
original or
transformed intensity variations of the appropriate wavelengths of light
measured
from this unknown sample. The result of the prediction step is the estimated
value of
the characteristic of the unknown sample. The disclosure of Robinson et al. is
incorporated herein by reference.
A further method of building a calibration model and using such model for
prediction of analytes and/or attributes of tissue is disclosed in commonly
assigned
U.S. Patent No. 6,157,041 to Thomas et al., entitled "Method and Apparatus for
Tailoring Spectrographic Calibration Models," the disclosure of which is
incorporated
herein by reference.
In "Near- Infrared Spectroscopy for Non-invasive Monitoring of Metabolites",
Clinical Chemistry Lab Med 2000, 38(2): 137-145, 2000, Heise et al. disclose
the
non-invasive measurement of glucose in the inner lip of a subject utilizing a
Fourier
transform infrared (FTIR) spectrometer and a diffuse reflectance accessory.
The
instrument used for this measurement contained a tungsten light source with an
output
that was collimated and sent into a Bruker IFS-66 FTIR spectrometer. The FTIR
spectrometer modulated the light in a manner that created an interferogram and
the
collimated interferogram was sent to a diffuse reflectance accessory. The
diffuse
3o reflectance accessory was a bifurcated, Y-shaped fiber optic probe. The
input fibers
of the probe radiated the inner lip of a subject or a spectralon reference
standard with
the interferogram from the FTIR spectrometer. Light diffusely reflected from
the
inner lip was collected by the output fibers of the diffuse reflectance
accessory and
-3-
CA 02445868 2003-10-10
WO 02/082990 PCT/US02/09469
focused onto a liquid nitrogen cooled InSb detector. The optical
interferograms were
converted to an electrical signal by the InSb detector and the electrical
signal was
digitized by an analog-to-digital converter (ADC). The digitized interferogram
was
then converted into an NIR spectrum and a collection of these spectra and
corresponding blood glucose reference values were correlated using
multivariate
techniques to produce a calibration for non-invasive glucose measurements.
This
instrument was able to produce cross-validated, leave-one-out-at-a-time
glucose
standard error of predictions (SEP) of 36.4 mg/dl. This level of accuracy and
precision is not of clinical utility.
In "Near-Infrared Spectrometric Investigation of Pulsatile Blood Flow for
Non-Invasive Metabolite Monitoring", CP430, Fourier Transform Spectroscopy: l
ltn
International Conference, 1998, Heise et al. discuss the non-invasive
measurement of
glucose in the inner lip of a subject using multivariate analysis of spectra
with
pulsatile blood flow. Heise et al. assert that by taking the difference
between the
systolic and diastolic portions of the cardiac cycle, interferences can be
removed and
glucose predictions are done on the spectra due to the additional blood
volume. The
optical pathlength due to the additional blood volume is 50 to 70 times
shorter than an
integrated NIR measurement, resulting in a dramatically reduced glucose signal-
to
noise ratio (SNR). Heise used the instrument described in the preceding
paragraph to
make his measurements. No glucose prediction results were disclosed.
In "Spectroscopic and Clinical Aspects of Non-invasive Glucose
Measurements", Clinical Chemistry, 45:2, 165-177, 1999, Khalil gives an
overview of
non-invasive glucose monitoring techniques. Khalil covers NIR transmission and
reflectance, mechanical manipulation of the tissue coupled with NIR
spectroscopy,
Kromoscopy, spatially resolved diffuse reflectance, frequency domain
measurements,
polarimehy measurements, Raman spectroscopy and photo-acoustic methods.
In U.S. Patent No. 5,361,758, Hall et al. describe a method and apparatus for
the non-invasive measurement of glucose. This device is composed of a
broadband
light source, transfer optics from the light source to the sampling accessory,
a tissue
sampling accessory, transfer optics from the tissue sampling accessory to a
dispersive
spectrometer whose main optical elements are a diffraction grating and a
linear array
detector and finally processing and display subsystems. Hall et al. disclose
taking the
second derivative of the NIR absorbance spectrum collected by the above
instrument
-4-
CA 02445868 2003-10-10
WO 02/082990 PCT/US02/09469
and applying a calibration model to the second derivative of the absorbance
spectrum
to predict glucose concentrations.
In U.S. Patent No. 5,743,262, Lepper, Jr. et al. describe a method and
apparatus for the non-invasive measurement of glucose. This device is composed
of a
broadband light source, a collimating optic for the light source, an optical
filter for
modulating the output of the light source, a tissue sampling accessory, a
photodetector, a data acquisition subsystem and a signal processing subsystem.
The
optical filter passes select wavelengths of light from the broadband source in
a given
time interval. The selected wavelength of light is sent into the tissue-
sampling
accessory to irradiate the tissue. Light collected from the tissue is focused
onto a
detector, and the electrical signal output from the detector is digitized by
an analog-to-
digital converter. The signal processing subsystem takes a "double log"
transformation of the signal and then uses the result to predict glucose
concentrations.
In U.S. Patent No. 5,750,994, Schlager describes a method and apparatus for
non-invasive measurement of glucose in the NIR range using optical transfer
cells that
have positive correlation filters that are selective for the analyte of
interest. This
apparatus includes a dispersive spectrometer along with a broadband light
source, a
tissue-sampling accessory, a detector or linear array detector and a data
acquisition
subsystem.
2o In U.S. Patent No. 5,830,112, Robinson describes a general method of robust
sampling of tissue for non-invasive analyte measurement. The sampling method
utilizes a tissue-sampling accessory that is pathlength optimized by spectral
region for
measuring an analyte such as glucose. The patent discloses several types of
spectrometers for measuring the spectrum of the tissue from 400 to 2500 nm,
including acousto-optical tunable filters, discrete wavelength spectrometers,
filters,
grating spectrometers and FTIR spectrometers. The disclosure of Robinson is
incorporated hereby reference.
In U.S. Patent No. 6,016,435, Maruo et al. describe an apparatus for the non
invasive measurement of glucose. This device uses a broadband light source
coupled
to a stepped grating monochrometer to generate successive wavelengths of light
in the
NIR spectral region. The output of the monochrometer is sent to an optical
fiber
bundle that samples the tissue of a subject. The optical fiber bundle radiates
the skin
with the light from the monochrometer and collects diffusely reflected light
from the
-5-
CA 02445868 2003-10-10
WO 02/082990 PCT/US02/09469
skin of the subject. The collected diffuse reflectance spectrum is sent to a
detector
and the electrical signal from the detector is digitized. An absorbance
spectrum is
generated from the digitized output of the detector and that diffuse
reflectance
spectrum is used to make a prediction of glucose concentration.
In U.S. Patent No. 6,026,314, Amerov et al. describe a method and apparatus
for the non-invasive measurement of glucose that utilizes pulsed, discrete
wavelengths of light in the NIR spectral region. The pulsed light source may
be a
flash lamp, light emitting diodes or laser diodes. The output of the pulsed
light source
is coupled to a tissue-sampling accessory that utilizes prisms or fiber optics
to
irradiate the tissue and collect absorbance spectra from the tissue. The
output of the
sampling accessory is sent to one or more detectors which convert the optical
signal to
an electrical signal. The electrical signals from the detectors are amplified
and
undergo analog-to-digital conversion. The digitized signals are then
processed, and
an algorithm is applied to predict glucose concentration.
In U.S. Patent No. 6,049,727, Crothall describes an implanted glucose sensing
system that measures glucose in vivo and is meant to couple to an insulin pump
to
create an artificial pancreas. The implanted sensor uses a number of discrete
wavelengths which irradiate a blood vessel. The light is absorbed and
scattered by the
blood and tissue in the optical path between the light sources and the
detector. The
detected light is converted from an optical signal to an electrical signal,
and then
digitized by an analog-to-digital converter. The digitized signal is sent to a
radio
frequency transceiver which communicates with an external processing system to
apply an algorithm to the digitized absorbance spectrum to calculate glucose
concentration. The resulting glucose concentration information is utilized to
control
the administration of insulin to the subject by an insulin pump. This closed
loop
system is meant to create an artificial pancreas for insulin dependent
diabetics.
In U.S. Patent No. 6,061,582, Small et al. describe a method and apparatus for
non-invasive determination of glucose. The apparatus for the measurement
includes a
broadband light source, an FTIR spectrometer, tissue sampling accessory, a
detector
and data acquisition system and a processing system. The spectra collected
from the
subject are digitally filtered to isolate a portion of the spectrum due to the
glucose
signal. Multivariate analysis techniques are then applied to the digitally
filtered
spectrum to generate a glucose prediction. The tissue-sampling accessory can
collect
-6-
CA 02445868 2003-10-10
WO 02/082990 PCT/US02/09469
spectra from the subject using transmission or diffuse reflectance.
In PCT Application, WO 99/43255, Small et al. describe a non-invasive
glucose monitoring apparatus and method that measures glucose by transmission
of
NIR light through the tongue of a subject. The apparatus for the measurement
includes a broadband light source, an FTIR spectrometer, tissue sampling
accessory, a
detector and data acquisition system and a processing system. The prediction
results
presented in this application do not achieve the levels of precision and
accuracy
necessary for clinical application.
In "New Approach to High-Precision Fourier Transform Spectrometer
Design", Applied Optics, 35:16, 2891-2895, 1996, Brault introduces a constant
time
sampling analog-to-digital conversion technique for FTIR spectrometers that
allows
use of high dynamic range delta-sigma ADCs. Brault asserts their approach
provides
a superior technique for implementing the data acquisition system of an FTIR
spectrometer because it avoids the artifacts of gain ranging and the need to
precisely
match the time delays between the laser reference and infrared measurement
channels.
In "Uniform Time-Sampling Fourier Transform Spectroscopy", Applied Optics,
36:1-
2206-2210, 1997, Brasunas et al. discuss a variation of Brault's constant time
sampling analog-to-digital conversion technique for FTIR spectrometers.
In U.S. Patent No. 5,914,780, Turner et al. describe a method of digitizing
the
interferogram of an FTIR spectrometer using a constant time sampling analog-to-
digital converter. The constant time sampling technique allows the use of high
dynamic range, delta-sigma analog-to-digital converters that obviate the need
for gain
ranging circuitry and precisely matched delays between the reference laser and
infrared signals. This type of data acquisition system is asserted to provide
the FTIR
spectrometer with higher SNR and superior photometric accuracy when compared
to
the previously employed sampling technique which is triggered by the zero
crossings
of the reference laser.
Although there has been substantial work conducted in attempting to produce
a commercially viable non-invasive near-infrared spectroscopy-based glucose
monitor, no such device is presently available. It is believed that prior art
systems
discussed above have failed for one or more reasons to fully meet the
challenges
imposed by the spectral characteristics of tissue which make the design of a
non-
invasive measurement system a formidable task. Thus, there is a substantial
need for
_7_
CA 02445868 2003-10-10
WO 02/082990 PCT/US02/09469
a commercially viable device which incorporates subsystems and methods with
sufficient accuracy and precision to make clinically relevant measurements of
analytes, such as glucose, in human tissue.
Summary of the Invention
The present invention is directed to an apparatus and method for the non-
invasive measurement of glucose in human tissue by quantitative infrared
spectroscopy to clinically relevant levels of precision and accuracy. A
clinically
relevant level of precision and accuracy is defined as the measurement of
glucose
concentration in humans to a level of precision and accuracy such that a
patient can
base insulin dosing and/or diet modification on the glucose concentration
measurement made by the noninvasive device. In addition, the noninvasive
measurement has sufficient accuracy and precision such that either hypo-
glycemia or
hyper-glycemia can be diagnosed.
A Clark Error Grid provides a means to measure the clinical relevance of
measurements on a system as compared to a reference measurement for
measurements made over a period of time. With the present system acceptable,
preferred and ideal Clark Error Grid data have been defined, each providing
clinically
relevant glucose measurements. An acceptable system includes a plot with 72%
or
greater in Region A, 24% or less in Region B. 1% or less in Region C, 3% or
less in
Region D and about 0% in Region E. A preferred system includes a plot with 85%
or
greater in Region A, 14.4% or less in Region B, 0.1% or less in Region C, 0.5%
or
less in Region D and about 0% in Region E. An ideal system includes a plot
with
98.5% or greater in Region A, 1.5% or less in Region B and about 0% in Regions
C,
D and E. In one preferred system of the present invention, 80% or more
predictions
on a single subject within a physiological range of glucose fall in Region A
of a Clark
Error Grid. In this embodiment, it is also preferred that 18.5% or less fall
in Region
B, about 0% in Region C, 1.5% or less in Region D and about 0% in Region E.
If glucose concentration measurements are taken in a more continuous manner
instead of several discrete measurements per day, the requirements for
accuracy and
precision can be relaxed and still maintain clinical relevance. It is
recognized that the
minimum threshold for percentage of measurements in each of the regions of the
Clark Error Grid can depend on the peculiarities of the way the noninvasive
measurement is taken, differences between individual subjects and/or other
_g_
CA 02445868 2003-10-10
WO 02/082990 PCT/US02/09469
circumstances. The preferred standard for the noninvasive glucose measurement
of
the present invention is that it must allow the user to effectively maintain
glycemic
control and avoid either hypo-glycemic or hyper-glycemic conditions.
The present system overcomes the challenges posed by the spectral
characteristics of tissue by incorporating a design which includes, in
preferred
embodiments, six highly optimized subsystems. The design contends with the
complexities of the tissue spectrum, high signal-to-noise ratio and
photometric
accuracy requirements, tissue sampling errors, calibration maintenance
problems,
calibration transfer problems plus a host of other issues. The six subsystems
include
an illumination subsystem, a tissue sampling subsystem, a calibration
maintenance
subsystem, an FTIR spectrometer subsystem, a data acquisition subsystem, and a
computing subsystem.
The present invention further includes apparatus and methods which allow for
implementation and integration of each of these subsystems in order to ensure
that the
glucose net analyte signal-to-noise ratio is preserved to the maximum amount.
The
glucose net analyte signal is the portion of the near-infrared spectrum that
is specific
for glucose concentration levels because it is orthogonal to all other sources
of
spectral variance. The orthogonal nature of the glucose net analyte signal
makes it
perpendicular to the space defined by any interfering species and as a result,
the net
analyte signal is uncorrelated to these sources of variance. The glucose net
analyte
signal-to-noise ratio is directly related to the accuracy and precision of the
present
invention for non-invasive measurement of glucose by quantitative near-
infrared
spectroscopy.
The present invention preferably utilizes near-infrared radiation for
analysis.
Applicants have found that radiation in the wavelength range of 1.2 to 2.5
microns (or
frequency range of 8000 to 4000 cm') is of prime interest for making the
present non-
invasive measurements because such radiation has acceptable specificity for a
number
of analytes, including glucose, along with tissue optical penetration depths
of up to 5
millimeters with acceptable absorbance characteristics. In the 1.2 to 2.5
micron
spectral region, the large number of optically active substances that make up
the tissue
complicate the measurement of any given substance due to the overlapped nature
of
their absorbance spectra. Applicants have utilized herein multivariate
analysis
techniques which are believed required to resolve these overlapped spectra
such that
-9-
CA 02445868 2003-10-10
WO 02/082990 PCT/US02/09469
accurate measurements of the substance of interest can be achieved. Use of
multivariate analysis techniques, however, also requires the maintenance and
transfer
of multivariate calibrations, which techniques Applicants have developed in
order to
accurately measure analytes, especially when trying to measure these analytes
as
weak absorbers found in the presence of much stronger absorbers, such as
water.
A typical prior art non-invasive measurement system will have an illumination
subsystem which generates the near-infrared light, a tissue sampling accessory
which
irradiates and collects light from the tissue, a spectrometer, a data
acquisition
subsystem, a reference device for calibration maintenance and a processing
unit.
Each of these subsystems has significant influence on the accuracy of the non-
invasive measurement. The present invention documents a multidisciplinary
approach to the design of the present instrument which incorporates an
understanding
of the instrument subsystems, tissue physiology, multivariate analysis, near-
infrared
spectroscopy and overall system operation. Further, the interactions between
the
subsystems have been analyzed so that the behavior and requirements for the
entire
non-invasive measurement device are well understood and result in a design for
a
commercial instrument that will make non-invasive measurements with sufficient
accuracy and precision at a price and size that is commercially viable.
The subsystems of the non-invasive glucose monitor are highly optimized to
2o provide reproducible and, preferably, uniform radiance of the tissue, low
tissue
sampling error, depth targeting of the glucose-bearing layers of the tissue,
efficient
collection of diffuse reflectance spectra from the tissue, high optical
throughput, high
photometric accuracy, large dynamic range, excellent thermal stability,
effective
calibration maintenance, effective calibration transfer, built-in quality
control and
ease-of use. All of these factors have been considered as important to
maximize the
glucose net analyte signal-to-noise ratio and provide clinically relevant
levels of
prediction accuracy and precision for the administration of insulin therapy
and other
therapies related to the detection and management of diabetes. The present
invention
has been found to provide clinically relevant levels of glucose prediction and
accuracy
over a minimum of two months for a diverse subject population. With the
present
system, the overall standard error of prediction for 40 subjects over a 7-week
validation study was 21.7 mg/dl. Further, as shown in Figure 56, 83.5% of the
data
was within section "A" of a Clark Error Grid, 15.4% in section "B", 0% in
section
-10-
CA 02445868 2003-10-10
WO 02/082990 PCT/US02/09469
"C", 1.1 % in section "D" and 0% in section "E".
Brief Description of the Drawings
Figure 1 is a schematic depiction of a non-invasive spectrometer system
incorporating the subsystems of the present invention;
Figure 2 is a detailed perspective view of an infrared radiation source lamp
known in the art;
Figure 3 is a diagramed view of a system for measuring the concentration of
an analyte within biological tissue;
Figure 4a is an incidence plot using a ray trace program simulating the
spatial
distribution of emitted radiation from an infrared spectrophotometer known in
the art;
Figure 4b is an incidence plot showing the changes in spatial distribution of
emitted radiation after a 90-degree rotation of the filament used in producing
the
incidence plot of Figure 4a;
Figure 4c is an incidence plot showing the changes in spatial distribution of
emitted radiation after a one-millimeter vertical translation of the filament
used in
producing the incidence plot of Figure 4a;
Figure Sa is an intensity plot using a ray trace program simulating the
angular
distribution of emitted radiation from an infrared spectrophotometer known in
the art;
Figure Sb is an intensity plot showing the changes in angular distribution of
emitted radiation after a 90-degree rotation of the filament used in producing
the
intensity plot of Figure Sa;
Figure Sc is an intensity plot showing the changes in angular distribution of
emitted radiation after a one-millimeter vertical translation of the filament
used in
producing the intensity plot of Figure Sa;
Figure 6 is a diagramed view of a system for constructing a chemometric
model for measuring glucose concentration in the forearm's of various
subjects;
Figure 7 is a box and whisker plot of prediction error versus day across five
lamp changes using the system illustrated in Figure 6;
Figure 8 is a box and whisker plot of in-vivo prediction errors versus
orientation for a lamp within a system illustrated in Figure 6;
Figure 9 is a diagramed view of a system used for cross-validation analysis
for
baseline system performance using a tissue phantom for the sample source;
Figure 10a is a box and whisker plot of cross-validated prediction errors for
-11-
CA 02445868 2003-10-10
WO 02/082990 PCT/US02/09469
the system illustrated in Figure 9, in the absence of a lamp change;
Figure lOb is a box and whisker plot of cross-validated prediction errors for
the system illustrated in Figure 9, with the inclusion of lamp changes;
Figure 11 is a diagramed view of a system of the present invention using a
means for spatially and angularly homogenizing emitted radiation;
Figure 12a and Figure 12b are depicted as a perspective and a plan view of a
light pipe of the present invention;
Figure 13 is a plan view of a ray trace showing radiation focused by an
elliptical reflector into and through a light pipe of the present invention;
l0 Figure 14a is an incidence plot using a ray trace program simulating the
spatial
distribution of emitted radiation from an infrared spectrophotometer using a
light pipe
of the present invention;
Figure 14b is an incidence plot showing the changes in spatial distribution of
emitted radiation after a 90-degree rotation of the filament used in producing
the
incidence plot of Figure 14a;
Figure 14c is an incidence plot showing the changes in spatial distribution of
emitted radiation after a one-millimeter vertical translation of the filament
used in
producing the incidence plot of Figure 14a;
Figure 15a is an intensity plot using a ray trace program simulating the
angular
distribution of emitted radiation from an infrared spectrophotometer using a
light pipe
of the present invention;
Figure 15b is an intensity plot showing the changes in angular distribution of
emitted radiation after a 90-degree rotation of the filament used in producing
the
intensity plot of Figure 15a;
Figure 15c is an intensity plot showing the changes in angular distribution of
emitted radiation after a one-millimeter vertical translation of the filament
used in
producing the intensity plot of Figure 15a;
Figure 16 is a schematic plan view of an alternative source and light pipe
system of the present invention;
Figure 17 is an incidence plot depicting homogenization of the light at the
distal end of the light pipe of Figure 16;
Figure 18 is an intensity plot showing the homogenization of light emitted
from the light pipe of Figure 16;
-12-
CA 02445868 2003-10-10
WO 02/082990 PCT/US02/09469
Figure 19 is a schematic plan view of an alternative illumination source
incorporating parabolic reflectors and a light pipe;
Figure 20 is an incidance plot depicting spatial homogenization of the light;
Figure 21 is a plot of intensity showing the homogenization of light by the
source in Figure 19;
Figure 22 is a schematic perspective view of an alternative illumination
source
incorporating faceted reflectors;
Figure 23 depicts spatial distribution of the light showing spatial
homogenization achieved through the system of Figure 22;
Figure 24 is a plot of angular distribution produced by the device of Figure
22;
Figure 25 is a diagramed view of a system of the present invention for
measuring glucose in scattering media having a tissue phantom as the sample
source;
Figure 26a is a box and whisker plot of a standard system with no bulb
changes;
Figure 26b is a box and whisker plot of a standard system across four bulb
changes;
Figure 26c is a box and whisker plot of a system using an s-bend light pipe
across four bulb changes;
Figure 26d is a box and whisker plot of a system using a ground glass diffuser
2o plus and s-bend light pipe across four bulb changes;
Figure 27 is a diagrammed view of a system incorporating filters prior to the
light pipe which eliminate unwanted wavelengths of radiation from the
illumination
source;
Figure 28 graphically depicts the transmittance of selected wavelengths in a
preferred fingerprint region;
Figure 29 is a perspective view of elements of a preferred tissue sampling
subsystem;
Figure 30 is a plan view of the sampling surface of the tissue sampling
subsystem of Figure 29, showing a preferred arrangement of input and output
optical
fiber ends;
Figure 31 is a perspective view of a preferred ergonomic apparatus for holding
the sampling surface and positioning a tissue surface thereon;
Figure 32 is a simplified schematic view of an FTIR spectrometer utilized in a
-13-
CA 02445868 2003-10-10
WO 02/082990 PCT/US02/09469
subsystem of the present invention;
Figure 33 depicts a typical interferogram created by the spectrometer of
Figure 32;
Figure 34 shows two graphs of spectral residuals comparing a conventional air
background to a similar background;
Figure 35 shows a graph of standard error of prediction comparing no
background, a conventional air background, and a similar background in the
presence
of instrument and environmental variation;
Figure 36 shows a graph of the spectral differences between the mean human
tissue spectrum and two different backgrounds, namely a conventional air
background
and a similar background;
Figure 37 is a flowchart illustrating the steps used in quantifying spectral
similarity;
Figures 38 and 39 illustrate a cone background device in accordance with an
embodiment of the present invention, wherein Figure 38 illustrates a ray-trace
of the
cone background device and Figure 39 illustrates a partial cut-away view of
the cone
background device;
Figure 40 shows a graph of spectral response demonstrating the spectral match
between the tissue sample and the cone background;
Figure 41 schematically illustrates a scattering solution background in
accordance with an embodiment of the present invention;
Figure 42 shows a graph of spectral response demonstrating the spectral match
between the tissue sample and the scattering solution background;
Figure 43 schematically illustrates a roof background in accordance with an
embodiment of the present invention;
Figure 44 schematically illustrates an alternative roof background as
positioned on a fiber optic sampling array;
Figure 45 shows a graph of spectral response demonstrating the spectral match
between the tissue sample and the roof background;
3o Figure 46 schematically illustrates a mufti-layer background in accordance
with an embodiment of the present invention;
Figure 47 shows a graph of spectral response demonstrating the spectral match
between the tissue sample and the mufti-layered background;
-14-
CA 02445868 2003-10-10
WO 02/082990 PCT/US02/09469
Figure 48 schematically illustrates a transmission cell background in
accordance with an embodiment of the present invention;
Figure 49 shows a graph of spectral response demonstrating the spectral match
between the tissue sample and the transmission cell background;
Figure 50 schematically illustrates a variable height temporal background in
accordance with an embodiment of the present invention;
Figure 51 shows a graph of spectral response demonstrating the spectral match
between the tissue sample and the variable height temporal background;
Figure 52 schematically illustrates a collagen gel matrix background in
t 0 accordance with an embodiment of the present invention;
Figure 53 shows a graph of spectral response demonstrating the spectral match
between the tissue sample and the collagen gel matrix background;
Figure 54 schematically illustrates an animal tissue (bovine) background in
accordance with an embodiment of the present invention;
Figure 55 shows a graph of spectral response demonstrating the spectral match
between the tissue sample and the bovine tissue background;
Figure 56 is a Clark Error Grid which graphically depicts experimental results
showing the ability of the system of the present invention to derive
clinically relevant
glucose measurements in tissue on numerous subjects over two months; and
Figure 57 is a graphical depiction of the concept of net analyte signal in a
three-component system. .
Detailed Description of the Preferred Embodiments
The following detailed description should be read with reference to the
drawings in which similar elements in different drawings are numbered the
same.
The drawings, which are not necessarily to scale, depict illustrative
embodiments that
are not intended to limit the scope of the invention.
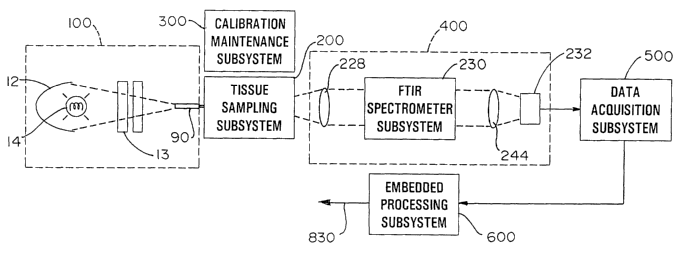
Referring now to Figure 1, a non-invasive glucose monitor system that is able
to achieve clinically relevant levels of accuracy and precision is depicted in
schematic
view. The overall system includes six subsystems. The subsystems include an
illumination subsystem 100, a tissue sampling subsystem 200, a calibration
maintenance subsystem 300, an FTIR spectrometer subsystem 400, a data
acquisition
subsystem 500 and an embedded processing subsystem 600. The subsystems have
been designed and carefully integrated in order to ensure that the glucose net
analyte
-15-
CA 02445868 2003-10-10
WO 02/082990 PCT/US02/09469
signal-to-noise ratio is preserved to the maximum amount. The glucose net
analyte
signal is the portion of the near-infrared spectrum that is specific for
glucose
concentration levels because it is orthogonal to other sources of spectral
variance.
The glucose net analyte signal-to-noise ratio is directly related to the
accuracy and
precision of the non-invasive measurement of glucose by quantitative near-
infrared
spectroscopy with the present invention.
The subsystems provide reproducible and preferably uniform radiance of the
tissue, low tissue sampling error, depth targeting of the glucose-bearing
layers of the
tissue, efficient collection of diffuse reflectance spectra from the tissue,
high optical
throughput, high photometric accuracy, large dynamic range, excellent thermal
stability, effective calibration maintenance, effective calibration transfer,
built-in
quality control and ease-of use. Each of these factors are optimized to
maximize the
glucose net analyte signal-to-noise ratio which results in clinically relevant
levels of
glucose prediction accuracy for insulin therapy. Each of the subsystems is
discussed
below in detail followed by experimental evidence documenting that a preferred
embodiment of the present system provides clinically relevant levels of
precision and
accuracy in glucose analysis in tissue.
The illumination subsystem 100 generates the near-infrared (NIR) light used
to interrogate the tissue of a human for the non-invasive measurement of
glucose.
The illumination subsystem, in an exemplary embodiment, contains a broadband,
polychromatic light source 14 that emits radiation in the NIR portion of the
spectrum.
The light source 14 may emit radiation outside of the NIR, also. An example of
a
suitable light source 14 would be a 40-watt, 22.8-volt tungsten filament lamp.
The
light source 14 is typically driven by a tightly regulated power supply. The
power
supply may supply the lamp with constant current, constant voltage or constant
power. The power supply for the light source should provide tight regulation
of
current, voltage or power to keep the color temperature and emissivity of the
light
source as stable as possible. Fluctuations of the light source's color
temperature and
emissivity are a source of noise in the non-invasive glucose measurement and
can
reduce the net analyte SNR and, subsequently, the accuracy and precision of
the
measurement. In preferred embodiments, the overall system of the present
invention
includes a power supply which provides regulated, low noise power to all of
the
subsystems. The power supply is preferably a 300-watt, quad output, resonant
power,
-16-
CA 02445868 2003-10-10
WO 02/082990 PCT/US02/09469
medical grade, AC power to DC converter that provides output voltages of +28,
+15,
-15, and +5 VDC. The ripple on each of the voltages is less than 20 millivolts
peak-
to-peak and the switching frequency of the supply is greater than 200
kilohertz to
facilitate additional filtering of the power and to further reduce noise.
Additionally,
the power supply has a conversion efficiency of at least 80% which is
important to
reduce the thermal loading of the non-invasive monitor to the point that only
convection cooling is required for normal device operation. The illumination
subsystem 100 utilizes the 28 VDC power from the power supply to drive the
light
source. A DC-to-DC converter tightly regulates the input power down to 21.4
VDC
and also provides a soft start function that gradually turns on the light
source when the
non-invasive glucose monitor is first turned on. The soft start function
extends the
useful life of the light source by eliminating startup transients and limiting
the current
required to initially power the light source.
In addition to the light source and regulated power supply, the illumination
t 5 subsystem will contain optical elements 12,13,90 that collect the
radiation from the
light source and transfer that light to the input of the tissue sampling
subsystem. The
elements that makeup the transfer optics may include collimating and/or
condensing
optics, optical filters, optical diffusers, a homogenizer or light pipe for
scrambling and
the corresponding mechanical components to hold the optics and light source.
The collimating optics may be refractive or reflective elements. An example
of a refractive collimating optic would be a lens. An example of a reflective
collimating optic would be a parabolic mirror. The condensing optics may also
be
refractive or reflective. An example of a refractive condensing optic would be
a lens.
An example of a reflective condensing optic would be an elliptical mirror. The
materials for lenses and mirrors are well known in the art. The reflective
optics may
have a smooth finish, a rough finish or a faceted finish depending on the
configuration
of the illumination subsystem. The purpose of the rough or faceted finishes
for the
reflective optics is to destroy the coherence of the light source image to
create a more
uniform radiance pattern. The refractive optics can be spherical or
aspherical. The
Fresnel lens is a special type of aspherical lens that also may be employed.
The
purpose of the collimating and/or condensing optics is to collect radiation
from the
source and transfer the radiation to the input of the tissue sampling
subsystem 200 or
to other optical elements that perform additional operations on the light
before it is
-17-
CA 02445868 2003-10-10
WO 02/082990 PCT/US02/09469
passed to the tissue sampling subsystem 200.
One or more optical filters 13 may be employed to preferentially pass
radiation only in the spectral region of interest. The optical filter may be
one or a
combination of long pass, short pass, or band pass filters. These filters can
be
absorptive, interference or dichroic in nature. In some embodiments, the
optical
filters are anti-reflection coated to preserve the transmittance of light in
the spectral
region of interest. These filters may also perform spectral shaping of the
radiation
from the light source to emphasize certain portions of the NIR spectrum over
others.
The optical filtering is typically done to bandlimit the radiation impinging
on the
tissue to increase the SNR in the region of interest and to keep from burning
or
otherwise damaging the tissue of the subject. Bandlimiting the radiation
improves the
effective SNR by reducing detector Shot noise that results from unwanted
radiation
outside the spectral region of interest.
The purpose of the optical diffusers 13 and scramblers 90 in the illumination
subsystem is to provide reproducible and, preferably, uniform radiance at the
input of
the tissue sampling subsystem 200. It has been found that uniform radiance is
necessary to ensure good photometric accuracy and even illumination of the
tissue.
Uniform radiance is also necessary to reduce errors associated with
manufacturing
differences between light sources. Uniform radiance is utilized in the present
2o invention for achieving accurate and precise non-invasive glucose
measurements.
An example of an optical diffuser is a ground glass plate. The ground surface
of the plate effectively scrambles the angle of the radiation emanating from
the light
source and its transfer optics. A light pipe is used to scramble the intensity
of the
radiation such that the intensity is uniform at the output of the light pipe.
In addition,
light pipes with a double bend will scramble the angles of the radiation. For
creation
of uniform intensity and angular distribution, the cross section of the light
pipe should
not be circular. Square, hexagonal and octagonal cross sections are effective
scrambling geometries. The output of the light pipe may directly couple to the
input
of the tissue sampler or may be used in conjunction with additional transfer
optics
before the light is sent to the tissue sampler. Exemplary illumination
subsystems are
disclosed below and in commonly assigned U.S. Patent Application Serial No.
09/832,586, filed on the same date herewith and entitled "Illumination Device
and
Method for Spectroscopic Analysis", the disclosure of which is incorporated
herein by
-18-
CA 02445868 2003-10-10
WO 02/082990 PCT/US02/09469
reference.
Figure 2 shows a plan view of an infrared radiation source lamp 14 known in
the art. The appearance of a radiant source lamp 14 closely resembles that of
a
traditional residential light bulb. Traditional spectrophotometer lamps
consist of a
filament 16 housed within a transparent envelope 18, or the like. The
transparent
envelope 18 is either comprised of a silicate glass, fused silica or quartz
material. The
material used for the glass envelope 18 is dependent upon the wavelength
regions
being surveyed on the electromagnetic spectrum.
The envelope 18 traditionally is cylindrical or oval in shape. The lamp 14 of
t 0 Figure 2 specifically is of a closed-end cylindrical variety. The closed-
end portion of
the cylinder has a nipple 20 positioned near the center of the cylinder's
closed-end
base. The nipple 20 formation is a result of manufacturing and functionally
has no
beneficial purpose. On the other hand, the nipple 20, as will be discussed in
detail
later, affects the emission of radiant energy.
Filament 16, and subsequently lamp choice, is wavelength dependent.
Operating in the infrared and near infrared regions of the electromagnetic
spectrum
requires a radiation source filament 16 applicable to those spectral regions.
Several
continuous radiation sources including tungsten-halogen lamps, tungsten lamps,
nerst
glowers, nichrome wires and globars are suitable for infrared molecular
absorption
spectroscopy. The desired filament is manufactured so as to place the filament
16
within the open end of the glass envelope 18 and securely fastened thereto.
Wires or
leads 22 emerge from the filament 16 and out of the glass envelope 18
attaching the
filament 16 to an energy source (not shown). Because the energy output of a
filament
16 generally varies approximately with the operating voltage, close voltage
control is
essential. For this reason, most lamps 14 are attached through the wires or
leads 22 to
a constant-voltage transformer or electronic voltage regulator.
The basic illumination source depicted in Figure 2 further includes an
elliptical reflector 12 which focuses emitted light from bulb 14 to a
reflector focus 26.
Representative rays 24 are depicted to show the function of the reflector 12.
The
relationship between the radiant source emitter 14 and the elliptical
reflector 12 was
used in the subsequently disclosed experiments.
Referring now to Figure 3, a diagramed view of a system 10 for measuring the
concentration of an analyte within biological tissue is depicted. The system
10
-19-
CA 02445868 2003-10-10
WO 02/082990 PCT/US02/09469
depicted is simplified by illustrating certain specific elements within a far
more
elaborate spectroscopic system. The elements depicted in Figure 3, however,
are
common to spectroscopic systems, and therefore, require some identification.
An elliptical reflector 12 known in the art is shown. At the center of the
elliptical reflector 12 is radiation source lamp 14. The radiation source lamp
14 is
depicted as having a filament 16, a glass envelope 18 with nipple 20 housing
the
filament 16, and a pair of leads 22 extending from the end of the lamp.
Surrounding a
portion of the lamp 14 is the body of the reflector 12. The elliptical
reflector 12
functions to concentrate emitted radiation rays 24 (shown as a ray trace) from
the
t 0 radiation source lamp 14 onto the reflector's focal point 26. In order to
maximize
reflectance, the elliptical reflector 12 is generally made from a highly
polished metal.
Although Figure 3 specifically illustrates an elliptical reflector, other
shapes suitable
for focusing radiant energy are also within the scope of the invention.
Figure 3 depicts two fiber optic bundles, an illumination fiber bundle 30 and
a
collection fiber bundle 32. Fiber optic bundles 30 and 32 are extremely
versatile
because they are capable of channeling harnessed radiation between elements
without
noticeable reduction in the intensity of that harnessed radiation.
At the reflector's focal point 26 is an opening to the illumination fiber
bundle
30. The illumination fiber bundle 30 collects the radiation emitted 24 by the
lamp 14
and channels the radiation through the bundle system. At the output end of the
illumination fiber bundle 30 is another opening that then directs the
harnessed
radiation onto a sample 40, such as human tissue on a person's forearm. The
second
fiber optic bundle, the collection fiber bundle 32, is positioned proximate to
the
sample 40 to again collect radiation, however, here the radiation is diffusely
reflected
from the sample 40.
Diffusely reflected radiation is that radiation reflected from within the
sample
40. Diffusely reflected radiation does not generally follow a uniform pattern.
Ray
tracing of the diffusely reflected radiation within the sample 40 as shown in
Figure 3
illustrates possible pathways of radiation entering, and subsequently
reflecting out of,
the
sample 40.
The collection fiber bundle 32 then channels the diffusely reflected radiation
from the sample 40 to the FTIR spectrometer subsystem 400 (see Figure 1 ). In
Figure
-20-
CA 02445868 2003-10-10
WO 02/082990 PCT/US02/09469
3, the FTIR spectrometer subsystem is shown simply as spectrophotometer 44 and
is
where the radiation is detected by converting the recaptured radiant energy
into a
measurable signal. In a preferred embodiment of the invention, an FTIR
spectrophotometer is utilized to analyze the diffusely reflected radiant
energy emitted
by the sample 40. The output optical signal from the FTIR is focused on a
photodetector which converts the optical signal to an electrical signal that
is then
transferred to the data acquisition subsystem 500 (see Figure 1) which
includes a
signal processor. Processing of the signal is generally accomplished using a
computer
or other data processing means 46 designed for such processing. The outcome of
the
processing is then transcribed to a readout, allowing practitioners to study
the results
of the analysis.
As described in detail above, in spectrophotometer instruments where shot
noise predominates the system, as is in the system depicted in Figure 3, the
signal-to-
noise ratio (SNR) for the system is directly proportional to the square root
of the flux
( ~ ) on the photodetector. The SNR for the system, however, can be improved
by
maximizing the amount of radiation incident on the detector. Increasing the
flux on
the detector generally necessitates increasing the incidance, and thus, may
cause
thermal damage on the sampled biological tissue 40. To illustrate this tissue-
heating
problem, experiments were conducted utilizing the system illustrated in Figure
3. For
the experiment, the sample 40 used was the forearm of a living human subject
and the
analyte to be measured was glucose.
The radiation source lamp 14 was connected to a variable current source that
permitted the lamp 14 to increase output up to a maximum of 40 watts. The
output of
the lamp would then be incrementally increased until the SNR was high enough
to
acquire accurate glucose measurements. As the lamp power was increased during
the
subsequent experimental trials, most of the subjects reported discomfort prior
to
reaching an acceptable SNR. The discomfort experienced by the subjects was due
to
a localized heating of their forearm by the illuminating radiation.
To further analyze the above-described phenomenon, a ray trace program was
utilized to compare and contrast various illumination systems for spatial and
angular
homogeneity. TracePro V2.1, a commercially available non-sequential ray trace
program, was used to generate realistic models of the radiation distributions
from
various illumination system configurations. The output from such modeling is
-21-
CA 02445868 2003-10-10
WO 02/082990 PCT/US02/09469
depicted in Figures 4a-c, 5a-c, 14a-c and 15a-c. In order to understand the
output of
the modeled illumination, Table 1 correlates the specific radiometric terms to
their
corresponding symbols, definitions, and units.
TABLE 1: Definition of Radiometric Quantities
Name Symbol Definition Units
Ener - Joules,
J
Flux t~ ~~ Watts,
W
a~
ExitanceM aA W/mz
s
a~
IncidenceE W/mz
aA
r
a~
z
RadianceL W/m
a(AS . ~os / sr
e) . a~
With respect to Table l, aAr and aAs refer to differential elements of area on
the
receiver and source, respectively. Additionally, B refers to the angle between
the line
of sight from the observer to the source and the direction of the radiation
24. The
associated spectral quantities are defined by differentiating the above
general
t 0 radiometric quantities with respect to wavelength, as depicted below:
M aM , E aE , and L aL
ea. ~ - ea. ~ - aa,
Figures 4a-c are plots of the incidence of emitted radiation 24 from the
elliptical reflector 12 in Figure 2. These plots have been generated using
TracePro
V2.1, a ray trace program simulating the spatial distribution of emitted
radiation from
the radiation source lamp 14. More specifically, the plots of incidence are
representative of the spatial distribution of emitted radiation at the focus
of the
elliptical reflector 26 diagramed in Figure 2.
Figure 4a shows a plot of incidence of emitted radiation 24 from a radiation
source lamp 14. The resulting incidence plot is characterized by a substantial
degree
of spatial inhomogeneity. Spatial distribution of emitted radiation in
particular areas
of the plot is demonstrated to vary substantially throughout the incidence
plot. In
certain areas within the plot, the spatial distribution is greater than other
areas within
the same plot. The converse is also true. The spatial distribution of the
emitted
-22-
CA 02445868 2003-10-10
WO 02/082990 PCT/US02/09469
radiation is also illustrated to follow certain arc-like bands of greater or
lesser
incidance throughout the plot.
Figure 4b shows a plot of incidance of the same radiation source lamp of
Figure 4a, but after a 90-degree rotation of the filament producing the
incidance plot.
Comparisons of the plots of Figures 4a and 4b show that areas of greater
incidance in
Figure 4a are now areas of lesser incidance in Figure 4b, and the inverse.
Figure 4c
further depicts this spatial distribution disparity by showing the changes in
spatial
distribution when the filament 16 of the same radiation source lamp 14 of
Figure 4a
undergoes a vertical translation of one millimeter. Again, the spatial
distributions in
t0 Figure 4c after the one-millimeter translation provide areas of greater
incidance where
there were originally none in Figure 4a. These plots document that the spatial
distribution of light at the focus of the standard light source is highly
unstable with
modest translations and/or rotations of the filament.
Similar to Figures 4(a-c), Figures 5(a-c) depict plots of the intensity of
emitted
radiation from the elliptical reflector in Figure 2. These plots have also
been
generated using TracePro V2.1 to simulate the angular distribution of emitted
radiation 24 from a radiation source emitter 14 known in the art. More
specifically,
the plots are representative of the angular distribution of emitted radiation
at the focus
of the elliptical reflector 26 diagramed in Figure 2, i.e., the direction of
the light rays
at the focus of the elliptical reflector. .
Figure Sa shows a plot of intensity of emitted radiation from a radiation
source
lamp 14. The resulting intensity plot from the standard radiation source is
characterized by a substantial degree of angular inhomogeneity. Angular
distributions
in particular areas of the plot also vary dramatically within the same plot.
For
example, Figure 5a illustrates a "hole" in the center of the intensity plot.
The lack of
irradiation intensity in this particular area is a result of a shadowing
effect by the
envelope nipple 20 on the end of a radiation source lamp 14.
Rotating the filament 16 of Figure 5a produces an intensity plot illustrated
by
Figure Sb. Because the filament 16 was rotated, the hole 60 in the center of
the plot
remains centered within the plot after the 90-degree rotation. Translation of
the
filament 16 of Figure 5a by one millimeter, however, greatly diminishes the
angular
distribution within the spectroscopic system, as depicted in Figure 5c.
Angular
distributions are sporadic, and often completely shadowed by the modest
translation
-23-
CA 02445868 2003-10-10
WO 02/082990 PCT/US02/09469
of the radiation source lamp 14.
The ray trace plots of Figures 4(a-c) and Figures 5(a-c) illustrate that the
spatial
and angular distribution of light at the focus 26 of a standard radiation
source 14 is
highly unstable with respect to modest translations and/or rotations of its
filament 16.
Areas of higher incidance and intensity may form "hot spots" during
illumination. In an
attempt to maximize the signal-to-noise ratio, the radiation source 14 could
be~increased
to the thermal and/or comfort limits established by the patient. However, if
there are
"hot spots" across the tissue, these areas may require a lower overall
radiation output and
corresponding result of lower SNR. Thus, uniform intensity illumination is
desired
when attempting to maximize the SNR for glucose measurements.
The above plots clearly illustrate angular and spatial variances associated
with
the illumination system. These variances translate into spectroscopic
variances that
adversely influence the achievement of high levels of accuracy in measuring
analyte
concentrations. Inhomogeneous spatial and angular distributions of emitted
radiation 24
impede a practitioner from constructing chemometric models that are sensitive
to the
differences between interferents and the desired analyte. Modest and
unaccounted for
translations and/or rotations of the emitter 14, such as those that might
result from loose
mechanical tolerances or vibration, have been found to significantly alter
these relied-
upon chemometric models. An additional experiment was conducted to illustrate
the
2o effect of interferent variations on a calibrated chemometric model.
Figure 6 shows a diagramed view of the system used for constructing a
chemometric model for measuring glucose concentration in the forearm's of
various
subjects. The components within this instrument system closely resemble those
in
Figure 3 and like elements are numbered the same. The additions utilized
should not be
construed as an exhaustive list for constructing an accurate chemometric model
for
glucose measurement. Identification of these additions is merely for
illustrative
purposes only, as one of skill in the art may readily identify numerous
combinations of
instrument components that could achieve a chemometric model for the desired
analyte.
The first of the additions shown in Figure 6 is a five (5) millimeter aperture
70
positioned at the focal point of the elliptical reflector 26. This aperture 70
limits the
amount of emitted radiation 24 permitted to pass through the system 10 for
analysis.
Once the radiation clears the aperture 70, a silicon lens 72 redirects the
radiation through
a cyan filter 76, which in turn, sends the radiation through a second silicon
lens 74.
-24-
CA 02445868 2003-10-10
WO 02/082990 PCT/US02/09469
Radiation transmitted through this series of lenses is then filtered to absorb
radiation at
wavelengths at or greater than 2.7 micron by passing through filter/diffuser
78. In a
preferred embodiment, a WG295 filter/diffuser is utilized to absorb the
wavelengths at
or greater than 2.7 micron. The radiation is then illuminated upon a sample
40, collected
and analyzed as described in relation to Figure 3.
Using the above-described system, numerous calibration spectra spanning a
wavelength range of approximately 1.25 N.m to 2.5 pm were used to construct a
chemometric model for measuring glucose concentrations within forearms' of
subjects.
The calibration set spanned several different lamps, many human subjects, a
wide range
of glucose values, and a variety of operating temperatures and relative
humidities.
During the "prediction" phase of the experiment, eleven human subjects were
measured by the spectrometer system four times each day. Additionally, the
radiation
source lamp 14 for the system was changed every two days. As a note, the human
subjects and lamps used in this prediction phase of the experiment were not
the same as
those used during the calibration phase. The results of this experiment are
shown in
Figure 7, where the errors are sorted by day.
Figure 7 shows a "box and whisker" plot. In this type of plot, the median
prediction error for each day is plotted as a horizontal line 82 in the middle
of a box 80,
which encompasses the middle half of the data, and "whiskers" 84 are plotted
at the 5th
and 95th percentiles; a "dot" 86 represents the mean prediction error for the
day; the
horizontal dashed line 88 shows where the data are centered when the
prediction error
bias is zero; and the numbers shown under at the bottom of the graph indicate
the
number of predictions associated with that whisker and taken on each study
day.
Figure 7 specifically shows a box and whisker plot of prediction error versus
day
across five lamp changes, six lamps in total, over twelve days. During the
first four days
of the experiment, regarding lamps 1 and 2, the absolute prediction error bias
was less
than
20 mg/dl. After the second lamp change, however, (on days 5 and 6 of the
experiment)
the absolute bias increased dramatically. Replacing the third lamp with a
fourth (on day
7 of the experiment) reduced the bias to well under 20 mg/dl.
These results suggest.that the chemometric model was sufficiently "robust" as
to
permit accurate determination of the glucose levels for the subjects for most
of the
lamps, even though the lamps used during the prediction phase were not the
same as
-25-
CA 02445868 2003-10-10
WO 02/082990 PCT/US02/09469
those used during calibration. With regard to the third lamp, however, the
chemometric
model failed to produce accurate predictions. This failure suggests that the
emission
characteristics of this lamp were substantially out of the calibration range
used to build
this experimental chemometric model.
To help isolate the emitter variation within the illumination subsystem, as
the
source of the prediction errors described above, another experiment was
conducted using
the same apparatus, and similar methods as described in the previous
experiment. In this
subsequent experiment, however, spectra were collected from three different
subjects all
on the same day, using the same lamp throughout the prediction period. The
lamp was
1o installed in the apparatus at some arbitrary azimuthal orientation, Bo, and
spectra of the
subject's forearms were taken at Bo, as well as at Bo +/- 2 degrees. The
resulting
prediction errors are plotted in Figure 8 for the three lamp orientation
states. These
results indicate that changes in the emitter characteristics, which are the
result of small
rotations of the lamp, can cause prediction errors that are almost as large as
those caused
by complete replacement of one lamp with another.
A third experiment was then conducted to evaluate the effects of lamp changes
on prediction error. The system utilized is depicted in Figure 9, with like
elements
numbered the same as in Figure 3 and Figure 6. In this experiment, the sample
source of
living tissue 40 (a subject's forearm) was replaced with a "tissue phantom"
43. A tissue
phantom is solid, liquid, gel, jelly or combination thereof that approximates
the
absorbance and water pathlength distribution of living tissue without
necessarily
replicating the compositional and structural properties of living tissue.
Tissue phantoms
43 consist of a scattering solution made of microscopic polystyrene beads
suspended in
water at varying concentrations. In this experiment, the concentration range
for the
polystyrene beads was between 5000-8000 mg/dl. Tissue phantoms 43 within these
ranges are representative substitutes for living tissue because their optical
scattering and
absorption properties are similar to those of biological tissue. Additionally,
the use of
tissue phantoms of known concentrations eliminates the confounding effects
often
observed from physiological changes in living tissue. Figure 9 diagrams the
replacement
of a subject's forearm 40 with a tissue phantom 41. Further, the cyan filter
76 is located
after the output fiber optic 32. In all other respects, the apparatus
diagramed in Figure 9
is consistent with those discussed in detail with respect to Figure 3 and
Figure 6.
-26-
CA 02445868 2003-10-10
WO 02/082990 PCT/US02/09469
A set of 98 different tissue phantoms composed of 5 different analytes at
different concentrations were optically sampled. In order to assess the
ability of this
system in Figure 9 to predict glucose concentrations in the absence of lamp
changes, a
"cross-validation" analysis was performed. To accomplish this cross-validation
analysis,
a series of baseline measurements were performed wherein spectra of all ninety-
eight
solutions were taken using a single lamp with the apparatus depicted in Figure
9. This
data was artificially subdivided into four sets. Using three of these sets, a
chemometric
model was constructed to predict glucose values for the remaining set. The
analysis
procedure was again repeated, rotating the data sets used for calibration and
prediction,
1 o until all four sets had been used for prediction. The results of the cross-
validation are
shown in Figure 10a. The prediction errors biases shown in Figure l0a are
clustered
near 0 mg/dl. Such clustering suggests that in the absence of a lamp change,
this
apparatus is capable of making satisfactory measurements of glucose
concentration with
these samples.
Another cross-validation analysis was then performed. In this cross-validation
analysis, the ninety-eight solutions discussed above were grouped into four
subsets, and
a different lamp was assigned for use as the illumination source for each
subset. In this
analysis, data from three of the lamps was used to build a chemometric model
to predict
glucose in data from the fourth lamp. This chemometric modeling procedure was
repeated until each of the four data sets was used for prediction. The
prediction results
for the four data sets are presented in Figure lOb. A comparison between the
four data
sets shows a very large lamp-to-lamp prediction bias. These results are again
consistent
with the findings presented in Figures 7 (the replacement of individual lamps)
and
Figure 8 (the modest rotation and/or translation of a single lamp by +/- 2
degrees), thus
further illustrating the deleterious effects of interferents, such as emitter
variations, on
the development of accurate chemometric models for a preferred illumination
subsystem 100 of the present invention.
The illumination subsystem 100 of the present invention overcomes the above
identified problems. Figure 11 schematically depicts a simplified system
incorporating means for optimizing the illumination subsystem 100 to help
achieve
clinically relevant analytical results. In most respects, the apparatus
diagramed in
Figure 11 is consistent with those features discussed in detail with respect
to Figure 6,
with the clear identification of a radiation homogenizer 90. In a preferred
-27-
CA 02445868 2003-10-10
WO 02/082990 PCT/US02/09469
embodiment, the homogenizes 90 is positioned between the filter 78 and the
sample
40, as depicted in Figure 11. At this location, entering nearly monochromatic
radiation is spatially and angularly homogenized prior to its distribution
upon the
sample 40.
The placement of the homogenizes 90 at the above-described location is not to
be construed as restricting the scope of the invention. The system depicted in
Figure
11 is significantly simplified for illustrative purposes. Only certain
specific elements
within a far more elaborate spectroscopic system are diagramed. All the
elements
depicted in Figure 11, however, are common to preferred spectroscopic systems
of the
1 o present invention. The elements diagramed, therefore, are to aid in
identification of
various aspects of the overall spectroscopic system. Thus, it should be
understood
that the present invention encompasses embodiments wherein various components
of
a spectroscopic system may be assembled in a relative order other than the one
explicitly diagramed in Figures 11 and 16. However, the homogenizes 90 is
placed at
a point between the emitter 14 and the tissue or sample 40, although other
elements
may be included between the homogenizes 90 and emitter 14 or between the
homogenizes 90 and tissue or sample 40. This can also include the spectrometer
44,
which in certain embodiments can be positioned between the emitter 14 and
tissue 40.
In a preferred embodiment, the radiation homogenizes 90 is a light pipe.
2o Figures 12a and 12b show a perspective end view and a detail plan view of a
light
pipe 91 of the present invention. Light pipe 91 is generally fabricated from a
metallic,
glass (amorphous), crystalline, polymeric, or other similar material, or any
combination thereof. Physically, the light pipe comprises a proximal end 92, a
distal
end 94, and a length 96 therebetween. The length of a light pipe 91, for this
application, is measured by drawing a straight line from the proximal end 92
to the
distal end 94 of the light pipe. Thus, the same segment of light pipe 91 may
have
varying lengths depending upon the shape the segment forms. The length of the
segment readily varies with the light pipe's intended application.
In a preferred embodiment as illustrated in Figures 12a and 12b, the segment
forms an S-shaped light pipe. The S-shaped bend in the light pipe provides
angular
homogenization of the light as it passes through the light pipe. This
conclusion is
documented by the experiment and discussion associated with Figures 14a-c and
15a-
c below. It is, however, recognized that angular homogenization can be
achieved in
-28-
CA 02445868 2003-10-10
WO 02/082990 PCT/US02/09469
other ways. A plurality of bends or a non-S-shaped bend could be used.
Further, a
straight light pipe could be used provided the interior surface of the light
pipe
included a diffusely reflective coating over at least a portion of the length.
The
coating provides angular homogenization as the light travels through the pipe.
Alternatively, the interior surface of the light pipe can be modified to
include dimples
or "microstructures" such as micro-optical diffusers or lenses to accomplish
angular
homogenization. Finally, a ground glass diffuser could be used to provide some
angular homogenization.
The cross-section of the light pipe 91 may also form various shapes. In
~ 0 particular, the cross-section of the light pipe 91 is preferably polygonal
in shape to
provide spatial homogenization. Polygonal cross-sections include all polygonal
forms
having three to many sides. Certain polygonal cross-sections are proven to
improve
spatial homogenization of channeled radiation. For example, a light pipe
possessing a
hexagonal cross-section the entire length thereof provided improved spatial
homogenization when compared to a light pipe with a cylindrical cross-section
of the
same length.
Additionally, cross-sections throughout the length of the light pipe may vary.
As such, the shape and diameter of any cross-section at one point along the
length of
the light pipe may vary with a second cross-section taken at a second point
along the
same segment of pipe.
In certain embodiments, the light pipe is of a hollow construction between the
two ends. In these embodiments, at least one lumen may run the length of the
light
pipe. The lumens of hollow light pipes generally possess a reflective
characteristic.
This reflective characteristic aids in channeling radiation through the length
of the
light pipe so that the radiation may be emitted at the pipe's distal end. The
inner
diameter of the lumen may further possess either a smooth, a diffuse or a
textured
surface. The surface characteristics of the reflective lumen aid in spatially
and
angularly homogenizing radiation as it passes through the length of the light
pipe.
In additional embodiments, the light pipe is of solid construction. The solid
core could be cover-plated, coated or clad. Again, a solid construction light
pipe
generally provides for internal reflection. This internal reflection allows
radiation
entering the proximal end of the solid light pipe to be channeled through the
length of
the pipe. The channeled radiation may then be emitted out of the distal end of
the
-29-
CA 02445868 2003-10-10
WO 02/082990 PCT/US02/09469
pipe without significant loss of radiation intensity. An illustration of
internal
reflection and the resulting channeling is shown in Figure 13.
Figure 13 depicts a plan view of a ray trace showing radiation 24 from a light
source 14 (40-watt tungsten-halogen bulb) focused by an elliptical reflector
12 into,
and through, a light pipe 91 of the present invention. In particular, Figure
13
illustrates how emitted radiation from a radiation source lamp is focused upon
the
proximal end of the light pipe of the present invention. The focused radiation
is
internally reflected throughout the length of the light pipe. As the radiation
is
reflected, specific structural characteristics of the light pipe (here an S-
shaped
segment of hexagonal cross-sectioned pipe) angularly and spatially homogenizes
the
resulting radiation emitted at the pipe's distal end.
Figures 14(a-c) are plots of the incidence of emitted radiation from the
elliptical reflector and light pipe depicted in Figure 13. These plots have
again been
generated using TracePro V2.1, a ray trace program simulating the spatial
distribution
of emitted radiation from the radiation source emitter. More specifically, the
plots of
incidence are representative of the spatial distribution of emitted radiation
at the distal
end of the light pipe diagramed in Figure 13.
Figure 14a shows a plot of incidence of emitted radiation from the radiation
source lamp coupled to the light pipe of the present invention. The resulting
incidence plot is characterized by a substantial degree of spatial
homogeneity. Spatial
distribution of emitted radiation throughout the incidence plot varies
slightly. A
comparison of Figure 14a with that of Figure 4a illustrates the substantial
improvement in spatial distribution throughout the incidence plot when using a
light
pipe of the present invention.
Figure 14b shows a plot of incidence of the same radiation source lamp
coupled to the light pipe of the present invention as depicted in Figure 14a,
but after a
90-degree rotation of the filament producing the incidence plot. Again, the
resulting
incidence plot is characterized by a substantial degree of spatial
homogeneity. In fact,
there exist few detectable difference in spatial distribution after the
resulting 90-
degree rotation as with the spatial distribution prior to the rotation.
Figure 14c further depicts the spatial homogeneous distribution of emitted
radiation using a light pipe of the present invention. Again, the spatial
distribution in
Figure 14c, after a one-millimeter translation, is very similar to those
spatial
-30-
CA 02445868 2003-10-10
WO 02/082990 PCT/US02/09469
distributions in Figures 14(a-b).
Similar to Figures 14(a-c), Figures 15(a-c) show plots of the intensity of
emitted radiation from the elliptical reflector and light pipe depicted in
Figure 13.
These plots have also been generated using TracePro V2.1 to simulate the
angular
distribution of emitted radiation from a. radiation source emitter known in
the art.
More specifically, the plots of intensity are representative of the angular
distribution
of emitted radiation at the distal end of the light pipe diagramed in Figure
13.
Figure 15a shows a plot of intensity of emitted radiation from the radiation
source lamp coupled to the light pipe of the present invention. The resulting
intensity
plot from the standard radiation source is characterized by a substantial
degree of
angular homogeneity. Angular distributions throughout the plot vary slightly.
A
comparison of Figure 15a with that of Figure 5a illustrates the substantial
improvement in angular distribution throughout the intensity plot when using a
light
pipe of the present invention. For example, the "hole" in the center of the
intensity
plot caused by the glass nipple on the end of the radiation source lamp is no
longer
present and is now replaced with homogenized angular radiation.
Rotating the filament of Figure 15a by 90-degrees produces an intensity plot
illustrated by Figure 15b. Again, there are minor differences between the
intensity
plots after, and prior to, the rotation. Translation of the filament of Figure
15a by one
2o millimeter, as depicted in Figure 15c, once again documents reduction in
variation of
angular distribution as compared to the plots of Figures 15a-b.
The ray trace plots of Figures 14(a-c) and 15(a-c) illustrate that the spatial
and
angular distribution of light at the output of the light pipe is highly stable
with respect to
modest translations and/or rotations of its filament. This is especially clear
when
comparing the ray trace plots of Figures 14(a-c) and Figures 15(a-c) using a
light pipe of
the present invention with Figures 4(a-c) and Figures 5(a-c) without the light
pipe of the
present invention. The light tube of the present invention has been
effectively shown
through these incidance and intensity plots to eliminate or substantially
reduce the light
source or illumination system as an interferent associated with chemometric
modeling.
It has been found that the use of the light pipe in the illumination subsystem
of the
present invention allows construction of chemometric models of sufficient
sensitivity to
measure analyte concentrations.
Another embodiment of the illumination subsystem of the present invention is
-31-
CA 02445868 2003-10-10
WO 02/082990 PCT/US02/09469
depicted schematically in Figure 16. In this embodiment, the tungsten halogen
source 14
is placed at one focus of an elliptical reflector 110 and the proximal end 111
of a light
pipe 112 is placed at the other focus 114. To improve the collection
efficiency of the
system a separate back reflector 116 is positioned opposite the elliptical
reflector 110 to
capture and redirect light which would otherwise be lost from the system. The
distal end
118 of the light pipe 112 then provides the source of radiation for the
spectroscopic
sample.
Figures 17 and 18 show the simulated spatial and angular distributions of the
light at the distal end 118 of the light pipe 112 of Figure 16. These
distributions show
substantially improved homogenization as compared to the output of the
standard system
depicted in Figure 2.
Another embodiment of the present invention is shown in Figure 19. In this
embodiment, the tungsten halogen source 114 is placed at the focus 120 of a
section of a
parabolic reflector 122 and the proximal end 124 of a light pipe 126 is placed
at the
focus 128 of a section of another parabolic reflector 130. The homogenized
light exits
the distal end 132 of the light pipe 126. The simulated spatial and angular
distributions
of the light at the distal end of the light pipe, shown in Figures 20 and 21,
show
substantially improved homogenization as compared to the output of the
standard system
depicted in Figure 2.
Another embodiment of the present invention is shown in Figure 22. This
embodiment is similar to the standard system depicted in Figure 2, except that
the
standard elliptical reflector has been replaced with a faceted reflector 140.
This faceted
reflector 140 has the same general form as the elliptical reflector of Figure
2, but the
smoothly varying shape of the standard elliptical form has been replaced with
flat mirror
facets 142 which locally approximate the standard shape. Such faceted
reflectors 142
provide a high degree of spatial uniformity. Figure 23 is a simulated spatial
distribution
of the light at the second focus of the ellipse, showing substantially
improved spatial
homogeneity as compared to the output of the standard system of Figure 2.
Figure 24 is
a simulated angular distribution at the second focus of the ellipse which,
unlike the other
embodiments disclosed herein, exhibits a high degree of non-uniformity.
The faceted elliptical reflector is an example of an embodiment of an
illumination subsystem of the present invention which produces only part of
the desired
characteristics in the output radiation. In the case of the faceted reflector
140, spatial
-32-
CA 02445868 2003-10-10
WO 02/082990 PCT/US02/09469
homogenization is achieved but not angular homogenization. In other cases,
such as
passing the output of the standard system through ground glass, angular
homogenization
is achieved but not spatial homogenization. In embodiments such as these,
where only
angular or spatial homogenization is produced (but not both) some improvement
in the
performance of the spectroscopic system may be expected. However, the degree
of
improvement would not be expected to be as great as for systems where spatial
and
angular homogenization of the radiation are simultaneously achieved.
Another method for creating both angular and spatial homogenization is to use
an integrating sphere in the illumination subsystem. Although common to use an
integrating sphere for detection of light, especially from samples that
scatter light,
integrating spheres have not been used as part of the illumination subsystem
when
seeking to measure analytes non-invasively. In practice, radiation output from
the
emitter could be coupled into the integrating sphere with subsequent
illumination of the
tissue through an exit port. The emitter could also be located in the
integrating sphere.
An integrating sphere will result in exceptional angular and spatial
homogenization but
the efficiency of this system is significantly less than other embodiments
previously
specified.
In order to evaluate the efficacy of the light tube of the present invention
for
reducing prediction error related to lamp variations, an experiment was
conducted
comparing a chemometric model using a light pipe of the present invention with
a
chemometric model without the light pipe of the present invention. The system
of
Figure 9 depicts the system without the light pipe. Figure 25 is a diagramed
view of the
system of the present invention for measuring glucose in scattering media
having a tissue
phantom 43 as the sample source. The apparatus diagramed in Figure 25 is
consistent
with that discussed in detail with respect to Figure 9 except for the S-bend
light pipe 91
which is included at the focus of the second silicon lens 74.
The results of comparative testing between the system of Figure 9 and that of
Figure 25 which incorporates the light pipe are included in the box and
whisker plots of
Figures 26a through 26d. Figures 26a and 26b are duplicates of Figures 10a and
lOb to
provide easy comparison with the results included in Figures 26c and 26d.
Thus, Figure
26a depicts the ability of the standard system with no bulb changes to predict
glucose
concentrations. Figure 26b depicts the system ability across four bulb
changes. Figure
26c depicts the results of the system of Figure 25 across four bulb changes.
Figure 26d
-33-
CA 02445868 2003-10-10
WO 02/082990 PCT/US02/09469
shows the results of tests done on the system of Figure 25, but with the
addition of a
ground glass diffuser 78 prior to the light pipe 91. Figures 26c and 26d
clearly show that
the embodiments of Figure 25 are highly effective in improving the predictive
accuracy
of the apparatus and chemometric model over the system of Figure 9. Further,
the
greatest benefit is derived when the ground glass diffuser 78 and the S-bend
light pipe 91
are used together which results in the highest degree of homogenization of the
light
incident on the sample.
The performance of the illumination subsystem of the present invention
relative
to a known radiation emitter difference can be quantified. A method for
quantifying the
1 o performance of the illumination system is to create both angular and
spatial distribution
plots under two known but different conditions. The differences between the
two similar
metric plots can be quantified. The known emitter difference to be used for
quantification is preferably a one-millimeter translation of the lamp
filament.
Angular and spatial distribution plots can be created by using standard ray
trace
packages such as TracePro V2.1 or through direct measurements. The image of
the
illumination system beam can be measured by using any standard intensity
mapping
scheme and by using a goniometer. This allows both the spatial and angular
disfibutions of the illumination output to be determined.
Optical modeling or direct measurement of the system should occur before and
after movement of the filament. In order to standardize the calculation for
many
applications, the image should be divided into approximately one hundred
equally sized
"bins" (or squares), with ten bins across the diameter of the output image.
This
requirement is easily satisfied when performing ray trace analysis and can be
accomplished by either measuring the beam in a ten by ten grid or by sampling
at finer
spacing and then averaging the data. The spatial and angular distributions for
the initial
emitter state are then subtracted from the corresponding distributions after
movement of
the lamp filament by one millimeter. The resulting images represent either the
angular
or spatial variance that occurred due to the emitter perturbation. In order to
quantify the
angular or spatial variance, all the data in the different images are put into
a vector for
easier calculation, and the vector is normalized so that its length equals 1.
This
normalization is achieved by dividing each data point by the 2- norm (~~.~~2),
which is
equivalent to the Euclidean distance of the vector,
-34-
CA 02445868 2003-10-10
WO 02/082990 PCT/US02/09469
iiz
Eq~ (1) Ilxllz =C~~~Xe~z
where X is the vector of the difference image and n is the number of data
points
in the vector.
The normalization step ensures that the magnitude of every difference-image is
comparable. Following the normalization step, the standard deviation of the
normalized
image vector is calculated, and this metric is an indication of the amount of
variance
introduced by the known emitter difference,
2
- meara
Xt Ilxlz Xl Ilxllz~
Eq. (2) Metric =
n-1
The standard deviation of the normalized image vector for both angular and
spatial distributions was calculated for three different illumination systems.
1. Acceptable System: This illumination system is a light source (40-watt
tungsten-halogen bulb) focused by an elliptical reflector into a ground
glass diffuser, specified as a weak angular homogenizer, with
subsequent coupling into a hexagonal light pipe with a length to
t 5 diameter aspect ratio of 3 to 1. The system is modeled such that the
filament image fully fills the input into the hexagonal light pipe.
2. Preferred System: the illumination system is the same as the acceptable
except that the length to diameter aspect ratio is 7 to 1.
3. Ideal System: The illumination system is composed of a light source
(40-watt tungsten-halogen bulb) focused by an elliptical reflector into a
ground glass diffuser, specified as a strong angular homogenizer, with
subsequent coupling into an s-bend hexagonal light pipe with a length
to diameter aspect ratio of 7 to 1. The system is modeled such that the
filament image fully fills the input into the hexagonal light pipe.
Based upon testing with these three illumination systems, the degree of
homogenization can be generally classified as acceptable, preferred and ideal.
Table 2
shows the standard deviations of the spatial distribution for the three
systems. Table 3
shows the standard deviation for angular distribution.
-3 5-
CA 02445868 2003-10-10
WO 02/082990 PCT/US02/09469
TABLE 2
Vertical Filament Filament Rotation
Acceptable 0.053 0.050
Preferred 0.045 0.042
Ideal 0.039 0.034
TABLE 3
Vertical Filament Filament Rotation
Acceptable 0.044 0.066
Preferred 0.032 0.054
Ideal 0.027 0.050
There is another metric that can be used to evaluate the efficacy of an
illumination system in reducing error inflation following bulb changes. This
metric is
known as the multivariate signal to noise (mSNR). The typical signal to noise
(SlN)
calculation is a univariate measure; it is defined as the maximum signal in a
spectrum
divided by the standard deviation of the baseline noise.
When a multivariate calibration is used, the signal from two or more
t 0 wavelengths is used to quantify the analyte of interest. Because of this,
unless the
noise is random or 'white' noise, the standard deviation of the baseline (as
used in
univariate SlN calculations) is an inexact and inappropriate noise estimate.
Furthermore, the maximum signal in the spectrum is also an inexact and
inappropriate
measure of the overall signal since the multivariate calibration uses signals
from
multiple wavelengths. The mSNR metric, however, uses the multivariate net
analyte
signal and the error covariance matrix and therefore gives a better estimate
of the
signal to noise for multivariate calibrations.
The net analyte signal is that part of the analyte spectrum which is
orthogonal
(contravariant) to the spectra of all interferents in the sample. If there are
no interfering
species, the net analyte spectrum is equal to the analyte spectrum. If
interfering species
with similar spectra to the analyte are present, the net analyte signal will
be reduced
relative to the entire spectrum. The concept of net analyte signal for a three-
component
system is depicted graphically in Figure 57. Because the calibration depends
on the net
analyte signal, the multivariate signal to noise metric takes this measure
into account.
-36-
CA 02445868 2003-10-10
WO 02/082990 PCT/US02/09469
The mSNR can be calculated if two pieces of informarion are known. The net
analyte signal (NAS) for the analyte of interest must be known, but this may
be
estimated from the regression vector, b (the model),
b
Eq. (3) NAS = ~ ~ Z
b
Z
where II~IIZ represents the 2-norm of the vector.
The error covariance matrix (E), which describes the error structure of the
multi-
wavelength spectral data, is also needed for the mSNR calculation,
Eq. (4) E = sT * E
where a is a vector containing the noise at each wavelength.
Eq. (5) x = xo + a
where x is a measured spectrum, xo is the "true" spectrum in the absence of
noise, and s is the noise.
The error covariance matrix, E, measures how noise is correlated across
2o wavelengths. The spectra used to calculate the error covariance matrix are
spectra
that have a constant amount of the analyte of interest and are obtained or
processed in
a manner to identify the spectral variances due to the variance of interest.
In practice,
a repeat sample should be used and the only variance introduced into the
system
should be the spectral variance being identified. In this invention, the
variance source
of interest is spectral variance due to emitter changes. Thus, spectral data
from a
repeat sample is obtained using different emitters. If the noise is
uncorrelated, the
error covariance matrix will have no off diagonal elements, but in many cases,
this
will not be true. In such cases, the error may 'overlap' spectrally with the
net analyte
signal. In other words, this will introduce 'Noise' into the measurement of
this
particular analyte. The 'Noise' may be calculated as,
-37-
CA 02445868 2003-10-10
WO 02/082990 PCT/US02/09469
Eq. (6) Noise = vTEv
where
_ NAS
Eq~ (~) v IINAS Iz
The mSNR at unit concentration may then be calculated by,
IINAS Z IINAS Iz
Eq. (8) mSNR = -
Noise vTEv
The inverse of the net analyte spectrum, 1/mSNR, is an estimate of how much
error
will be added to prediction estimates if the type of noise in a is present in
the spectra
being used to predict the analyte concentration (or other property).
When an illumination system is insensitive to emitter variances, there will be
little effect on the spectral noise; in other words, the error covariance
matrix, E, will
be close to diagonal. In that case, the mSNR will be high. In the case where
the
system is sensitive to emitter variances or source fluctuations, correlated
noise will be
introduced and that will create off diagonal elements which will be present in
the
error covariance matrix E. When these spectral variances or noise interfere
(co-vary)
with the net analyte signal, the mSNR gets smaller and its inverse increases.
Table 4 shows the mSNR and 1/mSNR values calculated for three different
illumination systems. These systems include a standard system with no bulb
changes,
the preferred embodiment system (with s-bend light pipe and diffuser) and also
one
that contained a straight light pipe (acceptable system).
TABLE 4
System mSNR 1 /mSNR
No bulb change (Ideal level) 0.2 5
Bent light pipe & diffuser (Preferred level) 0.033 30
Straight light pipe only (Acceptable level) 0.0166 60
-3 8-
CA 02445868 2003-10-10
WO 02/082990 PCT/US02/09469
It is clear that bulb changes influence each system differently. The mSNR is
highest when no bulb change occurs, and lowest when the standard system with
limited source homogenization is used. Conversely, the greatest inflation in
prediction errors can be seen in that system (approximated by 1/mSNR).
These mSNR values were calculated using the study measuring the 98-solution
set that was described previously. The NAS was calculated using the model (b)
generated from the data set where a single bulb was used (equation 1). This
model
had no knowledge of bulb changes, and so the net analyte signal corresponds to
that in
the absence of source fluctuations. For each illumination system, there were
four bulb
changes as described before. For each bulb, in addition to the 90-solution
set,
additional 'repeat' samples were measured. These 'repeats' were simply samples
that
contained all of the analytes at concentrations at the center of the
calibration. Thus, to
isolate the spectral variance due to bulb changes the spectral data was
processed in the
following manner. Multiple 'repeat' spectra at each bulb were measured, and
the
average repeat spectrum for each bulb was calculated using these data,
hereafter
referred to as the average bulb spectrum. Each average bulb spectrum can be
thought
of as the 'x' in equation S. The mean repeat spectrum is simply the average
spectrum
of the average bulb spectra. To calculate the error, s, associated with each
bulb, the
mean repeat spectrum was subtracted from the average bulb repeat spectra,
n
X~
Eq. (9) 8; = x; - '_~
n
where n is the number of bulbs in the analysis (4 in this example). The E
matrix was
then calculated using equation 4, and equations 6-8 were then calculated to
find the
mSNR.
Now referring to Figure 27, another aspect of the present invention is
depicted.
The system depicted provides spectral filtering or bandpass filtering to
eliminate
unnecessary wavelengths or bands of wavelengths from the light prior to
contact with
the tissue. This is accomplished by placing one or more elements between the
light
source and tissue. The elements can include absorptive filters fabricated of
any
transparent or partially transparent substrate; single layer or mufti-layer
dielectric
coatings deposited on any transparent or partially transparent substrate; a
grating or
prism which disperses the radiation, permitting unwanted wavelengths to be
blocked
-39-
CA 02445868 2003-10-10
WO 02/082990 PCT/US02/09469
from reaching the tissue; and/or an aperture which selectively blocks
undesirable
radiation.
A preferred system for bandpass filtering is depicted in Figure 27 which
depicts a
light source 101 placed within an electrical reflector 102. Figure 27 also
depicts a
hexagonal S-bend light pipe 104 to receive light from the source 101. A series
of filters
are placed between the light source 101 and the light pipe 104. The first
optical filter is a
silicon filter 106 which is anti-reflection coated to transmit at least ninety
percent (90%)
of the in band incident light. The silicon filter passes wavelengths of light
longer than
1.1 micron. The second optical filter is preferably a KOPP 4-67 colored glass
filter 108
to that, in combination with the silicon filter, passes light in the 1.2 to
2.5 micron spectral
region. The slope of the KOPP filter is such that is preferentially passes
light at
wavelengths between 2.0 and 2.5 micron. The third optical filter is an ORIEL
WG295
absorption filter 110 that cuts out wavelengths longer than 2.5 micron. The
front surface
of the WG295 filter can be polished or finely ground. If the front surface is
finely
ground, the WG295 acts as a diffuser as well as a light filter. It has been
found that these
filters prevent burning of the tissue, while enhancing the signal-to-noise
ratio of the
system by band limiting the light to only the spectral region of interest. The
effect of
band limiting the light is to reduce shot noise generated by the photon flux
incident on
the detector.
An alternative combination of filters to achieve spectral bandpass filtering
is
depicted in Figure 6. With this embodiment, the two silicon lenses 72,74
absorb
wavelengths shorter than approximately 1.2 microns and longer than
approximately 10
microns. The cyan filter 76 is an absorptive filter such as a Hoya CM-500 to
absorb
mid-infrared radiation at wavelengths of approximately 2.8 microns and longer.
Further,
a SCHOTT WG-295 absorptive filter 78 is included to absorb radiation at
wavelengths
approximately 2.7 micron and higher. Figure 28 graphically depicts the
individual and
combined spectral transmission of the components shown in Figure 6, along with
the
"spectral fingerprint" of glucose. As depicted in the graphs, this combination
of
absorptive filters and silicon lenses acts to block unwanted wavelengths,
while still
permitting transmission of radiation in the glucose fingerprint region.
Similar
combinations of filters can be utilized based on analytes of interest to be
analyzed.
It is also recognized that other modifications can be made to the present
disclosed system to accomplish desired homogenization of light. For example,
the light
-40-
CA 02445868 2003-10-10
WO 02/082990 PCT/US02/09469
source could be placed inside the light pipe in a sealed arrangement which
would
eliminate the need for the reflector. Further, the light pipe could be
replaced by an
integrator, wherein the source is placed within the integrator as disclosed in
U.S. Patent
Application Serial No. 09/832,631, entitled "Encoded Multiplex Variable Filter
Spectrometer," filed on the same date herewith and incorporated by reference.
The purpose of the tissue sampling subsystem 200 is to introduce radiation
generated by the illumination subsystem 100 into the tissue of the subject and
to
collect the portions of the radiation that are not absorbed by the tissue and
send that
radiation to the FTIR spectrometer subsystem 400 for measurement. Figures 29,
30
t 0 and 31 depict elements of a preferred tissue sampling subsystem 200.
Referring first
to Figure 29, the tissue sampling subsystem 200 has an optical input 202, a
sampling
surface 204 which forms a tissue interface 206 that interrogates the tissue
and an
optical output 207. The subsystem further includes an ergonomic apparatus 210,
depicted in Figure 31, which holds the sampling surface 204 and positions the
tissue
at the interface 206. In a preferred subsystem, a device that thermostats the
tissue
interface is included and, in some embodiments, an apparatus which repositions
the
tissue on the tissue interface in a repetitive fashion is included.
The optical input 202 of the tissue sampling subsystem 200 receives radiation
from the illumination subsystem 100 (i.e., light exiting the light pipe) and
transfers that
radiation to the tissue interface 206. The optical input may consist of a
bundle of optical
fibers that are arranged in a geometric pattern that collects the most light
possible from
the illumination subsystem. One preferred arrangement is depicted in Figure
30. The
plan view depicts the ends of the input and output fibers in a geometry at the
sampling
surface including six clusters 208 arranged in a circular pattern. Each
cluster includes
four central output fibers 212 which collect diffusely reflected light from
the tissue.
Around each grouping of four central output fibers 212 is a cylinder of
material 215
which ensures about a 100 p.m gap between the edges of the central output
fibers 212
and the inner ring of input fibers 214. The 100 Eun gap is important to target
glucose in
the dermis. As shown in Figure 30, two concentric rings of input fibers 214
are arranged
around the cylinder of material 215. As shown in one preferred embodiment, 32
input
fibers surround the four output fibers. The high ratio of input-to-output
fibers is
maintained in all preferred embodiments in recognition of loss within the
tissue.
All of the clustered input and output fibers are potted into a cluster ferrule
which
-41-
CA 02445868 2003-10-10
WO 02/082990 PCT/US02/09469
is glued into a sampling head 216. The sampling head 216 includes the sampling
surface
204 which is polished flat to allow formation of a good tissue interface.
Likewise, the
input fibers are clustered into a ferrule 218 connected at the input ends to
interface with
the illumination subsystem 100. The output ends of the output fibers are
clustered into a
ferrule 220 for interface with the FTIR spectrometer subsystem 400.
Alternatively, the optical input may not require any fibers and may instead
use a
combination of light pipes, refractive and/or reflective optics to transfer
the maximum
amount of input light to the tissue interface. It is important that the input
optics of the
tissue sampling subsystem collect as much light as possible from the
illumination
subsystem 100 in order to maximize the SNR achieved by the overall system. In
the art,
FTIR spectrometer-based non-invasive glucose monitoring systems have been
described
with the illumination subsystem before the FTIR spectrometer and the tissue
sampling
subsystem after the FTIR spectrometer. This configuration as described in the
art has the
disadvantage of limiting the total throughput of the system because the FTIR
spectrometer cannot support a large range of angles from the illumination
subsystem due
to spectral resolution and physical size requirements. In the present
invention, the
placement of the illumination subsystem 100 and tissue sampling subsystem 200
before
the FTIR spectrometer subsystem 400 results in over an order of magnitude
improvement in throughput for a given size of FTIR spectrometer because the
input to
the tissue sampling subsystem 200 is designed to handle the wide range of
angles from
the illumination subsystem 100 and the small output image size of the tissue
sampling
subsystem is better matched to the throughput supported by a reasonably sized
FTIR
spectrometer. The source, sample, FTIR spectrometer, detector (SSFD)
configuration
for non-invasive glucose monitoring is a significant improvement over the
current art.
The tissue interface is another critical part of the tissue sampling
subsystem. It
must irradiate the tissue in a manner that targets the glucose bearing
compartments of
the tissue and discriminates against light that does not travel a significant
distance
through those compartments. As stated above, the 100-pm gap discriminates
against
light which contains little glucose information. In addition, the tissue
interface may
3o need to average over a certain area of the tissue to reduce errors due to
the
heterogeneous nature of the tissue. The tissue sampling interface should
reject
specular and short pathlength rays and it must collect the portion of the
light that
travels the desired pathlength through the tissue with high efficiency in
order to
-42-
CA 02445868 2003-10-10
WO 02/082990 PCT/US02/09469
maximize the SNR of the system. The tissue sampling interface may employ
optical
fibers to channel the light from the input to the tissue in a predetermined
geometry as
discussed above. The optical fibers may be arranged in pattern that targets
certain
layers of the tissue that contain good glucose concentration information. The
spacing
and placement of the input and output fibers can be arranged in an optimal
manner to
achieve effective depth targeting. In addition to the use of optical fibers,
the tissue
sampling interface can use a non-fiber based arrangement that places a pattern
of
input and output areas on the surface of the tissue when using diffuse
reflectance.
Proper masking of the non-fiber based tissue sampling interface ensures that
the input
light travels a minimum distance in the tissue and contains valid glucose
concentration information. Finally, the tissue sampling interface may be
thermostatted to control the temperature of the tissue in a predetermined
fashion. The
temperature of the tissue sampling interface is set such that the invention
reduces
prediction errors due to temperature variation and also such that glucose
direction of
change can be inferred by the equilibration of the interstitial space with
capillary
blood glucose levels. In preferred embodiments, the sampling head 216 is
heated to
between 34° C and 40° C in order to thermostat the tissue. This
promotes
equilibration of glucose between the interstitial fluid and the capillary
blood. Further,
reference errors are reduced when building a calibration model. These methods
are
disclosed in commonly assigned U.S. Patent Application Serial No. 09/343,800,
entitled "Method and Apparatus for Non-Invasive Blood Analyte Measurement with
Fluid Compartment Equilibration," the disclosure of which is incorporated
herein by
reference.
The tissue sampling subsystem generally will employ an ergonomic apparatus or
cradle 210 that positions the tissue over the sampling interface 206 in a
reproducible
manner. A preferred ergonomic apparatus 210 is depicted in Figure 31. In the
case of
sampling the underside of the forearm, an ergonomic cradle design is essential
to ensure
good contact with the sampling interface. The ergonomic cradle 210 includes a
base 221
having an opening 223 therethrough. The opening is sized for receiving the
sample head
216 therein to position the sampling surface 204 generally coplanar with an
upper
surface 225 of the base 221. The ergonomic cradle 210 references the elbow and
upper
arm of the subject via a bracket 222 in conjunction with a float-to-fit
handgrip 224 to
accurately position the forearm on the tissue sampling interface. Careful
attention must
-43-
CA 02445868 2003-10-10
WO 02/082990 PCT/US02/09469
be given to the ergonomics of the tissue sampling interface or significant
sampling error
can result. Errors in sampling the tissue have been found to be a major source
of
reduced accuracy and precision for the non-invasive measurement of glucose.
The ergonomic cradle 210 of the present invention is an important part of the
tissue sampling subsystem 200. The cradle is designed such that the forearm of
the
subject is reliably located over the sample head 216. The bracket 222 forms an
elbow
rest that sets the proper angle between the upper arm and the sampling head
216, and
also serves as a registration point for the arm. The adjustable hand rest 224
is designed
to hold the fingers in a relaxed manner. The hand rest position is adjusted
for each
subject to accommodate different forearm lengths. In preferred embodiments, a
lifting
mechanism is included which raises and lowers the cradle periodically during
sampling
to break and reform the tissue interface. Reformation of the interface
facilitates
reduction of sampling errors due to the rough nature and inhomogeneity of the
skin.
The image formed by the output of the tissue sampling subsystem is typically
an order of magnitude smaller in size than its input. This input image to
output image
ratio is necessary to match the throughput supported by the FTIR spectrometer
while
maximizing the overall system signal to noise ratio. The output of the tissue
sampling
subsystem 200 transfers the portion of the light not absorbed by the tissue
that has
traveled an acceptable path through the tissue to the input of the FTIR
spectrometer
subsystem 400. The output of the tissue sampling subsystem 200 may use any
combination of refractive and/or reflective optics to produce a collimate beam
that
will be modulated by the FTIR spectrometer. In preferred embodiments, the
diffusely
reflected light collected by the output fibers 207 of the sampler head 216 are
collimated by a piano-aspheric lens made of ZnSe. The design of the lens is
such that
the collimated beam has less than five degrees of divergence. This lens 228 is
schematically depicted in Figure 1 as part of the FTIR spectrometer subsystem
400.
The collimating lens 228 produces a beam with low optical distortion that
serves as
the proper input to the FTIR spectrometer discussed below.
As shown in Figure 1, the FTIR spectrometer subsystem 400 includes a
spectrometer 230 that modulates the sufficiently collimated light from the
tissue
sampling subsystem 200 to create an interferogram which is received by a
detector
232. The interferogram spatially encodes the IVIR spectrum collected by the
tissue
sampling subsystem. Figure 32 schematically depicts one embodiment of an FTIR
-44-
CA 02445868 2003-10-10
WO 02/082990 PCT/US02/09469
spectrometer 230 which includes a beamsplitter 234 and compensator optics 236,
a
fixed retro-reflector 238 and a moving retro-reflector 240. The collimated
input light
242 impinges on the beamsplitter optic 234 and is partially reflected and
partially
transmitted by the coating on the back surface of the beamsplitter 234. The
reflected
light passes back through the beamsplitter optic 234 and reflects off the
fixed retro-
reflector 238 and back to the beamsplitter 234. The transmitted light passes
through
the compensator optic 236 and reflects off the moving retro-reflector 240 and
back to
the beamsplitter 234. The transmitted and reflected portions of the light
recombine at
the beamsplitter to create an interference pattern or interferogram. The
amount of
t 0 constructive and/or destructive interference between the transmitted and
reflected
beams is dependent on the spectral content of the collimated input beam 242
and on
the optical path difference between the fixed retro-reflector 238 and the
moving retro-
reflector 240.
Figure 33 shows a typical interferogram created by an FTIR spectrometer. At
the point of zero path difference between the transmitted and reflected beams,
there
will be maximum constructive interference, and the centerburst of the
interferogram is
created. The interferogram is then focused onto a detector 232, as shown in
Figure 1.
The detector 232 converts the optical interferogram into an electrical
representation of
the interferogram for subsequent digitizing by the data acquisition subsystem
500.
In a preferred embodiment, the non-invasive glucose monitor FTIR
spectrometer subsystem 400 utilizes an FTIR spectrometer 230 manufactured by
Bomem. This spectrometer utilizes a single plate that contains beamsplitter
and
compensator functions. In addition, cube corners are used as the end mirrors
and both
cube corners are moved on a wishbone suspension to create the optical path
difference
and the subsequent interference record. The Bomem WorkIRTM FTIR spectrometer
achieves the desired thermal stability and spectral complexity performance
necessary
for making non-invasive glucose measurements with NIR spectroscopy. The FTIR
spectrometer modulates the collimated light from the tissue sampler to
spatially
encode the NIR spectrum into an interferogram. The spectral resolution of the
3o interferogram can be in the range of 7.5 to 64 wavenumbers. The preferred
range of
spectral resolution is 30 - 50 wavenumbers. The interferometer will produce
either a
single-sided or a double-sided interferogram, with the double-sided
interferogram
being preferred because it achieves a higher SNR. The resulting interferogram
is
-45-
CA 02445868 2003-10-10
WO 02/082990 PCT/US02/09469
preferably passed to a condensing lens 244, as shown in Figure 1, and this
lens
focuses the light onto the detector 232. The condensing lens 244 is a double
convex
design with each surface being aspherical in nature. The lens material is
ZnSe. The
detector 232 is preferably a thermo-electrically cooled, lmm diameter,
extended
range, InGaAs detector that is sensitive to light in the 1.2 to 2.5 ~.m region
of the
spectrum. The detector 232 converts the optical interferogram into its
electrical
equivalent.
The non-invasive measurement of glucose in humans places extreme
requirements on the performance of the instrumentation due to the very small
size of
to the glucose absorption spectrum relative to the water absorption of the
body. In
addition, interferences due to absorption of other spectroscopically active
compounds
such as collagen, lipid, protein, etc. reduce the useful portions of the
glucose
absorption spectrum, yielding a net analyte signal that is very small. To
first order
approximation, 1 mg/dl of glucose concentration change is equivalent to 1 pAu
of
spectral variance for the effective pathlength light travels through tissue
using the
present invention. Therefore, in order to measure glucose non-invasively with
clinically acceptable accuracy, the spectrometer portion of the non-invasive
glucose
monitor must have a very large signal-to-noise ratio (SNR) and must have
excellent
photometric accuracy.
The FTIR spectrometer is a critical component of the non-invasive
measurement glucose monitoring system of the present invention because it can
achieve the required high SNR and photometric accuracy. In the art, there are
hundreds of variants of the classic Michelson interferometer design depicted
in Figure
32. One preferred interferometer design is disclosed in commonly assigned U.S.
Patent Application Serial No. 09/415,600, filed October 8, 1999, entitled
"Interferometer Spectrometer with Reduced Alignment Sensitivity," the
disclosure of
which is incorporated herein by reference. The FTIR spectrometer has
throughput
advantages (Jaquinot and Fellget advantages) relative to dispersive
spectrometers and
acousto-optical tunable filters. In addition to high throughput, the use of a
reference
laser in the FTIR spectrometer gives the device wavenumber axis precision.
Wavenumber or wavelength axis precision is very important for effective
calibration
maintenance and calibration transfer.
The FTIR spectrometer subsystem must achieve certain minimum
-46-
CA 02445868 2003-10-10
WO 02/082990 PCT/US02/09469
performance specifications for thermal stability, spectral complexity and
modulation
efficiency. In real world use of the present invention, ambient temperature
and
relative humidity will vary with time. Over an ambient temperature operating
range
of 10 C to 35 C, the FTIR spectrometer must maintain a modulation efficiency
of
50% or better. Modulation efficiency is a measure of the useful signal
produced by
the FTIR spectrometer and is calculated by taking the ratio of the peak
interferogram
value at zero path difference to the DC value and then multiplying by 100. The
maximum theoretical value of modulation efficiency is 100% with typical FTIR
spectrometers achieving values in the range of 65% to 95%. FTIR spectrometers
with
1 o modulation efficiencies below 50% have relatively poorer SNR because of
the
additional Shot noise from the larger proportion of non-signal bearing DC
light falling
on the photodetector.
In addition to maintaining modulation efficiency at or above 50% over the
ambient temperature operation range, the FTIR spectrometer's change in percent
transmittance (%T) at wavelengths between 1.2 and 2.5 microns (8000 to 4000
cm')
should not exceed 2% per degree Celsius. This maximum temperature sensitivity
is
necessary to preserve the glucose net analyte SNR and to simplify calibration
maintenance.
The spectral shape changes induced by thermal drift of the FTIR spectrometer
2o should be simple in shape such that they do not significantly degrade the
glucose net
analyte signal. One method of quantifying thermal drift for the FTIR subsystem
and/or the entire system is to place the device in a temperature controlled
chamber
and then measure spectra from a stable reference sample, such as an
integrating
sphere, as a function of time and temperature change in the chamber. A
principle
components analysis can be performed on the resulting absorbance spectra from
the
experiment and 99.99% of the variance due to thermal changes should be
explained in
the first 5 eigen vectors from the principle components analysis. In addition,
the %T
change with temperature can be calculated from the data set, and the
calculated
temperature coefficient should be 2% per degree Celsius or less.
As previously stated, the FTIR output beam 245 is sent to a condensing optical
element or elements 244 that focus the light onto a NIR sensitive detector.
The
condensing element or elements 244 can be refractive and/or reflective in
nature.
Examples of NIR detectors that are sensitive in the spectral range of 1.2 to
2.5 pm
-47-
CA 02445868 2003-10-10
WO 02/082990 PCT/US02/09469
include InGaAs, InAs, InSb, Ge, PbS, and PbSe. In the art, non-invasive
glucose
monitors have been described that utilize standard and extended range InGaAs
detectors that are sensitive from 1.2 to 1.7, 1.9 or 2.1 pm. In addition,
liquid nitrogen
cooled InSb detectors have been used. Also, PbS and PbSe detectors have been
used.
The present invention is unique in that it utilizes a thermo-electrically
cooled,
extended range InGaAs detector that is sensitive to light in the 1.2 to 2.5 ~m
range.
The 2.5 pm, extended range InGaAs detector has low Johnson noise and, as a
result,
allows Shot noise limited performance for the photon flux emanating from the
illumination/ tissue sampler/FTIR spectrometer subsystems. The extended InGaAs
detector has peak sensitivity in the 2.0 to 2.5 ~m spectral region where three
very
important glucose absorption peaks are located. Unlike the liquid nitrogen
cooled
InSb detector, the thermo-electrically cooled, extended range InGaAs is
practical for a
commercial product. Also, this detector exhibits over 120 dbc of linearity in
the 1.2
to 2.5 p,m spectral region.
Any photodetector may be used with the present invention as long as the given
photodetector satisfies basic sensitivity, noise and speed requirements. A
suitable
photodetector must have a shunt resistance greater than 6000 ohms, a terminal
capacitance less than 6 nano farads and a minimum photosensitivity of 0.15
amps per
watt over the 1.2 to 2.5 micron spectral region. In addition, the
photodetector must
have a cut-off frequency greater than or equal to 1000 hertz. The shunt
resistance of
the photodetector defines the Johnson or thermal noise of the detector. The
Johnson
noise of the detector must be low relative to the photon flux at the detector
to ensure
Shot noise limited performance by the detector. The terminal capacitance
governs the
cut-off frequency of the photodetector and may also be a factor in the high
frequency
noise gain of the photodetector amplifier. The photo sensitivity is an
important factor
in the conversion of light to an electrical current and directly impacts the
signal
portion of the SNR equation.
The optical interferogram is converted to an electrical signal by the detector
and this signal is received by the data acquisition subsystem 500. The data
acquisition subsystem 500 amplifies and filters the electrical signal from the
detector
and then converts the resulting analog electrical signal to its digital
representation
with an analog to digital converter. The analog electronics and ADC must
support the
high SNR and linearity inherent in the interferogram. In order to preserve the
SNR
-48-
CA 02445868 2003-10-10
WO 02/082990 PCT/US02/09469
and linearity of the interferogram, the data acquisition subsystem 500
supports at least
100 dbc of SNR plus distortion. The data acquisition subsystem 500 produces a
digitized interferogram that has uniform spatial displacement between samples.
The
data acquisition subsystem 500 also receives the reference laser signal from
the FTIR
spectrometer subsystem 400. Both the NIR signal and the reference laser are
digitized
by a 24-bit delta-sigma ADC operated at 96 kilohertz. The digital output of
the ADC
is processed by a signal processor to produce an interferogram that is sampled
at
constant spatial intervals. The interferograms are passed to the embedded
computer
subsystem 600 for further processing, as discussed below. Traditionally, the
zero
crossings of the reference laser are utilized to mark constant spatial
intervals for
sampling of the interferogram. The zero crossings of the reference laser are
spaced at
intervals equal to half the wavelength of the monochromatic light emitted by
the laser.
Further, the data acquisition subsystem 500 utilizes a constant time sampling,
dual channel, delta-sigma analog-to-digital converter (ADC) to support the SNR
and
photometric accuracy requirements of the present non-invasive glucose
measurement.
In preferred embodiments, the delta-sigma ADC utilized supports sampling rates
of
over 100 kHz per channel, has a dynamic range in excess of 117 dbc and has
total
harmonic distortion less than -105 dbc.
There are other types of data acquisition systems for the FTIR spectrometer
and photodetector that are well known in the art and could be employed in the
present
invention if they provide the following performance characteristics for
constant
spatial sampling, dynamic range, SNR, harmonic distortion and sampling speed.
There is an allowable error in determining the constant spatial sampling
intervals of
the interferogram, and the spatial sampling interval determination must have a
maximum spatial sampling fitter of +/- 25 nanometers in order to preserve a
SNR
of 100 dbc at 1.2 microns (8000 cm'). Levels of spatial sampling fitter
greater than
+/- 25 nanometers will introduce frequency modulation artifacts into the
spectral and
will degrade the glucose net analyte signal. In addition, the data acquisition
subsystem must support a dynamic range of at least 100 dbc, a SNR of 90 dbc
and
have total harmonic distortion less than 90 dbc. Finally, the ADC of the data
acquisition subsystem must be able to sample at speeds of 5,000 samples per
second
or greater in order to support a minimum FTIR moving minor scanning speed of
0.25
centimeters per second.
-49-
CA 02445868 2003-10-10
WO 02/082990 PCT/US02/09469
The constant time sampling data acquisition subsystem 500 has several distinct
advantages over the more traditional methods of acquiring interferograms from
an FTIR
spectrometer. These advantages include greater dynamic range, lower noise,
reduced
spectral artifacts, detector noise limited operation and simpler and less
expensive analog
electronics. In addition, the constant time sampling technique improves the
vibration
immunity of the FTIR because it can digitally compensate for delay mismatches
between
the laser reference and infrared detectors and can back out the non-ideal
aspects of the
electronics' transfer function. The main disadvantages of the constant time
sampling
technique are the increased computational and memory requirements necessary to
translate the constant time samples of the interferogram to constant spatial
samples.
With the use of a high performance digital signal processor (DSP), the
additional
computation and memory requirements are easily outweighed by the performance
enhancements of the constant time sampling technique.
The data acquisition subsystem passes the digitized, constant spatially
sampled
interferograms to the embedded computer subsystem 600 for further processing.
The
embedded computer subsystem 600 converts the stream of interferograms to
single
beam spectra by windowing the interferogram, performing phase correction of
the
windowed interferogram and then taking the Fourier transform of the windowed
and
phase corrected inteferogram. Either Mertz or power phase correction methods
may
be used. The power phase correction method is simpler to implement, but
results in
noise that has non-zero mean and is larger in magnitude by a factor of 1.414.
The
Mertz phase correction method is more complicated but produces noise with zero
mean and does not inject noise from the imaginary portion of the complex
spectrum.
The Mertz method results in spectra with higher photometric accuracy, however,
when using multivariate analysis techniques, both phase correction methods
result in
equivalent prediction performance.
After converting the interferograms to single beam spectra, the embedded
computer system will preferably check the single beam spectra for outliers or
bad
scans. An outlier sample or bad scan is one that violates the hypothesized
relationship
between the measured signal and the properties of interest (i.e., noninvasive
measurement of glucose concentration in human tissue). Examples of outlier
conditions include conditions where the calibrated instrument is operated
outside of
the specified operating ranges for ambient temperature, ambient humidity,
vibration
-SO-
CA 02445868 2003-10-10
WO 02/082990 PCT/US02/09469
tolerance, component tolerance, power levels, etc. In addition, an outlier can
occur if
the composition or concentration of the sample is different than the
composition or
concentration range of the samples used to build the calibration model. Any
outliers
or bad scans will be deleted and the remaining good spectra are averaged
together to
produce an average single beam spectrum for the measurement. The average
single
beam spectrum is then preferably converted to absorbance by taking the
negative base
logarithm (1og10) of the spectrum. The absorbance spectrum is then preferably
scaled by a single beam spectrum to renormalize the noise. The resulting
scaled
absorbance spectrum will then have calibration maintenance and/or calibration
to transfer algorithms applied to it. Calibration maintenance techniques are
discussed in
detail below and in commonly assigned U.S. Patent Application Serial No.
09/832,608, filed on the same date herewith and entitled "Optically Similar
Reference
Samples and Related Methods for Multivariate Calibration Models Used in
Optical
Spectroscopy", the disclosure of which is incorporated herein by reference.
Calibration transfer techniques are disclosed in commonly assigned U.S. Patent
Application Serial No. 09/563,865, filed May 3, 2000, entitled "Method and
Apparatus for Spectroscopic Calibration Model Transfer", the disclosure of
which is
incorporated herein by reference. Finally, a tailoring algorithm such as that
disclosed
in U.S. Patent No. 6,157,041 is applied to the spectrum to remove inter-
patient
2o variation. After the tailoring step, outlier detection can be performed on
the spectrum
to check the consistency of the spectrum with the spectra used to generate the
multivariate calibration. If the spectrum is consistent with the multivariate
calibration
spectra, final regression coefficients of the calibration model are applied to
the
spectrum to produce a glucose prediction. In preferred embodiments, the
glucose
concentration value from the tailoring spectrum is added to the predicted
glucose
value to produce the actual glucose concentration for the subject.
To better appreciate the benefits afforded by the calibration maintenance
subsystem 300, it is useful to analytically review the problem at hand. The
problem
solved by the calibration maintenance subsystem is the difficulty in
maintaining a
multi-wavelength calibration model for quantitatively measuring the
concentration of
analytes whose spectral absorption is much smaller than that of the gross
sample
spectrum. The cause of the failure of a spectrally dissimilar reference sample
to
maintain calibration under these conditions can be described analytically as
shown
-51-
CA 02445868 2003-10-10
WO 02/082990 PCT/US02/09469
below.
It has been shown in the literature that photometric inaccuracies will be
present even in an ideal instrument of finite resolution where all sources of
non-
linearity (detector response, stray light, etc.) have been removed. See, for
example, R.
J. Anderson and P. R. Griffiths, Analytical Chemistry, Vol. 47, No. 14,
December
1975; and R. J. Anderson and P. R. Griffiths, Analytical Chemistry, Vol. 50,
No. 13,
November 1978. This inherent inaccuracy is caused by the finite resolution of
the
instrument (grating spectrometer or FT interferometer) because a spectrum
produced
by an instrument with finite resolution will be the true sample spectrum
convolved
with the instrument line shape (ILS) (for a.grating spectrometer, the ILS is a
function
of the entrance and exit slit widths and for an FT interferometer, the ILS is
a function
of the instrument self apodization and the apodization function used in
performing the
Fourier transform). One can think of the convolution process as a distortion
of the
true spectrum at a particular wavenumber that is dependent on all other
spectral
intensities within the spectral bandpass of the instrument. Mathematically
this can be
written as Equation (10):
Eq. (10) T"(v;)= ~~(v -v;)e-"~''>~dv
where Ta( v; ) is the measured (or apparent) transmission at a particular
optical
frequency, v; , a defines the ILS (or apodization), K(v; ) is the absorption
coefficient
of the species being observed and l is the pathlength through the sample. A
conclusion drawn from the Griffiths paper is that this apodization induced
distortion
causes significant deviations from Beer's law when the true absorbance of a
peak
exceeds 0.7 AU.
The referenced literature also shows, and it can be inferred from Equation
(10), that deviations from Beer's law are also a function of the instrument
resolution
relative to the narrowness of the spectral line being measured. A quantity
called the
resolution parameter, p, is defined as the ratio of the instrument resolution,
R, to the
full-width-half height (FWHH) of the spectral band of interest as set forth by
Equation ( 11 ):
Eq. (11) p=RlFWHH
The effect of p on photometric accuracy can be understood in the limit by
examining Equation (10). If the ILS is thought of as a Dirac-delta or impulse
function
-52-
CA 02445868 2003-10-10
WO 02/082990 PCT/US02/09469
(i.e., perfect instrument resolution), then the ILS convolution in Equation
(1) yields
the absorbance term independent of ILS, in other words the true absorbance
spectrum
is measured if the instrument operates with infinite resolution. On the other
hand, if
the absorbance term is thought of as a delta function, we are left with only
the ILS
centered at the discrete wavelength where the absorption line occurs. One can
then
summarize from the referenced literature that photometric inaccuracy due to
apodization is a function of both p and the spectral absorbance of the sample
as set
forth in Equation (12):
Eq. (12) Error = f {p, AT (v)}
t o where AT (v) is the true absorbance of all absorbers in the sample.
It will be shown below that when there are different absorbers in the sample
and background (for example, liquid water, glucose and water vapor in the
sample
and only water vapor in the background), the background usually does not
capture a
system perturbation in the same way that the sample will record the same
perturbation. The strategy for using a background in spectroscopy is to
capture and
correct for instrumental or environmental variations so that the true
absorbers in the
sample can be identified. If the coefficients of absorption are included for
all
absorbers in the system, Equation (10) can be rewritten to represent the
measured
transmission of any sample in any environment. For the particular case of
glucose in
water in the presence of water vapor, Equation (10) becomes Equation (13):
-K (v)! -K (v)l -K (v)! -K (v)!
Eq. (13) TSA(v )= j°°6(v -v )e r ~e g se
r o r
where the subscript "I" represents instrument, "g" represents glucose, "w"
represents
liquid water and "v" represents water vapor present in the measuring
environment. A
typical background sample spectrum containing no glucose or water would be
written
as Equation ( 14):
- K (v)! - K (v)!
Eq. (14) T,A(vl)= jo Q(v -vl)e
where the background spectrum measures the instrument absorbance and the water
vapor absorbance. The background corrected sample spectrum would be written as
Equation (15):
-53-
CA 02445868 2003-10-10
WO 02/082990 PCT/US02/09469
.) J~6(v-v)e K'(v)l'e Kg(v)lge KW(v)lwe Kv(v)lv
o ;
Eq. (15) ~ - -K ~~)l -K ~~)l
Th (V1 ) j0 6(V - V )e I I a v v
As in Equation ( 10), the spectral intensity at each optical frequency depends
on the spectral intensity of the adjacent frequencies measured by the
instrument, the
absorption terms for the instrument e-"'~"~r' and the water vapor e-
"°'~"~'° do not
cancel in Equation (15), resulting in a background corrected spectrum that is
not equal
to the true absorbance spectrum of the measured analytes. The only way these
terms
will ever cancel is if all other absorption terms that are not common to both
sample
and background are negligible or do not vary with optical frequency. Equation
(15)
can be expanded further to encompass any instrumental or environmental
perturbation
from the calibration state as set forth by Equation (16):
Eq, ( 16)
-K (v)f -K (v)1 -K (v)! -K (v)! -K (v)!
TA(v>J°°~(v-v>e'le8gewwevveoo
5+0 l o
T A V ao Klw)l' Kv(v)lv KQ(v)lQ
h+o ( ; ) jo ~(v - ~~ )e a a
where the subscript 4 represents the absorption due to the perturbation.
Maintenance
of calibration could be achieved using any reference sample if the ratio in
Equation
(16) were equal to the ratio in Equation (15). However, as long as the unknown
sample and reference sample have different spectral characteristics, Equation
(16) will
never identically equal Equation (15). The two equations become more similar
as the
reference sample begins to absorb more like the prediction sample.
In summary, a similar background is required when the system perturbation is
not well modeled and the perturbation is not negligible in magnitude compared
to the
absorbers in the prediction sample, or when the spectral resolution (full
width at half
height) of the perturbation is much less than the instrument resolution.
Another way
to write this requirement is in terms of the final regression coefficients
from a
multivariate calibration model acting on the spectrum of the unknown sample.
This
can be written as Equation (17):
Eq.(17) F~(So+SN~+s)~F'S",L «F~E
where F represents a vector of final regression coefficients, So represents
the true
-54-
CA 02445868 2003-10-10
WO 02/082990 PCT/US02/09469
spectrum, SNP represents the distorted, or non-linear, part of the measured
spectrum
due to the finite resolution of the instrument and s represents the spectral
error due to
sources of random error. In other words, the product of the final regression
coefficients and the non-linear portion of the measured spectrum caused by a
system
perturbation should be much less than the product of the final regression
coefficients
and the random error present in the measured spectrum so that the error term
due to
the distorted part of the spectrum is small and prediction performance is
maintained.
There are several different types of instrumental and environmental variation
which may affect the prediction capability of a calibration model. It is
possible, and
highly desirable to reduce the magnitude of the effect of instrumental and
environmental variation by incorporating this variation into the calibration
model. It
is difficult, however, to span the entire possible range of instrument states
during the
calibration period. System perturbations can result in the instrument being
operated
outside the space of the calibration model. Measurements made while the
instrument
is in an inadequately modeled state will exhibit prediction errors which
render the
measurement useless. In the case of in vivo optical measurements, these types
of
errors may result in erroneous medical information being used for the
treatment of
patients. These errors are obviously unacceptable in a commercial device.
Some examples of problematic instrument and environmental variation
include, but are not limited to: changes in the levels of environmental
interferents
such as water vapor or COZ gas, changes in the alignment of the instrument's
optical
components, fluctuations in the output power of the instrument's illumination
system,
and changes in the spatial and angular distribution of the light output by the
instrument's illumination system. It will be shown through both simulated and
empirical results that a spectrally similar background sample provides
improved
capability to correct for these types of variations.
Correcting for any of the classes of instrument and environmental variation
requires that the background sample have matched spectral absorption features
with
the sample of interest. It has already been shown mathematically that the
finite
instrument resolution causes the effect of different instrument states to
depend on the
spectral absorption characteristics of the sample (Equation (16)). Another way
of
stating this problem is that the optical effects of instrument and
environmental
variation should ideally be identical in both the background sample and the
sample of
-55-
CA 02445868 2003-10-10
WO 02/082990 PCT/US02/09469
interest. Taking the derivative of Equation (13) with respect to water vapor
absorption yields Equation (18):
dTSA(V ) -K (v)! -K (~)I -K (v)f -K (v)!
Eq. (18) ' - jo -lV~(v -v )e »e g $e w W2 ~ °dv
dKV (v )
It is apparent from Equation (18) that the spectrum of water vapor is modified
by the
spectral shape of all compounds in the sample. This relationship holds true
for any
system perturbation which causes a change in the optical appearance of a
sample's
spectrum.
Simulated results are presented for the effects of water vapor level variation
on
the in vitro measurement of glucose in reflectance using scattering media.
Actual
l0 spectra from 98 glucose solution samples were collected using an FTIR
spectrometer
operated at 16 cm' resolution. The samples contained variable levels of
scattering
media to simulate optical pathlength distributions similar to those seen in
living
tissue. For comparison purposes, spectra from two different types of
background
samples were also collected: a similar background with matched optical
properties
and an air background (i.e., an integrating sphere placed over the reflectance
sampler).
High-resolution water vapor spectra (obtained at 1 cm ')were then artificially
added to
the solution and background spectra in order to simulate varying water vapor
levels.
Simulations were run on the resulting spectra in order to model the effects of
finite
instrument resolution on the added interferents. The sample spectra were then
ratioed
to the background sample spectra in an attempt to remove the effects of the
varying
water vapor levels. Figure 34 shows the residual spectral effects after this
background
correction was performed. The two plots in Figure 34 show the remaining
spectral
differences when the ratioed spectra with added water vapor are subtracted
from the
original ratioed spectra without added water vapor. As can be seen in the
figure, the
spectrally similar background reduces the effects of the water vapor
interferent by a
significant amount. A calibration developed at a constant water vapor was used
to
predict on the sample spectra. As stated above, the sample spectra were
ratioed
against a similar background with matched optical properties and an air
background.
The prediction errors for the sample data with the air background ratio were
inflated
over the sample spectra with a similar background by approximately
mg/dl using a calibration model with 20 factors. This simulation clearly
-56-
CA 02445868 2003-10-10
WO 02/082990 PCT/US02/09469
demonstrates the advantage of using a similar background for correcting for
even
simple system perturbations.
Many of the types of instrument variation involve interactions with the
sampling geometry of the sample. These types of instrument variation include
changes in alignment of optical components and changes in angular and spatial
distribution of the output light from the instrument's illumination system.
These
types of variations may be caused by a number of physical mechanisms,
including:
aging of optical mounts, thermally induced mechanical deformations of optical
mounts, aging of light sources, or variations in routinely replaced components
such as
t 0 light bulbs. In order to be effective, the background sample must preserve
the same
mapping of angular and spatial distribution of light as the sample of
interest. This
requires that the background sample interact with the sampling optics of the
instrument in a manner that mimics the interaction of the sampling optics with
the
sample of interest.
An additional constraint which is generally required for successful
calibration
maintenance is that the overall intensity of light seen at the optical
detector elements
be closely matched for both the background sample and the sample of interest.
This
constraint helps to correct for non-linearities in the instrument's optical
measurement
characteristics. Again, this constraint is included in the overall definition
of similar
spectral radiance.
Empirical results are presented for an actual, in vivo study measuring blood
glucose concentrations non-invasively. The study was intentionally designed to
include several of the types of instrument and environmental variation
previously
discussed herein. Specifically, ambient relative humidity, ambient
temperature, and
illumination power were all varied during the prediction phase of the study.
This
study was intended as a proof of concept for using a similar background
reference
sample for calibration maintenance. The study was limited to five subjects
over a
period of two days. Prediction errors were determined by comparing non-
invasive
results to standard capillary blood glucose reference measurements. Figure 35
3o demonstrates the superior ability of the similar background to maintain the
prediction
performance of the calibration in the presence of instrument and environmental
variation by generating a lower standard error of prediction and by generating
the
smoothest decreasing SEP curve. Figure 36 shows the spectral differences
between
-57-
CA 02445868 2003-10-10
WO 02/082990 PCT/US02/09469
the mean human tissue spectrum and the two different background sample types
being
tested in the study.
Refer now to Figure 37 which illustrates a flowchart for determining spectral
similarity. The spectral similarity of an optically similar reference sample
to the test
sample of interest may be quantified with respect to spectral absorbance,
mapping of
input to output light spatial distribution, and mapping of input to output
light angular
distribution.
There are two metrics that may be used to calculate the similarity of a
particular background sample to the sample of interest with respect to
spectral
absorbance. The first involves comparing the optically similar reference
sample in
question to the test samples, typically tissue spectra, where all of the
background and
tissue spectra were collected near in time, as set forth in Equation 19:
~1/ _ \'z
~~X~l Zfl
Eq. (19) Spectral Similarity = ' ~ ' ~
1
where X is a set of tissue pseudo-absorbance spectra and z is any mean
background
pseudo-absorbance spectrum for the time in question. (The pseudo-absorbance
spectrum is defined in Equation 20). I refers to the total number of data
points
collected in the wavelength region of interest (or the total number of
discrete
wavelengths chosen for analysis), and J refers to the total number of tissue
spectra
collected in this period of time. The average value of the spectrum should be
subtracted from all wavelengths before calculating the metrics. This step
ensures that
the spectral shapes of the background and tissue are correctly compared
without being
influenced by a uniform, DC energy offset or baseline shift.
Eq. (20) Pseudo-absorbance = -logio(I)
where I is a single beam intensity spectrum.
Quantifying the degree of spectral similarity can be done through a
straightforward process involving a comparison between the spectra in which
the
analyte is to be measured and the optically similar reference sample. The
flowchart of
Figure 37 summarizes this process. The process involves the following steps:
-58-
CA 02445868 2003-10-10
WO 02/082990 PCT/US02/09469
Step # 1: Define or establish the representative measurement sample. A
representative measurement sample is a sample that is representative of
samples on
which the optical measurement system will be making subsequent measurements.
If
the application is a single patient with diabetes, then a representative
measurement
sample would be a sample at the sampling location on that patient. If the
application
group is a heterogeneous group of subjects, then the representative
measurement
samples would be an appropriate group of subjects on which the monitor would
be
subsequently used. If the measurement group were other sub-populations of
subjects,
then the representative measurement samples would be obtained from the sub-
to population. For example, in patients with renal disease, the representative
measurement population would be patients with renal disease.
Step #2: Obtain spectral measurements from the representative measurement
samples. In all cases, multiple measurements with reinsertions of the tissue
into the
sampling device should be made. In the case of a single subject application,
at least
ten spectral measurements should be made. In the case of a heterogeneous
patient
population, the representative measurement samples should be a reflection of
the
subjects that will subsequently use the monitor. In the example below, 30
subjects of
varying ages, gender, ethnicity and body mass index were used. The spectral
measurements should be made in a manner consistent with use of the monitoring
device. These spectra are hereafter referred to as the representative
measurement
spectra.
Step #3: Calculate a mean pseudo-absorbance spectrum from the spectra
obtained from the representative measurement samples. The resulting spectrum
is
hereafter referred to as the mean representative measurement spectrum.
Step #4: Obtain spectral measurements from the optically similar reference
sample. In all cases, multiple insertions and measurements of the optically
similar
reference sample should be made. It is preferred that at least 10 measurements
should
be made. These spectra are hereafter referred to as the optically similar
reference
sample spectra.
Step #5: Calculate a mean pseudo-absorbance spectrum from the optically
similar reference sample spectra. The resulting spectrum is hereafter referred
to as the
mean optically similar reference spectrum.
Step #6: Use the representative measurement spectra and the mean
-S 9-
CA 02445868 2003-10-10
WO 02/082990 PCT/US02/09469
representative measurement spectrum with Equation ( 19) to calculate a
spectral
similarity value. The resulting value will hereafter be referred to as the
spectral
similarity measure #1.
Step #7: Use the representative measurement spectra and the mean optically
similar reference spectrum with Equation (19) to calculate a spectral
similarity value.
The resulting value will hereafter be referred to as the spectral similarity
measure #2.
Step #8: Ratio the two spectral similarity values to obtain a spectral
similarity
ratio. Spectral similarity ratio =
Spectral Similarity Measure #2
Spectral Simiarity Measure #1
Equation (19) is a mean sum of squares (SS) metric, and it may be calculated
for different wavelength regions. It may be calculated for a continuous
spectral
region, for discrete wavelengths, for combinations of two or more discrete
wavelengths (which may or may not have been found using a variable selection
algorithm), or for selected regions of a spectrum.
Table 5 below shows the values that were calculated for Equation (19) for a
representative group of subjects for three levels of similarity: acceptable,
preferred,
and ideal. The spectral regions and discrete wavelengths for which these
values were
calculated are also indicated in the table. The discrete variables used in
this case are
glucose important wavelengths and are specified in Table 6. The more similar
the
background is to the tissue spectra, the smaller the SS value becomes. Table 7
shows
the same spectral similarity metrics when the representative sample is a
single subject.
TADTL' C
Level Example
of
SimilarityBackground Spectral Similarity
Ratio
Sam 1e
Full Spectrum Discrete Absorbance Troughs
Variables
(4,200crri'-7,200crri'~ (4,440crri'-4,800cm''
&
5,400crri'-6,400cm''~
AcceptableScattering 30 30 30
Solutions
PreferredTransmission10 10 10
Cell
Ideal Mean Subject1 1 1
Spectrum
-60-
CA 02445868 2003-10-10
WO 02/082990 PCT/US02/09469
TABLE 6
Glucose-important variables (cm-') used in spectral similarity calculations
4196 4451 4883 5369 5731 6163 66
4227 4459 4922 5392 5755 6187 69
4273 4497 5014 5454 5785 6287 69
4281 4528 5091 5469 5809 6318 70~
4304 4559 5176 5477 5839 6349 70
4320 4613 5230 5515 5893 6449 70~
4335 4690 5269 5585 5924 6472 72
4366 4775 5299 5623 5947 6557
4389 4829 5315 5662 6001 6595
4436 4860 5338 5701 6094 6673
TABLE 7
Level Example
of Background Spectral Similarity
SimilaritySam 1e RatlO
Full Spectrum Discrete Absorbance Troughs
(4,200cm-'-7,200crri'~Variables (4,440crri'-4,800crri'
&
5,400crri '-6,400crn
'~
AcceptableScattering 1500 1500 7500
Solutions
PreferredTransmission1000 1000 2500
Cell
Ideal Mean SubjectI 1 1
Spectrum
If an analyte is to be determined, it is helpful if the background matches
different regions and/or discrete wavelengths of the spectrum that are
important in the
determination. In other words, if spectral region A is important in
determining the
analyte, then the background should match the tissue especially well in region
A. On
the other hand, region A may not be at all important in determining a
different
analyte, in which case the spectral match would be less important for that
region.
When an analyte is to be determined, therefore, another metric must also be
defined
that is specific to the analyte in question, as shown in Equation (21) below.
~b~ * 'Yti - b~ * Zr
Eq. (21 ) Regression weighted Similarity = ' ' ' '
I
where b is the regression vector for the analyte being determined, normalized
to length one, and the other symbols have the same meanings as in Equations
(19) and
-61-
CA 02445868 2003-10-10
WO 02/082990 PCT/US02/09469
(20). This regression vector may be calculated via any linear or non-linear
regression
method, where partial least squares is an example of such a method. It may be
thought of as the analyte's calibration model, and it weights the absorbances
at
different wavelengths based on their importance in predicting the analyte
characteristic of interest.
The process for quantifying the degree of spectral match is the same except
that Equation (21) is used instead of Equation (19). The 8-step process is the
same
with a single substitution of the equations. The resulting ratio will
hereafter be
referred to as the regression weighted spectral similarity ratio.
1 o Table 8 shows results from Equation (21 ), calculated for a representative
group of subjects when the analyte of interest was glucose; however, these
values may
also be calculated for any component in the sample that is to be determined.
It can be
seen that the ideal background has a much smaller SS value than the acceptable
background, since it is more similar to tissue spectra collected during the
same period
of time. The more similar the background is, the smaller the SS value will be
for
Equation (19) or Equation (21) or both, for any spectral region or any
combination of
regions or any discrete wavelength or combination of discrete wavelengths.
Table 9
shows the same spectral similarity metrics when the representative sample is
an
individual subject. In an analysis where no specific characteristic (e.g.,
concentration)
of the sample is being measured, then Equation (19) is sufficient. When a
specific
characteristic is to be determined, however, both Equations ( 19) and (21 )
may be
evaluated.
If the spectral similarity ratio for the optically similar reference sample
value
is less than 30, then the optically similar reference sample is to be
considered an
acceptable optically similar reference sample. If the spectral similarity
ratio is less
than 10, then the optically similar reference sample is to be considered a
preferred
optically similar reference sample. If the spectral similarity ratio is less
than or equal
to 1, then the optically similar reference sample is to be considered an ideal
optically
similar reference sample. The metrics must be calculated for the analyte being
determined and for the wavelengths/wavelength regions being used to ensure the
validity of the similarity determination.
-62-
CA 02445868 2003-10-10
WO 02/082990 PCT/US02/09469
TABLE 8
Level Example Regression
of Weighted Spectral
Similarity
Ratio
SimilarityBackground
Sample
Full Spectrum Discrete Absorbance Troughs
Variables
(4,200crri (4,440crri ~-4,800cm-~
~-7,200crri &
~~
5,400crri ~-6,400crn
~~
AcceptableScattering 30 30 30
Solutions
PreferredTransmission10 10 10
Cell
Ideal Mean Subject1 1 1
Spectrum
TABLE 9
Level Example Regression
of Weighted Spectral
Similarity
Ratio
SimilarityBackground
Sam lc
Full Spectrum Discrete Absorbance Troughs
Variables
(4,200cm-~-7,200crri (4,440crri ~-4,800crri
~~ ~ &
5,400crri'-6,400crri
~~
AcceptableScattering 4500 3000 9000
Solutions
PreferredTransmission1500 2500 3000
Cell
Ideal Mean Subject1 1 1
S ectrum
The similarity of the mapping function of light spatial distribution and light
angular distribution can also be quantified for optically similar reference
samples.
The preferred method for quantifying the similarity of these properties is to
examine
the image of the output light beam, which is produced after the light has
passed
through the sampling optics and the sample of interest. For purposes of this
discussion, the light beam is assumed to be circular in cross-section, but the
similarity
metrics can be extended to any geometry of beam (e.g., the output of a square
cross-
section light guide). The boundary of the light beam passing through the
sample is
defined as the points at which the light intensity falls to 1/ez times the
peak light
intensity.
The image of the output beam is measured using any standard intensity
mapping scheme (e.g., scanning a single pixel detector or using a CCD camera)
and
using a goniometer. This allows both the spatial and angular distributions of
the light
beam to be determined. Measurements should be made for both the sample of
interest
and for the similar background being quantified. In order to standardize the
calculation for many applications, the image should be divided into
approximately
one hundred equally sized "bins" (or squares), with ten bins across the
diameter of the
-63-
CA 02445868 2003-10-10
WO 02/082990 PCT/US02/09469
image. This can be accomplished by either measuring the beam in a ten by ten
grid or
by sampling at a finer spacing and then averaging the data. The spatial and
angular
distributions for the sample of interest are then subtracted from the
corresponding
distributions of the background sample. The resulting images represent the
similarity
level for the background and the sample of interest. In order to quantify this
similarity, all of the data points in the image are put into a vector for
easier
calculation, and the vector is normalized so that its length equals 1. This is
achieved
by dividing each data point in the image by the 2-norm ( xllz ), which is
equivalent to
the Euclidean distance of the vector.
»z
n 1
Eq. (22) Ilxllz =~~Ix;lz~
r- l~
where x is the vector of the difference image and n is the number of data
points in that vector.
The normalization step ensures that the magnitude of every difference-image
is comparable. Following the normalization step, the standard deviation of the
normalized image vector is calculated, and this metric is an indication of how
similar
the background and sample images are. Table 9 shows the standard deviations
that
are ideal, preferred and acceptable for the spatial distribution of similar
backgrounds.
Table 10 shows the same metrics for angular distribution.
TABLE 10
Levcl of SimilarityS atial Similarity Metric
(Standard Deviation
Acce table 0.079
Preferred 0.052
Ideal 0
TABLE 11
Level of SimilarityAngular Similarity Metric
(Standard Deviation)
Acceptable 0.051
Preferred 0.036
Ideal 0
As stated previously, the optically similar reference sample is used to
capture
-64-
CA 02445868 2003-10-10
WO 02/082990 PCT/US02/09469
the current instrument state such that the effect of instrumental and
environmental
variation on prediction capability can be eliminated. There are several
different
methodologies by which the reference spectrum can be used to correct for
instrumental and environmental variation. These spectral correction methods
include,
but are not limited to those described below.
These correction methodologies can be classed into two broad categories:
methods which modify the spectrum of the test sample and methods which modify
the
calibration model. The simplest and preferred method modifies the spectrum of
the
sample of interest by subtracting the optically similar reference spectrum in
1 o absorbance space. The reference spectrum may be the most recently
collected
optically similar reference spectrum, or it may be an averaged spectrum
containing
information from several background samples collected at different points in
time.
One preferred method of averaging is to exponentially time weight the
background
reference spectra and average them together. The exponentially time weighted
method allows for the optimization of achieving high signal-to-noise-ratio
correction
data and capturing the current instrument state.
The second class of background correction methodologies consists of actually
modifying the multivariate calibration model. One simple method is to simply
include the reference spectra with the original calibration samples and rerun
the
regression algorithm on the combined data set. A preferred method is to
include only
the spectral variation from the background reference sample in the calibration
model.
This method consists of taking multiple background reference samples during
the
calibration period, finding the mean of the background reference sample
spectra
collected during the calibration period, subtracting (in absorbance space)
this mean
background reference spectrum from subsequent background reference spectra
collected prior to making an actual prediction, adding this spectral
difference back to
the calibration samples, and rerunning the regression algorithm to create an
updated
calibration model. In an alternative method, a PCA decomposition is run on the
spectral differences seen in the background and a limited number of
eigenvectors is
used to add this spectral variation back to the model.
Refernng now to Figures 38-55, several embodiments of similar background
devices for use in a calibration maintenance subsystem 300 of the present
invention are
depicted. Each of the similar background embodiments discussed may be used in
-65-
CA 02445868 2003-10-10
WO 02/082990 PCT/US02/09469
combination within the present system. These specific backgrounds are intended
for
applications, such as glucose measurement, in which analyte concentrations are
to be
measured in vivo using reflection spectroscopy. Specifically, these optically
similar
reference samples are designed to match the optical properties of tissue at
selected
wavelengths in the near infrared region including 1.2 to 2.5 pm (8000 to 4000
wavenumbers). In this optical region, water is the dominant absorbing
component
contained in the tissue. Each of the following backgrounds is designed to
provide
multiple optical pathlengths through water in order to mimic the spectrum of
living
tissue. Based upon Monte Carlo simulations of light propagation through
scattering
media where the scattering properties match those of tissue, a distribution of
pathlengths
can be calculated. The results can be defined by a mean pathlength with a
standard
deviation and skew to the distribution. The distribution skew is toward longer
pathlengths. Typically the standard is less than or equal to the mean. For
example, if the
mean pathlength is lmm, then the standard deviation of pathlengths is about
lmm as
well.
In developing and assessing reference samples, is important to have a metric
that
enables one to rapidly and easily determine if multiple optical pathlengths of
water are
created by the reference sample. One simple way is to fit the absorbance
spectrum of the
reference sample with three terms: 1) an offset, 2) a slope with wavenumber,
and 3) the
pure component of water. The pure component of water is simply the absorbance
of
water at a fixed pathlength. Mathematically stated:
Eq. (23) A(x) = bo + b,x + blPC(x)
The three fitting parameters are estimated using a least squares fit of the
above equation
to the absorbance spectrum (which has no instrument line shape in it).
Following fitting
of the above parameters the spectral residual is determined. The spectral
residual is
determined by subtracting the above equation from the absorbance spectrum of
the
reference sample. The final step is to compute the root-mean-squared (RMS)
error
across the spectrum.
Eq. (24) Multipath - RMSError = 1 ~ (A; - A; )z
N ,_,
The multipath RMS error is greater when multiple pathlengths of water are
present in the
reference sample. A single pathlength sample will results in a smaller RMS
error then a
-66-
CA 02445868 2003-10-10
WO 02/082990 PCT/US02/09469
two pathlength sample, etc. A simple threshold value calculated in absorbance
units can
be used to determine if multiple pathlengths of water are present. The
threshold is
sensitive to the spectral region used. For, example the threshold would be
smaller if the
region used for analysis had smaller absorbance bands.
Several novel designs are presented for achieving the multiple water
pathlengths required to match the spectrum of tissue. Most embodiments consist
of
an optical interface (e.g., an MgF2 window) which is highly transmissive in
the optical
region of interest, an optical sampling compartment containing water, and
diffusely
reflective or scattering media. For each background design, either
experimental or
simulated data are presented showing how close a spectral match was achieved
between the background and human tissue.
The inventors recognize that in addition to including the dominant absorbing
species (e.g., water), the background sample may also include the actual
analyte of
interest (e.g., glucose, ethanol, urea, etc.). By including various analytes,
the
background sample may be used as a quality control or calibration sample in
addition
to its primary use in the maintenance of calibration.
With specific reference now to Figures 38 and 39, a cone background device
300 is illustrated in accordance with an embodiment of the present invention.
Figure
38 illustrates representative ray-traces in the cone background device 301 and
Figure
39 illustrates a partial cut-away view of the cone background device 301. Cone
background device 301 utilizes a conical geometry in order to help achieve
some of
the required performance specifications for a background similar to human
tissue. It
includes an optically transparent cone 330 such as a fused silica cone, a thin
layer of a
constituent 320 such as water, collagen or lipid, and a diffusing cone 310
which
provides approximately Lambertian reflection of the incident radiation.
The cone geometry of device 301 provides excellent stray signal suppression
as best seen in the ray trace shown in Figure 38. The useful signal is
transmitted
through the hollow portion 340 of the cone, and then through the constituent
layer
320. The amplitude of the signal that is reflected back to the collection
system
3o without undergoing the desired interaction is reduced significantly due to
several
Fresnel reflection losses. The useful radiation undergoes a randomized
reflection
from the diffusing cone 310 surface, and passes back into the inner cone
volume 340,
either to be collected or to undergo yet another pass through constituent
layer 320 and
-67-
CA 02445868 2003-10-10
WO 02/082990 PCT/US02/09469
random reflection. Figure 40 shows a graph of spectral response demonstrating
the
spectral match between the tissue sample and the cone device 301.
The cone reference sample, as designed, contains a distribution of optical
pathlengths through water. This distribution of water pathlengths was
confirmed by
calculating the multipath RMS error in the manner explained above. The
multipath
RMS error was calculated over the region of 4200 - 7200 cm' and generated a
value
of 0.18 absorbance units.
Refer now to Figure 41, which schematically illustrates a scattering solution
background device 350 in accordance with another embodiment of the present
invention. The scattering solution background 350 includes a container 352
that is at
least partially optically transparent adjacent the tissue sampling 12 and
collection
subsystem 14. The scattering solution background also includes a scattering
solution
354. Scattering solution 354 comprises a plurality of reflective beads
disposed in a
liquid or gel constituent such as water, collagen or lipid. The random
pathlength
distribution of the scattering solution 354 is provided by the reflective
beads, which
may comprise, for example, reflecting polystyrene microbeads (0.298pm
diameter,
6600 mg/dl concentration) in aqueous solution. The particle reflectance, size
and
concentration of the reflective beads in the scattering solution 354 are set
in order to
create the desired match to tissue for the solution 354. Preferably, the
solution 354 is
mechanically agitated by agitator 356 in order to prevent settling of the
reflective
beads. Figure 42 shows a graph of spectral response demonstrating the spectral
match
between the tissue sample and the scattering solution background 350.
Refer now to Figures 43 and 44, which schematically illustrate alternative,
roof background devices 360 in accordance with yet another embodiment of the
present invention. The roof background devices 360 make use of an optically
transparent layer 362 such as a flat window comprising fused silica or MgF2, a
roof
like reflective diffuser 364, and a constituent layer 366 disposed
therebetween. The
optically transparent layer 362 may be used to surround and contain the
constituent
layer 366. The constituent layer 366 may comprise water, collagen, lipid, or a
mixture thereof. The diffuser 364 may include an irregular or otherwise non-
planar
surface such as roughened aluminum or stainless steel, or Spectralon of the
proper
reflecting characteristics. Light passes from the tissue sampler 12 through
the
window 362 and constituent layer 366 to the diffuser 364. After undergoing a
random
-68-
CA 02445868 2003-10-10
WO 02/082990 PCT/US02/09469
reflection from the diffusing surface, the light passes back through the
constituent
layer 366 through the window 362 to the collection system 14. Figure 44
further
illustrates the roof background device 360 disposed on a sampler interface 368
to
which a cluster of fiber optic bundles 370 is joined. Each fiber optic bundle
preferably includes an arrangement of a plurality of input and output fiber
optic
cables.
The parameters of the device 360 may be adjusted so that the collected light
has similar spectral radiance to light that has interacted with tissue. Figure
45 shows a
graph of spectral response demonstrating the spectral match between the tissue
t 0 sample and the roof background 360. The angles of the diffusing surface
and the
thickness of the water path were adjusted in simulation to achieve the
theoretical
result shown in Figure 45. The spectral response of this system was calculated
from
the pathlength distribution and the known absorption spectrum of water. It is
important to note that the spectral match shown depends on adjusting the mean
energy
of the background to match that of tissue.
Refer now to Figure 46, which schematically illustrates a mufti-layer
background device 401 in accordance with a further embodiment of the present
invention. The mufti-layer background device 401 is based on a match at
discrete
pathlengths to tissue. The mufti-layer device 401 includes an optically
transparent
window 410 such as an MgF2 window, a plurality of optical splitting layers 420
such
as partially reflecting quartz microslides, and a reflecting layer or surface
430 such as
a gold mirror. Multiple constituent layers 440, such as water, are disposed
between
the window, 410, the optically transparent layers 420, and the reflective
layer 430.
The optically transparent window 410 may be used to surround and contain the
constituent layers 440. The diameter of the mufti-layer background 400 is
chosen to
match the output area of the sampling optics for a given device.
Incident light from the tissue sampler 12 is broken up into components with
discrete pathlengths by the optical splitting layers 420. The reflectance of
the optical
splitting layers 420 and the thickness of the constituent layers 440 may be
adjusted in
order to achieve the proper distribution of pathlengths in the device 401 so
that a
match to tissue is achieved. Figure 47 shows a graph of spectral response
demonstrating the spectral match between the tissue sample and the mufti-
layered
background 401. For this test, the water layers 440 (labeled A, B, and C) were
sized
-69-
CA 02445868 2003-10-10
WO 02/082990 PCT/US02/09469
as follows: A = 170p,m, B = 205pm, and C = 150pm. The microslide 420 between
layer A and B had 4% reflectance, and the microslide 420 between layer B and C
had
32% reflectance. The gold mirror 430 had approximately 99% reflectance in the
specified wavelength region
Refer now to Figure 48, which schematically illustrates a transmission cell
background device 501 in accordance with yet a further embodiment of the
present
invention. The transmission cell background device 501 also makes use of
discrete
constituent 520 pathlengths to match the pathlength distribution of tissue at
key
points. The transmission cell background device 501 includes an optically
transparent
container 510 such as fused silica windows containing a plurality of spacers
530 such
as MgFz spacers to provide desired pathlengths. The remainder of the container
510
is filled with a constituent 520 such as water. The spacers function to
displace the
water or other constituent, creating a background with several different
length water
paths. Suitable dimensions for the cell spacers are 0.226", 0.216", and
0.197",
1 s respectively. These spacers may be used to create three water layers with
thickness
values of 0.0098", 0.0197", and 0.0393". The diameter of the transmission cell
501 is
chosen to match the output area of the sampling optics for a given device.
Figure 49
shows a graph of spectral response demonstrating the spectral match between
the
tissue sample and the transmission cell background 501. Figure 49 indicates
the
degree of match between the transmission cell (T-Cell) background 501 and the
tissue
sample to be on the order of +/-0.1 absorbance units.
The transmission cell background 501 may be incorporated into a transmission
spectroscopy device by incorporating a second, reflective element (not shown).
The
transmission cell described above is placed into the optical beam of the
spectrometer
in a location such that the light from the sampling optics passes through the
transmission cell before being measured by the optical detector. A diffusely
reflecting material, such as Spectralon, is placed at the tissue sampler
interface in
order to mimic the bulk scattering properties of tissue. This optical setup
allows a
similar background to be constructed that uses discrete water pathlengths in
3o transmission to mimic the optical properties of tissue sampled using
reflection
sampling optics.
The transmission reference sample, as shown in Figure 48, has three different
optical pathlengths. When examined by the multipath RMS error metric over the
-70-
CA 02445868 2003-10-10
WO 02/082990 PCT/US02/09469
region of 4200 - 7200 cm', the magnitude of the residual clearly indicates the
presence of multiple pathlengths through generation of a value of
approximately 0.11
absorbance units.
Refer now to Figure 50, which schematically illustrates a variable height
temporal background device 601 in accordance with another embodiment of the
present invention. The temporal background device 601 includes an optically
transparent layer 610 and a movable diffuse reflector layer 620, such as a
Spectralon.
A constituent layer 630 such as water is disposed between the optically
transparent
layer 610 and the diffuse reflector 620. The optically transparent layer 610
may be
used to contain the constituent layer 630 or a separate container 650 may be
provided
for that purpose.
The temporal background device 601 uses a time-weighted sampling
technique to produce proper throughput at various pathlengths that match the
tissue
path distribution. This, in turn, enables the spectral match to tissue. A
diffuse
reflector 620 (approximately Lambertian high-reflectance material) is used to
provide
return illumination in the form of reflected light and is translated
vertically (as shown
by arrow 640 and labeled h;) to achieve a variable water path. The data
presented
below were generated by varying the height of the Spectralon reflector 620
over the
water layer h; through values ranging from O.lmm to 0.3mm. The diameters of
the
2o MgF2 window and Spectralon reflector are chosen to match the output area of
the
sampling optics for a given device. Thus, the reflecting layer 620 is moved to
a
height corresponding to a given pathlength in the desired distribution, and
light is
subjected to this pathlength and collected for a time proportional to the
weight of the
particular path in the distribution. Upon combination of the time-sampled
data, a
match to the tissue spectrum can be achieved as shown in Figure 51.
Refer now to Figure 52, which schematically illustrates a collagen gel matrix
background device 700 in accordance with an embodiment of the present
invention.
The collagen gel matrix background device 700 includes a container 710 that is
partially optically transparent. A constituent 720 is disposed in the
container and
comprises a collagen gel matrix. The collagen gel matrix may consist of
denatured
porcine collagen in a gel state. Reflectance microbeads may be infused into
the gel to
create a randomized scattering path throughout the volume of the constituent
720. For
example, the collagen matrix 720 may be made from 30% porcine gelatin, 0.8%
2pm
-71-
CA 02445868 2003-10-10
WO 02/082990 PCT/US02/09469
polystyrene beads, and 69.2% water. Figure 53 shows a graph of spectral
response
demonstrating the spectral match between the tissue sample spectrum and the
collagen gel matrix background spectrum 700. The actual gel thickness
presented to
the sampling system was 3.Ocm - 4.Ocm. As can be seen from Figure 53, a close
match to human tissue can be made if the proper preparation of the collagen
gelatin
matrix is carried out, which can be accomplished empirically. It is recognized
that the
gel matrix can be composed of any substance that enables an optically similar
reference sample to be created.
Refer now to Figure 54, which schematically illustrates an animal based
bodily constituent (e.g., bovine tissue) background device 800 in accordance
with an
embodiment of the present invention. The animal based bodily constituent
background 800 includes a container 810 that is at least partially optically
transparent
and an animal (e.g., bovine, porcine) based bodily constituent 820 disposed
therein.
The animal based bodily constituent may comprise an animal bodily tissue
(e.g.,
skin), an animal bodily fluid (e.g., blood) or other animal based biological
constituent.
Through the use of a section of bovine tissue, a relative match to human
tissue is
readily attained. The bovine tissue section may be doped with analytes in
order to
simulate various in-vivo concentration levels for humans. Because the spectral
features of the bovine tissue section are similar to those found in human
tissue, it
2o provides a good formulation of a tissue similar background for use in
calibration
maintenance. Figure 55 shows a graph of spectral response demonstrating the
spectral match between the tissue sample and the bovine tissue background 800.
For
the data shown in Figure SS, 2cm x 4cm rectangular sections of bovine collagen
tissue
approximately 1 cm thick were used. The bovine collagen sample comprised a
section
of cowhide immersed in distilled water to prevent dehydration.
In use as a subsystem of the present invention, any of the calibration
maintenance devices having similar backgrounds discussed above is optically
coupled
(e.g., positioned adjacent) to the illumination source and irradiated with
multiple
wavelengths of radiation from the illumination source. The collection system
is used
to collect radiation that is not absorbed by the reference sample. The
collected
radiation is then used to determine the intensities of the non-absorbed
radiation at
each of the multiple wavelengths to generate a reference spectrum. A new
calibration
model can be created or a pre-existing calibration model can be modified based
on the
-72-
CA 02445868 2003-10-10
WO 02/082990 PCT/US02/09469
reference spectrum to account for instrument and environment variations.
Alternatively, the reference spectrum is simply used to alter a spectrum of a
test
sample to account for instrument and environment variations without altering
an
existing model.
After the calibration model has been created or modified, a test sample of
interest is optically coupled (e.g., positioned adjacent) to the tissue
sampler. The test
sample (e.g., human tissue or blood) is irradiated with multiple wavelengths
of
radiation from the tissue sampler. Radiation that is not absorbed by the test
sample is
collected by the tissue sampler collection system. The collected radiation is
then used
to determine the intensities of the non-absorbed radiation at each of the
multiple
wavelengths to generate a test spectrum corresponding to the test sample of
interest.
In one embodiment, the newly created or modified calibration model is used,
and an
analyte or attribute of the test sample may be calculated based on the test
spectrum.
Alternatively, the test sample spectrum is modified based on the reference
spectrum
(i.e., a ratio or difference) and the modified test spectrum is used with an
existing
model to determine an analyte concentration or attribute.
Note that these steps may be reordered and/or modified without departing
from the scope of the present invention. For example, the reference sample may
have
the same or separate interface with the instrument as that used for the test
sample of
interest. Also, the reference sample may have multiple components that are
simultaneously measured at different locations in the optical path of the
spectroscopic
instrument. Further, the reference sample may be manually or automatically
positioned and measured.
In order to correct for the effects of instrument and environmental variation,
the similar background is preferably sampled sufficiently close in time to the
sample
of interest. The required frequency of sampling for the background is
dependent on
instrument stability and environmental variations which are being corrected.
Preferably, a background measurement is made just prior to measuring the
sample of
interest which allows the most current instrument state to be determined. In
an
alternative sampling scheme, the signal-to-noise ratio in the measured
background
spectrum is improved by taking multiple similar background measurements prior
to
measuring the sample of interest.
There are several schemes for optimizing the relationship between using
-73-
CA 02445868 2003-10-10
WO 02/082990 PCT/US02/09469
multiple background sample measurements (higher signal-to-noise) and using
only
the background sample measurement made closest in time to the measurement of
the
sample of interest (most current instrument state). One such scheme is to use
multiple, weighted, time-averaged background sample measurements. Multiple
background sample measurements are collected over a period of time in order to
increase the spectrum's signal-to-noise ratio. Weighted averaging allows those
background sample spectra taken closest in time to the sample of interest to
more
heavily influence the spectral correction.
There are multiple methods for using the spectral measurement of the similar
background to correct for instrument and environmental variation. One simple
and
effective methodology is to ratio the measured spectrum of the sample of
interest to
the measured spectrum of the similar background sample. This correction
methodology removes spectral variation that is common to both the similar
background and the sample of interest. This methodology may be used to both
t 5 establish and maintain a multivariate calibration model, but in some
cases, it is
desirable to use this methodology only for calibration maintenance.
After generating a glucose prediction, the embedded computer subsystem 600
will report the predicted value 830 to the subject. Optionally, the embedded
computer
subsystem 600 may report the level of confidence in the goodness of the
predicted
value. If the confidence level is low, the embedded computer subsystem 600 may
withhold the predicted glucose value and ask the subject to retest. The
glucose values
may be reported visually on a display, by audio and/or by printed means.
Additionally, the predicted glucose values will be stored in memory in order
to form a
historical record of the subject's glucose values over time. The number of
recorded
glucose values is constrained only by the amount of memory contained in the
device.
The embedded computer subsystem 600 includes a central processing unit
(CPU), memory, storage, a display and preferably a communication link. An
example
of a CPU is the Intel Pentium microprocessor. The memory can be static random
access memory (RAM) and/or dynamic random access memory. The storage can be
3o accomplished with non-volatile RAM or a disk drive. A liquid crystal
display is an
example of the type of display that would be used in the device. The
communication
link could be ~ high speed serial link, an Ethernet link or a wireless
communication
link. The embedded computer subsystem produces glucose predictions from the
-74-
CA 02445868 2003-10-10
WO 02/082990 PCT/US02/09469
received and processed interferograms, performs calibration maintenance,
performs
calibration transfer, runs instrument diagnostics, stores a history of
measured glucose
concentrations and other pertinent information, and in some embodiments, can
communicate with remote hosts to send and receive data and new software
updates.
The embedded computer system can also contain a communication link that
allows transfer of the subject's glucose prediction records and the
corresponding
spectra to an external database. In addition, the communication link can be
used to
download new software to the embedded computer, update the multivariate
calibration model, provide information to the subject to enhance the
management of
their disease, etc. The embedded computer system is very much like an
information
appliance. Examples of information appliances include personal digital
assistants,
web-enabled cellular phones and handheld computers.
The present invention has been tested to show it achieves clinically relevant
levels of glucose prediction and accuracy over a minimum of two months for a
diverse subject population. Using the non-invasive glucose monitoring system
depicted in Figure 1, a glucose calibration model was developed on 40 subjects
over a
period of 6 weeks on 3 identical instruments. The calibration model was
validated on
40 new subjects who were not part of the calibration model. The 40-patient
validation
was conducted over a period of 7 weeks, with each subject being measured twice
per
week. The results of the validation study are shown in Figure 56. Figure 56
displays
the correlation between the capillary blood glucose reference measurement
(Yellow
Springs Instruments 2700 Select) and the- glucose concentration predicted by
the non-
invasive NIR quantitative spectroscopy measurement. This overall standard
error of
predictions for the 40 subjects over the 7 weeks was 21.7 mg/dl. Further,
83.5% of
the results are within section A of the Clark Error Grid. This study
demonstrates non-
invasive glucose measurements with clinically acceptable levels of accuracy
and
precision.
Those skilled in the art will recognize that the present invention may be
manifested in a variety of forms other than the specific embodiments described
and
contemplated herein. Accordingly, departures in form and detail may be made
without departing from the scope and spirit of the present invention as
described in
the appended claims.
-75-