Note: Descriptions are shown in the official language in which they were submitted.
1213 7 0 ~ 02447460 2003-10-30
SYSTEM AND METHOD FOR DISPLAYING REAL-TIME TURBINE
CORRECTED OUTPUT AND HEAT RATE
BACKGROUND OF THE INVENTION
This invention relates generally to the field of turbine controls and, more
particularly,
to display systems showing turbine performance.
Industrial and power generation gas turbines have control systems
("controllers") that
monitor and control their operation. These controllers generate data regarding
the
performance of the turbine. The data may be displayed by the controller so
that
human operators may monitor the operation of the turbine.
Corrected turbine output and corrected heat rate are useful performance
parameters
that indicate the thermodynamic health of the turbine. However, conventional
controllers have not displayed corrected heat rate and output of a turbine.
There is a
long-felt need for data regarding corrected heat rate and output of turbines.
There is
also a need for this data to be presented in real time and historically.
BRIEF DESCRIPTION OF THE INVENTION
In a first embodiment, the invention is a method for generating and displaying
in real
time performance parameters of a turbine including: monitoring the performance
of
the turbine and collecting real time data regarding turbine performance;
determining a
corrected turbine output value from the collected real time data;
electronically storing
the corrected turbine output value and a corresponding time, and displaying a
current
corrected turbine output value and a corresponding time.
In a second embodiment, the invention is a method for generating and
displaying in
real time performance parameters of a turbine including: monitoring the
performance
of the turbine and collecting real time data regarding turbine performance;
determining a corrected turbine heat rate from the collected real time data;
electronically storing the corrected turbine heat rate value and a
corresponding time,
and displaying a current corrected turbine heat rate value and its
corresponding time.
1
121370
CA 02447460 2003-10-30
BRIEF DESCRIPTION OF THE DRAWINGS
FIGURE 1 is a schematic depiction of a gas turbine having a fuel control
system and a
controller display;
FIGURE 2 is an exemplary screen display showing real time and historical
values of
various gas turbine performance parameters, and
FIGURE 3 is an exemplary flow chart
DETAILED DESCRIPTION OF THE INVENTION
FIGURE 1 shows a gas turbine 10, that includes a compressor 12, combustor 14,
turbine 16 connected to the compressor by a shaft 17, fuel controller 18 and a
gas
turbine control system 20. The gas turbine drives a generator 19 through shaft
22 to
produce electrical power. The control system 20 monitors the operation of the
gas
turbine by sensors that detect, for example; the power output from the
turbine,
rotational speed of the compressor and turbine, turbine inlet and exhaust
temperatures,
fuel flow to the combustor, compressor pressure and other operating
conditions.
The control systems) 20, 18 may be a conventional General Electric Speedtronic
{Tm) Mark V Gas Turbine Contxol System. The SpeedTronic controller monitors
various sensors and other instruments associated with a gas turbine. In
addition to
controlling certain turbine functions, such as fuel flow rate, the SpeedTronic
controller generates data from its turbine sensors and presents that data for
display to
the turbine operator. The data may be displayed using software that generates
data
charts and other data presentations, such as the General Electric Cimplicity
{TM)
HMI software product. However, the display features of this conventional
controller
and control presentation do not provide a display for corrected turbine output
or
corrected turbine heat rate.
The Speedtronic (Tm) control system is a computer system that includes
microprocessors that execute programs to control the operation of the gas
turbine
using sensor inputs and instructions from human operators. The control system
includes logic units, such as sample and hold, summation and difference units,
that
2
CA 02447460 2003-10-30
121370
may be implemented in software or by hardwire logic circuits. The commands
generated by the control system processors cause actuators on the gas turbine
to, for
example, adjust the fuel control system that supplies fuel to the combustion
chamber,
set the inlet guide vanes to the compressor, and adjust other control settings
on the gas
turbine.
The controller 20 includes computer processors and data storage that convert
the
sensor readings to data using various algorithms executed by the processors.
The data
generated by the algorithms are indicative of various operating conditions of
the gas
turbine. The data may be presented on operator displays 22, such as a computer
work
station, that is electronically coupled to the operator display. The display
and or
controller may generate data displays and data printouts using software, such
as the
General Electric Cimplicity (Tm) data monitoring and control software
application.
FIGURE 2 is an exemplary display screen 30 from the display 24 that shows
current
and past performance test data from an operating gas turbine. The data display
screen
30 includes a chart 32 showing various line graphs 34 performance parameters
as a
function of time. The line graphs 34 show the current value of gas turbine
parameters
and the recent historical values for those parameters. The horizontal axis of
the chart
shows a current time period 36 and a period of time 38 immediately proceeding
the
current time. Soft function keys 40 allow a person viewing the display to
select the
parameters to be displayed and the duration of the displayed time period.
The line graphs 34 may provide current and recent historical values for the
corrected
turbine output power ("Power Output margin") and the corrected turbine heat
rate
("Heat Rate margin") 42. These values of Power Output and Heat Rate may be
presented as a percentage 44 of the maximum of normal operating value for
these
parameters.
The values for Power Output and Heat Rate margin are determined based on the
algorithms set forth below and are derived from real-time signals from sensors
monitoring the operation of the gas turbine. The real-time values of corrected
turbine
heat rate and corrected turbine output power are useful for useful to the
operator of
3
121370 ~ 02447460 2003-10-30
the gas turbine as they provide information regarding the turbine performance.
In
particular, the corrected real time turbine power output margin indicates the
available
additional power that can be generated which is particularly helpful to manage
the
power output of a power generation station. Similarly, the corrected turbine
heat rate
margin provides helpful information to determine the efficiency of the gas
turbine.
As is evident from the following algorithms, the heat rate and turbine output
power
are corrected to account for ambient pressure and temperatures. By correcting
for
ambient conditions, the values of current corrected turbine output power and
corrected
heat rate may compared to historical values without further adjustment for
variations
in ambient conditions.
The display of current and recent historical values of corrected turbine
output power
and corrected heat rate allow the operator to readily identify abrupt changes
in the
heat rate or output power, and monitor trends in the heat rate and output
power. The
period of time that the recent historical values for corrected output power
and
corrected heat rate are displayed may be selected by the operated by using the
user
controls for the display. The historical information regarding the corrected
turbine
power outlet may be juxtaposed with the current corrected turbine output
margin and
heat rate margin, as is done in line graphs 42.
The corrected gas turbine-generator power output (MW_corr) is calculated from
available parameter values as follows (Equation 1 ):
(Equ. 1) MW corn = DWATT * f(AFPAP} * f(AFPCS) * f(AFPEP)
f(CMHUM) * f(CTIMX} * f(DPF) * f(TNH) * f(WQJ) * f(AUX)
where: MW corr is the corrected gas turbine-generator power output (MW);
DWATT is the measured gas turbine-generator power output (MW); f(AFPAP) is a
function of measured atmospheric pressure (in Hg) and provides a correction
for
ambient pressure; f(AFPCS)is a function of measured inlet pressure loss (in
H20);
f(AFPEP)is a function of measured exhaust pressure loss (in HZO); f(CMHUM)is a
function of calculated compressor inlet humidity (lb/lb}; f(CTIMX)is a
function of
measured compressor inlet temperature (deg); f(DPF)is a function of calculated
4
CA 02447460 2003-10-30
generator power factor; f(TNH)is a function of measured turbine rotational
speed
(RPM); f(WQJ) is a function of measured water or steam injection flow
(lbs/sec), and
f{AUX)is a function of assumed auxiliary power loss (kW).
The actual functions of the above parameters may vary according to a
particular
application and turbine. A person of ordinary skill in this art, e.g., a gas
turbine
engineer with several years of experience in control systems, will be fully
capable of
developing the actual functions for the equations for a particular turbine
application.
Further, any one application may not employ all of the above-listed functions.
For
example, the functions related to water or steam injection may not be included
in
turbine applications that did not have water or steam injection.
Corrected gas turbine-generator power output margin (MW mar) may be determined
in accordance with Equation 2, as follows:
(Equ. 2) MW mar = ((MW corr/MW ref) -1 ) * 100
where: MW mar is the corrected gas turbine-generator power output margin {%);
MW corr is the corrected gas turbine-generator power output (MW); and
MW ref is the reference gas turbine-generator power output (MW).
The reference power output will usually be the guaranteed power output value
which
is generally stated by the turbine manufacturer.
Corrected gas turbine-generator heat rate (HR corn) is calculated from
available
parameter values as follows in equation 3:
(Equ. 3) HR corr - FQ * LHV * CF / DWATT * f(AFPAP) * f(AFPCS) *
f(AFPEP) * f(CMHUM) * f(CTIMX) * f(DPF) * f(TNH) * f(WQJ) * f(AUX)
where: HR corr is the corrected gas turbine-generator heat rate (BTUIkWh); FQ
is the
measured gas turbine fuel flow (lb/s); LHV is the assumed fuel lower heating
value
(BTU/lb); CF is a units conversion factor; DWATT is a measured gas turbine-
generator power output (MW); f(AFPAP) is a function of measured atmospheric
pressure (in Hg); f(AFPCS) is a function of measured inlet pressure loss (in
HZO);
121370 ~ 02447460 2003-10-30
f(AFPEP) is a function of measured exhaust pressure loss (in H20); f(CMHUM)
function of calculated compressor inlet humidity (lb/lb); f(CTIMX) is a
function of
measured compressor inlet temperature (deg.); f(DPF) is a function of
calculated
generator power factor; f(T'NH) is a function of measured turbine rotational
speed
(RPM); f(WQJ) is a function of measured water or steam injection flow
(lbs/sec); and
f(AUX) is a function of assumed auxiliary power loss (kW).
The actual functions of the above parameters will vary according to the
particular
application. A person of ordinary skill in this field should be fully capable
of
developing the algorithms for each of the above listed functions. Further, not
all of
these functions will apply in all cases (e.g. water or steam injection system
may not be
installed)
The corrected gas turbine-generator heat rate margin (HR mar) may be
determined
from the following equation 4:
(Equ. 4) HR mar - (1- (HR corr/HR ref) )* 100
where: HR mar is the corrected gas turbine-generator heat rate margin (%); HR
corr
is the corrected gas turbine-generator heat rate (BTU/lcWh); and HR ref is the
reference gas turbine-generator heat rate (BTU/kWh).
The reference heat rate may often be the guaranteed heat rate value
established by the
manufacturer of the turbine. The actual functions of the above parameters will
vary
according to the particular application. A person of ordinary skill in this
field should
be fully capable of developing the algorithms for each of the above listed
functions.
Further, not all of these functions will apply in all cases (e.g. water or
steam injection
system may not be installed).
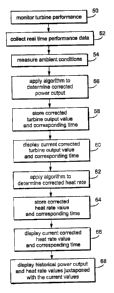
FIGURE 3 is a flow chart of the steps for determining and displaying the
correct
power output and heat rate values. In step 50, the turbine performance is
monitored
with sensors and data is collected from the sensors using the controller 18.
Data from
the sensors needed to calculate the power output and heat rate of the gas
turbine is
6
CA 02447460 2003-10-30
121370
stored in memory of the controller, in step 52, In addition, the ambient
conditions,
e.g., temperature and pressure, are measured in step 54.
With the stored data, the controller applies algorithms (see equations 1 and
2) to
determine a current corrected power output margin, in step 56. The time
corresponding to the calculated power output margin is correlated and stored
with the
power output margin, in step 58. In step 60, the power output margin and the
corresponding time are displayed on a screen display 24. Similarly, the
controller
applies the algorithms (see equations 3 and 4) to determine a current
corrected heat
rate margin value and is correlated to the corresponding time, in step 62. The
values
for the power output and heat rate margins are time-stamped, stored (64) and
displayed (66) by the controller. As time passes, tlhe recently stored values
of
corrected power output and heat rate margins are displayed as historical
values on the
screen, in step 68.
While the invention has been described in connection with what is presently
considered to be the most practical and preferred embodiment, it is to be
understood
that the invention is not to be limited to the disclosed embodiment, but on
the
contrary, is intended to cover various modifications and equivalent
arrangements
included within the spirit and scope of the appended claims.
7