Note: Descriptions are shown in the official language in which they were submitted.
CA 02451929 2003-12-23
1
DETECTION OF ACOUSTIC NERVE TUMORS
BACKGROUND OF THE INVENTION
O1 A tumor of the auditory nerve affects the ABR (auditory brainstem response)
in
individuals. This fact has been used as a screening method for MRI (magnetic
resonance
imaging) testing. The test commonly used involves stimulating the cochlea by a
"click",
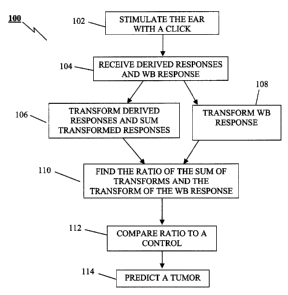
and comparing the response to the national average for males or females. While
the test
was quite accurate for large tumors, it was less accurate for smaller tumors.
Improvements were made on the test by windowing the acoustic response into
"derived
bands", or bands which displayed the ABR in a particular frequency range.
02 It is known in the art how a tumor of the auditory nerve affects the
individual
derived bands. The derived bands tend to be present in acoustic tumor ABRs but
they are
differentially shifted to longer latency values such that the cancellation is
generally more
pronounced and the resulting WB (wide band) response is much smaller than in
normal
cases. Because the amplitude of the ABR shows a 10-fold range in the normal
population,
the response has to be properly normalized on the potential output of the
cochlea, i.e., on
the sum of the derived responses. Don (L1S patent 6,264,616) presents a method
in which
the derived band responses are lined up such that wave V latencies overlap.
This results
in the "stacked ABR" and requires an expert to identify wave V in each derived
band.
Difficulties that may arise can be seen in FIG. 4a and 4b, where an untrained
eye may not
be able to determine wave V.
03 This invention provides a method which requires no expertise or detection
of
wave V to analyze the derived bands.
SUMMARY OF THE INVENTION
04 An alternative to obtaining a stacked ABR is to normalize the power
spectrum of
the WB (wideband) on the SUM of the derived band power spectra.
CA 02451929 2003-12-23
2
OS There is therefore provided, according to an aspect of the invention, a
method and
apparatus of detecting abnormal auditory brainstem response. The apparatus
comprises
means for producing a broadband stimulus, electrodes for sensing an auditory
brainstem
response, and a processor connected to receive the auditory brainstem response
and
programmed to carry out the method. The method comprises the steps of
receiving an
acoustic response generated by applying a stimulus to an ear, the acoustic
response
comprising a set of frequencies, fording a power spectrum or equivalent
transform for
each of plural subsets of the set of frequencies, summing the power spectra or
transform;
and comparing the sum of the power spectra with the power spectrum or
transform of the
set of frequencies in the acoustic response. The subset of frequencies of the
acoustic
response may comprise the auditory brainstem response in a set of limited
frequency
ranges found by masking the acoustic response with white noise. According to a
further
aspect, the method is used to predict the existence of a tumor. According to a
further
aspect, the acoustic response is received by electrodes on an individual's
forehead and
mastoid. The acoustic response may be received differentially between an
electrode on
the high forehead and an electrode on the mastoid corresponding to the
stimulated ear,
and an electrode on the low forehead serves as a ground. According to a
further aspect,
the acoustic response of the cochlea is received. According to a fiuther
aspect, the sum
of the plural subsets of the set of frequencies comprises a wide band
response. According
to a further aspect, the acoustic response is in the normal hearing range.
06 According to a further aspect of the invention, fording a subset of the set
of
frequencies comprises the steps of obtaining an unmasked acoustic response,
obtaining
masked acoustic responses by masking the stimulus with white noise in a
frequency
range, subtracting the masked acoustic response of the highest frequency range
from the
unmasked frequency response to obtain a subset of the set of frequencies, and
subtracting
the masked acoustic response from the next highest masked acoustic response
for the
remaining frequency ranges.
07 According to a further aspect of the invention comparing the sum of power
spectra with the power spectrum of the set of frequencies in the acoustic
response
CA 02451929 2003-12-23
3
comprises normalizing the sum of power spectra to obtain a normalized sum and
normalizing the power spectrum of the set of frequencies in the acoustic
response to
obtain a normalized reference and taking the ratio of the normalized sum and
the
normalized reference. A higher ratio of the normalized sum and the normalized
reference
may correspond to a higher probability of the existence of a tumor. The ratio
of the
normalized sum and the normalized reference may be compared to a ratio
obtained from
a group of people without abnormal auditory brainstem response or to a ratio
obtained
from the opposite ear of an individual. The peak in the ratio between 400-1000
Hz may
be used as a predictor of the presence of a tumor. A processor may be used to
predict the
presence of a tumor.
08 These and other features of the invention will be apparent from the
detailed
description of the invention. The described method and apparatus may also be
extended
to apply to the detection of abnormalities in signals or responses from other
bodies or
parts of bodies, including human bodies, where phase information in sub-bands
of the
frequencies is lost in the wideband response.
BRIEF DESCRIPTION OF THE DRAWINGS
09 There will now be given a brief description of the preferred embodiments of
the
invention, with reference to the drawings, by way of illustration only and not
limiting the
scope of the invention, in which like numerals refer to like elements, and in
which:
FIG. 1 is a flow chart showing the steps involved in predicting a tumor;
FIG. 2 shows how a derived band is calculated;
FIG. 3 shows different derived acoustic responses of an ear to a stimulus;
FIG. 4 shows an apparatus for determining the acoustic response
FIG. 5 shows the power spectrum of the wideband response and the sum power
spectrum.
FIG. 6 shows the ratio of the power spectrum of the wideband response and the
sum power spectrum.
CA 02451929 2003-12-23
4
DETAILED DESCRIPTION OF THE PREFERRED EMBODIMENTS
The word comprising is used in this document in its inclusive sense and does
not
exclude other features being present. The indefinite article "a" before an
element
specifies at least one of the elements is present, but does not exclude others
of the same
element being present. The term power spectrum refers to any power or
magnitude
calculated from a spectrum in which the phase information can be transformed
and
quantified, and may refer to various frequency domain (Fourier or Laplace
transforms,
complex demodulation), frequency-time domain (such as, but not restricted to,
Wigner-,
Choi-Williams-, and Rihacek-distributions) and "scaling"-time domain (various
Wavelet
transforms) methods.
11 Referring to Fig. 1, there are shown steps in a method 100 of detecting an
abnormal auditory brainstem response. The first step 102 is to apply a
stimulus such as a
click with a wide band frequency range to the ear of an individual. The
auditory
brainstem response (ABR), or acoustic response, is recorded from electrodes on
the high
forehead, the left and right mastoids and on the low forehead. The response to
stimulation
of the left ear is recorded differentially between the forehead, or any
electrode close to
the midline, and left mastoid electrode, and the response to stimulation of
the right ear
between the forehead, or any electrode close to the midline, and the right
mastoid
electrode. The low forehead electrode or any electrode in a convenient place
serves as a
ground. The signal is amplified to a convenient level, such as 100,000 times
using a band
pass filter setting between 100-3000 Hz. A continuous white noise level
sufficient to just
mask the ABR in response to clicks presented at, for instance, 60 dB nHL is
used. The
white noise is used to obtain the derived responses in 104, in addition to the
WB
(wideband), or unmasked response. The derived responses are subsets of
fi~equencies in
the original set of frequencies in the acoustic response. The original set of
frequencies
may be referred to as the WB (wideband) response. The method for obtaining the
derived responses will be discussed below. In 106, the derived responses are
transformed
to find a power spectrum and are then summed to find a sum of power spectra of
the
derived responses. In 108, the WB response is transformed to find a power
spectrum of
the WB response. The result is two power spectra that may be compared to see
the effect
CA 02451929 2003-12-23
of phase cancellation. By transforming the derived responses before summing,
we are
able to avoid the phase cancellation that occurs between the derived
responses, while the
WB response still contains that phase cancellation. The two normalized spectra
can be
seen in Fig. 5, where it can be seen that phase cancellation causes the level
of the
transformed WB response 504 is lower at higher frequencies than the sum of the
transformed subset of frequencies. By comparing the two spectra, the effect of
phase
cancellation becomes apparent, and as this effect will be different in the
presence of a
tumor, it can be used as a diagnostic tool. As an example, if the ABR of two
ears are
compared, the ratio may be 12 for the left ear, and 8 for the right. In step
110 the
transforms are compared by taking the ratio of the normalized sum of
transforms and the
normalized transform of the WB response. The plot of the ratio is shown in
Fig. 6. The
ratio is compared to a control in step 112, and the presence of a tumor is
predicted in step
114 according to the results. The control may be the opposite ear of the
patient, or a pre-
determined average from a control group without abnormal ABR. In obtaining an
average from a control group, it is necessary to divide the group according to
age and
gender, as these factors will also affect the latency of the cochlea, which is
what
generates the acoustic response that is measured.
12 The method of obtaining derive acoustic responses as seen in FIG. 3 will
now be
discussed. FIG. 2 shows how this is done in the time domain for the highest
frequency
range, where an unmasked acoustic response 202 has been obtained. The stimulus
is
masked with white noise in a frequency range to obtain a masked response 204.
The
masked acoustic response is subtracted from the unmasked frequency response to
obtain
the response 206. For lower frequency ranges, the unmasked frequency range is
replaced
with the masked response of the next highest frequency range. For convenience,
the set
of frequencies chosen for the derived responses are selected to be in octaves,
such as
<500 Hz, 500-1000 Hz, 1000-2000 Hz, 2000-4000 Hz, 4000-8000 Hz, and >8000 Hz.
Because of the mechanical response properties of the basilar membrane, high-
pass
masking does not affect frequency regions outside the pass band of the noise.
Thus, the
difference between the response to a click without noise and the response to a
click in the
presence of an 8 kHz high-pass noise would reflect the activity from that part
of the
CA 02451929 2003-12-23
6
cochlea that is masked by the 8 kHz high pass noise. Continuing, subtracting
the
response to a click in the presence of a 4 kHz high-pass noise from that
recorded in the
presence of a 8 kHz high-pass noise results in activity from the region in the
cochlea that
is masked by the 4 kHz high-pass noise but not by the 8 kHz high-pass noise.
Continuing
in this way one can derive the responses from octave wide regions along the
cochlea. In
Fig. 3, three examples of derived responses are shown, with 302 representing a
higher
frequency band than 304, and 304 representing a higher frequency band than
306. It can
be seen that there are alternating positive-negative portions that tend to be
out of phase,
i.e., the responses cancel each other for specific latency ranges. As a
consequence the
ABR to a click tends to be smaller than the contributions from the individual
octave
bands would predict.
13 One observes that with decreasing high-pass cut-off frequency, and
consequently
greater masking of the normal hearing range (250-15,000 Hz), that the dominant
ABR
component present at 7-9 ms after stimulus onset is shifted to longer values.
This reflects
the masking of the high-frequency parts of the inner ear (cochlea) that cannot
generate
click-related activity. Because the response time (latency) of the high-
frequency parts of
the cochlea is shorter than those for the lower frequency components, a shift
towards
longer latencies occurs. In addition, the response amplitude may decrease
somewhat.
14 The phase cancellation in the ABR as occurring in the time domain, can be
quantified by comparing the sum of the power spectra of the derived responses
with the
power spectrum of the WB response to avoid response parts that would not
contribute to
the diagnosis such as the PAM (post-auricular muscle) and the stimulus
artifact. By
comparing the sum of the power spectra of the derived responses to the overall
response
with the power spectrum of the response to the click in the absence of any
masking one
observes that the SUM response is larger than the WB response. This difference
reflects
the degree of phase cancellation that occurs.
15 Fig. 6, line 602 quantifies this difference by showing the ratio of lines
502 and
504 (in fact the difference in dB of lines 502 and 504). There is no
significant difference
CA 02451929 2003-12-23
7
for frequencies below 300 Hz, whereas the difference above 1000 Hz may be
affected
mostly by the increase in noise resulting from the subtraction procedure to
obtain the
derived bands. We believe upon reasonable grounds that the dominant frequency
components related to the identifiable peaks in the response would be in the
500-700 Hz
region (period of 1.5-2 ms). This frequency region shows a prominent
discrepancy in the
ratio plot. It is believed on reasonable and probable grounds that the ratio
(SUM/WB)
will increase considerably when a tumor is present in the range of normal
ratios or ratio x
frequency (e.g., 300-750 Hz). Because there is generally only 1 peak in this
range, the
comparison may be automated such that a computer or other processor compares
the
value of the ratio in this range to a predetermined value or the value from
the other ear,
and provide a prediction, removing the need for a technician to analyze the
data. A
combination may also be used, where the ratio plot is displayed with the
prediction, so
that a visual check may be performed to ensure that the correct information
was used in
the prediction.
16 The apparatus that is used to carry out this method is shown in Fig. 4,
where a
device for generating a wideband stimulus or click stimulates the ear 406.
Electrodes
408, 410, and 412 are used to receive signals generated by the patient, where
signals are
received differentially between 408 and 412, and the signals are sent to the
processor 402.
The processor is programmed to carry out the method as described. In using the
term
"processor is programmed", it is understood that this encompasses any circuit
capable of
carrying out instructions, such as, but not limited to, a programmable
microprocessor, a
hard-wired circuit, or software that may be used by a computer. There may also
be a
combination of the above, for example, an amplifier and filter connected to a
programmable microprocessor.
17 Those skilled in the art may make immaterial modifications to the invention
described here without departing from the invention. The comparison may be
carried out
using the power-spectra or magnitude-spectra provided by the Fourier or
Laplace
transform or complex demodulation, of the averaged ABR and of each of the
derived
band ABRs. Using frequency-time domain and scaling-time domain representations
the
CA 02451929 2003-12-23
marginal frequency- and scaling-distributions are used to quantify these phase
cancellation effects.