Note: Descriptions are shown in the official language in which they were submitted.
CA 02451992 2003-11-05
WO 02/092101
PCT/US02/15981
SYSTEMS AND METHODS FOR MONITORING BEHAVIOR INFORMATICS
FIELD OF THE INVENTION
This invention generally relates to systems and methods that capture
behavioral and physiological data into a database and to systems and methods
that
analyze and extract relevant and new information from the database. More
particularly the invention relates to a method used to capture, summarize and
register animal movements and physiological measurements, and to a database
mining tool that will allow high throughput analysis of drugs effects, and
characterization of animals of different strains and genetically manipulated
animals.
BACKGROUND OF THE INVENTION
During the last decade new enabling technologies in molecular biology,
chemistry, automation, and information technology have dramatically reshaped
pharmaceutical and biological research. The completion of the sequencing of
the
genome in humans and mice has opened new opportunities to study the
relationship
between gene expression and behavioral function. Although the function of many
genes is being unraveled resulting in many promising therapeutic targets,
progress in
understanding neuropsychiatric disorders is lacking.
In vivo behavioral biology is needed to validate behavioral phenotypes
associated with newly discovered genes and new drug leads. As it is a slow,
labor-
intensive, high-maintenance technique it creates a bottleneck, and creates a
need for
a novel paradigm with a new approach to modem, scalable and automated
technology.
Drug Discovery.
The development of new drugs and medications involves the study of their
effects on various animals. The use of mice, dogs and other animals for
experimental purposes is needed to obtain data so that subsequent tests on
humans
may be safely carried out.
Assessing behavior and the effects of drugs on laboratory, animals has been a
central component of the field of neuropharmacology. The discovery of
chlorpromazine, for example, as a drug that produces differential effects on
CA 02451992 2003-11-05
WO 02/092101
PCT/US02/15981
2
avoidance and escape behavior provided a strong impetus for evaluating the
behavioral effects of experimental antipsychotic drugs. The growth of
neuropharmacology coincided also with the development of the field of operant
conditioning. Indeed, many of the techniques used to control and monitor
operant
behavior were enthusiastically endorsed by behavioral pharmacologists. It is
recognized nowdays that the assessment of behavior in determining the effects
of
drugs is of pivotal importance.
Phenotype/Genotype Correlation.
With the completion of the genome sequence in both humans and mice, a
wealth of information has inundated the scientific community. Thousands of
genetically manipulated animals are being generated in hundreds of different
laboratories for many different purposes. Although the research in academia
and
industry focusing on the function of genes is normally hypothesis driven, most
of the
time there are secondary adaptations ("side effects") that confound or
obliterate the
targeted gene function. For example, a gene involved in memory may result in
abnormal sensory function, and therefore many tests for the assessment of
memory
may have to be ruled out, if they depend on the sensory function affected. The
difficulty is that laboratories that develop these genetically manipulated
animals
rarely have the capacity to test for secondary adaptations and most of these
may go
unnoticed.
In the area of functional genomics there is therefore a special need for a
comprehensive assessment of behavior that brings the ability to correlate
behavior,
physiology and gene expression and allows to rule out secondary adaptations as
the
cause of observed behavioral and physiological phenotypes.
Standard Behavioral Techniques
Although great progress has been made in the development of techniques
that permit objective and quantitative study of behavior, these techniques
involve
considerable expertise and effort. In the field of neuropharmacology, for
example,
the adoption and widespread use of these procedures has had the multiple
benefit of
broadening our understanding of the principles governing behavior, elucidating
the
mechanisms of drug action, and demonstrating the complex neurochemical
substrates influencing both behavior and drug action. However, these
behavioral
CA 02451992 2003-11-05
WO 02/092101
PCT/US02/15981
3
techniques are time consuming, they provide a limited picture of the animal's
behavior and do not allow a comprehensive assessment of the test subject. The
type
of behavioral assessment currently used is limited by the choice of the end
point
measures or dependent variables, and by the limitation of the observation to a
given
period. Behavioral data are therefore limited to and by what the scientific
community considers a relevant variable, by the way this variable is measured,
and
by the context and time constraints of the testing.
Behavioral data are collected using a myriad of different techniques. In some
cases, drug-induced behavior is assessed by trained observers who employ
rating
scales. Although a trained observer can detect complex and/or subtle changes
in
behavior, there is an intrinsic variability and subjectivity in the behavioral
data
generated in this way. Reliability of the data heavily depends on the
expertise of the
observer. This method is obviously constrained by the short duration of the
observation.
In drug research, for example, various devices are often used for measuring
the activity of a test animal treated with an experimental substance. Normal
activity
of untreated animals is measured to provide a comparison with the results from
treated animals.
Measurements of activity are usually done with scientific
equipment for continuously monitoring an animal's movement within a confined
area. Whereas these devices permit prolonged observation of the animal's
activity,
other concurrent behaviors are normally ignored.
Various types of animal activity monitors have been used by behavioral
analysts to study the effects induced upon the animal by experimental drugs.
Such
monitors include, for example, video equipment and light sensors. These types
of
monitors have been limiting in the study of animal behavior because they only
allow
the dimension the animal's visually detectable gross motion activities such
as, for
example, locomotion and stereotyped motor behavior. Complex behavioral
assessment data is unavailable from these types of monitors.
An additional problem in the study of animal behavior using conventional
methods is that the test subject is usually transported from the colony room
to a test
area or cage, in a different room, where the behavioral studies are conducted.
This
removal involves handling the test subject, placing it on a cart and rolling
the cart
away, and placing it in a different environment. This procedure by itself has
profound influences on the animal's behavior thereby affecting the results. If
CA 02451992 2003-11-05
WO 02/092101
PCT/US02/15981
4
processes related to stress, for example, are to be avoided, this movement of
animals
from one setting to another is clearly counterproductive.
Thus, in both the area of functional genomics and in drug discovery, there
remains a need in the art for an apparatus and method that provides assessment
of
animal's behavior beyond mere gross motor activities. A comprehensive
assessment
over long or short periods of time is required. Such assessment can include
what
type of activity is performed, its intensity, frequency and duration, how
these
parameters change over time, and what complex patterns that involved a
succession
of different behaviors can be detected. A system that can link these
measurements to
telemetric devises measuring blood pressure, heart rate and other
physiological
parameter in parallel to the acquisition of behavioral data will be
invaluable. In
addition, there is a need to provide a method to reduce the level of
manipulation of
the test subject.
SUMMARY OF THE INVENTION
The present invention relates to systems and methods for massively parallel
data acquisition and analysis of behavior in a manner which permits
integration of
behavioral data with genomics, through the use of robotics and
bioinformatics..
One aspect of the present invention relates to novel robotic hardware to
collect and record a plurality of experimental behavioral, biochemical,
neurological
and physiological information from animals. Another aspect comprises computer
vision, preferably in combination with other algorithms to extract
behavioral/physiological states and to extract temporal and other structures
from
said plurality of information. A third aspect of the present invention relates
to a
computer system for mining said information for identifying a pattern
reflecting the
effects of drug, environmental or genetic manipulation of the test animals or
subjects. In general, the preferred system ideally includes:
(i)
equipment to mechanically and visually record one or more
behavioral, neurological, biochemical and/or
physiological
measurements using a variety of video cameras and other sensors;(ii)
software utilizing computer vision and additional algorithms
to extract one or more behavioral, neurological, biochemical and/or
physiological states from said measurements;
CA 02451992 2003-11-05
WO 02/092101
PCT/US02/15981
(iii) one or more behavioral, neurological, biochemical and/or
physiological measurement databases including information
representative of animal behavior, neurology, biochemical and/or
physiology observed from previous experiments with a) animals
5 treated with drugs, b) having predetermined genetic traits
and/or c)
having otherwise been exposed to an environmental cue or any other
type of treatment different from normal, control and/or sham-treated
animals;
(iv) a query server program that receives query behavioral, neurological,
and physiological data from one or more users of the system;
(v) a database searching program that (a) compares query behavioral,
neurological and physiological data with a model derived from said
previous animal experiments represented in said behavioral,
neurological, and physiological measurement database(s), and (b)
correlates the query data with behavior of animals treated with other
drugs and/or having predetermined genetic traits; and
(vi) a reporting program that interfaces with the user for reporting to
said
user information representative of the degree of correlation, if any,
between said query behavioral, neurological, and physiological data
and entries in said measurement database(s).
In certain embodiments, the subject system may be described in terms of
main components, comprising a data capture system for capturing behavioral and
other animal derived data, intelligent software such as computer vision
algorithms,
that capture and/or identify behavioral/physiological states, and a custom-
built
intelligent database that enables sophisticated statistical analysis of the
captured
states and data mining. The data capture system advantageously can be a free-
standing module that either is, or fits into, a standard laboratory home cage
and can
be fitted with mechanical devices for conducting experiments. It may be
equipped
with a variety of sensors that automatically record the test subject's
activity and
biological changes and feed them to the computer system on a continuous real-
time
basis. A variety of mechanical challenges advantageously part of the systems,
can
be computer-controlled for conducting a range of standardized, scientifically
validated tests. Physical activity can be captured by a highly sensitive
movement
capture system that allows for minutely detailed analysis.
CA 02451992 2003-11-05
WO 02/092101
PCT/US02/15981
6
Another aspect of the invention relates to the complementary use of software
to classify acquired behavioral, neurological, biochemical and physiological
data
into predetermined states, such as an a-priori defined sleeping state, in
addition to
identifying novel states that may be present in the complex datasets captured
by the
system.
The test data can also be time stamped and sent directly to the database for
further retroactive processing.
Another aspect of the invention comprises a relational database whereby a
plurality of data can be compared with reference data and other data from
linked
databases. In certain
instances, information from the system, may be
advantageously linked with data from public and private sources to provide an
exceptionally powerful platform for analysis.
In an exemplary embodiment, the subject method and system is used to
categorize drugs based on their "signatures". In the standard behavioral lab
many
different tests are implemented to study the full profile of a drug or to
characterize a
knockout. A drug is qualified, for example, as an anxiolytic if it increases
some
responses (e.g., exploration of the open arms of the elevated plus maze),
decreases
other (e.g., freezing) and shows no major non-specific side effects that may
confound the interpretation (e.g., sedation). Behavioral scientists therefore
understand the therapeutic value of a drug through the definition of a
profile, which
we call here a drug signature. One could also think about signatures of
similar kind
for genetically altered mutants or animal models, or even lesions (e.g.,
cerebellar-
dysfunction signature).
Another aspect of the invention relates to a computer-implemented method
for identifying potential modes of action of a candidate drug. The subject
computer-
implemented method includes providing a computer controlled system such as
that
described previously including:
(i)
signatures comprising one or more behavioral, neurological, and
physiological measurement databases including information
representative of animal behavior, neurology and physiology
observed for previous experiments with animals a) treated with drugs,
b) having predetermined genetic traits and/or c) having otherwise
been exposed to an environmental cue or any other type of treatment
different from normal, control and/or sham-treated animals;
CA 02451992 2003-11-05
WO 02/092101
PCT/US02/15981
7
(ii) a query
server program that receives query data from one or more
users on the system;
(iii) a database analysis program that
(a) compares query behavioral, neurological, and physiological
data with the signature derived from said previous animal
experiments represented in said measurement database(s), and
(b) correlates the query data with said signatures; and
(iv) a
reporting program that generates reports including information
representative of the degree of correlation, if any, between said query
data and entries in said measurement database(s).
Access to the computer system is provided to users to input query behavioral
data.
The method preferably also includes the capability of reporting correlations,
if any,
between said query behavioral data input by said user and activity of other
drugs
and/or genetic traits.
Still another aspect of the present invention relates to a method for
predicting
potential modes of action of a test compound. In general the method relies on
access
to, such as by generating, a database of information representative of
behavioral,
neurological, biochemical and physiological measurements from animals
previously
treated with drugs, or those having predetermined genetic traits and/or which
have
otherwise been exposed to at least one environmental cue or any other type of
treatment which differs from that experienced by normal, control and/or sham-
treated animals. From the database, a set of predictor variables, or
signatures, are
generated which define said information in said database, said set of
predictor
variables defining correlations between said behavioral, neurological, and
physiological measurements and said drugs, predetermined genetic traits and/or
exposure to environmental cues. This can be used to derive a model that
represents
a probability relationship between a response of an animal to a test compound
and
said set of predictor variables, said relationship derived through using at
least one
automated non-linear algorithm or other bioinformatics analysis tool. The
model
may advantageously be used to predict potential therapeutic application of a
test
compound based on behavioral, neurological, and physiological measurements
from
one or more animals treated with said test compound.
Yet another aspect of the invention relates to a method for predicting
potential modes of action of an environmental or genetic effect on an animal.
The
CA 02451992 2003-11-05
WO 02/092101
PCT/US02/15981
8
method includes generating a database of information representative of
behavioral,
neurological, and physiological measurements from animals treated with drugs,
having predetermined genetic traits and/or have otherwise exposed to an
environmental cue or any other type of treatment different from normal,
control
and/or sham-treated animals. From the database(s), a set of predictor
variables are
generated which define said information in said database, said set of
predictor
variables defining correlations between said behavioral, neurological, and
physiological measurements and said drugs, predetermined genetic traits and/or
exposure to environmental cues. A signature may then be derived that
represents a
probability relationship between
(a) behavioral, neurological, biochemical and/or physiological
measurements of an animal exposed to a test environmental effect or possessing
a
predetermined genetic state, and
(b) said set of predictor variables.
Preferably, the relationship is derived through using at least one automated
non-
linear algorithm. The instant invention may be used to predict potential modes
of
action of an environmental or genetic effect on a test animal based on
behavioral,
neurological, and physiological measurements from one or more of said test
animals.
For instance, the method may be advantageously used for one or more purposes
of
assessing potential therapeutic effects of a drug, assessing potential toxic
side effects
of a drug, predicting potential effects of a lesion, predicting potential
effects of
acute, sub-chronic (e.g., 2-5 days) or chronic (e.g., more than 5 days)
environmental
manipulation on fetal, juvenile or adult animals, and predicting potential
effects of
mutagenesis (natural or artificial, e.g., by chemical or radiation)
manipulation of
genes (e.g., by transgenic modification, including knock-in, knock-out and
knock-
down phenotypes).
Another aspect of the invention provides a service for administering, over a
wide area network, access to data mining models for identifying potential
modes of
action of a candidate drug. The subject service includes providing a server
system,
in communication with a wide area network. Such server systems include one or
more behavioral, neurological, and physiological measurement databases
including
information representative of animal behavior, neurology and physiology
observed
for previous experiments with animals treated with drugs, having predetermined
genetic traits and/or have otherwise exposed to an environmental cue or any
other
type of treatment different from normal, control and/or sham-treated animals.
It
CA 02451992 2003-11-05
WO 02/092101
PCT/US02/15981
9
may also include a query server program that receives query data from one or
more
users on the system, and a database-searching program that compares query
behavioral, neurological, and physiological data with a model derived from
said
previous animal experiments represented in said measurement database(s), and
correlates the query data with entries in said measurement database(s). In
preferred
embodiments, the server system will also include a reporting program that
generates
reports including information representative of the degree of correlation, if
any,
between said query data and entries in said measurement database(s). These
databases and programs can be located on the same or different computers or
storage
devices. The subject method allows users to employ a client process operating
on a
client station to connect to said server system through the wide area network
and to
input query behavioral data. The system can be set up to report to the user(s)
correlations, if any, between said query behavioral data input by said user
and
activity of other drugs and/or genetic traits.
Still another aspect of the present invention provides a method for
conducting a drug discovery business. In certain embodiments, the method
includes
the steps of:
(i) obtaining representative behavioral, neurological, biochemical
and/or physiological data of one or more animals treated with a test
compound;
(ii) comparing the obtained data with one or more signatures that
represent a probability relationship between a response of an animal
to a test compound and a set of predictor variables which define
correlations between observed behavior and known drugs and/or
predetermined genetic traits, said relationship derived through using
at least one automated non-linear algorithm or other data analysis
process;
(iii) determining, from the comparison data of step (ii), potential modes of
action or therapeutic applications of the test compound, and assessing
the suitability of further clinical development of the test compound.
The drug discovery business method may advantageously include the
additional step of licensing to a third party rights to the test compound for
further
development. In addition, the subject method may further include formulating a
pharmaceutical preparation including one or more agents identified as having a
CA 02451992 2003-11-05
WO 02/092101
PCT/US02/15981
desired therapeutic and/or toxic profile. In certain embodiments, the subject
method
may advantageously include additional steps of licensing such identified
pharmaceutical preparations to third parties and/or establishing a
distribution system
for distributing the pharmaceutical preparation for sale, and/or may further
include
5
establishing a sales group for marketing the pharmaceutical preparation. In
another
drug discovery business embodiment, the subject systems and bioinformatics
database can be made available to one or more third parties under a licensing
or
other scheme ideally involving milestone payments and/or a percentage of the
future revenues of drugs identified using the systems of the instant
invention.
10 In
additional embodiments, for compounds selected for further clinical
development, the method can include conducting therapeutic profiling of the
test
compound, or analogs thereof, for efficacy and toxicity in animals.
Yet another aspect of the present invention provides a method for conducting
a drug discovery business, and advantageously makes use of the hardware and
computer system described above. For instance, the subject method can include
obtaining one or more sets of behavioral, neurological, biochemical and
physiological data for one or more animals treated with a test compound.
Accessing
the subject computer system, e.g., as described supra, one receives
information
representative of the degree of correlation, if any, between behavioral,
neurological
and/or physiological data for said test compound and entries in said
measurement
database(s) or signatures or signatures derived therefrom. At least in part
from the
correlation step the method may advantageously determine potential modes of
action
of the test compound, and assesses the suitability of further clinical
development of
the test compound for various therapeutic applications. For compounds selected
for
further clinical development, one can (optionally) conduct therapeutic
profiling of
the test compound, or analogs thereof, for efficacy and toxicity in animals.
In
certain preferred embodiments, the method also includes a step of formulating
a
pharmaceutical preparation including one or more agents identified as having a
desired therapeutic and/or toxicity profile.
Another aspect of the present invention provides a method for conducting a
drug discovery business, in which the following steps are included:
(A)
providing personnel for obtaining that obtains behavioral data from
one or more animals treated with a test compound;
CA 02451992 2003-11-05
WO 02/092101
PCT/US02/15981
11
=
(B)
providing a data mining system for analyzing the behavioral,
neurological, biochemical and physiological data, said system
comprising:
(i) one or more behavioral, neurological, biochemical and
physiological measurement databases including information
representative of animal behavior observed from previous
experiments involving animals a) treated with drugs, b)
having predetermined genetic traits and/or c) have otherwise
been exposed to an environmental cue different from that
experienced by normal, control and/or sham-treated animals;
(ii) a query server program that receives query behavioral,
neurological, biochemical and/or physiological data from one
or more users on the system;
(iii) a database searching program that (a) compares query
behavioral, neurological, biochemical and/or physiological
data with a signature comprising behavioral, neurological,
biochemical and/or physiological data from said
measurement databases, and (b) correlates the query
behavioral, neurological, biochemical and/or physiological
data with said signatures of animals treated with other drugs
and/or having predetermined genetic traits; and
(iv) a reporting program that generates reports including
information representative of the degree of correlation, if any,
between said query behavioral, neurological, biochemical
and/or physiological data and entries in said behavior
signatures;
(C)
determining, using the system of (B), potential modes of action of the
test compound, and assessing the suitability of further clinical
development of the test compound;
(D) for compounds selected for further clinical development, conducting
therapeutic profiling of the test compound, or analogs thereof, for
efficacy and toxicity in animals; and
(E)
formulating a pharmaceutical preparation including one or more
compounds identified in step (D).
CA 02451992 2003-11-05
WO 02/092101
PCT/US02/15981
12
In embodiments where the subject methods and systems are used for
preclinical research, the focus may include gene target identification and
validation,
synthesizing and extracting compounds, compound selection and toxicity
testing.
In certain embodiments, the compounds can be further analyzed using the
standard tests which may include, for example, elevated plus maze, open field,
dark-
light transition test, tail suspension, forced swim test, Morris water maze,
etc.
In certain preferred embodiments of the subject systems and methods, the
model is a hidden Markov model. In other embodiments, the model is a neural
net.
In certain preferred embodiments of the subject systems and methods, the
database(s) include behavioral, neurological, biochemical and physiological
data
representative of one or more of sleeping, grooming, locomotion (including
ambulatory and non-ambulatory movements, foot misplacement, and the like),
rearing, stereotypic behavior, digging, anxiety, intake, pain sensitivity,
convulsions,
learning, memory (short/long), task switching, attention, discrimination,
motivation,
response inhibition, reward sensitivity, avoidance, startle, tolerance and
withdrawal.
In certain preferred embodiments of the subject systems and methods,
neurological data is acquired, and may include one or more of EEG data, data
concerning changes in CNS structures and/or function (including size and
location
of necrotic tissue), occurrence of seizures, level of blood flow to CNS
tissue,
glucose consumption by CNS tissue, oxygen consumption by CNS tissue,
somatosensory evoked potentials (SSEPs), intracellular current flow, and
information from other imaging sources including magnetic resonance imaging
(MRI), computed tomography (CT), positron emission tomography (PET), single
photon emission computed tomography (SPECT), somatosensory evoked potentials
(SSEPs), and magnetoencephalography (MEG).
In certain preferred embodiments of the subject systems and methods, the
physiological data includes one or more of gut motility data, body weight
data,
temperature data, EKG cardiac response data (e.g., output, QT interval), and
respiration data (e.g., rate, 02 and/or CO2).
In certain preferred embodiments, the database includes one or more of gene
transcriptional data (such as transcription profiles), proteomics data (e.g.,
data on
protein and protein expression levels, occurrence of post-translational
modifications,
cellular localization, protein-protein interactions, etc), marker profiles,
and
metabolite data.
CA 02451992 2003-11-05
WO 02/092101
PCT/US02/15981
13
In certain preferred embodiments of the subject systems and methods, the
database(s) is an annotated database including information representative of
the
mechanism of action of drugs for which behavioral, neurological, biochemical
and
physiological information has been included in the database.
In certain embodiments, the present invention is directed to an automated,
rapid throughput, in vivo behavioral assay systems with associated
bioinformatics,
e.g., to assess spontaneous and conditioned behavior in rodents. To this end,
the
invention provides systems and methods for use in the assessment of
behavioral,
neurological, biochemical and physiological characteristics that can depend on
innate characteristics of an animal, such as different genetic backgrounds or
genetic
manipulations, as well as environmental cues, such as drug treatment. The
invention
also provides systems for generating and maintaining databases of relevant
behavioral, neurological, biochemical and physiological models that can be
used for
information mining, for example, to uncover associations, patterns, and trends
in
drug response or genetic profiles, as well as cluster and classify information
about
drug effects, and to develop predictive models.
In certain preferred embodiments, the subject invention provides rapid-
throughput, automated animal testing systems, using hardware and software that
permits continuous collection of behavioral, neurological, biochemical and
physiological data. In contrast to traditional preclinical behavioral,
neurological,
biochemical and physiological testing processes, the automated systems of the
present invention can be more efficient, reproducible, cost-effective and
operator-
independent, as well as compatible with modern tools for drug discovery.
Continuous and automated character of the data collection process, for
example, can
increase the statistical power and ability to find unbiased embedded
correlations or
"behavioral, neurological, biochemical and physiological signatures" in the
data.
Another aspect of the invention provides reference data sets providing
behavioral, neurological, biochemical and/or physiological responses to
compounds
and/or genetic manipulations of animals. In preferred embodiments, the
invention
provides an extensive and continuously updated reference database and
relational
software tools that can be used to characterize the behavioral, neurological,
biochemical and/or physiological impact of compounds and genetic manipulations
and enable users to perform automated and intelligent analyses of its
behavioral,
neurological, biochemical and/or physiological function, benchmark these
against
previously assembled reference database, and use these to make predictions
about
therapeutic efficacy and safety. Accurate prediction of therapeutic efficacy
and
CA 02451992 2003-11-05
WO 02/092101
PCT/US02/15981
14
potential side-effects accelerates lead selection and drug development and
reduces
costs.
The subject methods and systems can be used as part of a discovery program
for new therapeutic candidates and of unanticipated neurological and
psychiatric
applications for drugs that were previously investigated in other therapeutic
areas.
Other drug-related observations which advantageously can be determined by
datamining the databases of the present invention include:
= = interactions among over-the-counter (OTC) medicines
= interactions between prescription and OTC medicines
= interactions among ethical medicines
= interactions between any kind of medicine and various foods,
beverages, vitamins, and mineral supplements
= common characteristics between certain drug groups and offending
foods, beverages, medicines, etc.
= distinguishing characteristics among certain drug groups (e.g., for
some people, certain antihistamines may not produce an adverse
reaction to certain foods, and therefore may be a better choice among
the large number of antihistamines on the market)
= questionable interactions based on very limited evidence, but which
may be of great interest (e.g., a few users out of many thousands of
users report a serious, but unusual side effect resulting from some
combination of characteristics) and
= determining which types of patients are likely to be at risk when
using a particular medicine.
Yet another aspect of the invention provides a module for collecting physical
and biological data concerning a test subject. The module further communicates
with a processor that interprets the data to capture and time-stamp the
behavior of
the test subject. In accordance with another embodiment of the invention, an
apparatus and method is provided for automated recording of animal behavior
and
interpretation of the observations by using individual modules, multiple
modules or
modules with multiple channels. Another advantage of the instant invention,
particularly when multiple apparatuses are used is that a large number of
animals
CA 02451992 2003-11-05
WO 02/092101
PCT/US02/15981
may be observed simultaneously, thereby dramatically leveraging the efficiency
of
laboratory personnel. Animals observed at the same time may be part of the
same
experiment or a variety of different experiments. The system and method also
allows hypothesis and validation of test animal behavior when the test animal
is
5 exposed to manipulation and/or an experimental drug, or when genetically
manipulated animals are studied.
The apparatus and method used to assess animal behavior includes a module
having one or more sensors that collectively obtain a variety of behavioral,
neurological, biochemical and/or physiological and physiological data from a
test
10 subject. The sensors of the apparatus also may provide for the
ability to
simultaneously obtaining data pertaining to different overt activities or
movements
and to physiological responses of the test subject. One embodiment would
provide a
portable module that fits into standard laboratory cages thereby permitting
behavioral, neurological, biochemical and/or physiological testing in the
animal's
15 own habitat, but other designs are possible including where the
module is the cage.
Multiple-dimensional modeling of the test subject based on the system's
interpretation of the data allows pattern recognition of the drug signature,
predictive
drug analysis, and interpretation of the phenotype of a genetically engineered
animal.
These and other aspects, features, and advantages of the present invention are
further described in the following Detailed Description, which is to be read
in
conjunction with the accompanying drawings.
BRIEF DESCRIPTION OF THE DRAWINGS
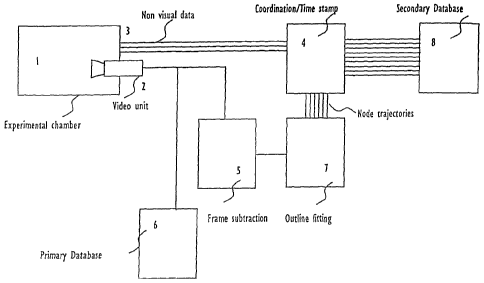
FIG. 1 is a perspective view depicting elements of the system in accordance
with
one embodiment of the invention.
FIG. 2 is a top view of the laboratory cage illustrating the portability of
the
system.
FIG. 3 is a front view of the laboratory cage illustrating the main
experimental
module.
FIG. 4 is an example showing the processing of a video frame.
FIG. 5 is an example of the outline fitting of 4 consecutive frames.
CA 02451992 2003-11-05
WO 02/092101
PCT/US02/15981
16
FIG. 6 is a graphic and analytical representation of the node trajectories
from
FIG. 5.
FIG. 7 is a diagram showing how the video and non-video signals are combined
and time stamped.
FIG. 8 is a diagram showing necessary processes to summarize the complex
dataset resulting from signal combination and time stamp and the resulting
state
probabilities and state transition probabilities.
FIG. 9 is an example showing a comparison between two probability diagrams
corresponding to a control and an experimental subject.
FIG. 10 is an example showing two classes of drugs resulting from the
clustering
analysis based on the probability diagrams, and an example showing a query of
the database that results in the "diagnosis" of the new drug x, based on the
normative clustering of the database.
FIGS. 11A and 11B show an exemplary combination of data streaming from an
animal in an embodiment of the subject system.
FIG 11C shows two different sequences of behavior, obtained from two different
animals.
FIG. 12 shows a possible sequence of these three behaviors arising from one
animal.
FIG 13 shows exemplary data from an experiment in which mice were treated
with one of the indicated drugs ensuing behavior was recorded and later coded
by human observers
FIG 14 provides a schematic representation of one embodiment of the data
handling modules of a preferred system.
FIG 15 shows a front perspective view of a preferred embodiment of the system.
FIG 16 shows a rear perspective view of a preferred embodiment of the system.
DETAILED DESCRIPTION OF THE INVENTION
I. Overview
The invention provides a method, apparatus and data analysis method for
massively parallel behavioral, neurological, biochemical and/or physiological
data
acquisition, analysis, storage and data mining capacity.
CA 02451992 2003-11-05
WO 02/092101
PCT/US02/15981
17
Using combinations of machine learning, statistical analysis, modeling
techniques and database technology, the subject method advantageously utilizes
data
mining techniques to find and identify patterns and subtle relationships in
animal
data that permits inference of rules for the prediction of drug effects.
In many embodiments, the subject methods and systems brings greater
precision to behavior analysis compared to traditional behavior testing
methods. By
automating arid systematizing the way in which behavior is captured and
collected,
the subject systems can be used to standardize the translation and
interpretation of
visual data, preferably in combination with physiologic data, enabling this
information to be stored into a relational database (along with non-visual
data also
captured during the screening) for analysis. Furthermore, by having the
ability to
store and compare the captured data in a standardized format, the present
method
enables the generation of databases related to CNS functions and disorders
unparalleled in content. This can greatly increase accuracy and facilitate
interpretation of the screening process by providing a strong foundation for
comparative analysis.
CNS disorders include mood disorders such as anxiety and depression,
psychotic conditions such as schizophrenia, Attention Deficit Disorder (ADD)
and
Attention Deficit HyperActivity Disorder (ADHD), Alzheimer's disease,
migraine,
epilepsy, Multiple Sclerosis and Amyotrophic Lateral Sclerosis ("ALS" or Lou
Gehrig's Disease). Exemplary CNS disorders that can be modeled by the subject
method include
CA 02451992 2003-11-05
WO 02/092101 PCT/US02/15981
18
ATTY REF: PSCO-pW1-001
= Anxiety disorders = Mania
= Depression 10 =
Neurodegenerative disorders
= Schizophrenia = Addiction
= ADHD / Impulsivity = Pain
= Eating disorders (obesity) = Epilepsy
= Cognitive disorders (e.g. =
Neuromotor disorders
Alzheimer's Disease, Dementia)
= Sleep disorders
= Aggression
= Sexual disorders
It is estimated that certain embodiments of the subject system can reduce the
CNS
drug discovery process by up to three years and generate better choices of
candidates for drug
development due to the following:
= Throughput that is 50 to 100 times higher
= Better predictions of efficacy and safety through greater accuracy of
data
collection and analysis
= Continuously updated database that facilitates interpretation of results
by
benchmarking against known compounds
In certain embodiments, the present invention combines contemporary
understanding
of the measurement of animal behavior and the relationship of these behaviors
to CNS
disorders with state-of-the-art video capture and digitizing techniques and
data management.
The result can be fully automated, standardized system for conducting
behavioral,
neurological, biochemical and/or physiological experiments on mice or other
laboratory
animals and collecting, processing, storing and analyzing the resulting data.
The present invention also contemplates methods of conducting informatics and
drug
assessment businesses utilizing the apparatus, methods and databases of the
present invention.
This invention provides a system for use in the assessment of behavioral
characteristics that depend on different genetic backgrounds, genetic
manipulations and drug
effects. In one embodiment, the system comprises a module for collecting
physical and
biological data concerning a test subject. The module further communicates
with a processor
that interprets the data to capture and time-stamp the active pixels in the
video input. In one
embodiment the data collection hardware is replicated in large numbers
allowing many
CA 02451992 2003-11-05
WO 02/092101 PCT/US02/15981
19
subjects to be tested simultaneously. Animals observed at the same time may be
part of the
same experiment or a variety of different experiments. The system and method
also allows
hypothesis and validation of test animal behavior when the test animal is
exposed to
manipulation and/or an experimental drug, or when genetically manipulated
animals are
studied.
The apparatus and method used to assess animal behavior includes a module
having
one or more sensors that collectively obtain a variety of physical and
biological data from a
test subject. The sensors of the apparatus also may provide for the ability to
simultaneously
obtaining data pertaining to different states in the data collecting hardware.
Such states
include but are not limited to the position of different mechanical parts of
the hardware, active
video pixels that may or may not correlate with the subjects position and
movement, the
signals arising from telemetric devices such as cardiac signals and any other
analogical or
digital signal that can be collected simultaneously (or within a close time
window). Time
stamped data is stored in a secondary database (where primary database refer
to a putative off
line storage of video images and other raw data) that allows sophisticated
mining. Complex
signals are summarized in probability maps using, for example, hidden Markov
models
(HM_Ms) to assign transition probabilities between different combinations of
the many
variables collected. Preferably low-probability states are not dropped from
the model, as these
low-probability states will help define the more subtle characteristics of the
drug or gene
signature. These probability maps will be differential, a result of the
comparison between a
control group and the experimental group. Multiple-dimensional modeling of the
test subject
based on the system's interpretation of the data allows pattern recognition of
the drug
signature, predictive drug analysis, and interpretation of the phenotype of a
genetically
engineered animal.
II. Definitions
"Accuracy" can be an important factor in assessing the success of data mining.
When
applied to data, accuracy refers to the rate of correct values in the data.
When applied to
models, accuracy refers to the degree of fit between the model and the data.
This measures
how error-free the model's predictions are.
The term "API" refers to an application program interface. When a software
system
features an API, it provides a means by which programs written outside of the
system can
interface with the system to perform additional functions. For example, a data
mining
software system of the subject invention may have an API which permits user-
written
CA 02451992 2003-11-05
WO 02/092101 PCT/US02/15981
programs to perform such tasks as extract data, perform additional statistical
analysis, create
specialized charts, generate a model, or make a prediction from a model.
An "association algorithm" creates rules that describe how often behavioral,
neurological, biochemical and/or physiological events have occurred together.
Such
5 relationships are typically expressed with a confidence interval.
The term "backpropagation" refers to a training method used to calculate the
weights
in a neural net from the data.
The term "binning" refers to a data preparation activity that converts
continuous data
to discrete data by replacing a value from a continuous range with a bin
identifier, where each
10 bin represents a range of values. For example, the number of convulsion
episodes per hour
could be converted to bins such as 0, 1-5, 6-10 and over 10.
"Categorical data" fits into a small number of discrete categories (as opposed
to
continuous). Categorical data is either non-ordered (nominal) such as gender,
age or weight of
the animal, or ordered (ordinal) such as high, medium, or low responses to a
stimuli.
15 The term "classification" refers to the problem of predicting the number
of sets to
which an item belongs by building a model based on some predictor variables. A
"classification tree" is a decision tree that places categorical variables
into classes.
A "clustering algorithm" finds groups of items that are similar. For example,
clustering could be used to group drugs according to effect on ambulatory
movements, pain
20 sensitivity, convulsions, cardiac output and QT interval. It divides a
data set so that records
with similar content are in the same group, and groups are as different as
possible from each
other. When the categories are unspecified, this is sometimes referred to as
unsupervised
clustering. When the categories are specified a priori, this is sometimes
referred to as
supervised clustering.
The term "confidence" refers to a measure of how much more likely it is that B
occurs
when A has occurred. It is expressed as a percentage, with 100% meaning B
always occurs if
A has occurred. This can also be referred to this as the conditional
probability of B given A.
When used with association rules, the term confidence is observational rather
than predictive.
"Continuous data" can have any value in an interval of real numbers. That is,
the value
does not have to be an integer. Continuous is the opposite of discrete or
categorical.
The term "degree of fit" refers to a measure of how closely the model fits the
training
data.
CA 02451992 2003-11-05
WO 02/092101 PCT/US02/15981
21
The term "discriminant analysis" refers to a statistical method based on
maximum
likelihood for determining boundaries that separate the data into categories.
The "dependent variables" (outputs or responses) of a model are the variables
predicted by the equation or rules of the model using the independent
variables (inputs or
predictors).
Frame: A single image from a video sequence.
Field: A portion of a video frame. Many video cameras generate interlaced
video, in
which each full frame is made by alternating lines from two Fields.
The term "gradient descent" refers to a method to find the minimum of a
function of
many variables.
The "independent variables" (inputs or predictors) of a model are the
variables used in
the equation or rules of the model to predict the output (dependent) variable.
The term "itemsets" refers to a set of items that occur together.
The phrase "k-nearest neighbor" refers to a classification method that
classifies a point
by calculating the distances between the point and points in the training data
set. Then it
assigns the point to the class that is most common among its k-nearest
neighbors (where k is
an integer).
The term "machine learning" refers to a computer algorithm used to extract
useful
information from a database by building probabilistic models in an automated
way.
The term "mode" refers the most common value in a data set. If more than one
value
occurs the same number of times, the data is multi-modal.
A "model" can be descriptive or predictive. A "descriptive model" helps in
understanding underlying processes or behavior. For example, an association
model describes
the effects of a drug on animal physiology as manifest in the tested
behaviors. A "predictive
model" is an equation or set of rules that makes it possible to predict an
unseen or unmeasured
value (the dependent variable or output) from other, known values (independent
variables or
input). For example, a predictive model can be used to predict side-effects of
a drug in
humans based on behavioral, neurological, biochemical and physiological data
for the drug
when used in non-human animals.
Motion Artifact: Inaccuracy in a video image due to motion in the imaged
scene.
Especially when significant motion occurs between the acquisition of the to
fields which
make up a frame.
CA 02451992 2003-11-05
WO 02/092101 PCT/US02/15981
22
A "node" is a decision point in a classification (i.e., decision) tree. Also,
a point in a
neural net that combines input from other nodes and produces an output through
application
of an activation function. A "leaf' is a node not further split -- the
terminal grouping -- in a
classification or decision tree.
Occlusion: In an image, the obstruction of an object or portion of the
background by
objects in the foreground.
A "regression tree" is a decision tree that predicts values of continuous
variables.
Segmentation: The identification and labeling of those image pixels that make
up an
object of interest, such as a mouse, so that those pixels can be distinguished
from the image
background.
The term "significance" refers to a probability measure of how strongly the
data
support a certain result (usually of a statistical test). If the significance
of a result is said to be
.05, it means that there is only a .05 probability that the result could have
happened by chance
alone. Very low significance (less than .05) is usually taken as evidence that
the data mining
model should be accepted since events with very low probability seldom occur.
So if the
estimate of a parameter in a model showed a significance of .01 that would be
evidence that
the parameter must be in the model.
= "Supervised learning" refers to a data analysis using a well-defmed
(known)
dependent variable. All regression and classification techniques are
supervised. In contrast,
"unsupervised learning" refers to the collection of techniques where groupings
of the data are
defined without the use of a dependent variable. The term "test data" refers
to a data set
independent of the training data set, used to evaluate the estimates of the
model parameters
(i.e., weights).
A "time series" is a series of measurements taken at consecutive points in
time. Data
mining methods of the present invention that handle time series can
incorporate time-related
operators such as moving average. "Windowing" is used when training a model
with time
series data. A "window" is the period of time used for each training case.
The term "time series model" refers to a model that forecasts future values of
a time
series based on past values. The model form and training of the model can take
into
consideration the correlation between values as a function of their separation
in time.
The term "training data" refers to a data set independent of the test data
set, used to
fine-tune the estimates of the model parameters (i.e., weights).
CA 02451992 2003-11-05
WO 02/092101 PCT/US02/15981
23
"Visualization" tools graphically display data to facilitate better
understanding of its
meaning. Graphical capabilities range from simple scatter plots to complex
multi-dimensional
representations.
III. Data Generation and Analysis
A. Behavioral Data
The behavioral data can include data on one or more of sleeping, grooming,
locomotion (including ambulatory and non-ambulatory movements, foot
misplacement, and
the like), rearing, stereotypic behavior, digging, body weight, temperature,
anxiety, intake,
pain sensitivity, convulsions, cardiac response (e.g., output, QT interval),
respiration (e.g.,
rate, 02 or CO2), learning, memory (short/long), task switching, attention,
discrimination,
motivation, response inhibition, reward sensitivity, avoidance, startle,
tolerance and
withdrawal.
In certain embodiments, the behavioral data includes data representative of
one or
more of immobility, approach, circling, chewing, digging/burying, drinking,
eating, freezing,
gait (normal, abnormal), grooming (face, ano genital, abnormal), huddling,
intake, jump
(horizontal, vertical, stereotyped), lever-pressing, locomotion (walk, run),
nose-poking,
rearing (normal, stereotyped), seizures (tonic, clonic), self-biting,
scratching (normal,
stereotyped), stretch-attend, sleeping, sniffing, startle, stereotypic
behavior, tail position,
temperature, twitching, yawning.
The behavioral data may also, or alternatively, include data concerning
anxiety,
attention, arousal, avoidance, circadian rhythms, discrimination, habituation,
learning,
memory, motivation, pain sensitivity, response inhibition and sensitization,
reward sensitivity,
sensitization, sensory motor gating, sleeping patterns, stereotypic behavior,
task switching,
tolerance, withdrawal, fear conditioning, home cage observation,
Irwin/neurological effects,
light/dark box, locomotor activity (open field test), prepulse inhibition of
startle ¨ startle
habituation, pain response, metabolic chambers, and operant conditioning.
Merely for illustration, the ability of the subject system to capture some of
the
behavioral states mentioned above in a fully automated way is briefly
described below in
greater detail with respect to a mouse (an ideal test animal) although it will
be readily
appreciated that the instant invention is not limited to just this species of
animal.
CA 02451992 2003-11-05
WO 02/092101 PCT/US02/15981
24
High Tower Walk Test: From all measures mentioned misstepping in between of
rods
systematically arranged on a surface seems to provide high sensitivity to the
sedative and
ataxic effects of some drugs.
Orienting Movement: In this test the latency to orient to a tactile stimulus
(air puff
directed to right or left side of head) provides sensitivity to moderate to
severe dopaminergic
depletion in animals treated with particular drugs.
Locomotor Activity: Apart from monitoring spontaneous activity and response to
acute drug effects, changes in locomotor activity over repeated injections may
reflect
tolerance and sensitization to drug effects. Sensitization to amphetamine, for
example, is
reflected with an increased response to the hyperlocomotor effects of the drug
upon repeated
exposure.
Circadian Activity: Measurement of general activity in a day - night cycle.
Sensitive to
hypothalamic dysfunction as well as neuromuscular damage. Can be combined with
measures
of food and water consumption over the circadian cycle to assess eating,
spontaneous
circadian behavior or non-specific drug effects. Although this is a test that
has been
successfully automatized (using lickometers, running wheels, etc), the instant
invention will
provide comprehensive assessment of all ongoing behaviors.
Pre-pulse Inhibition: A test of the ability of animals to "gate" or inhibit
the effect of
environmental information. Normal animals exhibit less of a startle response
to a sudden loud
sound if it has been preceded by a softer sound. Its impairment may typify
some aspects of
schizophrenia. A simple addition to the subject system (e.g., for delivery of
localized brief air
puff) will enable this capability.
Defensive Burying Test: In this test the mouse is challenged with a mild
electric shock
upon contact with a shock probe. Preliminary studies show that the fear
responses (approach
to the probe, contact, burying, freezing) of mice in this test are sensitive
to anxiolytic and
antidepressant treatment.
(i) Overt Behavior
Motor responses typically include changes in movement or motor function, or
lack
thereof. Several aspects of motor function can be assessed: frequency of
occurrence, type,
degree of motor coordination, temporal pattern and functional significance.
These different
aspects can be assessed in different ways. For example, motor responses may be
examined by
requiring a response consisting of moving a lever, pecking a key or moving an
object.
CA 02451992 2003-11-05
WO 02/092101 PCT/US02/15981
Additionally, motor responses may be more extensively characterized by forcing
the test
subject to perform in somewhat extreme conditions with the use of some
physical challenge
such as an obstacle course or maze. Many obstacles can be incorporated into
the invention
including stairs, treadmills, and the like.
5 Motor activity, as defined in this description, is meant to be any
physical activity such
as a physical change or any movement or lack of by the test subject. For
example, such
activity may include, but is not limited to immobility, approach, circling,
chewing,
digging/burying, drinking, eating, freezing, gait (normal, abnormal), grooming
(face,
anogenital, abnormal), huddling, intake, jump (horizontal, vertical,
stereotyped), lever-
10 pressing, locomotion (walk, run), nose-poking, rearing (normal,
stereotyped), seizures (tonic,
clonic), self-biting, scratching (normal, stereotyped), stretch-attend,
sleeping, sniffing, startle,
stereotypic behavior, tail position, temperature, twitching, yawning.
Other biological changes may include responses associated with a change in the
functioning of the nervous system and may include, for example, changes in
heart rate, blood
15 pressure, temperature, perspiration, piloerection, and respiration. In
one possible embodiment
of this invention measurement of heart rate (thorough telemetry or another
technique) and
other physiological measures are recorded in parallel with the behavioral
data. Another form
of biological response which may be used to contribute to defining an animal
behavior
according to this invention is a change in neuronal activity measured using a
variety of means
20 known to those skilled in the art including, for example, the use of
chronically implanted
electrodes to measure neuronal activity.
Conditioned responses may also be studied by the invention including, but not
limited
to, the effects of drugs on a test subject prior to and/or after behavioral
conditioning.
By measuring a plurality of responses this invention provides a means for
objectively
25 monitoring and detecting changes in animal behaviors. Complex behaviors
such as
aggression, emotional responses to aversive stimulation, nursing and other
maternal
behaviors, and the like may thus be assessed according to this invention by
monitoring a
plurality of responses occurring when such behaviors are exhibited, and by
using
sophisticated data mining tools as described below. Effects of drugs on the
animal's
behaviors may then be determined by detecting changes in the plurality of
behavioral and
physiological measures captured by this invention.
=
(ii) Additional Aspects Of Behavior
CA 02451992 2003-11-05
WO 02/092101 PCT/US02/15981
26
This invention serves to capture unconditioned and conditioned behavior in
parallel
with physiological data. Unconditioned behavior may be assessed by the
invention for use in
the research on the effects of drugs. This type of behavior is elicited by
specific stimuli and
usually involves no specific training or conditioning to the test subject.
Responses are
typically part of the behavioral repertoire of the species and are expressed
under suitable
environmental conditions. Although factors responsible for the occurrence of
these behaviors
presumably lie in the organism's distant evolutionary past, certain
unconditioned responses,
called reflexes, can be brought under more direct and immediate experimental
control through
the use of various procedures known to those skilled in the art. Such
procedures consist of
expanding the range of stimuli capable of producing or eliciting a response
and by exploring
the pattern of responses elicited by specific types of stimuli or arrangement
of stimuli. For
instance, considerable use has been made of a procedure for the study of
antipsychotic drugs
in which a strong tactile or auditory stimulus is presented and a "startle"
response is elicited.
When the startle reflex is reduced by the presentation of a brief stimulus
presented
immediately before the eliciting startle stimulus, "prepulse inhibition"
results. This
phenomenon has been useful in the evaluation of neuroleptic drugs and other
such drugs. In
one embodiment of this invention such a phenomenon will be evaluated.
With the use of conditioned responses (Pavlovian and/or operant) memory and
learning can be assessed. The invention may also be used for the study of
drugs that impair or
enhance memory, and by gene manipulations that result in enhanced or impaired
learning and
memory.
Pavlovian conditioning can be obtained by training the test subject to expect
that a
reinforcement will be delivered, for example, after a given period after a
auditory or visual
signal is presented. Behavior and physiological responses in anticipation and
in response to
the stimulus can then be registered and compared against a control group.
Operant
conditioning can be studied by the invention by training the test subject to
perform a response
to obtain reward or to avoid punishment. In this realm, a further embodiment
of the invention
is control of inputs (lever, nose poke, etc) and outputs (lights, sounds, etc)
that may serve to
enforce schedules of reinforcement.
The invention can also be used to study complex species-specific behavior
patterns in
animals. These types of behaviors have evolved in situations of survival.
Selection pressure
has resulted in the development of sensory and motor functions, sexual
behavior, care of the
young, social cohesion and dispersion, and interactions with other species in
the ecological
niche. These elaborate behavior patterns are the result of phylogenetic and
ontogenetic
processes. Typically, no explicit conditioning is required for their
expression, although they
CA 02451992 2003-11-05
WO 02/092101 PCT/US02/15981
27
can be modified. For example, it is possible to reproduce under controlled
conditions the
essential features of situations promoting the display of those elements of
the behavioral
repertoire that are characteristic of exploration, foraging, reproduction,
maternal care,
attachment to and separation from the group, as well as aggression and
defense.
The invention may, depending on the implementation, use another method in the
experimental analysis of behavior known as stimulus discrimination. In
essence, this
procedure consists of establishing a drug as a stimulus in the presence of
which a particular
response is reinforced. The use of a drug to gain discriminative control over
behavior is very
different from that mentioned earlier in which a drug elicits a reflexive-like
behavior. When a
drug develops properties of a discriminative stimulus, it "sets the occasion"
for a response.
This phrase means that the administration of the drug does not merely produce
the response
but makes the response more likely to occur because of past consequences in
the presence of
that stimulus.
Typically, when a drug is established as a discriminative stimulus, a single
dose of a
drug is selected and, following its administration, one of two responses are
reinforced. For
example, with rodents or nonhuman primates this consists of pressing one of
two
simultaneously available levers for reinforcement after a fixed number of
correct responses.
Alternatively, when saline or a control vehicle is administered, responses on
the other operant
are reinforced. Over a number of experimental sessions, a discrimination
develops between
the internal cues induced by the drug and by the control substance, with these
interoceptive
stimuli produced by the two solutions seen as "guiding" or controlling
behavior in much the
same manner as any external stimulus such as a visual or auditory stimulus.
Once established,
it is possible to perform several additional studies to investigate aspects of
the drug stimulus
in the same way as one might investigate other physical stimuli. Thus, it is
possible to
determine "intensity" gradients or dose¨effect functions as well as
generalization functions
that are directed towards determining how similar the training drug dose is to
a different dose
or to another drug that is substituted for the training stimulus. It also
possible to use drug
discrimination techniques as a means for exploring changes in neurotransmitter
function
following exposure to neurotoxins or other types of interventions that may
alter receptors in
the central nervous system.
Protocols for eliciting conditioned and unconditioned responses may be
automated,
and done by the invention. For example, measurements of behavior in
unconditioned and
conditioned tests such as a response startle in response to a loud stimulus,
or an avoidance
response to a nociceptive stimulus will result in precise and accurate data
through the use of
the invention because of the automated and thorough data capturing
capabilities of the device.
CA 02451992 2003-11-05
WO 02/092101 PCT/US02/15981
28
(iii) Objectivity In The Measurement Of Behavior
Adequate measurements of the behavioral expressions of affect, for example,
require
familiarity with the species-specific behavior in order to avoid
impressionistic and
anthropomorphic accounts that can lead to a misinterpretation by the observer.
The invention
avoids such a bias by providing a complete analysis of the test subject's
behavior objectively
through pre-programmed logic to determine the behavior from the behavioral and
physiological responses. Quantitative ethological methods can be used in the
invention's
comprehensive analyses by incorporating the traditional behavioral
measurements of latency,
frequency, and duration parameters, as well as a quantification of the
temporal and sequential
pattern. Increasingly more sophisticated levels of analysis can be performed
by the invention
to assess not just the presence or absence of these behaviors, but also
whether or not the
species-typical acts, postures, displays, and gestures are performed in a
particular temporal
topography of intensity and frequency.
The invention will provide precise analyses of salient and subtle elements in
an
animal's repertoire for detecting behaviorally selective drug action. For
example, a broad
profile of action for a desired drug effect can be assessed, to cover central
and side effects.
As the availability of agents to treat various neurological and psychiatric
disorders increases,
and the selectivity of the drugs available to treat those disorders improves,
it will be possible
to use this information to design even more sensitive and selective procedures
for the
evaluation of pharmacological activity. Thus, the invention can further drug
research.
(iv) Other Morphological and Physiological Tests
a. Radiotelemetry Recording
Information on physiological parameters of mice such as heart rate, blood
pressure and
body temperature can be critical in evaluating effects of genetic
manipulations and drug
treatments on the brain and the body of the animal. The state-of-the-art
technology to address
these issues is continuous, long-term monitoring of these parameters by using
radiotelemetry
recording. This can be accomplished by implanting a small device into the body
of the animal
that transmits signals registered by a computer for an extended period of
time, up to several
months without disturbing the mouse or its environment. Changes in heart rate,
blood
pressure or body temperature can provide important information to understand
gene function
and drug effects.
CA 02451992 2003-11-05
WO 02/092101 PCT/US02/15981
29
This approach can be utilized for mutant mouse phenotyping, and to pick up
efficacy
or side-effects of novel compounds. Furthermore, radiotelernetric recording
can extend and
complement the behavioral signature analysis with physiological signatures to
obtain a full
profile.
b. In vivo microdialysis in the brain
Changes in the level of neurotransmitters, and therefore, information
processing in the
brain, have been described as a principal mechanism that underlies normal and
pathological
behavior. This can be monitored by implanting a small dialysis probe into the
brain nuclei of
interest then measuring the concentrations of neurotransmitters that have been
implicated in
CNS disorders, in awake, freely moving mice. In certain embodiments, in vivo
microdialysis
measurement of major neurotransmitters and their metabolites can be carried
out, e.g., on
mutant mice and on mice treated with drugs. This allows the determination and
correlation of
quantitative changes in neurochemistry and behavior on the same subject at the
same time.
c. Functional Neuromorphology
Based on the understanding of the relationship between genes, brain structures
and
function, a comprehensive range of functional neuromorphology services
designed to assess
changes in a gene and/or protein expression, structural changes, cell death
and cell birth can
be carried out.
d. In situ hybridization histochemistry
The subject method can also include the use of high-quality, quantitative
(radioactive)
and semi-quantitative (fluorescent) in situ hybridization histochemistry aided
by mathematical
tools to measure changes in gene expression in the brain of mutant mice as
models of CNS
disorders or in response to drug treatment. For instance, high-resolution, non-
radioactive
fluorescent in situ hybridization histochemistry can be used to identify
expression of multiple
genes at a single-cell level that can be combined with immunohistochemistry to
visualize
proteins expressed in the same cells. The combination of quantitative
radioactive and high-
resolution, non-radioactive in situ hybridization technologies allows
acquisition of
information on quantitative changes of gene expression in the mouse brain at
the level of a
single neuron within a particular brain nucleus.
CA 02451992 2003-11-05
WO 02/092101 PCT/US02/15981
e. Neurohistology
Histology can be used to characterize gross morphological changes such as
lesions and
neurodegeneration, or to measure structure volume, cell count, etc. For
example, cell loss and
5 volume reduction in the hippocampus is characteristic of depression and
aging, and is
observed in certain respective animal models. In certain embodiments, the
subject method
also measures structural changes including dendritic and spine morphology,
cell death and
neurogenesis in the adult brain.
10 f Irnmunohistochemistry
Immunohistochemistry can be used for neurochemical cell phenotyping;
localization
of neurons containing certain peptides, enzymes or receptors; and measurement
of synaptic
markers. Immunohistochemistry can also be used to measure neuronal activity by
measuring,
for example the expression of the immediate-early gene product protein, cFos.
g. Microdissection
Microdissection of the animal brain, e.g., using the "punch method" or the
like, can
provide anatomical identification of brain nuclei suitable for gene expression
profiling to
determine response to drugs, behavioral intervention and genetic manipulation.
h. Microinjection technology
Microinjection technology can be used to target the cerebral ventricles as
well as
identified brain nuclei in a test animal. This can be used in preparing
antisense and viral
vector treated mice and for compound/peptide delivery where penetration is
poor.
i. Standard histological staining procedures
Standard histology can be used to characterize gross morphological changes
such as
lesions, neurodegeneration, or to measure structure volume, cell counts, etc.
For example, cell
loss and volume reduction in the hippocampus is characteristic of depression
and aging, and is
also observed in certain respective animal models.
CA 02451992 2003-11-05
WO 02/092101 PCT/US02/15981
31
j. Golgi staining
Golgi staining can be used to visualize dendritic trees and spines of neurons
in the
brain. Dendritic length and spine density can be measured from individual,
Golgi stained
neurons. Dendritic morphology and spine density has been shown to be altered
in animal
models of depression and in the cortex and hippocampus of schizophrenics.
Changes in spine
density may reflect changes in number of synaptic connections and therefore
altered activity
of the neural network.
=
k. Neuroplasticity studies
Neuronal death by apoptosis and necrosis, and cell proliferation in the adult
mouse
brain, can be measured by TUNEL staining, silver staining, and BrdU labeling,
respectively.
Rate of neurogenesis can be determined by measuring BrdU-positive cells double-
labeled
with neuronal markers using confocal fluorescent microscopy. Neuronal death
and neuro-
genesis can be influenced by genes, various treatment conditions or
experimental
manipulations.
1. Genotyping
PCR or Southern-blot based genotyping procedures and the like can be used to
identify and breed client owned transgenic or knock-out mice housed in the
service provides
colonies for the purpose of behavioral testing.
B. Database Analysis Techniques
Various data mining techniques can be used as part of the subject invention,
hi certain
preferred embodiments, the data mining system uses classification techniques,
such as
clustering algorithms, which find rules that partition the database into
finite, disjoint, and
previously known (or unknown) classes. In other embodiments, the data mining
system uses
association techniques, e.g., of summarization algorithms, which find the set
of most
commonly occurring groupings of items. Yet in other embodiments, the
datamining system
uses overlapping classes.
In one embodiment, the subject method using a data mining technique based on
association rules algorithms. These techniques derive a set of association
rules of the form
CA 02451992 2003-11-05
WO 02/092101 PCT/US02/15981
32
X = Y , where X and Y are sets of behavioral, neurological, biochemical and
physiological
responses and each drug administration is a set of literals. The data mining
task for
association rules can be broken into two steps. The first step consists of
finding all large
itemsets. The s'econd step consists of forming implication rules with a user
specified
confidence among the large itemsets found in the first step. For example, from
a behavioral
dataset, one may find that an association rule such as drugs which caused a
reduced sensitivity
to pain often cause a decrease in respiratory rate. Association rules can also
be more
complex, requiring that two or more criteria are met in order for the rule to
evoked. A rule
X
Y holds in the data set D with confidence c if c% of the occurrences of X in
the data set
also contain Y. The rule X = Y has support s in the data set if s% of the
entries in D contain
X = V. Confidence is a measure of the strength of implication and support
indicates the
frequencies of occurring patterns in the rule.
Another technique that can be used in the methods of the present invention is
the
process of data classification. Classification is the process of finding
common properties
among a set of "objects" in a database, and grouping them into various classes
based on a
classification scheme. Classification models are first trained on a training
data set which is
representative of the real data set. The training data is used to evolve
classification rules for
each class such that they best capture the features and traits of each class.
Rules evolved on
the training data are applied to the main database and data is partitioned
into classes based on
the rules. Classification rules can be modified as new data is added.
Yet another data mining technique that can be used in the subject method is
the use of
sequential pattern mining. This technique can be used to find sequential
patterns which occur
a significant number of times in the database. This analysis can be used to
detect temporal
patterns, such as the manifestation of secondary adaptation or effects
involving combinatorial
therapies. Time-Series clustering is another data mining technique that can be
used to detect
similarities in different time series.
In yet another embodiment, the subject method uses a clustering method for
finding
correlations in the behavioral database(s). In general, clustering methods can
be broadly
classified into partitional and hierarchical methods.
Partitional clustering attempts to determine Icpartitions that optimize a
certain criterion
function. The square-error criterion is a good measure of the within-cluster
variation across
all the partitions. The objective is to find k partitions that minimize the
square-error. Thus,
square-error clustering tries to make the k clusters as compact and separated
as possible, and
works well when clusters are compact clouds that are rather well separated
from one another.
CA 02451992 2003-11-05
WO 02/092101 PCT/US02/15981
33
Hierarchical clustering is a sequence of partitions in which each partition is
nested into
the next partition in the sequence. An agglomerative method for hierarchical
clustering starts
with the disjoint set of clusters, which places each input data point in an
individual cluster.
Pairs of clusters are then successively merged until the number of clusters
reduces to k. At
In another embodiment, the subject method uses Principal Component Analysis
(PCA). This is not a classification method per se. The purpose of PCA is to
represent the
variation in a data set into a more manageable form by recognizing classes or
groups. The
Still another embodiment utilizes a neural net or neural network, e.g., a
complex non-
linear function with many parameters that maps inputs to outputs. Such
algorithms may use
The neural net can be trained with "supervision", i.e., a mechanism by which
the net is
CA 02451992 2003-11-05
WO 02/092101 PCT/US02/15981
34
Supervised learning requires the buildup of a library of readily classified
data sets for
input into the neural net. Although more economic in terms of the amount of
data needed,
supervised learning implies that only pre-determined classes can be ascribed
to unseen data.
To allow for the possibility of finding a novel therapeutic class, such as
"antidepressant drugs
with anti-manic component" unsupervised clustering could be more appropriate.
In certain embodiments, a preferred method can combine both types of learning:
a
supervised learning of the neural net until it correctly classifies a basic
training set but which
also utilizes unsupervised learning to further subdivide the trained classes
into meaningful
sub-classes, or to add completely new sub-classes.
Principal component analysis (P CA) involves a mathematical procedure that
transforms a number of (possibly) correlated variables into a (smaller) number
of uncorrelated
variables called principal components. The first principal component accounts
for as much of
the variability in the data as possible, and each successive component
accounts for as much of
the remaining variability as possible. Traditionally, principal component
analysis is
performed on a square symmetric matrix of type SSCP (pure sums of squares and
cross
products), Covariance (scaled sums of squares and cross products), or,
Correlation (sums of
squares and cross products from standardized data). The analysis results for
matrices of type
SSCP and Covariance do not differ. A Correlation object is preferably used if
the variances of
individual variates differ much, or the units of measurement of the individual
datapoints
differ, such as is the case when the analysis comprises data from behavioral,
neurological,
biochemical and physiological measures. The result of a principal component
analysis on such
objects will be a new object of type PCA.
In still other embodiments, the subject method utilizes K-means and fuzzy
clustering.
Gaussian mixture models are a common version of this. These techniques are
"unsupervised"
clustering methods. They assume the user has no outputs, but would like to
group the data
anyway according to inputs that are similar to each other. The idea is to
choose a model for
each cluster. For example, each cluster may consist of points inside a hyper-
sphere centered
at some location in the input space. These methods automatically determine the
number of
clusters, place them in the correct places, and determine which points belong
to which
clusters. An advantage to these techniques is that they can be efficient
algorithms and can do
a good job of finding clusters. This is a method of choice when the user does
not have a priori
information about the classes
Another embodiment utilizes the hierarchical clustering Serial Linkage Method.
This
is an unsupervised clustering method in the same sense as K-means and fuzzy
clustering.
CA 02451992 2003-11-05
WO 02/092101 PCT/US02/15981
Here individual points are joined to each other by being close to each other
in the input space.
As these points are joined together, they define clusters. As the algorithm
continues, the
clusters are joined together to form larger clusters. Compared to K-means and
fuzzy
clustering, hierarchical clustering has the advantage that clusters can have
arbitrary non-
5 predefined shapes and the result correctly shows "clusters of clusters."
A disadvantage to
these methods is they tend to be more sensitive to noise.
Yet another embodiment utilizes a nearest neighbor algorithm. This is a true
supervised learning method. There is a set of training data (inputs, i.e.
datapoints, and
outputs, i.e. classes) that are given in advance and just stored. When a new
query arrives, the
10 training data is searched to find the single data point whose inputs are
nearest to the query
inputs. Then the output for that training data point is reported as the
predicted output for the
query. To reduce sensitivity to noise, it is common to use "k" nearest
neighbors and take a
vote from all their outputs in order to make the prediction.
In yet another embodiment, the subject method uses a logistic regression
algorithm.
15 This is related to linear regression (fitting a line to data), except
that the output is a class
rather than a continuous variable. An advantage is that is method provides a
statistically
principled approach that handles noise well.
Still another embodiment utilizes a Support Vector Machine algorithm. This
also has
a linear separator between classes, but explicitly searches for the linear
separator that creates
20 the most space between the classes. Such techniques work well in high
dimensions. Yet
another embodiment relies on a Bayes Classifier algorithm. The simplest form
is a naive
Bayes classifier. These algorithms build a probabilistic model of the data
from each class.
Unsupervised methods above may be used to do so. Then, based on a query, the
model for
each class is used to calculate the probability that that class would generate
the query data.
25 Based on those responses, the most likely class is chosen.
Yet another embodiment utilizes a Kohonen self organizing maps (SOM)
Clustering
algorithm. These algorithms are related to neural nets in the sense that
gradient descent is
used to tune a large number of parameters. The advantages and disadvantages
are similar to
those of neural networks. In relation to neural networks, Kohonen SOM
clustering algorithms
30 can have the advantage that parameters can be more easily interpreted,
though such
algorithms may not scale up to high dimensions as well as neural nets can.
The subject databases can include extrinsically obtained data, such as known
protein
interactions of a drug, chemical structure, Kd values, Pk/Pd parameters, 1050
values, ED50
values, TD50 values and the like.
CA 02451992 2003-11-05
WO 02/092101 PCT/US02/15981
36
The system of the present invention can also provide tools for visualizing
trends in the
dataset, e.g., for orienteering, to simplify user interface and recognition of
significant
correlations.
Certain embodiments of the subject system are designed to have increased power
to
Working with drug signatures implies that standard statistical tests are no
longer the
Example 1: Analysis
The output of the subject system can be visualized as a stream of numbers
(also called
"time series") representing the parameters that result from the computer
vision algorithm, and
Figure 11A shows an exemplary combination of data streaming from an animal in
an
embodiment of the subject system. For each window (in this case shown to
coincide with the
ECG sliding window) a given set of states and parameters is obtained from each
mouse.
CA 02451992 2003-11-05
WO 02/092101 PCT/US02/15981
37
It must be noted that the standard analyses of behavior in behavioral
pharmacology do
not address the issue of temporal structure, although they do address the time
course of
behavior.
To further illustrate, a possible way to summarize time series data in
preparation for
statistical analysis first reduces the problem of having several parallel
streams of data to a
unique simple sequence of three behaviors: grooming, running and locomotion.
Figure 11B recapitulates the sequence presented in Figure 11A, though letters
are
added each coding to signify that each combination of variables in each frame
has been
identified as a distinct state (by the learning algorithm). One can now think
of a single stream
of states (not longer just behavioral, as now we have succeeded to integrate
physiology and
behavior).
Figure 11C shows two different sequences of behavior, obtained from two
different
animals. In certain embodiments, it will desirable to find the similarity
between the two
sequences. Figure 11C shows a way to align the sequences utilizing string
matching
algorithms, such as those used in the BLAST algorithm or AGREP algorithms.
The principle can be simple: two sequences that align perfectly receive a
maximum
score. If there is a mismatch (in Figure 11C the first sequence needed to be
shifted 3 frames to
find the first match "A TL GP SS A"). For each shift needed to improve
matching, a value is
subtracted from the maximum score. As there are different ways to
(imperfectly) align
sequences, the best matching is the one that provides the higher score.
Figure 12 shows a possible sequence of these three behaviors arising from one
animal.
The idea that a temporal structure underlies such a sequence, as mentioned
before, means that
states are not independent from each other, and therefore the probability that
one state will
occur depends on the probability that the previous state has occurred. The
number of times
grooming followed walking reflects such probability (plus the total frequency
of grooming).
Therefore, if the system counts the number of walking-grooming transitions, it
will be
capturing two aspects of behavior, first, how much grooming occurs (where the
total
frequency of grooming will be the sum of all transitions that end up in
grooming, in this
example walking-grooming and running-grooming) and which other state predicts
grooming.
In Figure 12, the illustrated example counted the different transitions and
wrote the
results on a table, a transition table or matrix. One could also represent the
transitions as a
diagram with more frequent transitions being represented by thicker arrows,
and states as
nodes (circles in the figure). This is the typical way sequences of states
that are
interdependent (Markov chains) are represented. This way of visualizing the
transition
CA 02451992 2003-11-05
WO 02/092101 PCT/US02/15981
38
matrices has an immediate appeal: one can see now that the animal shuttled
most of the time
between walking and running, and only occasionally sustained bouts of
grooming, in an
unidirectional loop. Although all this information was embedded in the initial
sequence, no
human brain could have captured these characteristics of interdependency.
To make the representation of transition matrices easier to visualize, Figure
12 also
shows a matrix in which numbers have been replaced by shades of gray, just as
it is done in
gene-expression analysis. In fact, the similarity with tools used in
functional genomics will
become apparent in the next few paragraphs.
In certain embodiments, it will be desirable to distinguish between the
average drug
signature for drugs of different therapeutic indications. Merely to
illustrate, in such
embodiments one or more of the following criteria may be important to data
acquisition
and/or processing:
= Replication. Preferably the signature of a drug is stable and replicable,
when
testing is done in similar conditions.
= Significance. The signature of drug should be observed well over chance
levels.
= Discrimination. The signature of a drug is preferably significantly
different
from another drug signature, when the two drugs have no therapeutic overlap.
Testing drugs several times and comparing the results can address replication.
Significance is
illustrated in Figure 13, where exemplary data is shown from an experiment in
which mice
were treated with one of the indicated drugs ensuing behavior was recorded and
later coded
by human observers. In the analysis of transition matrices, the average matrix
of the drug
treated mice was combined with the average matrix of the control mice. The
control data was
treated as the "population" data as it was expected to have very large numbers
from mice
treated with same vehicle as more and more experiments that require such
vehicle are
conducted.
Even though vehicle treatments may be included with the corresponding drug
treated
group, it may be possible to analyze control groups across experiments and
build a normative
vehicle dataset.
Referring again to Figure 13, the average transition matrix was transformed as
a z-
score matrix based on the mean and standard error of the control matrix. In
doing so, every
drug transition (fd,i) subtracted the corresponding control transition (fc,i)
and divided by the
standard error (so), as in zdr-gd,i)-(fc,i))/(sc,i) was obtained. Although
this is just one possible
CA 02451992 2003-11-05
WO 02/092101 PCT/US02/15981
39
way to normalize the data (e.g., student t-scores can also be calculated), it
has some intuitive
appeal, as the z-scores can now be read as distance from the control in
standard-deviation
units. Thus, in Figure 13, the first cell of the matrix corresponding to
chlordiazepoxide (CDP),
can be read as "CDP increased the number of rear-rear transitions more than 30
fold".
Normalizing data using the controls can be of importance since it may allow
one to
compare seemingly disparate experiments, such as behavioral drug effects in
two different
strains that have a different activity baseline. In other words, one can be
concerned about
being able to extract how much more or less of a particular behavior is
observed in the
treatment group as compared to the control group.
In the illustrated example, having calculated z-scores and making some
assumptions
about the data (e.g., a normal distribution), one can now easily visualize
which of the
transitions was increased or decreased significantly by the drug treatment. In
Figure 13, black
and dark grays show z-scores that are significant at the 5% and 10% levels (z<-
1.96 and -
1.96<z<-1.64, respectively) representing transitions that were significantly
decreased by the
drug treatment. Conversely, white and light gray show significant increases
(z>1.96 and
z>1.64, respectively).
Figure 9 shows theoretical data to illustrate the normalization procedure in a
transition
map form. One can think of the process of identification of a signature as a
process through
which all transitions that have been not affected are discarded. In Figure 9,
then, only the
thicker and thinner transition lines in the experimental group are left as
part of the signature,
which we call "differential" to point out that the profile is based on a
comparison against the
control. Thus the drug signature in Figure 9 consists of increased transitions
2-6, 3-6, and 1-6,
and decreased transitions 1-7,2-7, and 1-5, where the numbers represent
behavioral,
neurological, biochemical and/or physiological states.
In Figure 13, having normalized the transition matrix for CDP and CPMC, one
can
now compare the significant effects of the two drugs. One might expect these
drugs to differ
in many respects, as CDP is an anxiolytic and CPMC an anxiogenic drug. Indeed,
some of the
transitions are significantly affected in opposite directions. For example,
the transitions in
which rearing was followed by rearing, directed burying, grooming and
immobility were
increased by CDP, but were decreased by CPMC.
In the case of CDP one could summarize the rear-x transition (where x is any
behavior) increases by stating that rearing was increased overall,
independently of what
preceded it or followed it. However, although CPMC seems to decrease rearing
in general, the
CA 02451992 2011-03-30
WO 02/092101 PCT/US02/15981
transition analysis revealed that the effect was more specific than that,
proving that transitions
can reveal a lot more about behavior that simple total frequencies.
Figure 10 shows an exemplary process of comparison of signatures. A novel drug
signature found by running a drug through the subject system is compared
against the whole
5
collection of signatures available in a database. One way one could quantify
the similarities
between the signatures is to compute a Chi Square, a test designed to assess
differences
between matrices.
Although some of the matrices dealt with within the subject system may violate
some
of the assumptions of this test, it will not be difficult to develop
appropriate, comparable
10
statistical tests. The Chi Square (or custom designed test) will give back a
probability that the
two matrices being compared are different due to chance or to the experimental
treatment.
This probability of "belonging" to a class can be approximated by the
probability of these two
signatures not being different, which is the inverse of the "p-value", or 1-p.
One can also
assess the power of such classification by 1-13 (probability of not missing a
true difference).
15 The
task of assigning new signatures to classes can conveniently be expressed as a
pattern classification problem, and can be implemented using a component
classifier based on
Gaussian mixture models. This type of classifier works by considering each
class
independently, and fitting a parametric probability density to the
corresponding distribution of
signatures. As new compounds are evaluated, these distributions are used to
estimate the
20 probability that the test compound is included in each class.
New studies with known drugs can provide information that will be used to
update
component models and prior distributions, leading to more accurate
classification in
subsequent runs.
Figure 10 shows a probability estimates, for each drug class, for an exemplary
25 embodiment in which the probability of belonging to the class and a
probability that such
classification is correct. Because drugs may have more than one therapeutic
indication, this
example incorporates non-exclusive classes or clustering.
Further understanding of these analysis techniques may be had by reference to
references as Tom Mitchell, "Machine Learning", McGraw-Hill, 1997; R. Duda, P.
Hart, D.
30 Stork, "Pattern Classification", Wiley, 2000. N. Cristianini, J.
Shawe-Taylor, "Introduction to
Support Vector Machines", Cambridge University Press, 2000; T. Kohonen, "Self-
Organizing
Maps", Springer-Verlag, 2001; and Bishop, "Neural Networks for Pattern
Recognition",
Oxford University Press, 1997.
CA 02451992 2003-11-05
WO 02/092101 PCT/US02/15981
41
Example 2: System Hardware.
Figure 1 depicts an example of one embodiment of a hardware device for use
with the
systems and methods described herein that can streamline data capture for the
purpose of
building a database of behavioral information.
To this end, the depicted apparatus comprises a plurality of detectors for
detecting
physical and biological responses. Various types of sensors may be used to
collect and
generate data for specific responses, and the types and arrangements of
sensors employed may
vary according to the application. For example, sensors may be provided for
vocal recording,
visual recording of the test subject's activities as well as for recording
biological data of the
test subject. These sensors may be external devices, or optionally, some of
these devices may
be implanted in or remain outside the test subject. Additionally, some sensors
may be partly
implanted into the specimen and partly external. In any case, the depicted
apparatus provides
sufficient senor functionality to capture sufficient information that the
behavioral and ideally
also the physiological state of the specimen may be determined. The
information collected by
the sensors may be processed by a data processing device that can filter and
analyze the data
being collected by these sensors.
One specific system for assessing behavior of a test subject in accordance
with the
present invention is identified generally by the numeral 1 in Fig. 1. A video
unit 2 captures
video information. Optionally, a second camera may be provided to expand the
angle of
vision, and gain a measure of depth. A series of other devices 3 capture data
pertaining to
feeding, drinking, body weight, heart rate, respiration rate, operant
responses and other =
physical characteristics and the like. This set of non-visual signals is sent
to a
Coordination/Time Stamp device 4 that can create a data header that can be
applied to the
collected data. Optionally, the information from the video unit 2 is sent to a
Frame
Subtraction Device 5, and to a storage primary database 6, that will compare
two frames and
identify the aotive pixels. By detecting the change in active pixels, the
system may generate a
measure of the motion that is occurring within the field of vision of the
visual sensor. Motion
detection can be achieved according to any of the known techniques, including,
but not
limited to, those techniques discussed in US Patent 5,493,344 issued to Yu on
20 February
1996. In this patent, a system is described that estimates movement within a
video signal to
half-pixel accuracy. The described system includes a first motion detector
that receives a
block of video data as well as subsequent block of video data for a defined
search area.
Motion is detected by determining the difference between the first video block
and the
CA 02451992 2003-11-05
WO 02/092101 PCT/US02/15981
42
subsequent video blocks in the search area. A motion vector generator receives
the first and
the second motion vector signals and vector-sums the received signals to
output the vector-
summed result as a final motion vector. The vector sum operation can occur on
a pixel-by-
pixel basis. Although this is one technique for determining presence and
motion within a
search area, other techniques are also known and any suitable method known to
those with
knowledge of the art may be employed
Active pixels only, in one embodiment of this invention, are also sent to
Primary
Database 6 for storage and later re-analysis. The database can be any suitable
database
system, including the commercially available Microsoft Access database, and
can be a local
or distributed database system. The design and development of suitable
database systems are
described in McGovern et al., A Guide To Sybase and SQL Server, Addison-Wesley
(1993).
The database can be supported by any suitable persistent data memory, such as
a hard disk
drive, RAID system, tape drive system, floppy diskette, or any other suitable
system. Active
pixels from the Frame Subtraction device are also sent to an Outline Fitting
Device 7. The
information captured by Device 7 is then sent to the Coordination/Time Stamp
Device 4,
where video and non-video data are synchronized. The synchronized dataset is
then sent to
Secondary Database 8, where data mining is performed as described below.
In a preferred embodiment, the system 1 is defined as in Figure 2 by a module
2 that is
disposed in a cage 4. Cage 4 can be any housing, habitat, or confined area
that houses the test
subject 6. However, it will be understood that the systems and methods
described herein can
include more open environments, such as aviaries, dens, and even parklands.
These
embodiments may be more suited to measuring behavior related to group
behavior, where
more expansive monitoring environments are appropriate. Note that this module
2 design
represents merely one embodiment of systems and methods of the invention and
in alternative
embodiments the systems described herein can include cage systems that have
the sensors and
other features of the module 2 integrated into the cage itself.
= The positioning of the depicted module 2 in cage 4 is such that the
module is easily
removed from the cage. The portability of this embodiment allows the module to
be placed in
other cages thereby allowing behavioral testing on laboratory animals in their
own habitat.
Module 2 is preferably sized so that it fits inside standard laboratory cages.
Thus, test subject
6, depicted in this illustration as a mouse, need not be transferred from a
familiar environment
to an unfamiliar environment for, behavioral testing to be conducted since
such a move could
itself influence behavior. In addition, the module can be removed for proper
cleaning of the
cage 4. Preferably, the module can be sterilized as well. Test subject 6 can
be any test
subject and need not be limited to a laboratory mouse. For example, the test
subject includes,
CA 02451992 2003-11-05
WO 02/092101 PCT/US02/15981
43
but is not limited to, humans, monkey, dogs, horses, sheep, and the like.
Moreover, in
embodiments where other than mammals are to be tested, such as fish, or birds,
the systems of
the invention can be integrated into an aquarium or into a birdcage or even an
aviary. This is
particularly true for those applications where the behavior information being
monitored
Module 2 further includes a base 26. Preferably, base 26 is disposed on floor
34 such
that the base is level with the floor 34. However, the module 2 need not be
level for operation
of the module. Base 26 is such that it can house a variety of sensory devices.
For example,
A light source 12 housed in module 2 provides light to the test subject as
well as a
means of stimulating the test subject. Food and water is provided to the test
subject in this
example by access to a water bottle 14 and a food dispenser 16. Opening a door
enables
access. Doors are normally open, so that in case of a power failure, access
will be enabled and
Further included in module 2 are one or more sensors 22. As depicted in this
illustration sensor 22 is housed in base 26, however it need not be for the
invention to
30 In this embodiment, a scale 30 is positioned on the base such that the
test subject is
weighed when seeking nutriments or interacting with any of the stimuli on the
base 26. Scale
30 may further include a sensor 32. Depicted in this illustration, sensor 32
is a sensor pad for
detecting electrophysiological responses of the test subject, such as an
electrocardiogram.
CA 02451992 2003-11-05
WO 02/092101 PCT/US02/15981
44
The sensor pad may also include other types of monitoring functions such as
blood pressure
and temperature monitoring through the use of telemetric devices and the like.
Module 2 also includes a communication link 36. Link 36 is preferably a data
link.
Such data link can alternatively be, but is not limited to, an electronic data
link, optical fiber
connection, fire wire, a network connection, a serial connection, a parallel
connection, USB,
wireless data connection or any other known connection used for data transfer.
Depending
upon the implementation, link 36 can operate in one or more modes of
transmission. For
example, such modes include radio frequency transmissions, optical
transmission, microwave
transmission, digital or analog transmission, or other known data transmission
mode. The
function of link 36 is to transmit and receive data to and from the module 2
by a user or
computer. Depending on the implementation, the link 36 may also be coupled to
several
modules to provide a network of modules all connected to a central control
unit or processor
(not shown in FIG. 1). In addition, the processor may or may not be located
inside the base
26 of module 2 as convenient. For purposes of this description, the term
"processor" shall
refer to any type of processor, network, server, terminal, mainframe, website,
personal digital
assistant (PDA), and other such electronic device, regardless if the device is
wireless or wire
connected. In a further alternative embodiment, the data processing system can
comprise a
micro-controller system. The micro controller system can also be embedded into
a processing
system. The micro-controller can comprise any of the commercially available
micro-
controllers including the 8051 and 6811 class controllers. The micro
controllers can execute
programs for implementing the processing functions, including the image
processing
functions, as well as for controlling the elements of the system, such as by
executing motor
control processes and feedback processes. Optionally, the data processing
system can also
include signal processing systems for performing the image processing. These
systems can
include any of the digital signal processors (DIPS) capable of implementing
the image
processing functions described herein, such as the DIPS based on the TMS320
core including
those sold and manufactured by the Texas Instruments Company of Austin, Texas.
FIG. 2 illustrates in accordance with this example of the present invention
the layout
of the module 2 with respect to cage 4. The test subject 6 is allowed to
freely roam in an open
playing field on floor 34. The test subject may be manipulated while in this
open playing
field. Such manipulation can include surgical procedures, genetic alterations,
physical
challenges and the like. A resting or nest area 40 is also provided in cage 4
so that the test
subject 6 is maintained in the habitat it has become accustomed to while being
tested for
behavioral characteristics. The module 2 is disposed in the opposite portion
of the cage 4
from the nest area 40 to allow the test subject 6 free roam in the playing
field. This
CA 02451992 2003-11-05
WO 02/092101 PCT/US02/15981
positioning assists in reducing the stress to the test subject and decreases
the incident of
obtaining erroneous data from removing the test subject to another area or
cage for behavioral
testing.
FIG.3 is a front view of the module 2. In this alternative example a possible
5 disposition of the stimuli and other features is shown. A low-lux wide-
angle video camera 10
can record the test subject's activity throughout the day and night. The
cameras may record
the test subject's activity of eating from food dispenser 16 and drinking from
water bottle 14.
A scale 30 can measure body weight or simply sense the presence of the mouse
on that side of
the cage. One or two operanda are used to condition the animal or measure
motor strength. If
10 access to the operanda must be restricted, doors 37 and 38 similar to
the food 16 and water
doors 14 can be implemented. Visual stimuli can be presented on a screen 35.
Additional
visual stimulation is provided by a Light source 12. Infrared light for night
recording is
provided by infrared lamp 36. Additionally, sensors as previously described
may also be used
to monitor the physical and biological effects of the projection screen on the
test subject.
15 In another embodiment, the subject system utilizes 3 or more cameras; a
top camera
and two or more side-view cameras. A top camera is used to locate the animal
in the cage or
other enclosure, e.g., it provides the X-Y coordinates of the animal.
Information from that
camera can also be used to determine certain body shapes, e.g., stretching,
curled, etc., as well
as position relative to cage structures (food, water bottle, air puffing
valves, etc). That camera
20 can also provide information concerning rate and direction of travel,
including rotations. In
certain optional embodiments, the top camera is also used to determine which
side-view
camera(s) to use to see the profile of the animal. Collectively, the top and
profile information
can be used to determine most if not all of the fine and gross bodily
movements of the animal.
In certain preferred embodiments, standard NTSC or PAL video is used. In
certain preferred
25 embodiments, video capture occurs at a rate of at least 30
frames/second, in order to see fast
activity of the animal such as startle response or twitching. In some
embodiments, the subject
systems employ LED or other flicker-free lighting (such as high frequency
fluorescent lights),
and preferably uses lighting that has instant on-off response and low heating
ratings.
In certain embodiments, the subject system and method can include one or more
30 sensory devices for use with the various behavioral experiments
described above, as well as
other such behavioral experiments. The sensory devices transmit the data to a
processing
device that collects the behavioral and physiological data to give a
behavioral assessment of
the test subject.
CA 02451992 2003-11-05
WO 02/092101 PCT/US02/15981
46
Typically, a sensor involves the use of a transducer that detects and measures
changes
in the environment. The sensor produces a variable signal, usually a voltage
that changes in a
linear manner the feature that is being measured varies. Some sensors produce
an output,
called the back signal or back voltage, that can be used in a feedback loop to
reduce or
increase whatever variable is being applied to create the change. The loop
configuration acts
as a limiter that minimizes the possibility of damage to objects tested. For
example, in the
context of laboratory animals being exposed to an experimental drug
intravenously (IV), the
sensor could detect hamiful effects of an experimental drug to the test
subject. Reduction of
the IV dosage of the experimental drug could be initiated by this loop
function. This function
is referred to as a limiter that can reduce the chance of injury to the test
subject. Another
example to this feedback loop feature is in rewarding the test subject. For
example, upon a
detected appropriate response of the test subject, activation of a food source
can supplied the
test subject with a reward.
In certain embodiments, the system includes a sub-system for detecting
ambulatory
and non-ambulatory movements. To illustrate, the cage can be equipped with an
array of
infrared sensors producing a beam pattern in the cage of high enough
resolution to
differentiate between ambulatory and non-ambulatory movements for both rats
and mice.
Status about IR beam interruptions by the animals is transferred from all
sensors to the
computer system. From the received information about beams interruption, the
system
computes the number of ambulatory and non-ambulatory animal movements as well
as animal
position along each sensor.
The system may also include a foot misplacement apparatus. This apparatus can
be
used to measure of sensory-motor function. An exemplary embodiment of such a
system may
consist of a set of two stainless steel horizontal ladders. The spacing of the
lungs on each
ladder is different to accommodate both rats and mice. At one end of the
ladder, a dark
compartment exists to entice the animal to walk toward the perceived "safety"
of the dark
cover. The apparatus provides an electric conditioning stimulus for training
the animal by
punishing them if they touch the metal plate, which is located below the
horizontal ladder.
After the animal is conditioned, an actual test is performed by placing the
animal on one end
of the ladder, and counting the number of missteps as it moves toward the dark
compartment
at the other end of the ladder. Counting missteps is done automatically by
detecting the
change of resistance between the ladder and the metal plate. Each time the
animal misses one
of the rungs of the ladder and touches the metal plate below; a very small
electric current is
detected, amplified, and counted by a separate computerized counter. The
animal is not aware
of this current, as it is far below the threshold of the animal's sensitivity.
CA 02451992 2003-11-05
WO 02/092101 PCT/US02/15981
47
The present system may be used with a variety of tests for cognitive function,
especially learning and memory testing, and are preferably carried using an
automated
system. Learning and/or memory tests that can be used to generate data for the
subject
databases include, for example, inhibitory avoidance, contextual fear
conditioning, visual
delay non-match to sample, spatial delay non-match to sample, visual
discrimination, Barnes
circular maze, Morris water maze, and radial arm maze tests.
An exemplary passive avoidance test utilizes an apparatus that consists of a
lit
chamber that can be separated from a dark chamber by a sliding door. At
training, the animal
is placed in the lit chamber for some period of time, and the door is opened.
The animal
moves to the dark chamber after a short delay - the latency - that is
recorded. Upon entry into
the dark chamber, the door is shut closed and a foot shock is delivered.
Retention of the
experience is determined after various time intervals, e.g., 24 or 48 hours,
by repeating the
test and recording the latency. The protocol is one of many variants of the
passive avoidance
procedures (for further review, see Rush (1988) Behav Neural Biol 50:255).
An exemplary maze-testing embodiment is the water maze working memory test. In
general, the method utilizes an apparatus that consists of a circular water
tank. The water in
the tank is made cloudy by the addition of milk powder. A clear plexiglass
platform,
supported by a movable stand rest on the bottom of the tank, is submerged just
below the
water surface. Normally, a swimming rat cannot perceive the location of the
platform but it
may recall it from a previous experience and training, unless it suffers from
some memory
impairment. The time taken to locate the platform is measured and referred to
as the latency.
During the experiment, all orientational cues such as ceiling lights, etc.,
remain unchanged.
Longer latencies are generally observed with rats with some impairment to
their memory.
Another memory test includes the eyeblink conditioning test, which involves
the
administration of white noise or steady tone that precedes a mild air puff
that stimulates the
subject's eyeblink.
Still another memory test that can be used is fear conditioning, e.g., either
"cued" and
"contextual" fear conditioning. In one embodiment, a freeze monitor
administers a sequence
of stimuli (sounds, shock) and then records a series of latencies measuring
the recovery from
shock induced freezing of the animal.
Another memory test for the test animals is a holeboard test, which utilizes a
rotating
holeboard apparatus containing (four) open holes arranged in a 4-corner
configuration in the
floor of the test enclosure. A mouse is trained to poke its head into a hole
and retrieve a food
reward from a "baited" hole that contains a reward on every trial. There is a
food reward
CA 02451992 2003-11-05
WO 02/092101 PCT/US02/15981
48
(e.g., a Fruit Loop) in every exposed hole that is made inaccessible by being
placed under a
screen. The screen allows the odor of the reward to emanate from the hole, but
does not allow
access to the reinforcer. When an individual hole is baited, a reward is
placed on top of the
screen, where it is accessible. The entire apparatus rests on a turntable so
that it may be
The subject system can include precision food consumption monitors, preferably
a
monitor with accuracy of 10 mg. In an illustrative embodiment, the design of
the animal
15 The system can also include V02NCO2 monitors. For instance, the system
can
include an indirect open circuit calorimeter designed to simultaneously
measure metabolic
performance of multiple subjects that have differing ventilation needs. The
system monitors
oxygen and carbon dioxide concentrations by volume at the inlet and outlet
ports of a
chamber/canopy/tent/mask through which a known flow of air is being forcibly
ventilated.
20 The difference in gas concentrations along with flow information is
employed in the
calculations of oxygen consumption, carbon dioxide production, respiratory
exchange ratio
and heat.
In certain embodiments, the subject system will include a volumetric drinking
monitor, e.g., that can precisely measures the volume of liquid consumed by
laboratory
The system can also include an "anxiometer", e.g., a system designed to induce
CA 02451992 2003-11-05
WO 02/092101 PCT/US02/15981
49
every nth lick) is recorded by the system. The performance of anti-anxiety
drugs, for example,
can be measured by comparing the drinking behavior of punished drugged rats to
the behavior
of punished non-drugged rats.
In certain embodiments, the subject system also includes a sub-system for
quantify
convulsive activity in small laboratory animals. In an exemplary embodiment,
an unrestrained
animal is placed within a chamber that resides upon a sensing platform. The
platform is
connected to a load sensor that converts the vertical component of motion into
an electrical
signal. The instrument accumulates impulse counts and time. An impulse count
is accrued for
each gram-second (980 dynes) of force applied to the sensing platform, and
terminates
monitoring at the conclusion of the episode. In preferred embodiments, the
instrument
= responds only to changes in the force exerted on the platform. The static
force exerted by the
weight of the platform and animal is not recorded.
The subject system can also include a cold/hot plate analgesia measuring
system, e.g.,
which utilizes a metal plate that can be heated and cooled. An animal's
sensitivity to pain
resulting from exposure to heat or cold is tested by placing the animal on the
surface of the
plate and starting a built-in timer. The timer is stopped at the instant the
animal lifts a paw
from the plate, reacting to the discomfort. Animal reaction time is a
measurement of animal
resistance to pain and is used to measure efficacy of analgesics, or side-
effects involving
impairment of the central or peripheral nervous system.
In certain embodiments, the subject system includes a grip strength meter,
e.g., for
assessing neuromuscular function by sensing the peak amount of force an animal
applies in
grasping specially designed pull bar assemblies. Metering can be performed
with precision
force gauges. The values may be either recorded manually or automatically via
a computer
interface. Fore and hind limb assessments can be performed concurrently with
the dual sensor
models or they can be performed in separate trials with the single stand
model. In practice, the
dual sensor model is employed by first allowing the animal to grasp the
forelimb pull bar
assembly. The animal is then drawn along a straight line leading away from the
sensor. The
animal will release at some point and the maximum force attained will be
stored on the
display. The animal continues to be moved along until the rear limbs grasp the
second pull bar
assembly. Again, there will be some point at which the animal releases after
which the second
sensor will retain the hind limb grip strength.
The system can also measure startle reflex. For instance, it may include an
instrument
for quantifying the vertical component of motion associated with the startle
reflex. The
assessment of the startle reflex can be an indicator in evaluating sensory and
CNS
CA 02451992 2003-11-05
WO 02/092101 PCT/US02/15981
performance. In practice, the subject is presented with some type of stimuli:
acoustic, tactile
or electric shock while situated on a device that records motion. The recorded
parameters are:
latency from stimulus onset to response and magnitude of response. The subject
system can
employ a single point load cell for the measurement of motion. This device is
attached to a
5
platform on which the animal is housed in such a fashion as to allow free
movement. The
single point design of the sensor assures equivalent measurements regardless
of animal
location. The sensors are manufactured to precise standards that yield linear
performance,
wide dynamic range and matched performance that eliminates the need for
repeated
calibration.
10
Whether acquired in an automated fashion or not, it is specifically
contemplated that
such data can be included in the data models of the present invention. There
are a variety of
other behavioral response for which automated and semi-automated data
acquisition can be
accomplished by apparatus of the present invention, and include:
= Tail Suspension: Indicator of dysfunction in descending motor pathways.
15 Orientation, direction of turning, and fore and hindlimb spasticity
are evaluated.
= Grid Walk Test: Stride length, walking foot spread and resting foot
spread are
measured in this test of limb coordination. Especially sensitive to deficits
in
descending motor control.
= Beam Walking: Assessment of motor incoordination. Time required for an
animal
20 to pull itself into a balanced position on a narrow beam is recorded.
= Rotarod: Tests an animal's ability to remain on, a rotating rod as the
speed of
rotation increases. Requires a high degree of sensorimotor coordination and is
sensitive to damage in the basal ganglia and the cerebellum. Differentiates
analgesia from sedation.
25 =
Grip Strength: Forelimb and hindlimb muscle strength evaluated by the distance
a
bar on a strain gauge is pulled before paw-grip is released.
= Landing Foot Spread: Test of peripheral nerve damage (neuropathy). The
animal
is released from a height, and the distance between the hindfeet as the animal
lands
is recorded.
30 =
Skilled Reaching (forelimb motor control): Rats reach through a small opening
to
retrieve food pellets. Sensitive to moderate to severe DA depletion caused by
unilateral 6-0HDA.
CA 02451992 2003-11-05
WO 02/092101 PCT/US02/15981
51
= Forelimb Asymmetry: Weight shifting using forelimbs during vertical
exploration
and landing in a cylinder. Sensitive to non-severe levels of DA depletion and
to L-
DOPA.
= Bilateral Tactile Stimulation (2 phase): Assays forelimb tactile
sensation, in which
an adhesive patch is applied to the wrist of each forelimb, and the order and
latency of stimulus removal is recorded. Sensitive to severe levels of DA
depletion.
= Single Limb Akinesia: Movement initiation in which direction of steps and
stepping movements are assessed. Sensitive to direct DA agonists when
degeneration of DA neurons is not severe.
= Placing Test: Asymmetries in forelimb placing, following unilateral 6-
0HDA,
using vibrissae-elicited placing.
= Bracing Test: Evaluates capacity to adjust stepping and regain postural
stability
when rapid weight shifts are imposed. Sensitive to DA agonists, even when
degeneration is severe.
= Orienting Movement: Measures latency to orient to a tactile stimulus
(right or left
side of face). Sensitive to moderate to severe DA depletion.
= Disengage Test: Orienting test (above) conducted while animal is eating.
Sensitive
to a moderate level of DA depletion.
= Drug-Induced Turning (rotational test): Number and direction of horizontal
circling movements following apomorphine. Common test for screening potential
therapies when DA loss is severe.
= Activity changes following MPTP (mice): Automated recording of both
locomotor
and rearing activity.
= von Frey Threshold: Sensitivity to graded mechanical stimulation by
monofilaments.
= Allodynia / place avoidance: Mechanical hyperalgesia (monofilament
stimulation)
in response to nerve injury, combined with avoidance of environment in which
the
pain occurred. Measures both sensory and affective components of neuropathic
pain.
CA 02451992 2003-11-05
WO 02/092101 PCT/US02/15981
52
= Elevated Plus- Maze: Standard test of anxiety in which the animal is
placed in the
center of an elevated 4-arm maze where only two of the arms are enclosed.
Anxiety-related behaviour is measured as avoidance of the open arms.
= Maternal Separation: Anxiety test in which ultrasonic distress
vocalizations are
counted in juvenile pups that have been separated from their mother.
= Light/Dark Preference (Emergence Neophobia): Activity in light and dark
portions
of a box are recorded. Avoidance of lighted portion reflects elevated anxiety
while
little or no time in the dark area reflects limbic disruption and certain
brain lesions.
= Intravenous Self-Administration: Animals learn to lever press for an
infusion of a
compound, via an intravenous catheter. Measures reinforcing effects of drugs
of
abuse or potential addictive properties of new pharmacological compounds.
= Intracranial Self-Stimulation: Animals lever press to stimulate brain
regions
involved in reward. Measures drug effects on reward.
= Straight Alley: Animals run from a "start" box to a " goal" box, by way
of a
straight alley, to receive a drug infusion. Latency to reach the goal box
reflects the
motivation of the animal for the drug.
= Place Conditioning: Evaluates preference or aversion of an animal for an
environment that has been associated with a positive or negative stimulus,
usually
a drug or a mild shock. It is performed in a box with two distinguishable
environments separated by an alley. This test has been used to study learning
and
memory, as well as the reinforcing effects and potential addictive properties
of
drugs of abuse.
= Locomotor Activity: Measured in activity boxes, in which photobeams
measure
locomotion. Changes in locomotor activity over repeated injections may reflect
tolerance and/or sensitization to drug effects.
= Circadian Activity : Measurement of general activity in a day - night
cycle.
Sensitive to hypothalamic dysfunction as well as neuromuscular damage. Can
also
be used to measure food consumption over the circadian cycle to assess eating
behaviour or non-specific drug effects.
= Sleep Patterns: The different components of awake and sleep are measured
using
an EEG in freely moving animals. Some drugs of abuse will disrupt these
patterns.
CA 02451992 2003-11-05
WO 02/092101 PCT/US02/15981
53
= Salivary Secretion: Evaluation of autonomic function in which the degree
of saliva
secretion is measured.
= Nest Building: Nest building capability and complexity. Reflects frontal
cortex or
limbic system damage.
= Food
Hoarding: Relationship of food pellet size to the tendency to carry it back to
the animal's home area. Sensitive to frontal cortex damage.
= Food Wrenching and Dodging Test: Aggressive behaviour in defense of food.
= Context Discrimination: A general test of associative learning, in which
the animal
is placed in a box with a center divider containing a gap. Food is placed in
one side
of the box and the animal is allowed to find and consume it, then is tested
the
following day for latency to enter the side that contained the food.
= Pre-pulse Inhibition: A test of rats and mice ability to "gate" or
inhibit the effect of
environmental information. Normal animals exhibit less of a startle response
to a
sudden loud sound if it has been preceded by a softer sound. This phenomenon
is
mediated by dopamine, and its impairment may underlie attention deficits and
schizophrenia.
With further reference to the figures, the module 2 is in communication with a
primary
database 6. Primary database 6 is used off-line to store video information and
other time
stamped outputs that can be reanalyzed at a later time.
The primary database 2 is in communication with a module 5 to extract
important
feature from the video data, as described below.
Processed video data is sent to Coordination device 4 that coordinates the
visual and
non-visual signals according to their time stamps. The combined information
set is then sent
to the secondary database 8 for further processing. This secondary database 8
can
advantageously link to other databases to obtain additional information that
may be required
for the interpretation of behavioral, physiological and other and datamining
needs. Such links
may include for example, but are not limited to National Institutes of Health
(NliH), Academy
of Behavioral Medicine Research, Association for Behavior Analysis Society of
Behavioral
Medicine and text references such as Diagnostic and Statistical Manual of
Mental Disorders,
Fourth Edition (DSM IV).
CA 02451992 2003-11-05
WO 02/092101 PCT/US02/15981
54
The database may store other type of data such as gene and protein expression
patterns
obtained from techniques such as cDNA chips, in situs and the like. The
function of the
secondary database 8 is to interpret the behavioral signature of the drug or
manipulation. In
addition, various methods of data mining may be used to analyze the data for
relationships
that have not previously been discovered. For example, a "signature method" is
used.
Figures 4 to 9 illustrate the generation of a "signature".
Fig. 4 shows an example of a video frame with the image of a mouse. The image
is
simplified into an outline and he outline is fitted with a self-organizing map
(SOM) that
tracks the outline. SOM minimizes the distance between the active pixels and a
number of
nodes. The position of the nodes can then be monitored over different frames.
Other fitting
methods can be used including ellipse and spline fitting and the like. In the
example, the SOM
is shown in Fig. 5 tracking the outline of a mouse over 4 different frames.
Some of the nodes
will track the movement of the back of the animal, while other will track the
large movements
and more subtle changes in the position of the tail, nose, extremities, chest,
ears, etc. Large
and small movements will be captured. Large movements will include locomotion,
rearing,
circling and the like. Small movements may include but are not restricted to
sniffing, ear
twitching, respiration, tail shakes and others. Fig 6. shows the node
trajectories obtained from
the positioning of the nodes in the SOM. The node trajectories are combined
with non-visual
data coming out of the hardware device. In Fig. 6 the node trajectories and
non-visual states
(such as accessing the food or water, or a measure of body weight or the like)
are combined.
A certain combination of these variables is called a state if it occurs with
at least certain
probability. A HMM or like technique is used to assess the transition
probability between, for
example, 100 states. The MANI identifies combination of variables that occur
with some
frequency, assigns them to a state and calculates the probability of
occurrence and the
transition probabilities between states. An imaginary state could be a low
heart rate signal,
and low respiration signal and static node trajectories. Such state may
correspond to a
sleeping animal, but the system does not need to recognized or name the state.
As explained
below recognizing or identifying the states into standard behavioral
categories is possible but
not necessary to enable the invention. The transition probabilities are
calculated for each
dataset obtained from each animal. For every treatment, being gene
manipulation, drug
treatment, strain or the like, a group of animals is typically run (for
example, 10 animals may
be injected with water and 10 animals with an experimental drug). State and
transition
probabilities as obtained from the HMM will be combined for the animals of
each treatment
to generate a "group" probability map. This map will then summarize the
behavior of all
animals in each group. As the important effects of the drug or other treatment
are relative to
CA 02451992 2003-11-05
WO 02/092101 PCT/US02/15981
the control group, the treatment and control groups must be combined. For
example, if the
treatment group shows a high probability of a state combining high heart rate,
low respiration
rate and no movement, and the treated experimental group show a very low
probability of
such state, the change in probability for that state should be calculated.
This is important
5 because in another strain of animals such probability in control animals
may be very low, so
the absolute value of the state probabilities is not important, but the
relative change of the
state probabilities between experimental treatment and control. Fig. 8 shows
an example of
such combination of probability maps between control and experimental animals.
For
simplicity the control group map is shown with 7 different equally probable
states, and all
10 transition probabilities are the same as well. The treatment probability
map shows that seven
transition probabilities have been affected by the treatment, three have
increased and four
have decreased, resulting in a high probability of state 6. Once the
differential maps, or
"treatment signatures" have been calculated they are stored in the secondary
database. There
they can be compared with other treatment signatures. Treatments with similar
15 neurobiological mechanisms will result in similar signatures.
Using clustering techniques or the like, treatment signatures can be combined
into
clusters or classes. For example all anxiolytic drugs will result in similar
signatures and will
then be clustered together. Once the database is populated with many
treatments comprising
pharmacological treatment, gene manipulation treatments, lesions and the like,
a cluster
20 analysis will provide a general classification of treatments into major
and minor classes. For
example, antipsychotic drug treatments should result into one antipsychotic
family with two
different subclasses, one for typical and one for atypical antipsychotic.
Once the database is populated it can be used as a diagnostic tool by
comparing the
signature of a novel treatment with the existing signature classes arising
from the cluster
25 analysis. Such a comparison should result in an estimate of the
similarity between the
treatments. By using the appropriate statistical tools a probability that a
treatment belongs to a
particular cluster can be obtained. Considering the number of animals or
sample taken to
construct the average map for the control and treated groups, the number of
existing drug
classes and class member in the database, an estimate of the reliability of
the diagnostic
30 classification can also be given. This is depicted in Fig. 9 where a
novel signature is compared
against two other treatment signatures (although in the real process the novel
signature should
be compared against all signatures stored in the database). In the example a
novel drug
signature is compared against two existing drug class signatures that show
some degree of
similarity. Drug A class shows minimal similarity and the probability that the
novel drug
35 belongs to drug A class is modest (.42) but the reliability of the
estimate is very low (.22).
CA 02451992 2003-11-05
WO 02/092101
PCT/US02/15981
56
Drug B class shows extended similarity and therefore the probability that the
novel drug
belongs to drug B class is high (.94). As the reliability of that estimate is
acceptable (.56), the
classification of the novel drug into drug B class is warranted. A table such
as that depicted in
Fig. 9 is the end product of the invention. If the drug classes of the example
were toxic drugs
, 5 in drug A class and antidepressant drugs in drug B class, such table
would suggest that the
novel drug is an antidepressant but it will probably have toxic side effects.
Such a result may
result in the termination of effort to push this drug into clinical trials,
cutting cost of drug
development short. As stated the invention can handle investigation of the
effects of novel
drugs, characterization of novel mutants created by genetic manipulation, and
any other
treatment. The data can be behavioral, physiological, gene expression data and
the like.
Monitoring of live animals may be the primary input, or data collected from
tissue.
=
Example 3: System Hardware
Another aspect of the invention provides animal habitats (such as cages), as
well as
kits and modules for outfitting habitats, for automated capture of behavioral,
neurological
and/or physiological measurements. In certain embodiments, the subject systems
are
designed to be flexible and accommodate a wide variety of experimental
apparatus. In certain
embodiments of the habitat, the wall panels, floor and top can be replaceable
modules that
can be fitted with various instruments depending on the needs of the research
in progress. See
Figure 15 and 16, as one example. Additionally, the subject habitats can be
designed to
facilitate the conduct of as many experiments as possible during a single
session without the
need to exchange instrument modules. In certain preferred embodiments, the
measurement
devices and sensors are provided with computer or other digital or analog-to-
digital interfaces.
Figure 15 and 16 show different views of an exemplary animal habitat of the
present
invention. In the illustrated embodiment, the system 1510 includes a slide out
cage 1602
having at least two clear sides. The system 1510 also includes three image
capture devices
(shown as cameras); a top camera 1502 and two side-view cameras 1605. The top
camera
1502 provides a top view that is used to locate the animal on the floor 1504
of the cage, e.g., it
provides X-Y coordinates of the animal. Information from the top camera 1502
can also be
used to determine certain body shapes, e.g., to determine if the animal is
stretching, curled up,
etc., as well as its position relative to cage structures (food, water bottle,
air puffing valves,
etc). The top camera 1502 can also provide information concerning the rate and
direction of
travel the animal, which may be useful in identifying such behaviors as the
animal walking or
spinning in circles (rotating) and the like. In certain optional embodiments,
the top camera
CA 02451992 2003-11-05
WO 02/092101 PCT/US02/15981
57
1502 is also used to determine which of the side-view cameras 1605 to use to
view the animal
in profile. In the illustrated embodiment, the two side-view cameras 1605 are
positioned at 90
degrees to each other, and have unobstructed views of the experiment through
the two clear
sides of the system 1510. Collectively, the top and profile views can be used
to determine
most if not all of the fine and gross bodily movements and positions of the
animal. -
In certain preferred embodiments, the image capture devices are compatible
with
standard NTSC or PAL video. In certain preferred embodiments, video capture
occurs at a
rate of at least 30 frames/second, in order to see fast activity of the animal
such as startle
response or twitching. In certain embodiments, the subject system utilizes
high-resolution
color video cameras which capture simultaneous, full-rate video. All three
cameras can be
connected to a computer, such as through a video digitizer or digital
interface, in order to
provide full frame-rate images from all three cameras to image processing
software. In the
illustrated embodiment, the leads from the cameras and, optionally, image
processing
software or buffer memory, can be gathered in the base 1508, that can be
hinged 1604 for
easy access into the base compartment.
The illustrated embodiment shows a lighting source 1601, though ambient light
can be
used as well. In certain preferred embodiments, the lighting source 1601 uses
LED or other
flicker-free lighting (such as high frequency fluorescent lights), and
preferably uses lighting
that has instant on-off response and low heating ratings. In one embodiment,
this board
contains several hundred LEDs which may be of various and/or mixed colors. The
LED
lighting system can be connected to a controlling computer that can turn the
lighting on and
off to simulate nighttime and daytime conditions in the laboratory. LED
lighting systems
have a number of advantages over alternatives such as fluorescent and
incandescent lights
such as more compact size, cooler operation, better control of light color,
and faster response
time.
To measure eating and drinking behaviors, the illustrated system includes two
water
bottles 1507 and a feeding bin 1506. Such bottles and bins can be connected to
touch sensor
circuits, e.g., mechanical or electrical, which senses contact by the animal.
The output of the
touch sensor(s) can be connected to the computer and can be read by software
to detect eating
and drinking behaviors. These behaviors can be processed and recorded along
with behaviors
recognized by the computer vision system.
In the illustrated embodiment, the floor 1504 can be a slide-out bedding tray.
Below
the bedding tray, the exemplary system includes floor sensors 1505 which may
include
pressure or other force sensors or other means for measuring the weight of the
animal. In
CA 02451992 2003-11-05
WO 02/092101 PCT/US02/15981
58
certain embodiments, the subject system can be used for testing pre-pulse
inhibition of startle
(PPI). The PPI test is used in laboratories to evaluate an animal's ability to
filter
environmental stimuli. A key part of the test is measuring the startle
response of the animal¨
essentially, how much force the animal exerts in a jump, in response to a loud
noise or puff of
air. A brief softer sound preceding the startling stimulus normally leads to
an inhibition of the
startle response. Measurement of the normal startle response and of the
response after a
prepulse can be made using a force sensing cage floor. The PPI measure is the
percent
inhibition produced by the prepulse. The force sensor floor is connected to
the computer and
continuously monitored by software to record startle events. This recorded
data becomes part
of the behavioral record and can be analyzed to measure the response amplitude
and timing of
the startle, and the PPI of the animal.
The floor can also include conductive leads for measuring cardiac impulses,
e.g. EKG
measurements.
In certain embodiments, the floor consists of many small, closely spaced
square or
round towers. These towers are tall enough and so closely spaced that the
mouse must remain
on top of the towers and can only move by stepping from one tower to the next.
The tower
floor is used for the high tower walk test experiment that measures
misstepping between
towers and provides high sensitivity to the sedative and ataxic effects of
some drugs.
The system can also include camera screens 1603 that can be used to block out
scenery outside the cage, and to provide a uniform colored background against
which the
animal is imaged.
In certain embodiments, the system 1510 includes instrument insert openings
1502 for
positioning other instruments and probes in the cage 1602. Merely to
illustrate, the sensors
can include temperature sensors, nose poke sensors, a scale to measure mouse
body weight,
an ultrasonic microphone, telemetric sensors, and the like. Indeed, almost any
commonly
used laboratory sensor can be added to the subject system and integrated into
a computerized
data capture system. It is also contemplated that the subject system can
include one or more
additional actuators, such as automatic food or reward dispensers, lights and
displays,
speakers or other noise makers, enrichment devices (such as an instrumented
running wheel),
and the like.
To further illustrate, the subject system can include an air puff system. To
induce a
startle response, compressed air nozzles can be installed in the enclosure,
e.g., through
instrument insert openings 1502. These nozzles produce an abrupt, intense and
(preferably)
evenly distributed puff of air which causes the mouse to startle. The
compressed air can be
CA 02451992 2003-11-05
WO 02/092101 PCT/US02/15981
59
supplied by an external compressor and controlled by an electronic air valve.
A standard
pressure regulator allows adjustment of the air pressure going to the valve
and nozzles. A
computer interface allows the valve to be rapidly cycled under software
control.
The subject system can also including a shocking probe. A preferred shocking
probe
Example 4: Computer Control System
Figure 14 shows a schematic representation of an embodiment of the subject
system.
As indicated, the exemplary animal habitat 1401 includes cameras 1410 for
capturing
images of the observed animals, the output from the cameras being processed by
a control
computer system 1402. The computer system 1402 can include an Experiment
Control
module 1420. In many embodiments, it is contemplated that digital and analog
I/0 hardware
CA 02451992 2003-11-05
WO 02/092101 PCT/US02/15981
The illustrated system also includes an Image Segmentation module 1424. This
module can be a software or hardware component and takes a video image and
labels pixels
as animal or non-animal (background). An exemplary implementation uses a
combination of
techniques including frame-to-frame differencing, background subtraction,
color
5 segmentation, and connected components analysis to discriminate between
those pixels which
make up the animal and those which make up the background and bedding.
The data from the Image Segmentation module 1424 can then be subjected to 2D
Model Fitting 1426. For example, segmented images can be processed by fitting
a set of 2D
models to the labeled regions. In addition to traditional geometric
primitives, such as
10 bounding box, center of mass, and best-fit-ellipse, more specific
geometric models, tailored to
the specific shape of the animal can be used. These 2D models include elements
corresponding to specific anatomical features, such as the nose, shoulders,
rump, and base of
the tail.
In one implementation, knowledge of the relative positions and orientations of
the
15 three cameras is used to guide the 2D model fitting. The location of the
animal in a particular
camera view is related to its location in each of the other views, and this
information is used
to constrain the 2D model fitting process.
The illustrated system also includes a module for Camera Calibration 1428. The
3D
positions, orientations, and imaging characteristics of the habitat's cameras
are recovered
20 through a 3D calibration procedure. For example, an calibration target
which is marked with
a collection of highly visible and accurately placed dots can be placed inside
the habitat.
Simultaneous images are acquired from all three cameras, and the dots are
located in each
image. A nonlinear optimization routine can be used to recover the
characteristic distortions
and projection parameters of each camera, as well as the position and
orientation of each
25 camera with respect to the calibration target. These data, taken
collectively, also define the
positions of the three cameras with respect to each other.
Referring again to the system of Figure 14, the positions of features in the
2D
geometric models, along with the 3D camera calibration 1428, are used to
compute 1430 the
approximate 3D locations and velocities of parts of the mouse, such as the
center of the
30 mouse, the mouse's shoulders, and the mouse's rump. The trajectories and
relative positions
of these 3D anatomical features can be tracked over time and recorded for use
in behavior
identification.
Collectively, data from the 2D Model Fitting 1426 and 3D Geometric Processing
1430
modules is referred to, for this example, as the "computer vision modules".
CA 02451992 2003-11-05
WO 02/092101 PCT/US02/15981
61
In certain embodiments, the control computer system 1402 can also include a
Low-
Level Instrument =Interface 1432. As indicated in the figure and herein, in
addition to the
image capture systems, the habitat can also includes a variety other sensors
for monitoring
animal activity. Readings and observations from each of these sensors is
preferably
synchronized with the video observations and logged. The Low-Level Instrument
Interface
1432 can be set up to buffer the input from these types of data acquisition
hardware and apply
any necessary pre-processing steps, such as low-pass filtering to reduce
signal noise. Each
processed sensor reading is preferably time stamped and passed to the Data
Collection module
1436.
The illustrated system also includes a Classifier Module 1434. That module may
be
used to annotate data obtained from the habitat 1401. The Classifier Module
1434 may
include one or more Rule-Based State Recognizers 1434A. In certain
embodiments, animal
activity can be described using a collection of accepted states, such as
rearing, digging,
climbing, scratching, etc. State labels are assigned to segments of video by
passing the output
of both 2D and 3D processing algorithms through a set of decision rules.
States such as
locomotion and immobility can be identified by averaging the velocity of the
center of the
animal over a short time period, and then comparing these average values with
empirically
chosen thresholds. Other states are identified using rules conditioned on the
positions and
velocities of 3D anatomical features, the positions of 2D anatomical features,
and image pixel
values. Yet other states may be identified with the help of 1434B Machine
Learning State
Recognizers, as described below.
The Classifier Module 1434 may also include one or more Machine Learning State
Recognizers 1434B that comprise supervised and unsupervised learning
algorithms.
Supervised Machine Learning State Recognizers 1434B can be used to capture
some pre-
determined states that may be difficult to recognize using Rule-Based State
Recognizers
1434A such as subtle or complex movements.
The set of recognized states need not be limited to those explicitly defined
in the Rule
Based State Recognizers 1434A. Additional patterns of animal activity and
sensor readings
can be detected by the Unsupervised Machine Learning State Recognizers 1434B.
These
software components monitor the data stream and search for general patterns of
behavior such
as sequences of states (e.g., rearing follow by grooming follow by jumping),
or combinations
of data input from the Sensors (e.g. grooming with high heart rate) that occur
with such high
frequency that are assumed to carry information.
CA 02451992 2003-11-05
WO 02/092101 PCT/US02/15981
62
The illustrated Control Computer system 1402 also includes a Data Collection
module
1436. Data from the Computer Vision modules and Low Level Instrument interface
1432 can
be passed to the Data Collection module 1436, which can serve as a management
system for
system data. Other modules which require sensor readings or computer vision
output can also
connect to the Data Collection Module 1436, which synchronizes the data from
its various
inputs, and acts as a storage Raw Data and Sequence Database 1436, by storing
experimental
data from each individual subject for further processing.
The data corresponding to reference compounds stored in the Raw Data and
Sequence
Database 1438 can be queried by a Supervised Machine Learning module 1444.
Supervised
learning techniques, such as Bayes Classifiers, Support Vector Machines, and
Mixture models
can be used to extract those characteristics of the experimental data that
permits successful
classification into pre-determined therapeutic classes (e.g. antidepressants).
The summarized
data for each drug, the drug signature, is stored in the Drug Class Signature
Database 1448.
The data corresponding to a test or novel compound stored in the Raw Data and
Sequence
Database 1436 can be queried by a Module 1447 that extracts the appropriate
summary data
or novel or test drug signature. Such signature is compared against the
reference Drug Class
Signature Database 1448, by a Machine Learning module 1440, which may used
diverse
learning algorithms, and which classifies the novel or test drug signature
into the existing drug
classes previously defined by the Supervised Machine Learning module 1444.
The Drug Class Signature Database 1448 and the classification output module
1442
communicate with one or more Servers 1446: A server interface can be used to
provide access
to the Behavioral Database 1438 for local and remote access to the data. The
server can
support direct queries of the database, and provide interfaces for additional
machine learning
algorithms, database search algorithms, and tools for correlating query data
with entries in the
database.
Furthermore, since numerous modifications and variations will readily occur to
those
skilled in the art, it is not desired that the present invention be limited to
the exact
construction and operation illustrated and described. Accordingly, all
suitable modifications
and equivalents, which may be resorted to, are intended to fall within the
scope of the claims.
It is to be further understood that while alternate embodiments may not have
been
presented for every portion or component of the invention, and that the
instant invention can
compose many different combinations of described portions, or that other
undescribed
alternate embodiments may be available or substituted for a described portion,
such is not to
be considered a disclaimer of those alternate embodiments. It will be
appreciated that many
CA 02451992 2003-11-05
WO 02/092101 PCT/US02/15981
63
of those undescribed embodiments are within the literal scope of the following
claims, and
others are equivalent. Again, it is recognized that the order or sequence of
tasks illustrated in
these examples and the attached figures are merely intended to be exemplary of
the concepts
defined herein.