Note: Descriptions are shown in the official language in which they were submitted.
CA 02452400 2003-12-05
B 14502 PR
1
A METHOD OF DIAGNOSING A FAULT ON A TRANSFORMER WINDING
The present invention. relates to a method of
diagnosing a fault on a transformer winding by using
frequency response analysis (FRA)= The present
invention is more particularly adapted to power
transformers.
Power transformers (such as transformers having
primary voltages of several hundreds of kilovolts (kV)
and delivering powers lying in the range a few megavolt
amps (MVA) to several hundred MVA) are extremely
expensive pieces of equipment in systems for
interconnecting electricity transmission networks or
"grids". It is therefore very useful to be able to keep
such transformers in service for as long as possible,
since a transformer breakdown or fault can have major
economic consequences due to the distribution network
being interrupted.
In addition, faults such as short circuits can run
the risk of explosion or fire.
It is therefore very important to be able to
determine the presence of a fault associated with a
transformer winding.
A known solution that problem consists in using
FRA. That technique consists in measuring the impedance
of a transformer winding over a wide range of
frequencies and in comparing the result of the
measurement with a set of reference measurements. In
order to measure impedance as a function of frequency,
it is possible to perform frequency scanning using a
sinewave signal.
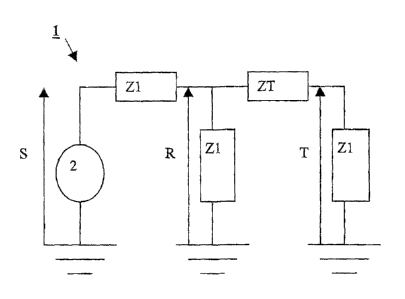
Thus, Figure 1 is a theoretical diagram of a
circuit 1 for performing frequency analysis on an
impedance corresponding to the impedance of a
transformer winding that is to be measured.
The circuit 1 comprises:
CA 02452400 2003-12-05
B 14502 PR
2
a network analyzer 2;
three same-value test impedances Zl; and
an impedance ZT corresponding to the impedance to
be measured of a transformer winding.
The network analyzer 2 generates a measurement
signal S. The measurement signal. S is a frequency-
scanned sinewave signal. By way of example, the
impedances Zi are the impedances of measurement cables
and they generally have a value that is equal to 50 ohms
(0). R is the signal measured between the first end of
ZT and ground. T is the signal measured between the
second end of ZT and ground. The analyzer 2 then
determines voltage gain k as a function of frequency, as
defined by the following relationship:
k = 20lo T
glo R
The gain k contains the information needed for
studying the impedance ZT and is equal to:
ZI 1
k = 201og1o C
ZI + ST
When the impedance Zi is equal to 50 52, this gives:
k = 201og101 50
50 + ZT
Impedance is measured over a very wide range of
frequencies that can extend from a few hertz (Hz) to
about 10 megahertz (MHz).
The same measurement must be performed on a
reference winding. The reference winding can either be
another phase which is assumed to have no fault, or the
same winding as measured previously when it had no
fault, or the winding of an identical transformer. This
measurement likewise produces a gain k as a function of
frequency and corresponding to the reference winding.
A first solution then consists in examining by eye
any differences between the curves representing k and k'
CA 02452400 2003-12-05
B 14502 PR
3
as a function of frequency. That solution nevertheless
presents certain problems.
An examination by eye performed by an expert can be
highly subjective and can lack transparency.
A second solution consists in calculating
statistical indicators suitable for revealing the
differences between the two curves. Such statistical
indicators can be constituted, for example, by
correlation coefficients calculated over different
frequency ranges.
Nevertheless, the use of such statistical
indicators also gives rise to certain problems.
Thus, certain faults cannot be identified; this
applies for example to the magnetic circuit of the
transformer being grounded or to circulating current
causing the winding to heat.
Similarly, such use of statistical indicators can
lead to certain faults being confused; for example poor
grounding of the transformer tank can be confused with
damage to a winding.
The present invention seeks to provide a method of
diagnosing a fault on a transformer winding serving both
to increase the number of faults that are detectable and
to distinguish between different faults.
For this purpose, the invention provides a method
of diagnosing a fault on a transformer winding, the
method comprising the following steps:
= measuring the impedance on said winding as a
function of frequency, said measurement being
represented in the form of a first voltage gain;
= comparing said impedance measurement with a
reference measurement represented in the form of a
second voltage gain, said comparison including a step of
calculating three first parameters, each of said three
first parameters being a correlation coefficient,
CA 02452400 2003-12-05
B 14502' PR
4
between said first and second gains over three different
frequency ranges;
said method being characterized in that it
comprises a step of determining the relative variation
of at least a fourth parameter, said fourth parameter
being a physical magnitude characteristic of said
transformer, said relative variation being obtained by
comparing said first and second gains.
By means of the invention, three correlation
coefficients are combined with the relative variation of
at least a fourth parameter enabling certain faults to
be identified that are not detected by the values of the
correlation coefficients. Depending on the value of the
relative variation of said fourth parameter, it is also
possible to resolve doubt between various possible
faults.
Advantageously, said fourth parameter is selected
from minimum gain, fundamental resonant frequency, and
number of resonant frequencies present above a
predetermined frequency.
Advantageously, said minimum gain is determined for
a frequency below 10 kilohertz (kHz).
The minimum gain is defined as the minimum value
taken by the voltage gain k as described with reference
to Figure 1 as a function of measurement frequency; the
minimum gain to be determined is the minimum gain at a
frequency of less than 10 kHz. It can happen that this
gain takes a minimum value at a higher frequency, but
this value is less pertinent in identifying faults.
Advantageously, said three different frequency
ranges are respectively: [1 kHz to 10 kHz], [10 kHz to
100 kHz], and [100 kHz to 1 MHz].
It turns out that the correlation coefficients
calculated at below 1 kHz are less pertinent, and that
CA 02452400 2003-12-05
B 14502 PR
those calculated above 1 MHz give information that is
unreliable.
In a particularly advantageous embodiment, said
method includes a step of determining the relative
5 variation of at least a fifth parameter and a sixth
parameter, said fifth and sixth parameters being
characteristics of said transformer, said relative
variation being obtained by comparing said first and
second gains.
In this implementation, said fourth parameter is
minimum gain, said fifth parameter is fundamental
resonant frequency, and said sixth. parameter is number
of resonant frequencies present above a predetermined
frequency.
In highly advantageous manner, said method includes
a step of determining a plurality of diagnosis codes,
each of said codes indicating whether a respective one
of said parameters belongs to a predetermined range of
values.
In this embodiment, said method includes a step of
determining the presence of a fault and of identifying
said fault as a function of said plurality of diagnosis
codes.
Advantageously, said step of determining the
presence of a fault and of identifying said fault is
performed by comparing said plurality of codes with
codes stored in a search table.
Other characteristics and advantages of the present
invention appear from the following description of an
embodiment of the invention given purely by way of non-
limiting illustration.
In the following figures:
= Figure 1 is a diagram of a circuit for analyzing
the frequency response of an impedance;
CA 02452400 2003-12-05
B 14502 PR
6
= Figure 2 is a diagram of a three-phase
transformer; and
= Figure 3 shows the respective gains as a function
of frequency for two high tension windings of two of the
phases of a three-phase transformer.
Figure 1 is described above with reference to the
state of the art. The FRA measurements described below
were all taken using an analysis circuit of the kind
shown in Figure 1.
Figure 2 is a diagram of a three-phase transformer
3.
The three-phase transformer 3 comprises:
a magnetic circuit 4;
= a tank 5;
= three low voltage windings 6; and
= three high voltage windings 7.
Each pair of high and low voltage windings
corresponds to one phase of the transformer and is
associated with a respective core 9 of the circuit 4.
The three phases of the transformer are referred to
below respectively as A, B, and C.
The magnetic circuit 4 and the tank 5 are connected
together by a connection 8 and they are both grounded.
Three impedance measurements can be performed
respectively for high voltage and for low voltage.
Thus, if a fault is suspected on one of the high
voltage windings of the transformer, the gain of that
winding is measured as a function of frequency, and the
same measurement is performed on another one of the high
frequency windings, after which the respective gains of
said two windings are compared. It should be observed
that a third measurement is also possible by using the
third high voltage winding.
It is also possible to make a comparison between
measurements taken on a winding suspected of being
CA 02452400 2003-12-05
B 14502 PR
7
faulty and measurements taken previously on the same
winding. It is also possible to compare measurements
taken on a suspect winding with measurements taken on an
equivalent winding of another transformer of the same
design.
By way of example, Figure 3 shows the respective
gains k and k' of two high voltage windings for the
phases C and A respectively of a three-phase transformer
of the kind shown in Figure 2.
The gains k and k' are shown for frequency varying
over the range 10 Hz to 1 MHz.
A fault is suspected to be present on the high
frequency winding of phase C that corresponds to gain k.
In order to determine the presence of a fault, if
any, and to diagnose that fault, the method of the
invention comprises calculating six parameters.
The first three parameters are the correlation
coefficients p1, p2, and p3 between k and k' as
calculated over the following three frequency ranges:
[1 kHz to 10 kHz] , [10 kHz to 100 kHz] , and [100 kHz to
1 MHz].
For two sets of n numbers X {x.1, x2, ... , xn} and Y
{yi, y2, = = -, yn}, the correlation coefficient p is
defined by the following equation:
n
p = Exiyi
i=1 i=1 i=1
The fourth parameter is defined as being the
relative change in the minimum gain CRk at low
frequency, i.e. at a frequency value of less than
10 kHz. Thus, if km is the minimum gain of the
impedance to be analyzed and k',, is the minimum gain of
the reference impedance, then the coefficient of
relative change in minimum gain C:E2k is defined by the
equation:
CA 02452400 2003-12-05
B 14501 PR
8
CRk = k,,
The fifth parameter is defined as being the
relative change in the fundamental resonant frequency
CRf. The fundamental resonant frequency is the first
resonant frequency in each of the gains k and k'. if
the respective fundamental resonant frequencies of the
gains k and k' are written f and f', then the parameter
CRf is defined by the equation:
f
CRf
The sixth parameter is defined as being the
relative change in the number of resonant frequencies
lying in the range 100 kHz to 1 MHz. If the numbers of
resonant frequencies in k and k' over the range 100 kHz
to 1 MHz are written respectively n and n', then the
parameter CRn is defined by the equation:
n
CRn = -
n'
Each measurement of the gain k compared with a
measurement of the reference gain k' thus corresponds to
the following sextuplet of parameters {P11 P2, P3, CRk,
CRf, CRn I .
These parameters can be calculated either by using
a computer tool or by an operator using a MSExcel or
other spreadsheet.
Thus, by calculating these parameters for the
curves shown in Figure 3, the following values are
obtained:
P1 = 0.7483
P2 = 0.9797
P3 = 0.8577
CRk = 0.98717
CRf = 1
CRn = 1.8333
CA 02452400 2003-12-05
B 14502 PR
9
Thereafter, each of these values is associated with
a code. These codes are summarized in Table 1 below.
Table 1
Parameters Values Codes
p (valid for all Normal range 0
frequency ranges)
> 0.7000 1
< 0.7000 2
CRf < normal range 9
Frequency 8
eliminated
Normal range 0
Normal range to 1
1.25
1.25 to 1.5 2
1.5 to 5 3
>5 4
CRk > normal range 9
Normal range 0
>0.8 1
0.2 to 0.8 2
<0.2 3
CRn Normal range 0
> normal range 1
Thus, six codes can be associated with each
sextuplet {p1, p2, p3, CRk, CRf, CRn} .
The term "normal range" means that the parameter
lies within a range of variation that is referred to as
being "normal".
This normal range of variation depends on the
winding used for the reference measurement. Table 2
summarizes normal variations when the same winding is
CA 02452400 2003-12-05
B 14502 PR
used for the analysis measurement and for the reference
measurement.
Table 2
Parameters Normal ranges
p (valid for all frequency [0.9950 to 1.00001
ranges)
CRf [0.9000 to 1.1000]
CRk km - 6 km + 6
to
km km
CRn 1.2000
5
Table 3 summarizes the normal variations when a
different winding is used as the reference (as shown in
Figure 3).
10 Table 3
Parameters Normal ranges
p (valid for all frequency [0.9750 to 1.0000]
ranges)
CRf [0.6500 to 1.1000]
CRk km - 6 km + 6
to
km km
CRn 1.2000
The parameters {p1, p2, p3, CRk, CRf, CRn} for the
curves shown in Figure 3 thus take on the codes: 101001.
When the six codes have been determined, the
invention moves onto a step of comparing the six codes
with codes recorded in a search table as shown in Table
4.
CA 02452400 2003-12-05
B 14502 PR
11
Table 4
Type of fault P2 P CRf CRk CRn
1) No fault 0 0 0 0 0 0
2) Poor grounding 0 0 0-1 0 0 0
of tank (high
resistance)
3) No grounding of 0 0 0-1 0-9 0-1 0
tank
4) No grounding of 0 0 0 0-9 0-1 0
magnetic circuit
5) Closed loop 0 0 0 0-9 0 0
grounded
6) Closed loop at 0 0 0-1 0-9 0 0
floating potential
7) Additional turn 0-1-2 0 0 3 2-3 0
short circuited
(same phase)
8) Fault between 0-1-2 0-1-2 0--1-2 8 3 0
terminals of
winding (winding
under analysis
affected)
9) Fault between 0-1-2 0-1-2 0 8 3 0
winding terminals
(another winding
on the same phase
affected)
10) A turn short 0-1-2 0 0 0 0-1-2 0
circuited
11) A plurality of 0-1-2 0-1 0-1 4 2 0
turns short
circuited
12) Short circuit 0-1 0 0 2 0 0
on the sole
adjacent phase
CA 02452400 2003-12-05
B 14502'PR
12
13) Short circuit 0-1 0 0 1 0 0
on a phase other
than the sole
adjacent phase
14) Winding 0-1 0-1 0 0 0 0
displaced or
buckling of inner
winding
15) Winding 0 0 0-1 0 0 0-1
damaged
16) Winding 0-1 0-1 0-1 0 0 0-1
displaced and
damaged
17) Poor 0-1-2 0-1-2 0--1-2 0-1 9 0
continuity
18) One of the 1-2 0-1 0--1 0 0 0-1
terminals of the
winding being
measured is
grounded
19) One of the 1-2 0-1-2 0 9-0 0-1-2 0-1
terminals of a
phase other than
that of the
winding being
measured is
grounded
20) One of the 0 0 0-1 0 0 0-1
terminals of
another winding of
the same phase as
the winding being
measured is
grounded
Comparing the calculated parameters with the search
table as shown in Table 4 can be performed by a computer
program developed in a Matlab environment.
The following explanation of faults is given with
reference to Figure 2.
Faults 2 and 3 correspond to poor grounding of the
tank 5. With fault 3, there is no grounding while with
fault 2, the tank is grounded with high resistance
between the tank 5 and ground (greater than 50 0).
CA 02452400 2003-12-05
B 14502 PR
13
Fault 4 corresponds to no grounding of the magnetic
circuit 4, i.e. to a break in the connection 8.
Faults 5 and 6 correspond to circulating current
loops respectively connected to ground and to a floating
potential. These loops cause the transformer to become
heated.
Fault 7 corresponds to the presence of an
additional turn creating a short circuit on the phase to
which the winding under analysis belongs.
Fault 8 corresponds to a fault between the
terminals of the winding under analysis; i.e. to a short
circuit of the entire winding.
Fault 9 corresponds to a fault between the
terminals of a winding belonging to the same phase as
the winding under analysis.
Fault 10 corresponds to a short circuit present on
a turn of windings belonging to the same phase as the
winding under analysis. This fault produces heating of
the transformer.
Fault 11 corresponds to a short circuit present on
a plurality of turns belonging to the same phase as the
winding under analysis. This fault produces heating of
the transformer.
Fault 12 corresponds to a short circuit fault such
as a short circuit between turns, between terminals, or
with an additional turn. It indicates that the fault is
located on a phase adjacent to the phase on which the
measurement is being performed and that the phase where
the fault is located is the sole adjacent phase, i.e.
immediately beside the phase where the measurement is
being performed. Thus, if the fault is on the central
core, analyzing other phases will give rise to this code
since the central phase is indeed the only phase that is
immediately beside both the left and the right phases.
CA 02452400 2003-12-05
B 14502 PR
14
Fault 13 also corresponds to a short circuit fault
such as a host circuit between turns, between terminals,
or on an additional turn. However it indicates that the
fault is not on the sole phase located immediately
beside the phase where the measurement is being
performed. Thus, if the fault is found on the left-hand
core, then analyzing the central phase will produce this
code since there are actually two phases immediately
beside the central phase, and not only one.
Fault 14 corresponds to the winding under analysis
being displaced axially but without the winding being
excessively damaged locally, or else it corresponds to
buckling of an inner winding.
Fault 15 corresponds to localized mechanical damage
on the winding under analysis.
Fault 16 combines faults 14 and 15.
Fault 17 corresponds to poor electrical continuity
in the winding under analysis. This poor continuity may
be associated with a poor measurement contact.
Fault 18 corresponds to one of the terminals of the
winding under analysis being grounded.
Fault 19 corresponds to one of the terminals of a
winding belonging to a phase other than the winding
under analysis being grounded.
Fault 20 corresponds to one of the terminals of a
winding other than the winding under analysis being
grounded, said other winding nevertheless belonging to
the same phase.
Faults 18, 19, and 20 are more indicative of faults
in making a measurement.
Thus, by comparing the codes 101001 associated with
the curves of Figure 3 with the faults listed in Table
4, it can be deduced that a fault of type 16 or 18 is
present. A measurement problem of type 18 can be
eliminated by performing the measurement again and by
CA 02452400 2003-12-05
B 14502 PR
determining whether or not a fault of type 16 is
present, i.e. a winding that is damaged or displaced.
Naturally, the invention is not limited to the
embodiment described above.
5 In particular, the steps of calculating the
parameters and of searching the search table as
performed by software means could also be performed by
operators.
Similarly, the code values are given by way of
10 indication, but they could be replaced by other values
adapted to other software tools.