Note: Descriptions are shown in the official language in which they were submitted.
CA 02460794 2004-08-16
SYSTEM AND METHOD FOR SAMPLE DETECTION BASED ON LOW-
FREQUENCY SPECTRAL COMPONENTS
REFERENCES
US Patent Nos. 4,751,515, 5,734,353, 5,952,978, 5,959,548, 6,028,558,
6, 204, 821, 6, 323, 632.
Introduction to Digital Signal Processing, Proakis and Manolakis, (Macmillan,
1988, ISBN 0-02-396810-9).
Advanced Digital Signal Processing, Proakis, Rader, Ling and Nikias,
(Macmillan,
1992, ISBN 0-02-396841-9).
The Fast Fourier Transform and Its Applications, Brigham, E. Oren, (Prentice-
Hall, Inc., 1988).
The Fourier Transform and Its Applications, Bracewell, Ron N., (McGraw-Hill'
Book Company, 1965).
The analysis and restoration of astronomical data via the fast Fourier
transform,
Brault, J. t~V. and White, O. R., 1971, Astronomy 8~ Astrophysics., 13, pp.
769-
189.
Split-radix FFT Algorithm, Duhamel, P. and Hollmann, H., 1984, Electr.
Letters,
vol. 1, pp. 14-16, January.
An algorithm for the machine calculation of complex Fourier series, Cooley, J.
W.
and Tukey, J. W., 1965, Mathematics of Computation, 19, 90, pp. 297-301.
Digital Signal Processing, Oppenheim, Alan & Schafer, Ronald, (1975, ISBN 0
13-214635-5).
An Introduction to Fourier Theory, by Forrest Hoffman,
1
CA 02460794 2004-03-17
WO 03/102566 PCT/US03/11834
("http:llaurora.phys.utk.edul forrestlpaperslfourier~ndex.html#introduction')
BACKGROUND
There are a variety of spectroscopic tools for characterizing atomic or
molecular compound. These include, but are not limited to, x-ray, UV, visible-
light,
infrared and microwave spectroscopy, and nuclear and electron spin resonance
(NMR and ESR) spectroscopy. In general, spectroscopic tools are useful for at
least
four different type of chemical-analytical problems: first, to characterize an
atomic
and molecular compound according to its spectrographic features, e.g.,
spectral
components; second, to determine the atomic composition of a compound,
according to the spectral characteristics of atoms making up the compound;
third, to
determine 2-D or 3-D conformation of a molecular compound according to the
spectral characteristic of atom-atom interactions in the compound; and fourth,
to
detect and identify components, e.g., contaminants, in a sample according to
the
distinguishing spectral characteristics of the compound being detected.
Most existing spectroscopic tools provide some unique advantages) in terms
of sensitivity, the information gained, ease of measurement and cost. Because
each
tool provides information not otherwise available, it is generally
advantageous to be
able to bring to bear on any chemical-analytical, as many pertinent
spectroscopic
tools as possible.
SUMMARY
In one aspect, the invention includes an apparatus for use in detecting a
selected material in a sample or environment(s). A data storage device in the
apparatus stores, for each of one or more preselected materials including the
selected material, a data set containing low-frequency spectral components
that are
(i) in a selected frequency range between do to 50 Khz, and (ii)
characteristic of that
material. A detector assembly in the apparatus has a detector coil for
generating a
time-domain signal having signal components related to low-frequency
electromagnetic radiation produced by the selected material in the sample,
when the
sample is placed adjacent the coil. Signal conditioning components in the
2
CA 02460794 2004-03-17
WO 03/102566 PCT/US03/11834
apparatus convert the signal from the detector coil to an amplified
conditioned signal
from which frequency components above a selected frequency have been removed.
An electronic computer in the apparatus receives the conditioned signal and
processes this signal by the steps of
(i) retrieving from the data storage device (a), a data set of low-frequency
spectral components characteristic of the selected sample material,
(ii) filtering the conditioned signal, with such in digitized form, to
selectively pass low-frequency spectral components corresponding to those of
the
retrieved data set;
(iii) cross-correlating the filtered signal from (ii) with the data set of low-
frequency spectral components from (i) to produce a frequency-domain spectrum
in
a frequency range within do to 50khz, and
(iv) determining whether the frequency-domain spectrum contains one or
more low-frequency signal components that are characteristic of the selected
material, and diagnostic of the presence or absence of such material in the
sample.
The output of the processing steps may be stored or displayed on an
interface device connected to the computer.
For use in detecting a material in a fluid sample, the detector assembly may
include a sample tube having sample inlet and outlet ports through which
sample
can be directed through the tube. The detector coil may be wound about the
tube in
a winding direction substantially perpendicular to the direction of sample
flow in the
tube. The tube is preferably formed of pyrex glass or other material that is
transparent to low-frequency electromagnetic signals, but itself produces
little or no
low-frequency signal. The detector assembly may further include a toroidal
ferrite
core having the collector tube disposed about at least a portion of the
circumference
of the core, with the detector coil wound around the tube and core in a radial
winding direction. Also in this general embodiment, the detector assembly may
further include a source of Gaussian noise and a noise-injection coil wound
about
the circumference of the toroidal core, through which Gaussian noise can be
introduced from the source into the sample in the tube.
In another general embodiment, the detector coil in the detector assembly
includes a Helmholz coil having a pair of opposed coil elements between which
the
sample can be placed. In one embodiment, the opposed coil elements define an
3
CA 02460794 2004-03-17
WO 03/102566 PCT/US03/11834
open sample-detection region therebetween, through which self-supporting
samples
can be inserted and removed.
In still another embodiment, the detector coil is a Tesla coil.
For use in detecting gaseous or particulate material in a gaseous-stream
sample, the detector assembly includes a filter effective to trap sample
material, as
the sample passes through the filter. The detector coil is placed against the
filter
with its winding direction substantially parallel to the filter.
The computer may be operable, in carrying out processing step (iv), to
identify the frequencies of low-frequency signal components in the spectrum
whose
cross-spectral correlations have a selected statistical measure above
background
spectral noise.
The computer may be operable, in carrying out step (iv), to (iva) receive an
additional frequency-domain spectrum for a given sample, (ivb) add the
additional
spectrum to the originally produced spectrum, and average the added spectra,
and
(ivc) repeat steps (iva) and (ivb) until components in the summed and averaged
spectrum have a selected statistical measure above background noise.
In another aspect, the invention includes a method for detecting a selected
material in a sample. In practicing the method, a sample is placed adjacent a
detector coil, thereby to generate an electromagnetic time-domain signal
composed
of sample source radiation. The signal is converted to an amplified
conditioned
signal from which frequency components above a selected frequency have been
removed, then filtered to selectively pass low-frequency spectral components
that
are (i) in a frequency range between do and 50 kHz, and (ii) characteristic of
the
selected material.
The filtered signal is cross-correlated with a data set of low-frequency
spectral components that are (i) in a frequency range between do and 50 kHz,
and
(ii) characteristic of a selected material, to produce a frequency-domain
spectrum in
the frequency range within DC to 50 kHz. By determining whether the frequency-
domain spectrum contains one or more low-frequency signal components that are
characteristic of the selected material, the presence or absence of such
material in
the sample is detected.
For use in detecting a material in a fluid sample, the sample may be flowed
through a sample tube having sample inlet and outlet ports. Here the detector
coil
4
CA 02460794 2004-03-17
WO 03/102566 PCT/US03/11834
may be wound about the tube in a winding direction substantially perpendicular
to
the direction of sample flow in the tube. The sample tube may be disposed
adjacent
a toroidal ferrite core, with the detector coil wound around the tube and core
in a
radial winding direction. In this embodiment, the method may further include
injecting Gaussian noise into the sample during generation of the time-domain
signal.
Alternatively, the detector coil may be a Helmhol~ coil having a pair of
opposed coil elements. In this embodiment, the sample may be placed between
the
coil elements.
For use in detecting gaseous or particulate material in a gaseous-stream
sample, the sample may be passed sample through a filter effective to trap
sample
material, as the sample passes through the filter. The detector coil is placed
adjacent the filter, preferably with a winding direction substantially
parallel to the
plane of the filter.
The step of determining whether the frequency-domain spectrum contains
one or more low-frequency signal components that are characteristic of the
selected
material may include identifying the frequencies of low-frequency signal
components
in the spectrum whose cross-spectral correlations have a selected statistical
measure above background spectral noise.
The step of determining whether the frequency-domain spectrum contains
one or more low-frequency signal components that are characteristic of the
selected
material may include (a) receiving an additional frequency-domain spectrum for
a
given sample, (b) adding the additional spectrum to the originally produced
spectrum, and averaging the added spectra, and (c) repeating steps (a) and (b)
until
components in the summed and averaged spectrum have a selected statistical
measure above background noise.
These and other aspects and features of the invention will become more fully
apparent when the following detailed description of embodiments the invention
is
read in conjunction with the accompanying drawings.
CA 02460794 2004-03-17
WO 03/102566 ~ ".,. , ., , ~ ",tPCT/US03/11834,
Il;,.ss (I,:". ",~~~ " ~" s~:,:l~ ~E :;tr E~,.~~ ~.:I~ r~'- ,.,~~,, .mL~
st'..:~f= ..,a= (f"il.,
BRIEF DESCRIPTION OF THE DRAWINGS
Fig. 1 shows components of an apparatus constructed in accordance with
one embodiment of the invention;
Fig. 2 shows components of an apparatus constructed in accordance with
another embodiment of the invention;
Fig. 3 is a block diagram of signal processing for streaming data
Fig. 4 shows elements of a toroidal detector assembly constructed in
accordance with one embodiment of the invention;
Fig. 5 shows elements of a collector assembly for air-borne material
constructed in accordance with another embodiment of the invention;
Fig. 6A shows a time-domain signal recorded from an NaCI solution, in
accordance the method of the invention;
Fig. 6B shows the time-domain signal from Fig. 6A after signal amplification
and removal of higher-frequency components;
Fig. 6C shows the time-domain signal from Fig. 6B after notch filtering to
pass selected low-frequency spectral components of a solution of NaCI; and
Fig. 6D shows a frequency-domain spectrum of NaCI produced by cross-
correlating the filtered signal from 6C with a data set of low-frequency
spectral
components associated with NaCI; showing a low-frequency spectral component
characteristic of NaCI.
Fig. 7 is a diagram of the processing unit included in the detection system.
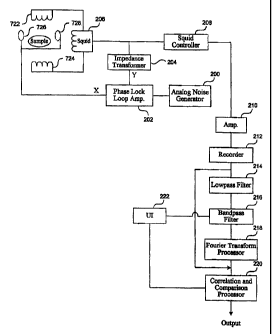
Fig. 8 is a diagram of an alternative processing unit of that of Fig. 7.
Fig. 9 is a flow diagram of the signal detection and processing pertormed by
the present system.
DETAILED DESCRIPTION
I. Definitions
The terms below have the following definitions unless indicated otherwise.
"Sample that exhibits molecular rotation" refers to a sample material, which
may be in gaseous, liquid or solid form (other than a solid metal) in which
one or
more of the molecular compounds or atomic ions making up or present in the
sample exhibit rotation.
6
CA 02460794 2004-03-17
WO 03/102566 PCT/US03/11834
"Time-domain signal" or 'time-series signal" refers to a signal with transient
signal properties that change over time.
"Sample-source radiation" refers to magnetic flux emissions resulting form the
rotation of a molecular dipole in a magnetic field.
"Gaussian noise" means random noise having a Gaussian power distribution.
"Stationary white Gaussian noise" means random Gaussian noise that has no
predictable components
"Frequency-domain spectrum" refers to a Fourier frequency plot of a time-
domain signal.
"Spectral components" refer to singular or repeating qualities within a time-
domain signal that can be measured in the frequency, amplitude, and/or phase
domains. Spectral components will typically refer to signals present in the
frequency domain.
"Similar sample," with reference to a first sample, refers to the same sample
or a sample having substantially the same sample components as the first
sample.
II. Apparatus
The apparatus of the invention operates at the extreme low end of the,
electromagnetic spectrum between Direct Current (DC) and 50 Kilohertz. (KhZ)
This technology is passive, which means it does not require 'painting' the
target with
harmful, or ionizing radiation (although some embodiments inject white noise
into
the system/sample). In at least one embodiment, this molecular sensing
invention
detects naturally occurring thermal electromagnetic radiation and offers a
fast,
simple method for remotely sensing extremely small molecular concentrations.
Applications include, but are not limited to: remote sensing of weapons,
explosives
and biohazards, detection of genetically modified grains and crops, real-time
detection of organisms such as E.coli and the aids virus, and real-time
chemical
analysis of process streams in volatile, corrosive or thermal environments.
This remote sensing system detects molecular electromagnetic emissions,
performs time series Fourier spectral analysis and compares the results
against
archived data, identifying molecular materials in near real time that may not
be
otherwise detectable. The device has the ability to detect multiple materials
7
CA 02460794 2004-03-17
WO 03/102566 PCT/US03/11834
simultaneously and is scalable from small handheld devices to large industrial
applications.
Fig. 1 illustrates an apparatus 20 constructed according to one embodiment
of the invention, for detecting a selected material, e.g., compound, ionic
species,
particulate material, contained in a sample. The apparatus include a detector
assembly 22 having a detector coil 24 for generating a time-domain signal
related to
low-frequency electromagnetic radiation produced by the material in the
sample.
Although not shown in Fig. 1, the sample is placed in a sample region 26
adjacent
the coil. As will be seen below, the sample region may include an open region
between sample coils, a sample collector, such as a membrane, or a sample tube
through which sample material can be flowed. The sample region, including
specific
sample holders, is also considered part of the detector assembly. Fig. 6A
shows a
typical time-domain signal for a 0.25 M NaCI sample recorded with the
apparatus of
the invention.
Shown at 27 are signal conditioning components for converting the signal
from the detector coil to an amplified conditioned signal from which frequency
components above a selected frequency have been removed. These components,
which are illustrated in Fig. 3, which also shows at 25 the target analog
signal
generated by the detector assembly. Components 27 in the figure include a low-
noise amplifier 28 (an AD 620 LNA 7or equivalent is suitable) that amplifies
the
signal to a serviceable level, e.g., with a gain of 1 to 1000. The amplifier's
gain is
addressable by the user as a method for adjusting the sensitivity the sensing
device.
Also include in components 27 is an analog low-pass filter which functions to
condition the signal for A/D conversion by passing frequencies below 50 kHz,
such
as a conventional Butterworth analog filter. This filter adjusts and limits
the
bandwidth of the received signal depending on down stream processing
requirements. This filter is addressable by the user and by the interpreter,
depending on data characteristics held in archive. If the primary spectral
components of an archived signal occur within a narrow bandwidth the
interpreter
can instruct the filter to narrow the bandwidth, thereby increasing the
efficiency of
the Fourier processor. The digital filter also may provide a notch filter to
remove
unwanted signals in noisy environments. Fig. 6B shows the Fig.-6A signal for a
8
CA 02460794 2004-08-16
0.25 M NaCI sample after amplification and band-pass filtering to remove
frequency
components above 50 kHz.
The output of the low-pass filter is supplied to an analog-to-digital
converter
34 for converting the amplified filtered analog signal to digital form. A
typical AlD
converter is a 16 bit analog to digital converter, such as is supplied by
Analog
Devices (Los Angeles, CA), although other resolutions are possible, such as a
24 bit.
The output of the AID converter is operably connected to an electronic
computer 36 in the apparatus for performing a series of signal processing
steps.
leading to the identification of spectral components that are diagnostic of
the sample
material to be identified, as will be described. The computer includes a
digital signal
processing module 35 which is designed for high speed signal processing
operations
as will be described. Also included in the computer is a data-storage device
37,.
such as a conventional thin-film storage device 37 for storing, for each of
one or
more preselected materials including the selected material, a data set
containing
low-frequency spectral components that are (i) in a selected frequency range
between DC to 50 kHz, and (ii) characteristic of that material. This data set
is
generated by recording and processing low-frequency signals from a selected
material under conditions of high magnetic and electromagnetic shielding.
Further
details are provided below in the section "Generating Signals".
Briefly, the low-frequency recording device produces a data set containing a
plurality of low frequency spectral components, typically in the range 100 Hz
to 6.6
kHz, but including the broader range of DC to 50 kHz, that are characteristic
of the
sample material, e.g., water, an ionized salt, a solute material, an undesired
contaminant, a biological sample material or the like. In general, the more
complex
the sample material, the more complex (the greater the number of
characteristic
spectral components) the sample material data set will contain. As will be
appreciated from below, the ability to detect a selected sample material by
the
method of the present invention relies on the fact that different selected
materials of
interest are characterized by different spectral "signatures," that is,
different sets of
characteristic low-frequency components, such that at least one, and typically
s
CA 02460794 2004-03-17
WO 03/102566 PCT/US03/11834
several of the characteristic spectral components of a material will be unique
to that
material.
The nature of the data sets that are installed on the storage device in the
apparatus will depend on the selected materials one wishes to detect with the
apparatus. Typically, for a mobile field unit, the data sets will include data
sets for
all material one expects to detect in a filed setting, include, for example,
various
contaminants that may be present in a water sample, or various air-borne
sample
one may wish to detect, such as atmospheric particulates, air-borne biological
particles or chemical components present in the air.
As indicated above, the computer is designed to perform a variety of signal
processing operations, as indicated in Fig. 3. The first operation signal
processing is
carried out to selectively pass frequency components corresponding to the low-
frequency spectral components of the sample material of interest. Thus, this
stage
performs the function of a plurality of notch filters, each notch passing one
of the
spectral bands in the data set for the material of interest. In performing
this
operation, the computer first retrieves from the data storage device, a data
set of
low-frequency spectral components characteristic of the selected sample
material,
and records the low-frequency spectral components associated with that
material.
This data is used in a conventional digital notch and band pass filter 38 to
(i)
remove (notch filter) 60 Hz frequency components, and pass those frequencies
(band pass filter) corresponding to spectral frequencies in the retrieved data
set. In
general, the digital filter passes selected frequencies between direct current
and 50
kHz. The pass band filter may consist of an array of addressable digital
filters
capable of providing multiple pass bands while also providing a notch filter
at power
line frequencies and other known noise frequencies. The digital filter is
addressable
by the processor and may also be configured to be user addressable.
There may be some compression in the AID conversion of signals. There is
also a data buffer 39 between the ADC and the Fourier processor for
temporarily
storing streaming data from the input. The results of the analysis (not the
signal) will
be presented in some form of graphic display and will also be stored in the
onboard
data archive for later retrieval.
In the next processing step, the band-pass filtered time-domain signal is
cross-correlated at 40 with the spectral components of the retrieved data set,
to
CA 02460794 2004-03-17
WO 03/102566 PCT/US03/11834
generate a frequency-domain spectrum in a frequency range within DC to 501<Hz
that contains, as spectral components, those spectral frequencies present in
both
the filtered signal and the data set. That is, the spectrum will evidence, by
the
presence of absence of characteristic spectral components, the presence of
absence of the sample material of interest. The cross-correlation module
performs
a time series Fast Fourier Transform on the received data using radix-2, radix-
4, or
a split-radix algorithm. The resulting data is representative of the original
signal
consisting of spectral amplitudes measured in seconds per cycle (time series
equivalent to Time, Frequency, and Amplitude). A spectrum for 0.25 M NaCI
generated by cross-correlating the Fig. 6B signal with a data set of spectral
components for this sample is shown in 6C.
The cross-correlation function may be performed by a monolithic processor
chip programmed to perform a Fourier correlative analysis of the unknown
signal
compared with Fourier data from a known signal. The results of the analysis
will be
rendered as a percentage spectral fit between the unknown signal and the known
signal. The 'fit' percentage will correlate to statistical significance and
this data is
then sent on to an interpreter to be filtered through an algorithm to
determine the
likelihood of a positive detection or match.
The processor may be a digital signal processor ("DSP") or a microprocessor
instructed to perform cross spectral correlations against archived data. The
processor may act independently, or in conjunction with other processors,
depending on architecture. This processor may also provide instruction to the
active digital filters to establish Fourier filters as signal preparation for
cross spectral
correlation. The processor may be part of a larger processing system which
includes data storage and an appropriate user interface with output devices)
(e.g.
visual display, speakers for audio, wireless transceiver, etc.). The user
interface
may provide for user control over the amplifier and filter modules, ADC and
correlator .
Typically, the spectrum generated above will require additional filtering,
and/or summing and averaging operations to enhance the spectral components
and/or evaluate whether the spectral components are above a defined
statistical
threshold that permits a reliable measure of identification of the selected
sample
material. In one exemplary method, a cross-correlated sample signal spectrum
is
11
CA 02460794 2004-03-17
WO 03/102566 PCT/US03/11834
compared with a cross-correlated noise (no sample) signal. A comparator
algorithm
the advances incrementally, e.g., in 0.1 Hz intervals across the cross-
correlated
sample spectrum and the cross-correlated noise spectrum, looking at the
correlation
value at each frequency point, and subtracts the noise correlation from the
sample
correlation at that point, to yield a frequency plot of corrected correlation
values. (Of
course, greater or lesser frequency intervals may be used depending upon the
application.) These values will be relative to a particular sample, and
depend, for
example, on the relative amplitude of any noise component.
Alternatively, the spectrum generated from a single reading may be summed
and averaged successively with spectra produced from the same sample. That is,
a
second spectrum produced as above from the same sample is added to the first
spectrum, and the two spectrum and summed and averaged. This process is
repeated until spectral components above a statistical threshold are observed.
These components are then "read" or compared to determine if they match the
characteristic frequencies of the selected material. The above operations are
carried out as shown at 42 in Fig. 3. A summed and averaged spectrum for an
NaCI
sample is shown in Fig. 6D.
The interpreter may be another monolithic processor chip capable of storing
and using a simple algorithm to determine an outcome from an event (or may be
a
routine performed by the above processor chip or system components). The event
will be a number reflecting the statistical significance (as a percentage) of
the fit
between the unknown and known signals. The algorithm will measure the'fit'
against
preset thresholds to determine the likelihood of a match based on the known
characteristics of the spectral data for a specific molecule. As an example,
one
molecule may have exceptionally high spectral energy within certain
frequencies
and cycles over time. Another molecule may have more uniform spectral energy
over those same frequencies and time. Each of these molecules may be produce a
statistical significance that is different but of equal weight. The
interpreter
compensates for this when there are multiple known molecular datasets in data
archive. In its simplest embodiment, the interpreter is a threshold against
which the
percentage fit signal is compared. The threshold may be adjusted based on
various
factors (e.g. reduce the threshold if the environmental noise level is high).
12
CA 02460794 2004-03-17
WO 03/102566 PCT/US03/11834
The data and/or results of the determinations are shown to the user at a
computer display 44. Alternatively, or in addition, the results are stored in
a storage
device 46, typically one associated with the computer. Also as shown in Fig.
1, the
computer has a keyboard 48 by which the user can specify signal processing
parameters, sample identification, and so forth.
A typical output will identify the selected sample of interest, and display a
table with side-by-side columns listing (i) the spectral components associated
with
the selected sample, and (ii) those statistically meaningful sample components
that
match those from the data set. From this, the user will be able to determine
whether
the selected material is in the sample. The output may also show an averaged
spectrum from which the spectral components are derived, to provide the user
with
some statistical measure of the reliability of the results.
An apparatus 50 constructed according to a second embodiment of the
invention is illustrated in Fig. 2. The apparatus here differs from apparatus
20 just
described in the detector assembly only, and thus other components of the
apparatus are shown by the same reference numerals as indicated from apparatus
20. The detector assembly in the apparatus, indicated at 52, includes as the
detector coil, a Helmholz coil 54 comprised of a pair of opposing coil
elements 56,
58. The two coils elements define a sample region 60 between the elements
through which a sample, such as indicated at 62, can be moved. This embodiment
is useful, for example, for detecting samples, such as portable objects, that
are
being screened or checked. As shown, the coil elements are separately
connected
to the signal amplifier in the noise injection coils. In operation, the two
separate
signals are processed the same as above.
Numerous alternative components are possible. For example, while the
detector coil is a tuned coil designed to operate between direct current and
50 kHz
capable of detecting low frequency electromagnetic emissions present in a
specific
area, a variety of coils can be implemented including, but not limited to:
Tesla coils,
toroidal coils, Helmholtz coils, slug tuned coils, and measured wavelength and
random wire loops.
The next two sections describe alternative detector assemblies, the first
having a sample tube and a toroidal detector for detecting material in a fluid
sample,
13
CA 02460794 2004-03-17
WO 03/102566 PCT/US03/11834
and the second having a filter sample collector for detecting a gas-borne
sample
material.
A. Toroidal Detector
Many commercial and industrial applications require materials to be
evaluated in a process stream in noisy electromagnetic environments. Sensing
molecular material inside a toroidal transformer provides a high level of
electromagnetic isolation. Applications for this system include, but are not
limited
to, real-time chemical analysis of process streams in volatile, corrosive or
thermal
environments, testing air for contaminates in commercial or public
environments,
and testing water supplies or other commercially available consumables.
The system provides the ability to move fluids and gasses through a toroidal
transformer while using the fluid or gas as a replacement for the primary
emitting
element. A gas or fluid is pumped around the circumference of the toroid
between
the torus core and induction coil. Gaussian white noise is injected inside the
toroid
via a noise element wrapped in a 1:1 ratio with a sample tube that moves the
gas or
liquid through the toroid (although other ratios may be used).
As molecular material moves through the toroid, Gaussian white noise is
injected 30 to 35 dBs above the level of the molecular signal. The molecular
signal
sums with the white noise to form a stochastic product that retains
identifying
characteristics of the molecular signal. The signal is then amplified and
processed
as described above, to identify material in the sample having a unique low-
frequency spectral signature.
The device uses the folded magnetic field of a toroid and provides inductance
between the primary and secondary element (sample tube and detection coil).
The
confined magnetic field (8) inside the toroid cavity is accurately quantified
by the
simple equation: 8 = A l r, where A is a proportionality constant (torus
factor), and r
is the radial distance from the long axis of the cavity.
A toroidal detector assembly constructed in accordance with this embodiment
of the invention is shown in plan view at 64 in Fig. 4. A glass, plastic,
preferably
Pyrex tube 66 is disposed about the outer circumference of a toroidal core 72
formed of a ferromagnetic material, such as Ferrite. The tube communicates at
its
opposite ends with inlet and outlet ports 68, 70, respectively, allowing
liquid or gas
14
CA 02460794 2004-03-17
WO 03/102566 PCT/US03/11834
samples to be pumped through the tube during a detection operation. The
dimensions of the toroid and tubing are dependent on the individual
application and
are only critical to the end-product design specifications. Further, the tube
ring
could be positioned in other locations within the coil, such as within a
center of the
core 72.
A noise injection coil 76 is disposed about the outer circumference of the
tube, as indicated. While the coil 76 is shown as one loop, it could take the
form of
coils disposed as the windings 74. The purpose of coil 76 is to allow the
addition of
Gaussian noise supplied from a Gaussian noise source noise 78 into the sample.
A secondary winding 74 which forms the detector coil in the assembly is
wrapped radially around the toroid core, tube 66, and noise coil 76. The size
and
type of the wire and the number of turns around the toroid is dependent on the
resonant frequency of the secondary coil. Although not critical, the
configuration
should be such as to achieve as high a Q factor as possible for the
transformer.
The detector coil is connected to a signal amplifier for signal conditioning
as
described above.
In operation, a fluid or a gas is pumped through the transformer in such a
manner as to provide a sustained low velocity flow. Sample material transiting
through the tubing emit extremely low amplitude electromagnetic waves that are
detected by the coil. White noise is injected into the area of the sample via
a noise
coil so as to mix with the natural electromagnetic emission from the target
material.
Gain is then applied to the noise until the noise is 30 to 35 dbs above the
target
signal. At this point the noise takes on the characteristics of the underlying
signal,
effectively amplifying the molecular signal under a natural condition known as
stochastic resonance. The stochastic product creates an induced voltage in the
secondary coil that is picked up and amplified by a preamplifier circuit.
The system effectively uses ambient electromagnetic environmental noise as
a stochastic source and applying Fourier analysis to identify stochastic
(waveform)
features that resemble (waveform) features of specific molecules. This also
establishes theoretical limits on the functional range of the detector.
Note, the scale of the toriod is dependent upon the application. For example,
a very large detector may be created with a large toroid to thereby sample a
large
volume of material.
CA 02460794 2004-08-16
B. Air Detector
Illustrated in Fig. 5 is apparatus 80 having an air-sample detector assembly
intended for the detection and identification of an unknown materials
entrained in a
gaseous form, e.g., air-borne particles. The assembly includes an air
transport tube
82, e.g., a 1 micron particulate filter, a detection coil 84, a radio
frequency shield 86,
and a pump 88 for pumping air through the tube and through the filter. The
detector
coil is oriented with its windings parallel to the plane of the filter, and
placed directly
against the back surface of the filter.
The air tube can be made of any suitable material, although plastics and fiber
composite materials may be preferable. The purpose of the air tube is to allow
airborne particulates to move through the device. A removable 1 micron
electrostatic
filter is used to trap airborne particulates as air moves through the filter.
Alternatively, where the apparatus is intended to measure material in
molecular gas
form, such as N0, S02, fluorocholorohydrocarbons, alkyl gases, and the like,
the
filter may provide a chemically reactive surface on which the material may be
adsorbed or absorbed, or with which the material may react.
Where it is necessary to dissolve the selected material of interest in a
solvent
in order to detect its low frequency rotational modes, the detector assembly
in the
apparatus may alternatively include separate collector and detection stations.
Thus,
for example, the apparatus may include a system for collecting material on a
filter,
and a separate detection system that includes a reservoir of solvent in which
the
filter is placed, allowing trapped material on the filter to release into the
solvent, e.g.,
water or organic solvent. The solution of suspended material may then be
interrogated with the solution in a Pyrex vessel having a detector-coil
winding about
the outside of the vessel.
In still another embodiment, the air is drawn through a reservoir of solvent,
e.g., water or an organic solvent in which the molecular-gas material is
dissolved.
That is, the air sample is bubbled through the reservoir at a rate effective
to trap the
selected material of interest. In this embodiment, the detector coil may be
wound
about the exterior of the reservoir, e.g., the exterior of a Pyrex cylindrical
vessel
through which the air is bubbled. The liquid sample with entrapped gas
material may
also be transfen-ed to a separate detector, e.g., the above toroidal detector
described
above.
ig
CA 02460794 2004-03-17
WO 03/102566 PCT/US03/11834
III. Generating Signals
Details on how certain signals, such as baseline or data set signals used for
comparing with sampled signals will now be described.
Referring to Figure 7, a processing unit employing aspects of the invention
includes a sample tray 840 that permits a sample 842 to be inserted into, and
removed from, a Faraday cage 844 and Helmholtz coil 846. A SQUIDIgradiometer
detector assembly 848 is positioned within a cryogenic dewar 850. A flux-
locked
loop 852 is coupled between the SQUID/gradiometer detector assembly 848 and a
SQUID controller 854. The SQUID controller 854 may be a model iMC-303 iMAG
multichannel controller provided by Tristan of San Diego.
An analog noise generator 856 provides a noise signal (as noted above) to a
phase lock loop 858. The x-axis output of the phase lock loop is provided to
the
Helmholtz coil 846, and may be attenuated, such as by 20 dB. The y-axis output
of
the phase lock loop is split by a signal splitter 860. One portion of the y-
axis output
is input the noise cancellation coil at the SQUID, which has a separate input
for the
gradiometer. The other portion of the y-axis signal is input oscilloscope 862,
such
as an analog/digital oscilloscope having Fourier functions like the Tektronix
TDS
3000b. That is, the x-axis output of the phase lock loop drives the Helmholz
coil,
and the y-axis output, which is in inverted form, is split to input the SQUID
and the
oscilloscope. Thus, the phase lock loop functions as a signal inverter. The
oscilloscope trace is used to monitor the analog noise signal, for example,
for
determining when a sufificient level of noise for producing non-stationary
spectral
components is achieved. An analog tape recorder or recording device 864,
coupled
to the controller 854, records signals output from the device, and is
preferably a
wideband (e.g. 50 kHz) recorder. A PC controller 866 may be an MS Windows
based PC interfacing with the controller 854 via, for example, an RS 232 port.
In Figure 8, a block diagram of another embodiment of the processing unit is
shown. A dual phase lock-in amplifier 202 is configured to provide a first
signal
(e.g., "x" or noise signal) to coils 726, 728 and a second signal (e.g., "y"
or noise
cancellation signal) to a noise cancellation coil of a superconducting quantum
interference device (SQUID) 206. The amplifier 202 is configured to lock
without an
external reference and may be a Perkins Elmer model 7265 DSP lock-in
amplifier.
This amplifier works in a "virtual mode," where it locks to an initial
reference
17
CA 02460794 2004-03-17
WO 03/102566 PCT/US03/11834
frequency, and then removes the reference frequency to allow it to run freely
and
lock to "noise."
An analog noise generator 200 is electrically coupled to the amplifier 202.
The generator 200 ~is configured to generate or induce an analog white
Gaussian
noise at the coils 726, 728 via the amplifier 202. As an example, the
generator 200
may be a model 1380 manufactured by General Radio.
An impedance transformer 204 is electrically coupled between the SQUID
206 and the amplifier 202. The impedance transformer 204 is configured to
provide
impedance matching between the SQUID 206 and amplifier 202.
The noise cancellation feature of the SQUID 206 can be turned on or off.
When the noise cancellation feature is turned on, the SQUID 206 is capable of
canceling or nullifying the injected noise component from the detected
emissions.
To provide the noise cancellation, the first signal to the coils 726, 728 is a
noise
signal at 20 dB above the molecular electromagnetic emissions sought to be
detected. At this level, the injected noise takes on the characteristics of
the
molecular electromagnetic signal through stochastic resonance. The second
signal
to the SQUID 206 is a noise cancellation signal at 45 dB and is inverted from
the
first signal at an amplitude sufficient to null the noise at the SQUID output
(e.g., 180
degrees out of phase with respect to the first signal).
The SQUID 206 is a low temperature direct element SQUID. As an example,
the SQUID 206 may be a model LSQl20 LTS dC SQUID manufactured by Tristan
Technologies, Inc. Alternatively, a high temperature or alternating current
SQUID
can be used. Coils 722, 724 (e.g., gradiometer coils) and the SQUID 206
(collectively referred to as the SQUID/gradiometer detector assembly) combined
has
a magnetic field measuring sensitivity of approximately 5 microTesla/~Hz. The
induced voltage in the coils 722, 724 is detected and amplified by the SQUID
206.
The output of the SQUID 206 is a voltage approximately in the range of 0.2-0.8
microVolts.
The output of the SQUID 206 is the input to a SQUID controller 208. The
SQUID controller 208 is configured to control the operational state of the
SQUID
206 and further condition the detected signal. As an example, the SQUID
controller
208 may be an iMC-303 iMAG multi-channel SQUID controller manufactured by
18
CA 02460794 2004-03-17
WO 03/102566 PCT/US03/11834
Tristan Technologies, Inc. A flux-locked loop may be operatively positioned
between the SQUID and the SQUID controller.
The output of the SQUID controller 208 is inputted to an amplifier 210. The
amplifier 210 is configured to provide a gain in the range of 0-100 dB. A gain
of
approximately 20 dB is provided when noise cancellation node is turned on at
the
SQUID 206. A gain of approximately 50 dB is provided when the SQUID 206 is
providing no noise cancellation.
The amplified signal is inputted to a recorder or storage device 212. The
recorder 212 is configured to convert the analog amplified signal to a digital
signal
and store the digital signal. In one embodiment, the recorder 212 stores 8600
data
points per Hz and can handle 2.46 Mbits/sec. As an example, the recorder 212
may
be a Sony digital audio tape (DAT) recorder. Using a DAT recorder, the raw
signals
or data sets can be sent to a third party for display or specific processing
as desired.
A lowpass filter 214 filters the digitized data set from the recorder 212. The
lowpass
filter 214 is an analog filter and may be a Butterworth filter. The cutoff
frequency is
at approximately 50 kHz.
A bandpass filter 216 next filters the filtered data sets. The bandpass filter
216 is configured to be a digital filter with a bandwidth between DG to 50
kHz. The
bandpass filter 216 can be adjusted for different bandwidths.
The output of the bandpass filter 216 is the input to a Fourier transformer
processor 218. The Fourier transform processor 218 is configured to convert
the
data set, which is in the time domain, to a data set in the frequency domain.
The
Fourier transform processor 218 performs a Fast Fourier Transform (FFT) type
of
transform.
The Fourier transformed data sets are the input to a correlation and
comparison processor 220. The output of the recorder 212 is also an input to
the
processor 220. The processor 220 is configured to correlate the data set with
previously recorded data sets, determine thresholds, and perform noise
cancellation
(when no noise cancellation is provided by the SQUID 206). The output of the
processor 220 is a final data set representative of the spectrum of the
sample's
molecular low frequency electromagnetic emissions.
A user interface (UI) 222, such as a graphical user interface (GUI), may also
be connected to at least the filter 216 and the processor 220 to specify
signal
19
CA 02460794 2004-03-17
WO 03/102566 PCT/US03/11834
processing parameters. The filter 216, processor 218, and the processor 220
can
be implemented as hardware, software, or firmware. For example, the filter 216
and
the processor 218 may be implemented in one or more semiconductor chips. The
processor 220 may be software implemented in a computing device.
This amplifier works in a "virtual mode," where it locks to an initial
reference
frequency, and then removes the reference frequency to allow it to run freely
and
lock to "noise." The analog noise generator (which is produced by General
Radio, a
truly analog noise generator) requires 20 dB and 45-dB attenuation for the
Helmholz
and noise cancellation coil, respectively.
The Helmholz coil may have a sweet spot of about one cubic inch with a balance
of
1/100t" of a percent. In an alternative embodiments, the Helmholtz coil may
move
both vertically, rotationally (about the vertical access), and from a parallel
to spread
apart in a pie shape. In one embodiment, the SQUID, gradiometer, and driving
transformer (controller) have values of 1.8, 1.5 and 0.3 micro-Henrys,
respectively.
The Helmholtz coil may have a sensitivity of 0.5 Gauss per amp at the sweet
spot.
Approximately 10 to 15 microvolts may be needed for a stochastic response.
By injecting noise, the system has raised the sensitivity of the SQUID device.
The
SQUID device had a sensitivity of about 5 femtotesla without the noise. This
system
has been able to improve the sensitivity by 25 to 35 dB by injecting noise and
using
this stochastic resonance response, which amounts to nearly a 1,500% increase.
After receiving and recording signals from the system, a computer, such as a
mainframe computer, supercomputer or high-performance computer does both pre
and post processing, such by employing the Autosignal software product by
Systat
Software of Richmond CA, for the pre-processing, while Flexpro software
product
does the post-processing. Flexpro is a data (statistical) analysis software
supplied
by Dewetron, Inc.
A flow diagram of the signal detection and processing performed by the
system is shown in Figure 9. When a sample is of interest, at least four
signal
detections or data runs may be performed: a first data run at a time t~
without the
sample, a second data run at a time t2 with the sample, a third data run at a
time t3
with the sample, and a fourth data run at a time t4 without the sample.
Performing
and collecting data sets from more than one data run increases accuracy of the
final
(e.g., correlated) data set. In the four data runs, the parameters and
conditions of
CA 02460794 2004-03-17
WO 03/102566 PCT/US03/11834
the system are held constant (e.g., temperature, amount of amplification,
position of
the coils, the noise signal, etc.).
At a block 300, the appropriate sample (or if it's a first or fourth data run,
no
sample), is placed in the system. A given sample, without injected noise,
emits
electromagnetic emissions in the DC-50kHz range at an amplitude equal to or
less
than approximately 0.001 microTesla. To capture such low emissions, a white
Gaussian noise is injected at a block 301.
At a block 302, the coils 722, 724 detect the induced voltage representative
of the sample's emission and the injected noise. The induced voltage comprises
a
continuous stream of voltage values (amplitude and phase) as a function of
time for
the duration of a data run. A data run can be 2-20 minutes in length and
hence, the
data set corresponding to the data run comprises 2-20 minutes of voltage
values as
a function of time.
At a block 304, the injected noise is cancelled as the induced voltage is
being
detected. This block is omitted when the noise cancellation feature of the
SQUID
206 is turned off.
At a block 306, the voltage values of the data set are amplified by 20-50 dB,
depending on whether noise cancellation occurred at the block 304. And at a
block
308, the amplified data set undergoes analog to digital (AID) conversion and
is
stored in the recorder 212. A digitized data set can comprise millions of rows
of
data.
After the acquired data set is stored, at a block 310 a check is performed to
see whether at least four data runs for the sample have occurred (e.g., have
acquired at least four data sets). If four data sets for a given sample have
been
obtained, then lowpass filtering occurs at a block 312. Otherwise, the next
data run
is initiated (return to the block 300).
After lowpass filtering (block 312) and bandpass filtering (at a block 314)
the
digitized data sets, the data sets are converted to the frequency domain at a
Fourier
transform block 316.
Next, at a block 318, like data sets are correlated with each other at each
data point. For example, the first data set corresponding to the first data
run (e.g., a
baseline or ambient noise data run) and the fourth data set corresponding to
the
fourth data run (e.g., another noise data run) are correlated to each other.
If the
21
CA 02460794 2004-03-17
WO 03/102566 PCT/US03/11834
amplitude value of the first data set at a given frequency is the same as the
amplitude value of the fourth data set at that given frequency, then the
correlation
value or number for that given frequency would be 1Ø Alternatively, the
range of
correlation values may be set at between 0-100. Such correlation or comparison
also occurs for the second and third data runs (e.g., the sample data runs).
Because the acquired data sets are stored, they can be accessed at a later
time as
the remaining data runs are completed.
When the SQUID 206 provides no noise cancellation, then predetermined
threshold levels are applied to each correlated data set to eliminate
statistically
irrelevant correlation values. A variety of threshold values may be used,
depending
on the length of the data runs (the longer the data runs, greater the accuracy
of the
acquired data) and the likely similarity of the sample's actual emission
spectrum to
other types of samples. In addition to the threshold levels, the correlations
are
averaged. Use of thresholds and averaging correlation results in the injected
noise
component becoming very small in the resulting correlated data set.
If noise cancellation is provided at the SQUID 206, then the use of thresholds
and averaging correlations are not necessary.
Once the two sample data sets have been refined to a correlated sample data
set and the two noise data sets have been refined to a correlated noise data
set, the
correlated noise data set is subtracted from the correlated sample data set.
The
resulting data set is the final data set (e.g., a data set representative of
the emission
spectrum of the sample) (block 320).
Since there can be 8600 data points per Hz and the final data set can have
data points for a frequency range of DC-50kHz, the final data set can comprise
several hundred million rows of data. Each row of data can include the
frequency,
amplitude, phase, and a correlation value.
IV. Methods and Applications
This section describes the method of the invention for interrogating detecting
one or more selected materials in liquid or gaseous sample. In practicing the
method, a sample containing a selected material of interest is placed adjacent
a
detector coil, e.g., in one of the detector assemblies noted above. The
detector coil
then converts low-frequency electromagnetic emissions in the material, due at
least
22
CA 02460794 2004-03-17
WO 03/102566 PCT/US03/11834
in part to rotational modes of the material, to an electromagnetic time-domain
signal
composed of sample source radiation.
The signal is conditioned to convert it to an amplified conditioned signal
from
which frequency components above a selected frequency have been removed. The
filtered, conditioned time-domain signal to selectively pass low-frequency
spectral
components that are (i) in a frequency range between do and 50khz, and (ii)
characteristic of the selected material. This is done by retrieving a data set
of
spectral components that are characteristic of that material, and filtering
the
conditioned signal to selectively pass, e.g., with a band width of 0.5 to 1
Hz, one of
more of the frequency components characteristic of the material.
The filtered signal is now cross-correlated with a data set of low-frequency
spectral components that are (i) in a frequency range between do and 50khz,
and
(ii) characteristic of a selected material, to produce a frequency-domain
spectrum in
the frequency range within do to 50khz. From this spectrum, it is determined
whether the frequency-domain spectrum contains one or more low-frequency
signal
components that are characteristic of the selected material, and diagnostic of
the
presence or absence of such material in the sample.
Applications of the method for detecting air, water, food, cosmetic, and
industrial samples are noted above, as are applications in screening luggage
or
airline passengers for harmful or illegal substances.
From the foregoing, it will be appreciated how various objects and features of
the invention are met. The method and apparatus do not require activation of
sample and do not employ x-radiation or other potentially destructive
radiation. The
invention is applicable to a wide range of materials, with the only
requirement that
the material be in any environment that allows molecular rotational movement.
Further, the sample being tested can be' liquid or air, or a person or a
persons'
effects, for screening purposes.
Unless the context clearly requires otherwise, throughout the description and
the claims, the words "comprise," "comprising," and the like are to be
construed in
an inclusive sense as opposed to an exclusive or exhaustive sense; that is to
say, in
the sense of "including, but not limited to." Words using the singular or
plural
number also include the plural or singular number respectively. Additionally,
the
words "herein," "above," "below" and words of similar import, when used in
this
23
CA 02460794 2004-08-16
application, shall refer to this application as a whole and not to any
particular
portions of this application. When the claims use the word "or" in reference
to a list
of two or more items, that word covers all of the following interpretations of
the word:
any of the items in the list, all of the items in the list and any combination
of the
items in the list.
The above detailed descriptions of embodiments of the invention are not
intended to be exhaustive or to limit the invention to the precise form
disclosed
above. While specific embodiments of, and examples for, the invention are
described above for illustrative purposes, various equivalent modifications
are
possible within the scope of the invention, as those skilled in the relevant
art will
recognize. For example, while processes or steps are presented In a given
order,
alternative embodiments may perform routines having steps in a different
order.
While these steps are shown in a particular order, in some embodiments these
steps are re-arranged, and some steps may be deleted, moved, added,
subdivided,
combined, andlor modified. Each of these steps may be implemented in a variety
of
different ways. Also, while these steps are shown as being performed in
series,
these steps may instead be performed in parallel, or may be performed at
different
times.
The teachings of the invention provided herein can be applied to other
systems, not necessarily the system described herein. These and other changes
can be made to the invention in light of the detailed description. The
elements and
acts of the various embodiments described above can be combined to provide
further embodiments.
Aspects of the invention can be modified, if
necessary, to employ the systems, functions and concepts of the various
references
described above to provide yet further embodiments of the invention.
These and other changes can be made to the invention in light of the above
detailed description. In general, the terms used in the following claims
should not
be construed to limit the invention to the specific embodiments disclosed in
the
specification, unless the above detailed description explicitly defines such
terms.
Accordingly, the actual scope of the invention encompasses not only the
disclosed
24
CA 02460794 2004-03-17
WO 03/102566 PCT/US03/11834
embodiments, but all equivalent ways of practicing or implementing the
invention
under the claims.
While certain aspects of the invention are presented below in certain claim
forms, the inventors contemplate the various aspects of the invention in any
number
of claim forms. For example, while only one aspect of the invention is recited
as
embodied as a method, other aspects may likewise be embodied as a method.
Accordingly, the inventors reserve the right to add additional claims after
filing the
application to pursue such additional claim forms for other aspects of the
invention.