Note: Descriptions are shown in the official language in which they were submitted.
CA 02461973 2008-07-22
FIELD OF THE INVENTION
This invention relates generally to fluid sensing, and more particularly to
detecting particles flowing in a fluid within a conduit.
BACKGROUND OF THE INVENTION
The production of particles, such as sand, concerns operators of oil/gas wells
because of the possible catastrophic consequences on production. (In this
disclosure, "sand should be understood as referring to solid particulate
matter as
would be found in an oil/gas well, without particular regard to its size or
diameter).
The production of sand may start at relatively minor levels, but then may
rapidly
increase resulting in clogged well lines that effectively "fill in" the well
and halt
production. Sand can also contaminate the separator tanks, which typically
connect
other producing wells. When this occurs, the production of all oil wells
feeding into
the separator tanks must be halted. Furthermore, once sand has entered into
the
completion equipment, corrosion and/or erosion is likely, resulting in
significant
economic loss.
Operators will thus labor to avoid the production of sand completely, or at
least
attempt to detect sand at minor levels so that evasive action can be taken. By
detecting sand at minor levels the operator may, for example, lower the rate
of
production (which might allow the sand to fall back through the well), reduce
or cease
completely any water injection, or in a multiple well system, shut down the
affected
well completely while allowing the other wells to continue production. In
short, the
onset of sand production is often the limiting factor in maximizing the
production for a
given oil and gas well. Because of the serious consequences associated with
unnoticed sand production as described above, operators apply conservative
production limits, which reduce the maximum production rates. Thus, a large
incentive exists in the industry for methods of detecting sand quickly and
continuously.
A variety of methods currently exist in the oil and gas industry to detect
sand
production. One such method is to physically filter a sample of produced
fluids to
CA 02461973 2008-07-22
check for solid particles. One problem with this method is that by the time
the fluid
has risen to the top of the well, it may be too late as contamination of the
separator
tanks and completion equipment may have already occurred. Furthermore, the
filtering of selected samples will not detect sand continuously but instead
only at
designated time intervals. Therefore, this method is unlikely to detect sand
at the
inception of production when sand may most likely be encountered.
A technique that continuously monitors for sand production senses the
vibrations caused by sand impacting the pipe or conduit in which the sand
flows.
These devices, such as ClampOnTM meter, clamp on to the pipe, typically at an
"elbow" or section of the pipe where the fluid has to take an abrupt turn, and
use
ultrasonic detection methods to listen for the impact vibration of the sand.
However,
these ultrasonic methods typically only provide a qualitative measurement and
are
plagued with the difficulties associated with ultra high frequency coupling
into the
pipe. Furthermore, the device must be located near an elbow, thus would be
unsuitable in the straight or slightly bent piping networks downhole. Although
they
have the benefit of continuous monitoring, they may also detect the presence
of sand
too late as they are practically limited to the surface environment.
Real-time monitoring of sand production would be valuable anywhere in the
production string, but is particularly valuable downhole, i.e., in conjunction
with the
production tube, where sand would initially be produced before flowing to the
surface.
With the emergence of fiber optic sensors, continuous monitoring of fluids in
the
downhole environment is possible. Fiber optic sensors and flowmeters already
monitor parameters such as fluid sound speed, fluid velocity, pressure, and
temperature. Such fiber optic based flowmeters are disclosed in U.S. Patent
6,782,150, entitled "Apparatus for Sensing Fluid in a Pipe," filed November
29, 2000;
U.S. Patent 6,691,584, entitled "Flow Rate Measurements Using Unsteady
Pressures," filed April 3, 2002; and U.S. Patent 6,354,147, entitled "Fluid
Parameter
Measurement in Pipes Using Acoustic Pressures," issued March 12, 2002
[hereinafter referred to as the "flow meter references."]. The ability to
reliably monitor
sand production downhole in real-time, as the above parameters are currently
measured, would allow for more effective management of sand production
problems.
2
CA 02461973 2008-07-22
Furthermore, coupling this capability with the real-time measurement of these
other
parameters results in a powerful fiber optic flowmeter for managing and
optimizing
well productivity.
The art would therefore benefit from a sensor that can be placed at any
location along the production pipe and that can detect sand particles at
minimal
levels, thus allowing the operator to respond in an appropriate and timely
manner to
the production of sand.
SUMMARY OF THE INVENTION
A method for detecting the presence of particles, such as sand, flowing within
a fluid in a conduit is disclosed. At least two optical sensors measure
pressure
variations propagating through the fluid. These pressure variations are caused
by
acoustic noise generated by typical background noises of the well production
environment and from sand particles flowing within the fluid. If the acoustics
are
sufficiently energetic with respect to other disturbances, the signals
provided by the
sensors will form an acoustic ridge on a kw plot, where each data point
represents
the power of the acoustic wave corresponding to that particular wave number
and
temporal frequency. A sand metric then compares the average power of the data
points forming the acoustic ridge to the average power of the data points
falling
outside of the acoustic ridge. The result of this comparison allows one to
determine
whether particles are present within the fluid. Furthermore, the present
invention can
also determine whether the generated acoustic noise is occurring upstream or
downstream of the sensors, thus giving an indication of the location of the
particles in
the fluid relative to the sensors.
BRIEF DESCRIPTION OF THE DRAWINGS
The foregoing and other features and aspects of the present disclosure will be
best understood with reference to the following detailed description of
embodiments
of the invention, when read in conjunction with the accompanying drawings,
wherein:
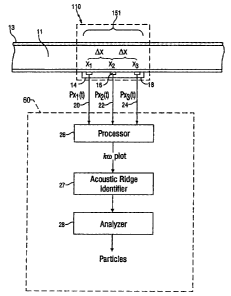
Figure 1 illustrates a system for detecting the presence of particles in a
fluid,
according to the present invention.
3
CA 02461973 2008-07-22
Figure 2 illustrates a kw plot with an acoustic ridge occurring above and
below
the meter, according to the present invention.
Figure 3 illustrates a graph of power versus velocity with a peak
corresponding
to the fluid sound speed, according to the present invention.
Figure 4 illustrates kw plots suspected of indicating the presence of sand
falling through a well whose production has been halted.
DETAILED DESCRIPTION OF EMBODIMENTS OF THE INVENTION
In the disclosure that follows, in the interest of clarity, not all features
of actual
implementations are described in this disclosure. It will of course be
appreciated that
in the development or any such actual implementation, as in any such project,
numerous engineering and design decisions must be made to achieve the
developers' specific goals, e.g., compliance with mechanical and business
related
constraints, which will vary from one implementation to another. While
attention must
necessarily be paid to proper engineering and design practices for the
environment in
question, it should be appreciated that the development of a method to detect
particles, such as sand, flowing within a conduit would nevertheless be a
routine
undertaking for those of skill in the art given the details provided by this
disclosure,
even if such development efforts are complex and time-consuming.
The present invention preferably uses a phased spatial array of optical
sensors with Bragg gratings that measure acoustic pressure waves caused by
sand
particles propagating through the fluid. The sensors may measure the acoustic
pressure waves by techniques disclosed in U.S. Patent Number 6,354,147
entitled,
"Fluid Parameter Measurement In Pipes Using Acoustic Pressures," or by sonar
processing techniques disclosed in U.S. Patent Number 6,587,798 entitled,
"Method
And System For Determining The Speed Of Sound In A Fluid Within A Conduit,"
filed
November 28, 2001. Furthermore, the optical sensors may comprise the acoustic
sensing arrays found in the "flow meter references" listed above. By analyzing
the
power of the signals provided by the optical sensors through the use of a
"sand
4
CA 02461973 2008-07-22
metric," the present invention enables one to determine the presence of
particles,
such as sand, within the fluid.
Acoustic "background" noise is present within the fluid flowing within the
production pipe. Such acoustics arise from a variety of sources, and can be
useful in
the detection of parameters of the fluid. For example, as disclosed in the
"flow meter
references," the naturally occurring pressure perturbations in the flowing
fluid or fluid
mixture can be used to determine, for example, the speed of sound, velocity,
and
other parameters of the fluid as previously mentioned. However, it has also
been
found that particles flowing within a fluid generate sufficient acoustic noise
detectable
over these other, more normal noises occurring within the fluid. Therefore, by
analyzing the power of the acoustic signals, as will be discussed in more
detail
below, and by comparing that power with the power generated by other
background
noises, the presence of particles may be detected. A variety of interactions
between
the sand particles in a fluid cause this detectable acoustic noise, which
occurs
generally within the range of 100 Hz to 6,000 Hz, and more specifically,
within the
range of 200 Hz to 800 Hz. Mechanisms causing particle acoustic noise may
include: (1) noise generated from the increased turbulence resulting from the
fluid
flowing over the multitude of particles, and (2) impact and scraping of the
particles
along the walls of the conduit.
Referring now to Figure 1, a system according to the present invention for
detecting
particles in a fluid 11 flowing within a conduit 13 is shown. An array of
pressure
sensors 14, 16, 18 provide signals 20, 22, 24 indicative of the fluid pressure
at each
sensor location at a number of successive instants of time. (More sensors, or
two
sensors, could also be used). The array of sensors 14, 16, 18 measure the
unsteady
pressure disturbances within the fluid 11 caused by sand and other phenomenon
propagating with or within the fluid. The sensors 14, 16, 18 may comprise
fiber optic
sensors and may further comprise any number of sensors equal to two or
greater.
The fiber optic sensors may coil around the conduit 13 in a series of wraps.
As is
disclosed in the "flow meter references," each wrap may be separated by a
single
Bragg grating for time division multiplexing (TDM) or each wrap may be
separated by
a pair of Bragg gratings for wavelength division multiplexing (WDM). However,
other
5
CA 02461973 2008-07-22
types of pressure sensors, such as electrical or mechanical sensors, could be
used
with the present disclosure, again as disclosed in the "flow meter
references."
As noted, the sensors 14, 16, 18 produce time varying pressure (Pxl(t))
signals indicative of the pressure of the acoustic disturbance detected at
each of the
sensors, in effect rendering information about pressure as a function of both
location
(x) and time (t), i.e., P(x,t). In a preferred embodiment useful in the
detection of sand,
these pressure signals are converted at processor 26 using well-known
techniques
into a kw plot, where k is wavenumber (21r/A), and w is the angular frequency
(2 zf). This conversion is affected at the processor 26 and preferably
involves the
use of well-known Fourier Transform algorithms. However, other
spatial/temporal
conversions (e.g., the generation of an xw plot, a kt plot, etc.) are also
possible and
useful with the disclosed technique, and "kw plot" should be understood as
including
these other types of spatial/temporal conversions. Because two variables (x
and t)
are transformed into two different variables (w and k), a two-dimensional
transform is
utilized as one skilled in the art will understand. The well-known CAPON
method, the
MUSIC method, deterministic maximum likelihood methods, the minimum variance
distortionless response method (MVDR) or MVDR beamformer methods, or other
beamforming methods, are all preferred two-dimensional transforms useful in
the
present disclosure. The details of this conversion, the physics of wave
propagation
inside a pipe containing a fluid, and other considerations relevant to this
technique,
are disclosed in U.S. Patent 6,587,798, and are not repeated here for
simplicity.
Figure 2 shows an exemplary kw plot to be analyzed pursuant to the disclosed
technique. The vertical axis of the plot is the temporal or angular frequency
(w) of
the signal in rad/s and the horizontal axis is the spatial frequency or wave
number (k)
(e.g., in 1/ft). Each point (i.e., frequency) in the plot has associated with
it a power
level (in dB), as denoted by regions 100a-100d. In this regard, and in the
computerized environment in which the kw plot is generated, it should be
understood
that the kw plot constitutes a data set in which each pixel comprises a
particular
power value, and not necessarily a visual plot.
Several different determinations about system acoustics can be made using
6
CA 02461973 2008-07-22
the kw plot. First, it should be noticed that the accumulation of all of the
acoustic
events represented in the plot lie generally along straight lines, referred to
as a
"ridge" 430. This reflects the fact that all of the detected various acoustic
events,
each having its own unique frequency constitutions, travel through the fluid
at
approximately the same speed through the fluid, i.e., the fluid speed of
sound. This
fluid speed of sound, c, can therefore be calculated by computing a best fit
line(s)
410, 420 within the ridge(s), and determining that line's slope, where w = ck.
(Dispersion, whereby the speed of sound in the fluid changes as a function of
the
frequency being transmitted, would cause this slope to deviate from linear,
but
significant dispersion should not occur with the frequencies of interest in a
traditional
oil/gas multiphase flow measurement, which ranges from approximately 10 Hz to
approximately 2000 Hz). In short, the speed of sound in the fluid, c, can be
calculated by using a kw plot, which can be useful in determining important
parameters concerning the fluid being measured, such as its density or its
phase
fractions, as is noted in US Patent 6,354,147. (As noted in that patent and in
US
Patent 6,587,798, pipe compliancy may need to be corrected for to determine
the
speed of sound in the fluid in an unbounded media, which might be a more
useful
parameter for certain applications). In an actual kw plot, a vertical ridge
will also be
apparent, but this is an artifact of various system noise and is not
significant to
determining the presence of sand or other system parameters. Hence, this
vertical
ridge is not shown in either Figure 2 or Figure 4 for clarity.
Second, and as shown in Figure 2, the power of the various acoustic
phenomena that are represented in the kw plot can be determined. Accordingly,
regions 100a - 100d represent areas of differing power levels, in which region
100d
represents the highest power levels (e.g., 20 db), region 100c represents
lower
power levels (e.g., 10 db), etc. As one skilled in the art will understand,
these power
regions may be more uneven or blotchy in shape, and Figure 2 shows only an
idealized representation of the reflected power levels. As described below, an
assessment of the power levels within a certain frequency range on the kw plot
assists in determining the presence of sand.
Third, the kw plot allows for directionality of the acoustical disturbances to
be
7
CA 02461973 2008-07-22
determined. Referring to Figure 1, the measured acoustics can arrive at the
sensor
array 110 as either left traveling-waves or right traveling waves,
corresponding to
energy on the left side or the right side of the kw plot. Because the speed of
the fluid
flowing within the pipe is usually much smaller than the speed of sound in the
fluid,
these left-traveling or right-traveling acoustic disturbances will approach
the array
110 at approximately the same speed (assuming that the Mach number of the flow
is
<<1). Left-traveling disturbances will correspond to negative k values, while
right-
traveling disturbances correspond to positive k values. Thus, assuming that
acoustics are being generated from both the left and the right of the array
110, as
they would in when the fluid is flowing and acoustical disturbances are being
created
by sand and other natural phenomena in the fluid, the kw plot will exhibit two
ridges
430, one along line 410, which is indicative of left traveling acoustics, and
another
along line 420, which is indicative of right-traveling acoustics. Because the
left-
traveling and right-traveling waves arrive at approximately the same speed as
mentioned above, the absolute value of the slopes of both lines 410, and 420
will be
approximately equal, and both indicative of the speed of sound in the fluid.
The ridges 430 in the kw plot are assessed in the system by a computerized
ridge identifier 27, as shown in Fig. 1, which can identify the ridges 430
using many
known computerized techniques for assessing plots or plot data files. For
example,
the ridge identifier 27 can be preprogrammed with a power level threshold, in
which
pixels in the plot having values exceeding this threshold are deemed to
constitute a
portion of the ridge 430. Once the area of the plot containing the ridge 430
has been
identified, its slope (i.e., lines 410 and 420) can be determined by analyzer
28, which
preferably employs a weighted least squares fitting algorithms or other
fitting
algorithm well known in the art.
Referring still to Figure 1, care should be taken to position the sensors 14,
16,
18 with suitable spacing (preferably, equally spaced by AX) for the
application at
hand to detect acoustical frequencies of interest. Of course, any particular
acoustical
phenomenon, such as those caused by sand, will comprise a plurality of
frequency
components. If a single frequency component is considered, the disclosed
system
obtains information about the wavelength A (or the wavenumber k) of that
frequency
8
CA 02461973 2008-07-22
component essentially by sensing the phase of that component at (at least) any
two
of the sensors 14, 16, 18. Thus, the separation AX can be determined to be a
particular fraction of a wavelength of the sound to be measured. The
information is
only not ambiguous, however, if the sensors sample frequently enough to avoid
temporal aliasing, and are close enough to avoid spatial aliasing. For
example, if the
sensors are a distance AX apart that is two wavelengths of the frequency
component
being measured, the system may incorrectly indicate a value for the wavelength
that
is twice the actual value. Taking these practical limitations into account, it
is
preferred that the sensor 14, 16, and 18 be spaced at a distance AX of
approximately
eighteen inches apart, center to center, such as disclosed in US Patent
6,782,150.
Should it be necessary to resolve frequencies over a larger range than a
single
spacing distance would permit, additional sensors spaced at appropriate
intervals
could be added.
Sand creates acoustic phenomenon in the fluid which as noted travels at the
speed of sound in the fluid, as do the other phenomena that are present or
naturally
occurring in the fluid. Accordingly, the acoustic phenomenon produced by the
sand
will lie along the same ridge 430 to which these other phenomena contribute.
However, the presence of sand adds additional power to the acoustics in the
fluid,
and evidence suggests that it adds that power within a certain frequency
range, e.g.,
between 200 to 800 Hz. Accordingly, by assessing either or both of these
effects, the
presence of sand can be inferred. Moreover, and as facilitated by the use of
fiber
optic based flow meters, such detection can be performed continuously directly
at the
production pipe before sand reaches the top of the well.
As just noted, the presence of sand will add extra acoustic energy to the
fluid
flowing inside the pipe. Quantification of this energy, in one embodiment of
the
present invention, is performed by computation at analyzer 28 of a "sand
metric" M
that can be used to detect the presence of sand or to quantify the amount of
sand
present. In one embodiment, the sand metric computes the ratio of the average
acoustical power along the ridge, Pacoustics, divided by the average
acoustical power of
some range outside of the ridge, Pnon_acoust;cs. To normalize this embodiment
of the
sand metric, this ratio is subtracted by one so that the metric equals zero
when no
9
CA 02461973 2008-07-22
ridge is present, and is greater than zero when a ridge is present, i.e.:
M = Pacoustics _ 1
Pnon-acoustics
As one skilled in the art will realize, there are various ways by which the
analyzer 28 can compute the power values to be used in the sand metric, and
either
average power values or summed power values may be used. In one embodiment,
and referring again to Figure 2, a straight line 500 passing through the
origin at k=0
can be swept through a range of sound speeds (i.e., slopes) and the power of
the
various pixels in the kw plot can be summed (or averaged) along that line 500.
When computing these summed or averaged powers, it is preferable to limit the
analysis to frequencies where the acoustics generated from sand are likely to
be
found, such as from 200 Hz to 800 Hz, but may include other frequencies as
well.
Frequencies above and below this threshold range are preferably discounted.
Figure 3 shows the results of this analysis for a sound speed range of 2,000
to
10,000 ft/sec. As expected, this graphs yields a power maximum 570
corresponding
to the speed of sound in the fluid being analyzed for sand content, i.e.,
along line 420
of Fig. 2. (A similar analysis can be performed along line 410 as well). With
this
maximum located, the analyzer 28 can use various criteria to determine which
speeds of sound correspond to the ridge (i.e., Pacoustics) and which fall
outside that
range (i.e., Pnon-acoustics)- For example, the maximum and minimum speeds of
sound
corresponding to power within the ridge, 520 and 510, may be defined as the
full-
width-half-maximum (FWHM) of the maximum 570, and may be defined according to
set power levels (e.g., 30% of the maximum), or may be defined as a set range
around the maximum. Likewise, the ranges 535 and 555 corresponding to the
regions outside of the ridge may be defined by limits 540 and 550 which are
similarly
related to the maximum, or which correspond to minimum power values, etc.
After
these limits are set, the values Pacoustics and Pnon-acoustics can be
calculated by
summing or averaging the power values within these defined range. Of course,
one
skilled in the art will recognize that calculation of these power values for
the sand
metric can be calculated in any number of ways.
CA 02461973 2008-07-22
Once Pacoustic and Pnon_acoust;c and the sand metric M are calculated, the
metric
can be correlated to the presence of sand in any number of ways. In this
regard, it is
useful to remember that phenomena other than sand can contribute to the energy
present at the ridge on the kw plot. Therefore, experimentation with or
calibration of
the pipe system being monitored may be necessary to understand when the sand
metric is indicating the presence or quantity of sand. For example, suppose
that an
array deployed in operation consistently yields a sand metric of 10. If this
value is
seen to increase to a value of 12, and if detection of other parameters in the
system
cannot explain the increase acoustic energy, it may be inferred or at least
contemplated that sand is being produced. Further verification of the presence
of
sand can then be performed, including techniques again employing the use of a
kw
plot as will be explained shortly. Correlation of the sand metric with other
known
sand detection techniques can also help to verify that the increase in the
sand metric
in fact correlates to sand production. For example, the flow meter before
deployment
can be calibrated using test equipment, such as a flow loop, and sand metric
values
can be calculated when the system is sand-filled or sand-free. Correlating the
sand
contents of sampled production fluids with the sand metric can further assist
in
determining normal values or ranges for the sand metric which would correlate
to the
production of sand. Other equations may be used to provide a sand metric that
compares the ridge power to non-ridge based power, and the equation listed
above
should only be understood as exemplary.
It has proven difficult to test the utility of the disclosed apparatus and
method
to detect sand in a test flow loop, as the noise involved in a flow loop test
apparatus
has been seen to overwhelm the acoustics of sand introduced into the loop.
However, data suggestive of the utility of the disclosed embodiments to detect
sand
is evidenced by an experiment which was performed on an actual working test
well.
In this test, a fiber optic based flow meter such as that incorporated herein
was
placed onto a production tube and lowered approximately 22,000 feet into a
well
suspected of producing sand. The well was activated to pump produced fluids to
the
surface. Production was then stopped, but the flow meter continued operation
to
monitor the acoustics within the production pipe.
11
CA 02461973 2008-07-22
Figure 4 illustrates the kw plots that were acquired at various times after
production was halted. (The kw plots in Figure 4, while indicative of actual
data, are
only exemplary, and have been simplified for illustration purposes). At the
first test
point 1 (time = 0), no measurable acoustics were seen. Thereafter, at test
point 2
(time 22 minutes later), a ridge appeared only on the right side of plot,
which
indicates that acoustics were being generated from some source above but not
below
the flow meter. The "top based" acoustics were seen to increase in power at
test
point 3 (time = 31 minutes). At test point 4 (time = 39 minutes), the
acoustics were
seen both above and below the flow meter. At test point 5 (time 43 minutes),
the
acoustics moved solely below the meter, and at test point 6 (time = 61
minutes) the
power of these "bottom based acoustics dropped off to lower levels. At test
point 7
(time = 78 minutes), no appreciable acoustics were recorded.
It is theorized that the results seen in Figure 4 are indicative of the
presence of
sand. Specifically, it is believed that a slug of sand was produced and was
present
near the top of the well after production was halted. Initially, the acoustics
generated
by this produced sand were not seen (test point 1) because they were too
remotely
located from the meter, and hence the sound generated by the sand was too
attenuated by the time it reached the meter. However, as the sand fell back
into the
well due to gravity, it eventually approached the meter (test point 2), and
the
acoustical power generated by this sand increased as the sand came closer to
the
flow meter (test point 3). At test point 4, it is theorized that the falling
sand had
approached the meter, and to some extent exceeded past the meter as acoustics
were now seen both above and below the flow meter. As the sand continued to
fall
past the meter, the power was seen only below the meter (test point 5), with
decreasing power levels (test point 6), until the sand became too far away
from the
meter for its acoustics to be resolvable (test point 7).
It is hypothesized that the settling of produced sand could be the only cause
of
these results. Accordingly, the disclosed technique offers additional
advantages for
the detection of sand. If produced sand is suspected or detected while the
well is
producing, either using the disclosed sand metric or by other techniques,
production
can be temporarily halted to see if sand falls past the meter, i.e., if "top
based"
12
CA 02461973 2008-07-22
acoustics are seen followed by "bottom based" acoustics. Alternatively or in
addition,
the "top based" acoustics could be assessed to see if they increase in power
over
time, or the "bottom based" acoustics could be asses to see if they decrease
in power
over time. Although this constitutes an undesirable brief interruption in
production,
the interruption is only temporary, and would be worth the delay if the
presence of
sand can be verified, which might allow production to be varied to reduce the
possibility of the continued production of sand. In short, the disclosed
apparatus and
techniques for detecting the presence of sand has utility both when the well
is
operational and fluid is flowing, and when production has been halted. If
multiple
meters are arrayed (e.g., multiplexed in series) along the production pipe,
this
method of determining the presence of sand can be redundantly verified, as the
operator can listen for sand falling past the first meter, then the second
meter, and so
on.
The above-referenced test relies on the force of gravity to pull sand downward
into the well, wherein the falling sand creates acoustic disturbances that are
detectable by the flow meter. Accordingly, the detection technique that this
test
illustrates will perform best on wells or conduits that are vertical, although
this is not
strictly necessary.
"Directionally detecting" the acoustic disturbances in the fluid that are
caused
by sand should be understood as not merely determining the mere presence of
acoustic disturbances. Instead, this phrase should be understood as meaning
not
only that acoustic are detected, but that their source is understood with
relation to the
flow meter that detects the disturbances, i.e., as either above or below the
meter. As
noted herein, the ability of the disclosed apparatus and methods to employ
directional detection of acoustic phenomenon allows added flexibility over
prior art
approaches to fluid acoustic detection that merely detects acoustics without
knowledge of its source.
Furthermore, kw based processing applies temporal and spatial filtering
techniques to increase the effective signal-to-noise ratio of sand generated
acoustics,
i.e., the disclosed method only considers the increase of acoustics
propagating at the
13
CA 02461973 2008-07-22
speed of sound of the fluid over a specific frequency range. Other signals
with the
sensor output such as electrical noise, vortical noise, impact noise
propagating within
the production tubing, are all effectively filtered out by the disclosed
method.
It is contemplated that various substitutions, alterations, and/or
modifications,
including but not limited to those design alternatives which might have been
specifically noted in the disclosure, may be made to the disclosed embodiment
without departing from the spirit and scope of the invention as defined in the
appended claims. For example, while particularly useful in detecting sand
within a
production pipe of an oil/gas well, the disclosed apparatus and method will
have
utility with respect to the detection of particulates in any pipe and in other
industrial
environments.
14