Note: Descriptions are shown in the official language in which they were submitted.
CA 02466079 2004-05-03
WO 2003/044668 PCT/US2002/036995
TITLE OF THE INVENTION
[0001] SYSTEM AND METHOD FOR IMPROVING SUPPORT FOR INFORMATION
TECHNOLOGY THROUGH COLLECTING, DIAGNOSING AND REPORTING
CONFIGURATION, METRIC, AND EVENT INFORMATION
CROSS-REFERENCE TO RELATED APPLICATIONS
[0002] This application claims the benefit of U.S. provisional patent
application number
60/332,761 filed on November 16, 2001, the disclosure of which is expressly
incorporated
herein in its entirety by reference.
STATEMENT REGARDING FEDERALLY SPONSORED RESEARCH
[0003] Not Applicable
REFERENCE TO MICROFICHE APPENDIX
[0004] Not Applicable
FIELD OF THE INVENTION
[0005] The present invention generally relates to systems and methods for
identifying and
mitigating problems related to computer system, software, hardware,
application or device
configuration issues that cause downtime.
BACKGROUND OF THE INVENTION
[0006] Independent solution providers provide complex solutions for problems
of
information technology users in all types of information technology
infrastructures. For
example, one type of information technology infrastructure is storage
environments. An
independent complex storage solution provider can provide enterprise data
availability
solutions including:(1) Disaster Recovery (backup and recovery and/or
replication); Online
storage (Storage Area Networking [SAN] and Network Attached Storage [NAS]);
Application Availability via Clustering Technologies; and Storage Management
Software.
The solution providers typically develop solutions that encompass technology
from several
to many different vendors on many different open system platforms such as, for
example,
Windows NT/2000, Solaris, HP-UX, AIX, Linux, Tru64, and Novell. Once a
customer is
CA 02466079 2004-05-03
WO 2003/044668 PCT/US2002/036995
provided with a working solution, it is common to receive a complaint months
later that the
solution is no longer working. The largest problem is that in a complex
solution with many
components supported by many different vendors it is easy to start the finger
pointing game.
Without a complete picture, it is easy for one vendor to point to another
vendor and blame
the problem on its technology. To determine why the solution is no longer
working, the
first question is "What changed?" Finding the answer to this question is often
not as easy as
it would seem. Typical responses are: customer did not change anything;
customer not sure
what changed because there are many people administering the system; customer
does not
want to admit that anything changed; customer made many changes since the
solution was
deployed; customer is unaware that a vendor support person replaced a piece of
failed
hardware with hardware that does not match the firmware that the solution
supports; and
user has done nothing, a new patch has been released but it was not added
because it causes
other problems to arise (new features, bug fixes, etc.).
[0007] It is clear that getting the right answers in a timely and efficient
manner is critical
to isolating problems in a complex solution. A key element in the discussion
is whether the
problem is software or hardware related. Information technology is not an
evolving species.
Software does not change itself (it generally is not intelligent enough to do
so). Typically,
problems are caused by (1) hardware failure; (2) operator error which changes
the
environment of the software; an/or (3) application failure which changes the
environment of
the software. Operator errors which can change the environment of software
include, for
example, deleting a file, forgetting to reboot for a particular change to take
effect,
introducing a virus, typos, and adding a patch without testing. Application
failures which
can change the environment of software include, for example, configuration
errors, external
event failures, and application bugs. Examples of environmental issues which
can cause
downtime are: an operating system patch was added to fix another problem and
in fact
caused the application software to not work properly; malformed configuration
file; bad
hardware; hardware was replaced with wrong firmware level; security settings
were
changed incorrectly; a disk is at 100% capacity; a dependent process is not
running
correctly, and a required application file is missing or corrupt.
2
CA 02466079 2004-05-03
WO 2003/044668 PCT/US2002/036995
[0008] Information technology watchdogs indicate that 20% of downtime is
caused by
technology failure, 40% of downtime is caused by operator error, and 40% of
downtime is
caused by application error. Once downtime is in progress, there are two main
components
to resolving the problem. Eighty percent of the downtime is spent identifying
the problem
while the remaining twenty percent of the downtime is spent resolving the
identified
problem. Accordingly, there is a need to reduce the causes of downtime and/or
the amount
of time it takes to identify the cause of downtime in a reactive
administrative model.
SUMMARY OF THE INVENTION
[0009] The present invention provides a system and method which overcomes at
least
some of the above-noted problems of the related art. According to one
embodiment of the
present invention, a system for diagnosing an information technology
environment
comprises, in combination, a collector server which stores configuration and
event
information gathered from the information technology environment and formats
the
information into formatted data and a data warehouse in communication with the
collector
server and housing formatted data imported from the collection server. A
portal server is in
communication with the collector server and the data warehouse and has an
interface from
which the formatted data in the data warehouse can be viewed.
[0010] According to another embodiment of the present invention, a system for
diagnosing an information technology environment comprises, in combination, a
collector
server which stores information gathered from the information technology
environment and
formats the information into formatted data and a data warehouse in
communication with
the collector server and housing formatted data imported from the collection
server. The
collector server is located at a user site while the data warehouse and portal
server are
located at a provider site remote from the user site. A portal server is in
communication
with the collector server and the data warehouse and has an interface from
which the
formatted data in the data warehouse can be viewed.
[0011] According to another embodiment of the present invention, a system for
diagnosing an information technology environment comprises, in combination, a
collector
server which stores information gathered from the information technology
environment and
CA 02466079 2004-05-03
WO 2003/044668 PCT/US2002/036995
formats the information into formatted data and a data warehouse in
communication with
the collector server and housing formatted data imported from the collection
server. The
collector server, the data warehouse, and the portal server are located at a
user site. A portal
server is in communication with the collector server and the data warehouse
and has an
interface from which the formatted data in the data warehouse can be viewed.
[0012] From the foregoing disclosure and the following more detailed
description of
various preferred embodiments it will be apparent to those skilled in the art
that the present
invention provides a significant advance in the technology and art systems and
methods of
identifying and mitigating information technology problems. Particularly
significant in this
regard is the potential the invention affords for providing a highly secure,
high quality,
reliable system and method. Additional features and advantages of various
preferred
embodiments will be better understood in view of the detailed description
provided below.
BRIEF DESCRIPTION OF THE DRAWINGS
[0013] These and further features of the present invention will be apparent
with reference
to the following description and drawings, wherein:
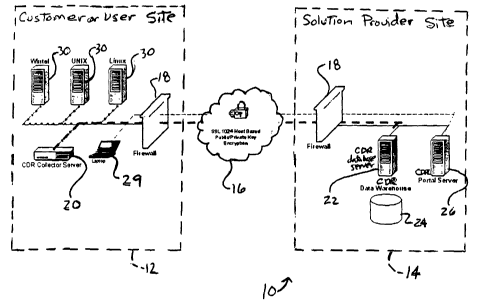
FIG. 1 is a diagrammatic view of a CDR system according to a first embodiment
of
the present invention;
FIG. 2 is a diagrammatic view of a CDR module of the system of FIG. l;
FIG. 3 is diagrammatic view of output of a file fingerprinting method;
FIG. 4 is a block diagram of a CDR method according to the present invention;
and
FIG. 5 is a diagrammatic view of a CDR system according to a second embodiment
of the present invention.
[0014] It should be understood that the appended drawings are not necessarily
to scale,
presenting a somewhat simplified representation of various preferred features
illustrative of
the basic principles of the invention. The specific design features of the
information
technology system as disclosed herein will be determined in part by the
particular intended
application and use environment.
DETAILED DESCRIPTION OF CERTAIN PREFERRED EMBODIMENTS
4
CA 02466079 2004-05-03
WO 2003/044668 PCT/US2002/036995
[0015] It will be apparent to those skilled in the art, that is, to those who
have knowledge
or experience in this area of technology, that many uses and design variations
are possible
for the improved information technology system and method disclosed herein.
The
following detailed discussion of various alternative and preferred embodiments
will
illustrate the general principles of the invention with reference to a complex
storage solution
provider (but could be applied to any complex heterogeneous support scenario).
Other
embodiments suitable for other applications will be apparent to those skilled
in the art given
the benefit of this disclosure.
[0016] Refernng now to the drawings, FIG. 1 shows a system 10 for Collecting,
Diagnosing and Reporting (CDR) information about an information technology
network or
environment according to a preferred embodiment of the present invention. The
CDR or
diagnosing system 10 assists in identifying and mitigating problems related to
software,
hardware, application, or device configuration issues that cause downtime. The
illustrated
CDR system 10 includes components at a user or customer site and components at
a
solution provider site 14 which is remote from the customer site 12. While the
illustrated
CDR system 10 includes a single customer site 12, it is noted that a plurality
of customer
sites 12 can be utilized within the scope of the present invention. Networks
at the illustrated
sites 12, 14 are in communication via the Internet 16. It is noted, however,
that other
suitable communication connections can be utilized such as for example, an
intranet or dial
up connection. Each of the networks is preferably provided with a suitable
firewall 18. The
illustrated CDR system 10 includes at least one CDR collector server 20, a CDR
database
server 22 with a CDR database or data warehouse 24, a CDR portal server 26, at
least one
CDR module 28 (FIG. 2), and a computer or other suitable device 29, such as
the illustrated
laptop, for providing the user access to the system 10.
[0017] The CDR collector server 20 is provided at the customer site 12. While
the
illustrated CDR system 10 includes a single CDR collector server 20 provided
at a single
customer site 12, it is noted that there can be one or more customer sites 12
and thus more
CDR collector servers 20. Preferably, there is a separate CDR collector server
20 at each
customer site 12. The CDR collector server 20 is preferably an Intel-based
system running
a hardened version of the Linux operating system tailored for each unique
customer. It is
CA 02466079 2004-05-03
WO 2003/044668 PCT/US2002/036995
noted that the CDR collector server 20 can alternatively be based on any
suitable processor
and/or can alternatively run any suitable operating system. The CDR collector
server 20
stores information gathered from the customer network, such as customer
servers 30, as
described in more detail hereinafter, regardless of which collection method is
utilized. The
CDR collector server 20 also preferably performs other functions or processes.
In an auto
upload process, all collected files or data are compressed and securely
transmitted to the
data warehouse 24 over the Internet 16. In an auto update process, the CDR
collector server
20 securely connects to the CDR portal server 26 or CDR database server 22
over the
Internet 16 to download new versions of the CDR module 28 or portions thereof,
files or
data, or server system settings. An auto health process preferably runs the
CDR process on
the CDR collection server 20 to better support the CDR collection serve 20. An
auto clean-
up process preferably cleans up old files on the CDR collection server 20 to
prevent
excessive storage and prevent things such as a full disk. With the auto clean-
up process, the
customer or user does not have to administer the CDR collection server 20.
Preferably, the
CDR collector server 20 is setup by the solutions provider with suitable
security elements,
such as public and private key based security, prior to shipment and
installation at the
customer site 12 in order to keep a highly secure mechanism for data
transmission from the
customer site 12 to the solution provider site 14. Configuring the security
elements prior to
shipment ensures that data will not be compromised with key exchanges via the
Internet
(which prevents the so called "man in the middle attack"). The CDR collector
server 20 is
preferably adapted to initiate all connections with components outside the
customer site 12,
that is outside the firewall 18. Thus, components at the provider site 14 or
else where
cannot initiate a connection with the CDR collector server 20.
[0018] The illustrated CDR database server 22 is located at the solution
provider site 14.
It is noted, however, that alternatively the CDR database server 22 can be
located at the
customer site 12 as described in more detail hereinafter. The CDR database
server 22 can
be based on any suitable processor and can run any suitable operating system.
The CDR
database server 22 imports data from the CDR collector servers) 20 and
preferably houses
the data in relational database format and stores the data in the data
warehouse 24. It is
noted that the data can alternatively be housed and/or stored in other
suitable formats if
6
CA 02466079 2004-05-03
WO 2003/044668 PCT/US2002/036995
desired. Additionally, the CDR database server 22 can provide updates to the
CDR
collector server 20 whenever the CDR collector server 20 requests and update.
[0019] The term "portal" means a front-end interface or web interface which
provides a
communication channel, preferably a secure communication channel. The
illustrated CDR
portal server 26 is located at the solution provider site 14. It is noted,
however, that
alternatively the CDR portal server 26 can be located at the customer site 12
as discussed in
more detail hereinafter or both sites. The CDR portal server 26 can be based
on any
suitable processor and can run any suitable operating system. The CDR portal
server 26
provides a front-end interface to the data in the CDR database 24 utilizing a
web browser
interface, provides intelligence to the data, and provides updates to the CDR
collector server
20 whenever the CDR collector server 20 requests an update.
[0020] As best shown in FIG. 2, the CDR module 28 is software made up of three
elements: one or more collectors 32, an importer 34, and an analyzer 36. The
collectors,
which include one or more tools, are executable code which runs on the servers
30 and
devices of the customer's system and gathers system, software, application,
and device
configuration, metric, and event information. This executable code gathers the
configuration, metric and event information but preferably does not format the
data. Output
from the collectors 32 is a snapshot or blueprint. The snapshot is a point-in-
time view of
the system, software, application and device configuration and event
information. The
collectors) 32 can be run at any time with limited overhead on the customer's
system or
device. A best practices approach is to execute the collector 32 just prior to
making a
change to the system and right after making the change to the system. Another
approach is
to automatically execute the collector 32 at regular intervals of time such
as, for example,
once every hour, once every twelve hours, once every twenty-four hours, once
every seven
days, or once every thirty days. The more frequently the collector 32 is
executed, the more
likely changes are going to be easily identified which give the user a better
handle on the
availability of its systems and/or devices. The importer 34 formats the data
once the data
has been transmitted to the CDR database server 22 (or the onsite data
warehouse 24). The
importer preferably cleans or formats the data and inserts the data into
appropriate areas of
appropriate databases so that the data can be viewed and manipulated by the
web browser
7
CA 02466079 2004-05-03
WO 2003/044668 PCT/US2002/036995
interface or application of the CDR portal server 26. Additionally, the
intelligence of the
importer provides the ability for proactive and reactive triggers. The
analyzer 36 is the
intelligence of the CDR system 10 and includes the web browser interface of
the CDR
portal server 26 and the intelligence behind it.
[0021] The CDR modules 28 are preferably written for every operating system,
application and device/appliance connected to the customer's network. The CDR
modules
28 can include collectors 32 customized for operating systems such as, for
example, Solaris,
Windows NT, Windows 2000, AIX, HP-UX, Linux, etc. The CDR modules 28 can
include
collectors 32 customized for applications such as, for example, VERITAS
NetBackup,
Oracle 9i RAC, PeopleSoft, custom applications, etc. The CDR modules 28 can
include
collectors 32 customized for devices/appliances such as, for example, Cisco
routers/switches, firewalls, Brocade/McData fibre channel switches, tape
library, NetApp
Filer, Hitachi Lightning 99x0, EMC Symmetrix, etc.
[0022] The snapshot is an any-point-in-time collection of information for a
server 30
regardless of collector type. For example, server "A" could have a collector
for Solaris run
at 4:00 am on 10/10/2002 and run again at 10:45 am on 10/10/2002. This would
provide
two independent snapshots of server "A" for 10/10/2002.
[0023] Preferably, a snapshot is run once per day as documentation of that
server 30 for
that particular point in time. Of course, there are other benefits of having
multiple
snapshots of a single server 30 per day. For example, a snap shot can be run
just prior to the
installation of a piece of software or patch and one just after the update has
been added.
These two snapshots could then be compared to one another and allow the
administrator to
understand exactly what occurs if that particular piece of software is added
to the
customer's system.
[0024] The most beneficial use of the snapshot is targeted at decreasing
downtime of the
customer's system. With this approach, multiple snapshots of the system are
taken on a
regular basis. If at any point in time the system is not working or performing
correctly, the
administrator can compare the configuration between two snapshots, namely the
point-in-
CA 02466079 2004-05-03
WO 2003/044668 PCT/US2002/036995
time "X" when the system was functioning properly and the point-in-time "Y"
when the
system is behaving incorrectly. This comparison can identify very rapidly what
has
changed between those two points-in-time. Preferably, the user can identify
and store a
"gold image" or "master" snapshot. The gold image or master snapshot is a
snapshot
earmarked by an administrator as a known good system/device configuration, or
any other
snapshot which the administrator identifies as the gold image snapshot, to
compare all
future snapshots against. Preferably, there can only be one gold image
snapshot per system
or device at any one time. The gold image snapshot is never deleted unless a
new snapshot
is identified by the administrator as the "gold image" snapshot.
[0025] The collectors 32 can gather any information that can be obtained from
the
hardware and software, that is, the operating system, the applications, and
the
devices/appliances. The collectors 32 can be shell scripts, interpreted
programs, compiled
code, or anything else that can be run on the platform. The collected
information preferably
includes any and all information used to successfully document and fully
support the end
element (whether it is a system, operating system, application, or
device/appliance). A
preferred feature of the CDR system 10 is the ability to add any new commands,
files for
collection, and/or directories for collection which can happen dynamically on-
the-fly.
[0026] For example, a collector 32 for Wintel can gather information including
the
following:
Version of Windows NT/Windows 2000;
System build number; Service pack revision level;
System uptime (when was the last system reboot); Environmental variables;
List of scheduled tasks;
Dump of the event log for application, security and system;
Copy of the critical boot files which allows later recovery capability in the
event
these files are disturbed;
Fingerprint (MDS hash) of the following files (not inclusive, list includes):
Critical boot files;
%SYSTEMDRIVE%\NTLDR;
%SYSTEMDRIVE%\boot.ini;
9
CA 02466079 2004-05-03
WO 2003/044668 PCT/US2002/036995
%SYSTEMDRNE%\bootsect.dos;
%SYSTEMDRIVE%\ntdetect.com;
%SYSTEMDRNE%\hyberfile.sys;
%SYSTEMDRIVE%\ntbootdd.sys;
%SYSTEMDRIVE%\ntoskxnl.exe;
%SYSTEMDRIVE%\hal.dll;
Shared DLLs as indicated by the registry value:
HKLM\sftware\Microsoft\Windows\Current version\shareddlls
%SYSTEMDRIVE%\system32\*; and
%SYSTEMDRIVE%\system\*;
File system capacity information;
Current running processes;
Status of the last registry backup/dump; and
Backup of the entire registry which is essentially the entire static system
configuration at the time of the backup (which is a point-in-time snapshot).
File collection is completely configurable, allowing for all or only a select
few to be
collected. It is noted that the data items listed are by way of example only
and those skilled
in the art will recognize that some items can be removed from the list and
other items can be
added to the list depending on the particular software and hardware under
study.
[0027] Collectors 32 for Unix preferably have a significant amount of
commonality. For
example, a general overview of information gathered on UNIX platforms of
Solaris, HP-
UX, AIX, and Linux includes the following:
Host name;
Domain name;
Current date/time;
Host ID;
Kernel version;
Kernel settings and options;
List f last logins;
Network configuration settings;
Remote procedure call service settings;
CA 02466079 2004-05-03
WO 2003/044668 PCT/US2002/036995
Arp cache;
Current mount points;
Dmesg;
Lsmod List of kernel modules;
Depmod;
Ldconfig;
Crontab entries for the root user;
Ipcs;
Disk space information;
Memory usage;
Swap space usage;
Running processes;
Exhaustive file listing for:
/etc/rc?d;
/etc/cron; and
/etc/xinetd.d;
Who is currently logged in;
Listing of all installed packages (RPMs);
Local firewall configuration;
Lilo configuration;
Lspci and -vv;
Checkpc;
Lsof -b'
Gather a copy of the following files:
/var/log/syslog;
/var/adm/messages; and
any other files needed based on platform, OS, or application depending on
the granularity desired;
Gather a copy of the following directories:
/etc; and
any other files needed based on platform, OS, or application depending on
the granularity desired;
11
CA 02466079 2004-05-03
WO 2003/044668 PCT/US2002/036995
Fingerprint of the following files (default):
/etc;
/boot;
/lib/modules<kernel>; and
any other files needed based on platform, OS, or application depending on
the granularity desired.
It is noted that the data items listed are by way of example only and those
skilled in the art
will recognize that some items can be removed from the list and other items
can be added to
the list depending on the particular software and hardware under study. For
example, on a
Linux server running firewall services , a user may want to include ALL files
in a file
system for security measures in order to determine if files have been tampered
with. Also,
for example, on a critical application server such as Oracle, a user may
gather fingerprints
on the oracle root directory which will include binaries and configuration
files to determine
when things change in the Oracle environment.
[0028] For example, a collector 32 for VERITAS NetBackup can gather
information
including the following:
Installation type: Master, media, Client;
License file;
Software registry keys) information for VERITAS NetBackup configuration
settings;
Software registry keys) information for VERITAS NetBackup services settings;
Hardware registry keys) information for storage hardware settings related to
NetBackup (SCSI, fibre channel, disk, tape, etc.); and
Data collection for Master:
Problems from the last 24 hours;
Media errors from the last 24 hours;
Backup status grouped by status code for the last 24 hours;
vmoprcmd - drive status;
bpclclients;
bpconfig;
bpgetconfig;
12
CA 02466079 2004-05-03
WO 2003/044668 PCT/US2002/036995
bpmedialist;
bpstulist;
bpcllist;
Essentially, ANY command provided by VERITAS to monitor the
application;
The NetBackup files to generate reports on the performance of NetBackup
(accessed by custom code); and
For the following log file types a directory is created if it does not exist
(this
enables that type of log):
admin;
bpcd;
bpdbjobs;
bpdbm;
bpj ava-msvc;
bpj ava-usvc;
bpinetd;
bprd;
bpsched;
bptm;
nbwin;
user ops;
tar;
xpbadm; and
xpbmon.
It is noted that the data items listed are by way of example only and those
skilled in the art
will recognize that some items can be removed from the list and other items
can be added to
the list depending on the particular software and hardware under study. It is
also noted that
registry keys are used only in connection with Windows NT and Windows 2000
platforms
but other like files are collected when the collector 32 for VERITAS NetBackup
is used for
other platforms such as UNIX platforms.
13
CA 02466079 2004-05-03
WO 2003/044668 PCT/US2002/036995
[0029] A system or device that does not have an open system operating system
is
considered to be a "non-intelligent" device. Examples of non-intelligent
devices include
Ethernet routers, switches, firewalls, NAS appliances, disk arrays, fibre
channel switches,
and tape libraries. Collectors for non-intelligent devices can operate in at
least two different
manners, each different from the collectors for intelligent devices. The first
method is less
secure by nature but is easier to implement. The first method uses the
standard telnet
interface of the device to logon to the device via TCP/IP over Ethernet and
run command
line tools to gather desired data. This is typically an interactive process
but the process can
be fully automated through tools such that a person does not need to interact
with the
interface to gather the configuration and event information for the device.
The information
collected can include:
Current running configuration;
Reboot configuration (the configuration which will be running if the system is
rebooted);
Event history; and
Anything that can be obtained from the admin interface.
The second method is to utilize standard SNMP calls to obtain the data or use
standards-
based APIs to obtain the data.
[0030] The CDR system 10 preferably includes a method for uniquely
fingerprinting files
in a file system. The purpose of fingerprinting files is to help rapidly
identify the change of
a file. FIG. 3 depicts the output of a suitable fingerprinting method. Given a
file, a line of
text is output providing unique details of the file. The unique details
preferably include File
Meta data that is information about the file (file properties). The File Meta
data can
include:
Filename;
File type;
Permissions;
File owner;
File group;
Size;
Number of blocks;
14
CA 02466079 2004-05-03
WO 2003/044668 PCT/US2002/036995
File mode;
File block size;
Last accessed;
Ctime; and
Last modified time.
The unique details also preferably include file contents. In addition to the
collection of file
meta data, the most unique portion is the actual file contents. The actual
contents of the
data are run against an MDS Message-Digest Algorithm to generate a globally
unique hash.
Once this hash is computed, it can be compared over time to determine if the
contents have
changed. It is noted that the data items listed are by way of example only and
those skilled
in the art will recognize that some items can be removed from the list and
other items can be
added to the list depending on the particular software and hardware under
study.
[0031) As best shown in FIG. 4, during operation of the CDR system 10 the
first step of
the CDR method is the collection process. During the collection step, the
collectors 32 (the
collection code) are run on the customer's servers 30. The collectors 32
gather desired
configuration and event information or data. The gathered information is
stored on the
CDR collector server 20 at the customer site 12 rather than the customer's
servers 30.
[0032] The collection process can be facilitated by any suitable method such
as for
example a CIFS/NFS method or an agent method. In the CIFS/NFS method, the
systems
administrator schedules job runs on the customer's servers) 30 at particular
times during
the day. The scheduled job connects to the CDR collector server 20 using
industry standard
CIFS/NFS protocols to "mount" or "map" to the CDR directory where the
collector code is
located and runs the collector code for the appropriate platform of choice.
The collector
code is run directly from the CIFS/NFS share/map point and all output is sent
directly to the
CDR collection server 20 which essentially eliminates storage capacity issues
on the
customer's servers) 30.
(0033) In the agent method, a small "service" is installed and configured to
run
automatically, or is configured to be run by an existing service which is
automatically run at
boot time on the customer server(s). The role of this service is to listen to
a specific TCP/IP
CA 02466079 2004-05-03
WO 2003/044668 PCT/US2002/036995
port for "interesting" data. This data is unique to the service, meaning the
service will not
respond if it is not using a known protocol. For example, the service will
listen for a unique
sequence of characters that starts a communication session. Once the session
has initiated,
the communication channel between the CDR collector server the customer's
server will
run the appropriate collection code to collect the desired data. Scheduling of
all CDR
processes can be handled completely through a local portal interface, thus
jobs will no
longer be required to be configured at the host layer. Additional
functionality of the agent
method includes the ability to no longer look at static information, the
scheduler could run
more frequently during the day to gather system state data, like performance
information.
This allows a combined effect of configuration, event and performance data
that can all be
overlaid to fully understand every aspect of system availability. The agent
method is useful
because it allows for secure, centralized and homogeneous scheduling process
of all servers
in the environment, it facilitates real time collection, and it is much more
secure than the
CIFS/NFS method.
[0034] Alternatively, an agent listing on a TCP/IP port is used with a secure
communication protocol such as SSL or other industry accepted data encryption
methodology. Scheduling of all CDR processes can be handled completely through
a local
portal interface, thus jobs will no longer be required to be configured at the
host layer. This
process is identical to the above process with the additional security
mechanism in place so
as to mitigate the snooping of the communication stream by a third party.
[0035] The second step of the CDR process is the importing process. Once the
data has
been collected, it must be cleansed and housed. The CDR collector server 20
will batch,
potentially at the same times) daily or the CDR collector server 20 notices
when new data
arrives to automatically perform the importing process. The importing process
preferably
includes the following steps. First, the CDR collector server 20 preferably
formats and
cleanses the data. Next the formatted and cleansed data is housed in any one
of a number of
suitable methods. In one method, the CDR collector server 20 utilizes secure
transport
mechanisms to transmit compressed and encrypted meta data from the customer
site 12 to
the CDR database server 22 at the solution provider site 14 via the Internet
16. This can be
accomplished using SSL 1024-bit public/private key encryption using any of the
following
16
CA 02466079 2004-05-03
WO 2003/044668 PCT/US2002/036995
encryption ciphers: AES, Blowfish, 3DES, DES, RSA1, RSA2, or other industry
accepted
cipher technologies. As best shown in FIG. 5, in an alternative embodiment,
the data is
entirely housed at the customer site 12. The CDR collection server 20, the
portal server 26,
and the database server 22 are each located at the customer site 12.
Therefore, the entire
system 10 is located within the user site 12 and information does not need to
leave the
user's network. The embodiment of FIG. 5 also includes a CDR collector portal
38 in
communication with the at the CDR collector server 20. The CDR collector
portal is
located at the user site 12 with the CDR collector server 20. The CDR
collector portal adds
additional functionality by providing direct access to the collector server.
With this direct
access it is possible to, for example, schedule snapshots or obtain immediate
uploads rather
than wait for scheduled uploads. While the CDR collector portal 38 is
illustrated with the
embodiment of FIG. 5, it is noted that the collector portal can be utilized
with other
embodiments such as, for example, the embodiment illustrated in FIG. 1. These
servers 20,
22, 26, 38 can be single or multi-tiered architectures based on the
performance and data
requirements that each unique customer needs, that is, all these components
can exist on
separate serves, the same server, or any combination thereof so that there are
from one to
four servers performing the functions.
[0036] During a regular interval or on request, the CDR collector server 20
via the update
process will check for any update from the CDR portal server 26 or CDR
database server
22. If a new version of a collector 32 or any other system component is
available, the
update process will download a copy of the new version of the collector 32 or
any other
system component for immediate or later installation. All communication is
preferably
initiated from the customer site 12, that is, at no point in time does a
connection initiate
from outside the customer's organization.
[0037] The third step of the CDR method is the analyzing process which
includes steps of
diagnosing and reporting the collected data. The roll of the analyzer 36 is to
view the data
and to use it in proactive and reactive methods to solve real business
problems. The
analyzer 36 is essentially the GUI front end provided by the CDR web portal
and the
intelligence behind it. Once the data has been collected and imported into the
database, the
user simply uses a ubiquitous web browser to securely log into the CDR portal
via the
17
CA 02466079 2004-05-03
WO 2003/044668 PCT/US2002/036995
Internet 16. All communications use the standard SSL encryption technology
including the
login and password. For additional security, a built-in timer can be provided
which expires
the current session based on inactivity or other predetermined event. The
user, depending
on hislher login credentials, has the capability of performing the following
tasks through the
portal: day-to-day administration; summary; view/compare; and reports.
[0038) For day-to-day administration, there is preferably an internal
interface which is
used by the solutions provider to administer the customer's databases and an
external
interface in which the end-users utilize to manage their specific environment.
Internal
administration tasks can include add new customers, add/change/delete users,
set/reset user
credentials, activate/deactivate profiles, request upload, and the like.
External tasks can
include adding users, changing users credentials, and the like.
[0039) The summary view of the portal interface preferably gives a customer a
high-level
view of all systems and devices collected in the environment. Therefore, using
this view,
the customer can easily see a summary of what configuration and event
information has
been collected.
[0040) The view/compare view of the portal interface preferably lists all
servers 30 that
are currently being monitored by the CDR collection system 10. In a single
screen, the user
preferably has the capability to do the following: click on a snapshot time
and see the
detailed configurations and logs; view the most current snapshot in one click;
compare two
distinct snapshots for a particular server to see how things have changed on
that server 30;
one-click compare the last two snapshots or the last snapshot to the "gold
image" or
"master" snapshot; and compare to different systems by selecting two distinct
systems.
[0041] The diagnosing step can take at least for different forms: identify
mode; on-
demand diagnosis mode; automated diagnosis mode; and learning mode. In the
identify
mode, the user can identify, from the portal interface, system, hardware,
software,
application and/or device changes that affect availability, performance and
usability. In
addition, the identify mode could be used for on-demand documentation or audit
purposes.
The on-demand diagnosis mode is utilized when the system, hardware, software,
application
is
CA 02466079 2004-05-03
WO 2003/044668 PCT/US2002/036995
and/or device is not performing as it should and the customer needs to
determine what is
causing the problem. The customer logs onto the portal to determine what
changes with the
system, hardware, software, application, or device that has the problem. By
doing a server
compare, for example, a customer is able to quickly identify that the
permissions of the
backup services were changed to a user with the incorrect credentials causing
the
application to fail. In automated diagnosis mode, information is automatically
sent to the
customer (no human intervention) to help mitigate issues before they arise.
The automated
diagnosis can be proactive by highlighting best practices on the system such
as application
and device configuration and event settings. For example, Disk 0 is filling up
and you need
to keep it below 80% capacity, DLT8000 tape has a MTBF of 3000 passes and you
have
2990 passes on cartridge 582 so you need to migrate this piece of media out of
your pool of
available media, or the /etc/st.conf file was changed on 9/12!02 at 9:14 am
(it is now
9/13/02 11:45 am) but the machine was not rebooted so you need to reboot your
server if
you want these changes to take effect. The automated diagnosis can also be
reactive by
highlighting events that have already occurred. For example, Disk 0 is at
100%, backups on
Server A, C and D failed last night due to a server communication error, or
Server abcl23
has not had a collection in 24 hours. In the learning mode, the user can
compare before and
after snapshots, from the portal interface, of a system to see exactly what
changes occurred
during a particular known event. For example, this comparison can allow the
user to
understand how a new application makes changes to their system if they were to
run a
collection just prior to installing a new application and collect again just
after the
installation of the application. Running a compare between these two snapshots
would help
in the learning process as to how applications and such impact the system.
[0042] The portal interface preferably permits a user to quickly report on all
aspects of the
system, hardware, software, application and/or devices. Standard reports can
include
monthly reports of change, proactive updates, and any other standard best
practices reports.
Custom reports can be tailored to each individual customer. Semi-annual (or
other user
defined timeframes) reports for management review can include a rollup of
monthly reports.
It is noted that proactive and reactive notifications or reports to the
customer are preferably
automatically generated by the automated diagnosis (no human intervention)
discussed
hereinabove.
19
CA 02466079 2004-05-03
WO 2003/044668 PCT/US2002/036995
[0043] From the foregoing disclosure and detailed description of certain
embodiments of
the present invention, it is apparent that the system provides a flexible
architecture (l, 2, and
3 tier) and can be utilized in both a service provider model (where the CDR
collector and
the CDR collector portal reside at the customer site while the CDR data
warehouse and
CDR portal reside at the provider site) and a product model (where all
components reside at
the customer location). In the provider model, the system can "manage" itself
from the
standpoint of the user because the service provider provides all of the
hardware
maintenance. It is also apparent that various modifications, additions and
other alternative
embodiments are possible without departing from the true scope and spirit of
the present
invention. The embodiments discussed were chosen and described to provide the
best
illustration of the principles of the present invention and its practical
application to thereby
enable one of ordinary skill in the art to utilize the invention in various
embodiments and
with various modifications as are suited to the particular use contemplated.
All such
modifications and variations are within the scope of the present invention as
determined by
the appended claims when interpreted in accordance with the benefit to which
they are
fairly, legally, and equitably entitled.