Note: Descriptions are shown in the official language in which they were submitted.
CA 02471195 2004-06-16
-1-
Title: MOBILE RADIATION SURVEILLANCE NETWORK
Field of the invention
[0001) This application claims priority from U.S. provisional patent
application no. 60/520,243 which is incorporated herein by reference. The
present invention relates generally to the field of surveillance systems, with
common but by no means exclusive application to systems for detecting
nuclear, radiation, chemical or biological conditions in the environment.
Backs~round of the invention
[0002] Since the terrorist events of September 11, 2001, the likelihood
of future terrorist attacks is acknowledged to be higher than in the past. As
a
result, the public has greater expectations for security, prevention,
interdiction
and incident site management. Radiological and other agents have a
particularly high potential for psycho-social impacts on political and
economic
systems. The malicious dispersal or the clandestine placement of radiological
materials or other agents could be used to attack private, public and economic
targets.
[0003) Radiological, nuclear, biological or chemical agents could be
acquired by terrorists through clandestine theft or low level military
operations
and moved, possibly undetected, to urban population areas or to targets of
high symbolic value.
[0004] The applicants have accordingly recognized a need for
improved systems and methods of detecting and tracking nuclear,
radiological, biological or chemical threats.
Summary of the invention
[0005] In one aspect, the invention is directed towards a detection
system having at least one detection unit and a control centre.
[0006) The detection unit includes at least one sensor configured to
generate sensor data correlated to sensed conditions; a locator for actively
determining location data corresponding to the location of the detection unit;
CA 02471195 2004-06-16
_2_
and a communicator configured to communicate the sensor data and location
data.
(0007] The control centre includes a receiver for receiving the sensor
data and the location data, and a control processor configured to determine a
threat level correlated to the sensor data.
(0008] In another aspect, the invention is directed towards a detection
unit having at least one sensor, a locator, and a communicator. The sensor is
configured to generate sensor data correlated to sensed conditions. The
locator is configured to actively determine location data corresponding to the
location of the detection unit. The communicator is configured to
communicate the sensor data and location data.
(0009] In yet another aspect, the invention is directed towards a
detection unit comprising at least one sensor, a locator, a control processor
and a display unit. The sensor is configured to generate sensor data
correlated to sensed conditions. The locator is configured to actively
determine location data corresponding to the location of the detection unit.
The control processor is operatively coupled to the sensor and to the locator.
The display is operatively coupled to the control processor and configured to
display graphical data correlated to both the sensor data and the
corresponding location data.
(0010] In yet a further aspect, the invention is directed towards a
method of detecting threatening conditions, comprising the steps of:
a. providing a control centre;
b. providing at least one mobile detection unit, wherein the
detection unit comprises at least one sensor configured to
generate sensor data correlated to sensed conditions;
c. actively determining location data corresponding to the
location of the detection unit;
d. communicating the sensor data and the location data to the
control centre;
CA 02471195 2004-06-16
-3-
e, determining a threat level correlated to the sensor data.
[0011] Preferably, the method also includes the step of generating a
graphical display correlated to both the sensor data and the location data.
Brief description of the drawings
[0012] The present invention will now be described, by way of example
only, with reference to the following drawings, in which like reference
numerals refer to like parts and in which:
[0013] Figure 1 is a schematic diagram of a detection system made in
accordance with the resent invention.
[0014] Figure 2A is a schematic diagram of a mobile detection unit
used in connection with the detection system of Figure 1.
[0015] Figure 2B is a schematic diagram of a vital point detection unit
used in connection with the detection system of Figure 1.
[0016] Figure 3 is a schematic diagram of sample historical sensor
reading data stored in the main data storage unit of Figure 1.
[0017] Figure 4 is a schematic diagram of a stand-alone detection unit
made in accordance with the present invention.
[0018] Figure 5 is a representative screen display of a display unit of
Figure 1.
[0019] Figure 6 is a logical flow diagram of a method of the present
invention.
Detailed description of the invention
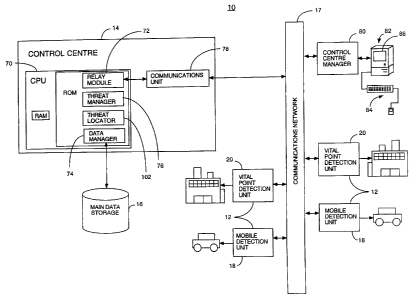
[0020] Referring to Figure 1, illustrated therein is a detection system,
referred to generally as 10, made in accordance with the present invention.
The detection system 10, typically comprises a plurality of detection units
12,
and a control centre 14 and a main data storage unit 16. The detection units
12 and control centre 14 are typically operatively coupled via a
communications network 17 such as the Internet, a local radio or wired
communications network, or cellular communications network, or a
CA 02471195 2004-06-16
-4-
combination thereof, which provides a communications link between the units
12 and the centre 14.
[0021 The detection units 12 may be of a mobile detection unit type 18
or a stationary vital point detection unit type 20.
(0022] Referring now to Figure 2A, illustrated therein is a mobile
detection unit 18. The mobile detection unit 18 includes a suitably
programmed detection unit central processing unit (CPU) 30 comprising
random access memory (RAM) and read only memory (ROM) storing device
manager software 31. The CPU 30 is operatively coupled to one or more
sensors 32, a locator 34, a timer 36, a communicator 38, a detection unit data
storage 40, and a power source 41.
[0023) Each sensor 32 measures the current level of a potentially
harmful agent (eg. radiological, nuclear, chemical or biological) in the
immediate environment, and generates corresponding sensor data 42,
preferably at specified intervals on a continuous basis while the detection
unit
18 is in operation. Such sensors 32 are commercially available, for example,
the Eberline 40G series of radiation detectors and the associated family of
external radiation detectors are available as off the-shelf components.
[0024) The locator 34 is preferably an active positioning determining
device such as a global positioning system (GPS), for example, a Trimble
Lassen SQ GPS. However other systems for actively and accurately
determining the location of the detection unit 18 may be used, for example
such as the LORAN navigation system or other triangulation systems, which
generate location data 44 corresponding to the location of the detection unit
18.
[0025 The timer 36 may be programmed as part of the processor 30
utilizing the processor's 30 clock functionality, and is configured to
generate
timing data 46 which corresponds to the time at which each sensor data point
42 is generated. Alternatively, if the locator 34 is a GPS system, the locator
34 could also generate the timing data 46, as will be understood.
CA 02471195 2004-06-16
-5-
[0026] The processor 30 receives the sensor data 42, the location data
44 and the timer data 46, and organizes the data 42, 44, 46 and including any
error messages into a data message 51. The processor 30 then causes the
communicator 38 to communicate the data message 51 (containing the data
42, 44, 46 and any error messages) to the control centre 14 for processing.
The communicator 38 will be a wireless data transmitter for example such as
a wireless modem or wireless Ethernet device. Preferably, the processor 30
is configured to encrypt the data message 51, and correspondingly, to decrypt
any data messages received from the control centre 14.
[0027] Typically, the communicator 38 will transmit the data message
51 via radio or cellular transmission. Typically, such a transmission will be
received and converted into an Internet message for delivery to the control
center 14. In the event the communicator 38 is unable to establish or
maintain a communications link with the control centre 14, the processor 30 is
preferably programmed to store the data 42, 44, 46 and/or the data message
51 in the detection unit data storage 40 for retrieval and communication by
the
communicator 38 once communications with the control centre 14 have been
reestablished.
[0028] The detection unit data storage 40 will preferably also store
basic alarm threshold data 48, which preferably stores an alarm threshold
data point 48 corresponding to a dangerous sensor data level 42. If the
sensor 32 generates a sensor reading 42 which exceeds (or is less than as
the case may be) the alarm threshold data point 48, the processor 30 will
preferably be programmed to trigger a local alarm 50 or otherwise will
preferably be programmed to notify the user of the potential danger.
[0029] Additionally, the communicator 38 may receive location-based
alarm threshold data points 48 from the control centre 14 which it will store
in
the detection unit data storage 40 (or alternatively in the detection unit's
processor 30 RAM storage). The basic and location-based alarm threshold
data 48 is stored locally on the detection unit 18 to enable the processor 30
to
detect a harmful environment and trigger a local alarm 50 for safety reasons,
CA 02471195 2004-06-16
-6-
even when communication with the control centre 14 is interrupted or
degraded and the control centre 14 would be unable to trigger such an alarm.
[0030] A power source 41 sufficient to power the operation of the
detection unit 18 is also provided. The power source 41 preferably includes a
rechargeable battery system. In some instances, the detection unit 18 (and
correspondingly, the power source 41, which will typically comprise a
significant portion of the detection unit's 18 weight) may be configured in
size
and weight to be easily carried by a person, for example, in a backpack. In
such instance, it is expected that such a person could either walk or travel
on
bike or horseback. In addition, or in the alternative to a rechargeable
battery
system, in detection units 18 intended for use with a motor vehicle the power
source 41 may include cabling and/or adaptors for connecting the detection
unit 18 to the vehicle's electrical system for the supply of electrical power.
[0031] In general, each detection unit 12 measures current levels of
undesirable agents (ie. chemical, biological, radiological or nuclear), and
sends these measurements, coupled with current time and location, to the
Control Center 14. The Control Center 14 receives and organizes the data
from a network of Detection Units 12.
[0032] Referring now to Figure 2B, illustrated therein is a vital point
detection unit 20. Vital Point Detection Units 20 (VPDU 20) are statically
deployed, and are intended to protect fixed assets. VDPUs 20 are generally
similar to the mobile detection units 18. However, because a VPDU's 20
location is static, no GPS-style locator 34 is required. Accordingly, the
locator
34' may simply comprise location data 44 corresponding to the location of the
VDPU 20 which has been predetermined and stored in the detection unit data
storage 40. For the sake of clarity, such a locator 34' is not considered to
be
active for the purpose of this application.
[0033] Additionally, wireless communication is typically not needed in
VDPUs 20. Accordingly, the communicator 38' may take the form of a wired
communication device, such as a wired Ethernet device. As well, in the case
CA 02471195 2004-06-16
-7-
of a VDPU 20, the power supply 41 may include a electrical plug for plugging
into a standard wall socket.
[0034] Referring again to Figure 1, the control centre 14 includes three
main software components, each of which may be programmed and run on a
main control centre CPU 70, or alternatively may be programmed and run on
separate, but operatively coupled CPUs: a relay module 72, a data manager
74, a threat manager 76.
[0035] Typically, the main data storage unit 16 comprises long term
memory and forms part of the control centre 14, although it should be
understood that the database 16 may reside locally or be remotely coupled to
the control centre 14. The control centre 14 also includes a communications
unit 78, typically having both wired and wireless communications devices,
such as wireless modems, wired or wireless Ethernet devices, radio or
satellite or infrared transmitters and receivers.
[0036] The relay module 72 is programmed to manage the
communication of data between the communications unit 78 and the
communicator 38 of each of the detection units 12. The data manager 74
manages the main data storage unit 16. The data manager 74 provides
service to the relay module 72 and the control centre managers 80 (discussed
in greater detail below), and allows them to add, retrieve, modify and delete
various monitoring information.
[0037] The threat manager 76 determines if the sensor data 42
indicates a level of agent that is higher than normal, or in the case of
radiation, indicates the presence of a signal that is stronger than background
radiation. The threat manager 76 determines a threat level for all sensor data
42 measurements, which is stored with each sensor data measurement 42 in
the main data storage unit 16 by the data manager 74. In its simplest
embodiment, the threat manager 76 may determine threat level by comparing
the sensor measurements 42 to previously determined threshold level data
points stored in the main data storage 16.
CA 02471195 2004-06-16
_ 8
(0038] In a more complicated embodiment, the threat manager 76
determines threat level by analyzing sensor measurements 42, in conjunction
with the corresponding location and time when the sensor measurements 42
were taken. The threat manager 76 may also use data from other sensors that
measure current weather conditions, and it may allow manual overrides for
known and accepted radiation anomalies (such as known transportation of
non-illicit material). This calculated threat level is then coupled with the
measurement 42, location and time and stored in the main data storage 16 by
the data manager 74.
[0039] The threat level analysis typically proceeds in four steps. These
four signal processing steps are preferably employed continuously throughout
the operation of the system 10. This continuous operation allows for
improvement in sensitivity and specificity of detection of threat events
during
the entire operational lifetime of the system 10 through increased statistical
precision in characterizing the expected radiation environment. The four
steps are set out below.
[0040] First, the sensor measurements 42 are associated with a
statistical uncertainty. Further, the effects of radiation sensor movement,
sensor efficiency of detection, instrumental measurement averaging time,
directional sensitivity, and other instrumental factors as may be necessary
are
accounted for in order to obtain an estimate of the radiation level at a
specific
location and its uncertainty.
(0041] Second, the estimates of the radiation levels and their
uncertainties are associated with season of year, time of day, prevailing
climatic conditions, and measurements obtained from other sensors such as
static radiation sensors. Using these factors the seasonal and temporal
variations in the radiation environment may be characterized.
[0042] Third, the short term temporal and spatial variations in radiation
measurement levels arising from the legitimate movement and placement of
radiation sources in the environment are identified by association of
radiation
measurement data with those radiation sources
CA 02471195 2004-06-16
_g_
(0043] Fourth, anomalous radiation sources both static and moving are
characterized by significant deviations from the expected radiation
environment as identified by the above three steps. Anomalous radiation
sources may differ in such factors as, but not limited to, magnitude of
radiation
sensor measurement data, velocity, pattern of movement within the
environment, temporal variation in radiation measured level and radiation
spectrum.
(0044] The system 10 provides for the use of conventional signal
processing tools to conduct the above four steps. These tools include but are
not limited to statistical estimates of errors and uncertainties, statistical
tests
of significance of association, difference, etc., seasonal factor extraction,
temporal and spatial averaging and deconvolution techniques. These tools
are typically applied globally to the data set of sensor measurements
distributed spatially over the area monitored and temporally over the time
span of monitoring
(0045] The present system provides for the capability to employ
adaptive alarming levels. First, the important spatial, meteorological and
temporal variations within a high value target area and which variations may
be as great as ten to one, may be used to provide for deviations of the
radiation or other types of sensor measurements relative to the expected
levels specific in time and location as determined by routine operation of the
present system.
(0046] In addition, the system provides for the adjustment of the above
relative alarming levels on the basis of a risk/cost/benefit determination.
Intelligence estimates of the probability of the perpetration of a
radiological,
chemical, biological or nuclear attack and other intelligence information from
outside the system may be used to dynamically adjust the relative
measurement alarming levels. This adaptive alarming operation provides for
the more sensitive detection of anomalous events with acceptance of the
costs of higher false positive rates in periods of greater perceived risk to
the
high value target area.
CA 02471195 2004-06-16
-10-
j004TJ In routine surveillance operation, and in the absence of
threatening incidents, the system 10 provides a cost effective means for the
assembly of a data set characterizing the normal or expected environment of
the area under surveillance with unprecedented spatial resolution, temporal
resolution and statistical significance. Moreover the data are reported
automatically by autonomous operation of the system leading to the important
advantages of reliability, reproducibility, consistency and negligible field
operative skill and time requirements.
(0048) The detailed understanding and the catalog of the signatures of
benign radiation, nuclear, biological and/or chemical measurements resulting
from operation of the system 10 provide a basis upon which the identification
of the signatures of anomalous and illicit events can be made. This leads to
a lower rate of occurrence of undesirable and costly false alarms or false
positive indications of illicit events. As well, these features lead to a
lower rate
of occurance of dangerous and costly failures to alarm in the presence of
illicit
events or false negative indications of illicit events.
(0049) Pixon signal processing tools may instead be used to conduct
the above four steps. Pixon signal analysis is discussed for example in
Puetter, R. C., and Yahil, A., "The Pixon Method of Image Reconstruction",
Proc. ADASS '98, in Astronomical Data Analysis Software and Systems Vlll,
D. M. Mehringer, R. L. Plante, and D. A. Roberts, Ed.s, ASP Conference
Series, Vol. 172, pp. 307-316, which is incorporated herein by reference.
(0050) These Pixon tools obtain the best estimate of a radiation
measurement for example at each specific spatial and temporal point in the
set of radiation measurements by modeling the data available in the local
neighborhood of that spatial and temporal point. The model developed of the
local data is that model which is the simplest possible which is consistent
with
the statistical uncertainties inherent in the data. The threat manager 76 is
also
preferably programmed to provide the ability to query the data manager 42 for
the stored threat level of each detection unit's 12 latest sensor readings.
CA 02471195 2004-06-16
-11-
(0051] The data manager 74 is preferably the only control centre 14
system component that has direct access to the main data storage 16. All
operations involving reading, writing, and manipulating data within the main
data storage 16 will preferably be performed exclusively by the data manager
74. The data manager 74 provides services to the relay module 72 and to
each control centre manager 80 that allow them to add, modify, view, and
delete data stored in the main data storage 16.
(0052] The data manager 74 controls the storing of sensor data 42,
device configuration data, errors, and commands for the detection unit CPUs
30. The data manager 74 will receive the data messages 51 from the relay
module 72 and then parse the sensor readings 42, corresponding location
and time data, and error messages from the data messages 51 and store
them in the main data storage 16.
(0053] Referring now to Figure 3, illustrated therein is a representative
sample of the type of historical data which may be stored in the main data
storage 16. The database 16 contains the detection unit identifier 92, the
sensor data 42, units of measurement 43, the location data 44 (latitude 94
and longitude 96) (corresponding to the sensor data 42), and the timer data
46 also corresponding to every reading 42.
(0054] The relay module 72 may also be programmed to periodically
query the data manager 74 for a list of commands to be sent to the detection
unit CPUs 30. The data manager 74 will also store all application preferences
and settings data required by the control centre managers 80. The control
centre managers 80 may query the data manager 74 for sensor readings 42,
and detection unit 12 configuration. In addition each control centre manager
80 will be able to send commands to the detection units 12 and update
configuration information.
(0055] The relay module 72 captures the data messages 51 in raw data
streams from the detection unit CPUs 30 and sends them to the data
manager 74. In addition, the relay module 72 has the ability to forward
commands from the data manager 74 to the detection unit CPUs 30.
CA 02471195 2004-06-16
-12-
[0056) The relay module 72 monitors for incoming socket requests and
then forwards them to the data manager 74. The relay module 72 will also
periodically poll the data manager 74 for commands that need to be sent to
individual detection unit CPUs 30.
[0057] The relay module 72 is preferably programmed to accept
incoming socket requests from detection units 12.
[0058) It will spawn an instance of a "Request Manager" to read the
data messages 51 from the detection unit 12. The relay module 72 will
ensure that the Request Manager terminates properly.
[0059] Once a connection request is detected, the relay module 72 will
preferably create a specialized thread, called "Request Manager", for dealing
with the device requesting the connection.
[0060] The Request Manager thread is capable in running in two
modes. In N-bit mode the Request Manager will wait for a data message 51
from a detection unit 12. Once the message 51 has been received, the
Request Manager thread will upload available commands to the detection unit
12, then it will close the connection. In Permanent Lisfen mode the Request
Manager thread will always have the connection open to receive new
readings from the client detection unit. In this mode the Request Manager
thread will periodically check if there are commands available to send to the
client device. In Permanent Listen mode, the Request Manager thread wilt
only close the connection when an error is encountered.
[0061] The control center 14, also receives requests from each control
center manager 80 (a user interface application) to retrieve information. The
control center manager 80 will query the data manager 74 for stored radiation
readings and detection unit 12 configuration. In addition, the control center
manager 80 is able to send commands to the detection units 12 and update
configuration information.
[0062) Typically, each control centre manager 80 is coupled to an
inputloutput device 82, such as a computer having a keyboard 84 and mouse
CA 02471195 2004-06-16
-13-
and a display monitor 86 for displaying data to the end users. As discussed
below, the input/output device 82 may be a portable device such as a PDA or
cellular phone having a display screen. Via the display screen 8fi, the
control
centre manager 80 is programmed to display a radiation monitoring screen to
the end user. Figure 5 illustrates a representative example of a radiation
monitoring screen 90.
[0063] The screen 90 shall display a table 91 of the current radiation
readings being displayed on a map 100 which is synchronized with the
location data 44 for each of the detection units 12. The table 91 contains the
detection unit identifier 92, the location data 44 (latitude 94 and longitude
96),
sensor data 42, units of measurement and the timer data 46 for every reading
[0064] The screen 90 also displays a labeled marker or other indicator
on the current map 100, showing the location of each of the detection units
12, and indicating each unit's 12 current alarm level. The screen shall
display
a trail on the current map 100, showing the recent path of each of the
detection units 12, and indicating each unit's 12 alarm level at each point on
that path. In the example illustrated on Figure 5, the relative strength of
the
alarm levels is illustrated by the size of the geometric shapes marking each
trail, but colour or other appropriate indicator may be used. In the example
illustrated on Figure 5, three different geometric shapes (circles, squares,
triangles) depict the paths of the three different detection units 12. The
larger
circles and larger squares are intended to illustrate sensor readings 42 which
were determined to represent a higher threat level than the sensor readings
42 represented by small squares and small circles.
[0065] Every reading that can be located on the selected map 100 is
illustrated until it expires (e.g. after 2 minutes or some other selected time
limit). If alarms are set, they are illustrated on the map 100 accordingly.
The
trails indicate past readings.
[0066] As noted, the control centre manager 80 is also programmed to
provide the user the ability to query the data manager 74 to view historical
CA 02471195 2004-06-16
-14-
readings. The display will provide the ability to query for readings, and the
ability to query the results.
[0067] The control centre manager 80 is programmed with a replay
manager which displays a replay of a previous set of data, between two
dates/times set by the user, on the display monitor 86. The replay screen
should be substantially similar to the monitoring screen 90 illustrated in
Figure
5. The replay should preferably be paused, rewound, and fast forwarded.
The replay speed may also preferably be increased several times for speedy
viewing.
[0068] Illustrated on the replay screen are a slider control, and play,
pause, and stop buttons which allow the user to have a media player-like
control over the replay. A progress bar within the slider control indicates
the
progress of the data streaming, as in media player. The replay manager
allows the user to select a speed of playback, which can be changed at any
time.
[0069] The control centre manager 80 is also programmed to allow the
user to select a map 100 (or arial photograph or view of a larger map, etc.)
on
which to view the sensor data 42. This can be changed at any time.
[0070] Preferably, the control centre 14 is also programmed with a
threat locating module 102. This module 102 is expected to be used when a
radiological or nuclear terrorist event has occurred or has been suspected to
have occurred.
[0071] This threat locating module 102 has access to all historical and
current radiation readings and associated times and locations. It will use
these
data, their associated statistical analyses, and physical modeling of
terrorist
event scenarios in order to determine estimates of the location, quantity, and
isotope of the radiological or nuclear material. It will do this analysis for
several scenarios, where each scenario is based on a different assumption of
the nature of the source: single stationary location, two stationary
locations,
single Radiological Dispersal Device (RDD), two RDDs, etc.; single source
CA 02471195 2004-06-16
-15-
being transported, two sources being transported, etc.; widely dispersed
source (i.e. as a powder, aerosol, etc.).
[0072] Additionally, the system 10 provides the benefit and advantage
of making available substantially in real time and potentially on a national
or
international scale the data, information and estimates related to identified
or
suspected terrorist attacks. This benefit will be of particular advantage
during
multiple attack events and in soliciting expert opinion from multiple remote
jurisdictions.
[0073] This analysis would preferably be illustrated graphically, in a
manner similar to that of the radiation monitoring screen 90. The user may
select the scenario description, and see the probable locations displayed on a
map 100. 1n this manner, the user may see a logical pattern for one or more
scenarios, and direct policing authorities and first responders accordingly.
[0074] Equipping policing authorities and first responders with displays
may prove to be advantageous. The control centre manager interface 80 can
easily be run on computers that are common in police cars. However, a
portable display would be valuable for pedestrian and equine deployment.
[0075] This portable display 82, running on a Personal Digital Assistant
(PDA) or on a Wireless Application Protocol (WAP) enabled cell phone, may
run the standard control centre manager interface 80, or be programmed to
run a special light version of the software.
[0076] This light version of control centre manager interface 80 would
selectively display information related to the user's own detection unit 12:
actual sensor readings 42, current threat level (alarm level), location
information 44 (all displayed textually andlor graphically).
[0077] Illustrated in Figure 4 is a schematic diagram of an alternative
stand-alone version of the detection unit 12' of the present invention. For
cost
or other reasons, it may not be feasible for certain applications to have a
centralized control centre 14. Accordingly, a single stand-alone detection
unit
12' of the present invention may be desired.
CA 02471195 2004-06-16
-16-
[0078] As will be understood, the stand-alone detection unit comprises
many similar components as that of the mobile detection unit 18, but with the
processing capability of the control centre CPU 70, and the greater storage
capacity of the main data storage 16. Accordingly, the stand-alone CPU 30' is
programmed with the threat manager 76 and the data manager 74 modules.
The detection unit 12' is also provided with a display monitor 86 and an input
device 84, for example such as a keyboard or touch-sensitive screen, which
are operatively coupled to the CPU 30'.
[0079] The detection unit 12' will preferably generate a screen display
substantially similar to the radiation monitoring screen 90, but as will be
understood, will only display the data such as the sensor readings 42 and
location data 44 and time data 46 generated by the detection unit 12'.
[0080] Referring now to Figure 6 (in conjunction with Figures 1 and 2A
& 2B), illustrated therein is one embodiment of the general process, referred
to generally as 200, which the detection system 10 performs. A control
centre14 is provided (Block 202), together with at least one detection unit 12
having a sensor 32 for generating sensor data 42 correlated to sensed
conditions (Block 204). Location data 44 corresponding to the location of
each detection unit 12 is then actively determined (Block 206). The sensor
data 42 and the location data 44 are then communicated to the control centre
14 (Block 208). Next, the data 42, 44 is analyzed and a threat level
correlated
to the sensor data 42 is determined (Block 210). A graphical display may then
be generated which is correlated to both the sensor data 42 and the location
d ata 44.
[0081] Thus, while what is shown and described herein constitute
preferred embodiments of the subject invention, it should be understood that
various changes can be made without departing from the subject invention,
the scope of which is defined in the appended claims.