Note: Descriptions are shown in the official language in which they were submitted.
CA 02482045 2004-09-17
1
METHOD OF CRYOPRESERVING CELLS
Technical Field
This application relates to methods of cryopreservation, particularly
methods of cryopreserving cells and tissues.
Background
Cryobiology is the study of the effects of low temperatures on biological
systems. Although freezing is lethal to most living systems,
cryobiologists have been able to preserve cells and tissues at a range of
subzero temperatures, as low as liquid nitrogen temperatures (-196 C).
Currently, cryopreservation can be applied to most cells in suspension,
such as stem cells, other progenitor cells, red and white blood cells,
sperm cells, oocytes, ova, and cellular materials derived from tissues
and organs (including but not limited to pancreatic islet cells,
chondrocytes, cells of neural origin, cells of hepatic origin, and cells of
cardiac origin). Cryopreservation has also been used to effectively
preserve tissues, such as heart valves, embryos, skin, articular cartilage,
and islets of Langerhans and an increasing range of engineered tissues
and tissues constructs. Although the current recovery rates of viable
cells post-thaw may be sufficient for some clinical uses, recovery rates
are generally considered less than optimal due to injury during the
freezing process.
Cryobiology has been applied to many cell and tissue types. Recent
developments in the utilization of a variety of stem cells, including cord
CA 02482045 2004-09-17
=
- 2 -
blood stem cells have revived interest in optimizing cryopreservation
techniques for cells and tissues (D. Krause, 2002). In particular, for
stem cells and other cell types which are obtained in low numbers from
donors, high recovery of these cell types is crucial. High recovery is
also important in cryopreservation of engineered cells due to the high
cost and length of time for manufacturing such cells. Emerging higher
standards for cell and tissue banking (Guide to safety and quality
assurance for organs, tissues and cells, 2nd edition, 2004, Council of
Europe Publishing, France), specifically stem cell banking, will be
required to meet future needs of cell banking and therefore, optimal
cryopreservation techniques are fundamental.
Currently, cryopreservation of cells has been most successful with the
use cryopreservants and cryopreservation of stem cells has been most
successful with the use of dimethyl sulfoxide (DMSO). There are,
however, limitations to the use of DMSO. Toxicities have been
associated with infusion of stem cells preserved with DMSO (Davis et
al., 1990; Egorin et al., 2001; Santos et al., 2003; Zambelli et al.,
1998). Some researchers have attempted to reduce the amount of DMSO
(Abrahamsen et al., 2002; Beaujean et al, 1998) or combine it with a
non-penetrating cryopreserv ant, such as Hydroxyethyl starch (HES)
(Donaldson, 1996; Halle et al., 2001; Katayama etal., 1997).
It has also been previously demonstrated that some cells can be
cryopreserved without the use of a specific cryoprotectant such as
DMSO. In cryopreservation procedures, cells are generally cooled at a
constant rate which is optimized for the cell type and cryopreservant.
CA 02482045 2004-09-17
3
This optimization has typically been approached empirically by varying
cooling rates and the nature and concentration of cryopreservants. In
addition to cooling at a constant rate, two other techniques have been
described to examine the effects of low temperatures on cells: a two-step
freezing technique and a graded freezing technique. The two-step
freezing technique (J. Farrant et al., 1974) is a logical method to
examine the effects of osmotic interactions on cell recovery over a
broad range of subzero temperatures. In this procedure, lymphocytes
were cooled rapidly to various subzero temperatures and held for
various periods of time before being 1) thawed directly from that
holding temperature or 2) rapidly cooled to -196 C before thawing.
McGann and Farrant later reported that the subzero temperature and the
length of hold time at that temperature were important factors to
consider when attempting to maximize cell survival (McGann and
Farrant, 1976). The graded freezing technique was later developed by
McGann and used to determine the temperature range through which
slow cooling should be controlled (McGann, 1979). Samples were
cooled slowly to various subzero temperatures before being either
thawed directly or plunged into liquid nitrogen first and then thawed.
These experimental techniques provided insights into the effects of
subzero temperatures and time, which can be used to empirically
optimize a cryopreservation procedure.
There is significant interest in designing an optimized cryopreservation
protocol for all cell types and tissues, which maintains cell and tissue
viability but does not require toxic cryopreservants.
CA 02482045 2004-09-17
- 4 -
Summary of Invention
This invention relates to a non-linear cryopreservation protocol for
cryopreserving cells comprising determining an optimal cooling profile
for maximum recovery of the cells and applying the cooling profile to
the cells. The optimal cooling profile is determined using a simulation
of cellular responses to cooling parameters. The cooling parameters
comprise cell temperature, duration of temperature exposure, cooling
level, cooling rate and presence or absence of cryopreservants. The
cellular responses are determined from mathematical models of
extracellular concentration parameters, intracellular concentration
parameters, and cellular osmotic permeability parameters.
The cryopreservation protocol can be used with cells stored without
cryopreservants. The protocol can also be used with cells stored with
cryopreservants, including non-penetrating cryopreservants. Such non-
penetrating cryopreservants include sugars, starches, serum, or plasma.
The invention can be applied to any types of cells, including stem cells,
other progenitor cells, red and white blood cells, sperm cells, oocytes,
ova, cells for research or transplant purposes, and cellular materials
derived from tissues and organs (including but not limited to pancreatic
islet cells, chondrocytes, cells of neural origin, cells of hepatic origin,
and cells of cardiac origin). Throughout this application, cells include
cells organized as tissues. Stern cells include human peripheral blood
stem cells, human umbilical cord blood stem cells and stem cells
derived from tissues and solid organs or other sources, including fetal
CA 02482045 2004-09-17
and or embryonic sources. The invention is not limited to human cell
types and is extendable to all mammalian and non-mammalian species.
In one embodiment of the invention, the non-linear cryopreservation
protocol comprises cooling the cells to a first temperature for a first
period of time, then cooling the cells to a storage temperature for a
second period of time prior to thawing.
In another embodiment of the invention, the non-linear cryopreservation
protocol can be executed on cells in small samples. The invention can
also be applied using a bulk freezing unit or a cryomicroscopy
apparatus. The bulk freezing unit comprises a controller for executing
the cryopreservation protocol, and the controller communicates with a
computer to receive the cryopreservation protocol. The controller is
connected to heaters surrounding the cells for maintaining the
temperature of the cells, and thermocouplers monitor the temperature of
the cells.
The invention also relates to methods of optimizing cryopreservation
protocols by determining an optimal cooling profile and applying the
profile to cryopreservation protocols. The invention also relates to
cryopreservation protocols optimized by the method of the invention.
The invention also relates to non-linear cryopreserving protocols for
cryopreserving stem cells
In a specific embodiment of the invention, the method of cryopreserving
stem cells comprises cooling the stem cells to a first temperature for a
CA 02482045 2004-09-17
- 6 -
first period of time, then cooling the cells to a second temperature for
storing the stem cells. In one embodiment, the stem cells are cooled to a
temperature between -5 C and -15 C for 1 to 3 minutes, then cooled to -
196 C to store the cells.
Brief Description of Drawings
Fig. 1 Simulation program user interface
Fig. 2 Cell volume vs temperature at different cooling rates
Fig. 3 Maximum supercooling and maximum [KC1] as a function of
cooling rate
Fig. 6 TF-1 cell volume distribution
Fig. 7 Boyle van't Hoff plot of TF-1 cells
Fig. 8 Cell volume kinetics of TF-t cells in hypertonic solutions
Fig. 9 Arrhenius plot of TF-I cells
Fig. 10 chematic of CryoSim5 program
Fig. 11 raded freezing cooling profiles of TF-1 cells
Fig. 12 Simulated cell volume kinetics of TF-1 cells
Fig. 13 Simulated supercooling kinetics of TF-1 cells during graded
freezing
Fig. 14 Simulated [KCII kinetics of TF-1 cells during graded freezing
CA 02482045 2004-09-17
7
Fig. 15 Simulated maximum supercooling of TF-1 cells using various
cooling rates
Fig. 16 Simulated maximum [KCI]i of TF-1 cells using various cooling
rates
Fig. 17 Membrane integrity of TF-1 cells in 10% DMSO
Fig. 18 Membrane integrity of TF-1 cells using 0.2 C/rain
Fig. 19 Membrane integrity of TF-1 cells using 0.5 C/min
Fig. 20 Membrane integrity of TF-1 cells using 0.9 C/rain
Fig. 21 Experimental determination of two-step cooling profiles
Fig. 22 Simulations of two-step cooling profiles of TF-1 cells
Fig. 23 Simulated cell volume kinetics of TF-1 cells
Fig. 24 Simulated supercooling kinetics of TF-1 cells during two-step
freezing
Fig. 25 Simulated {Kali kinetics of TF-1 cells during two-step freezing
Fig. 26 Simulated maximum supercooling and [KCI]i of TF-1 cells held
for various durations
Fig. 27 Simulations of optimal plunge temperatures ranges for TF-1
cells cooled using two-step freezing
Fig. 28 Membrane integrity of TF-1 cells using 3 minutes hold time
CA 02482045 2004-09-17
- 8 -
Fig. 29 Membrane integrity of TF-1 cells held at -5 C and -25 C for
various durations
Fig. 30 Contours of membrane integrity of TF-1 cells using two-step
freezing for various durations
Detailed Description of the Invention
Throughout the following description, specific details are set forth in
order to provide a more thorough understanding of the invention.
However, the invention may be practiced without these particulars. In
other instances, well known elements have not been shown or described
in detail to avoid unnecessarily obscuring the invention. Accordingly, the
specification and drawings are to be regarded in an illustrative, rather
than a restrictive, sense.
This invention relates to a non-linear cryopreservation protocol for
cryopreserving cells comprising determining an optimal cooling profile
for maximum recovery of the cells and applying the cooling profile to the
cells. The optimal cooling profile is determined using a simulation of
cellular responses to cooling parameters. The cooling parameters
comprise cell temperature, duration of temperature exposure, cooling
level, cooling rate and presence or absence of cryopreservants. The
cellular responses are determined from mathematical models of
extracellular concentration parameters, intracellular concentration
parameters, and cellular osmotic permeability parameters.
The cryopreservation protocol can be used with cells stored without
CA 02482045 2004-09-17
9
cryopreservants. The protocol can also be used with cells stored with
cryopreservants, including non-penetrating cryopreservants. Such non-
penetrating cryopreservants include sugars, starches, serum, or plasma.
The invention can be applied to any types of cells, including stem cells,
other progenitor cells, red and white blood cells, sperm cells, oocytes,
ova, cells for research or transplant purposes, and cellular materials
derived from tissues and organs (including but not limited to pancreatic
islet cells, chondrocytes, cells of neural origin, cells of hepatic origin,
and cells of cardiac origin). Throughout this application, cells include
cells organized as tissues. Stem cells include human peripheral blood
stem cells, human umbilical cord blood stem cells and stern cells
derived from tissues and solid organs or other sources, including fetal
and or embryonic sources. The invention is not limited to human cell
types and is extendable to all mammalian and non-mammalian species.In
one embodiment of the invention, the non-linear cryopreservation
protocol comprises cooling the cells to a first temperature for a first
period of time, then cooling the cells to a storage temperature for a
second period of time prior to thawing.
In another embodiment of the invention, the non-linear cryopreservation
protocol can be executed on cells using a bulk freezing unit or a
cryomicroscopy apparatus. The invention also relates to methods of
optimizing cryopreservation protocols by determining an optimal
cooling profile and applying the profile to cryopreservation protocols.
The invention also relates to cryopreservation protocols optimized by
the method of the invention.
CA 02482045 2004-09-17
- 10 -
The invention also relates to non-linear cryopreserving protocols for
cryopreserving stem cells
In a specific embodiment of the invention, the method of cryopreserving
stem cells comprises cooling the stern cells to a first temperature for a
first period of time, then cooling the cells to a second temperature for
storing the stem cells. In one embodiment, the stem cells are cooled to
a temperature between -5 C and -15 C for 1 to 3 minutes, then cooled
to -196 C to store the cells. =
Description of Simulation Tool
Reports of high cell recovery in the absence of permeating
cryopreservants such as DMS0 (J. Farrant et al., 1974) indicate that it
is feasible to eliminate such cryopreservants from cryopreservation
protocols. Instead of using cryopreservants to alter the properties of
solutions so that cells may be cooled at a constant rate (normally
1 C/min) and achieve high recovery, in one aspect of the invention, the
inventors' recent approach (Ross-Rodriguez, 2003(a); Ross-Rodriguez,
2003(b)) has been to use the properties of the intracellular and
extracellular solutions of subject cells to design optimal
cryopreservation protocols. A novel aspect of this approach is that the
temperature profile is not constrained to be linear. Rather, the
intracellular and extracellular solution properties, along with cellular
osmotic properties, are used to generate a temperature profile that
minimizes cryoinjury.
CA 02482045 2004-09-17
Al
During the course of the inventors' research on cryoinjury and
cryoprotection, the inventors have developed a mathematical model of
cellular osmotic responses at low temperatures using real (nondilute)
solutions assumptions for both the carrier solution and the cellular
cytoplasm (McGann and Elliott, 2003). In one embodiment of the
invention, this model has been implemented in a computer program as a
simulation tool to calculate intracellular and extracellular parameters and
properties as the temperature changes and ice forms or melts in the
cells. The simulation tool generates an ideal temperature range and
duration range for cooling the cells and obtaining optimal recovery of
the cells upon thawing. The tool can be applied to any cell type by
measuring appropriate parameters of the cells.
In some embodiments of the invention, simulations are based on
changes in the composition of the extracellular solution as water is
converted to ice during cooling, and the osmotic responses of cells to
these changes.
a) Features of the Simulation
This simulation uses nondilute solution equations in the calculations, and
allows accommodation of the contribution of proteins to the solution
properties of the cytoplasm. In one embodiment, the program calculates
cellular responses based on a programmed temperature profile generated
by specifying rates of temperature change, or by providing measured
temperature profiles to simulate real cryopreservation systems. In a
second embodiment, the program allows imposition of specific design
CA 02482045 2004-09-17
- 12 -
criteria, including the calculation of a cooling profile that maintains a
constant level of cooling in the cell, thereby minimizing exposure to the
environment of concentrated solutions.
b) Determination of Solution Properties
Since dilute solution assumptions do not apply as solutes concentrate in
both the extracellular and intracellular compartments, nondilute
descriptions of the solution properties have been utilized. The inventors
have found the osmotic virial equation to be simple yet sufficient for
many biological aqueous solutions. The osmotic virial equation was fit
to published or measured data on freezing point as a function of
concentration, and used in the simulations to describe the freezing point
(TFp) of binary solutions, taking into account the non-ideal behaviour of
real solutes:
Tpp=1C1.(m+ B2 *M2 + 133 M3 ) (1)
where m is the molality of the solute, and K1, B2 and B3 are fitting
constants for specific solutes in water. For electrolytes, the molality is
multiplied by a dissociation parameter. The constant B3 is non-zero only
for solutes with highly nonlinear behaviours, such as polymers. The
following relationship was used to calculate freezing point depressions
in solutions containing multiple (n) solutes (at most one of which has
non-zero B3);
TFF Ki=I + B21 = lie B31 = ne I [(B21 B2 j ) = MI = in) I
(2)
1=1 pi_ j=1+1 n
CA 02482045 2004-09-17
13
The last term uses Guggenheim's naive approximation to describe
interactions between solutes in the solution (Elliot et al, Cryobiology
2002). In these simulations, it was assumed that the primary
intracellular electrolyte is potassium chloride, and the primary
extracellular electrolyte is sodium chloride. Proteins and starches exhibit
highly nonlinear freezing point depression as the concentration
increases, so the value of B3 in equation (2) is significant. In one case,
the inventors found it necessary to include intracellular protein to more
accurately describe the cytoplasm as the solution concentrates in the
presence of ice (Ross-Rodriguez, 2003(a)).
c) Osmotic Transport of Water and Solutes
The Johnson & Wilson model (Johnson and Wilson, 1967) was used to
describe coupled water and solute transport across the plasma
membrane:
dV
dt = p = 24. R=T = g õe)+ o- õ 711)]
n (3)
dS\ dV
= 13, = kAc,)+kl- cr õ)=C' õ = --
dt dt
where V is cell volume at time t, Lp is membrane hydraulic conductivity,
A is surface area of the cell, R is the gas constant, T is absolute
temperature, is osmolality, and is the Staverman reflection
coefficient. Superscripts i and e refer to the intracellular and
extracellular compartments, respectively, and the subscripts n and s
refer to nonpermeating and permeating solutes. S is the moles of solute,
CA 02482045 2004-09-17
- 14 -
Ps is the solute permeability, Cs is the difference in solute concentration
across the membrane, and Cis is the mean solute concentration.
d) Temperature Dependence of Osmotic Parameters
The Arrhenius equation was used to describe the temperature
dependence of the osmotic permeability parameters.
E [1
Lp= Lpg' e (4)
where r.,õ is the hydraulic conductivity at any temperature T, Lpg is the
hydraulic conductivity at a reference temperature Tg, Ea is the activation
energy and R is the gas constant. A similar Arrhenius equation was used
to describe the temperature dependence of the solute permeability.
Equations (1) and (2) can be made more complex as needed by using
other solution thermodynamics equations from the literature. In
addition, equation (2) can be expanded to the case of multiple
components with non-zero B3 's by adding a term, or terms analogous to
the second order last term of equation (2), but of appropriate order.
There are many equations, both in the literature and to be derived in the
future based on physical analysis, that can replace equation (3).
e) Computer Program for Simulation of Cellular Low Temperature
Responses
A computer program was developed (using the Delphi programming
language) to perform the simulations based on either calculated or
CA 02482045 2004-09-17
measured temperature profiles. The program also includes a function to
generate the temperature profile required to maintain the cytoplasm at a
constant level of cooling. Parameters for equation (1) to describe
solution properties for a variety of solutes are read from data files. In
addition to the resulting temperature profile, all calculated parameters
are reported as a function of time to allow access to both intracellular
and extracellular concentrations and fluxes.
Figure 1 shows the user interface of the program to illustrate the input
parameters.
The sample output in Figure 2 shows calculated cell volumes as a
function of temperature during cooling at different rates.
j) Predictors of Cryoinjury
Based on Mazur's two-factor hypothesis (Mazur et al., 1972), the
inventors used the amount of cooling as a predictor of cryoinjury related
to intracellular ice formation, and the intracellular KC1 concentration as
a predictor for cryoinjury related to exposure to concentrated solutions.
Simulations allow determination of the maximum cooling and maximum
intracellular KC1 concentration in cells cooled at different rates down to
-40 C, as shown in Figure 3.
Application of Method to Different Cell Types
The invention can be applied to any types of cells, including stem cells,
other progenitor cells, red and white blood cells, sperm cells, oocytes,
ova, cells for research or transplant purposes, and cellular materials
CA 02482045 2004-09-17
- 16 -
derived from tissues and organs (including but not limited to pancreatic
islet cells, chondrocytes, cells of neural origin, cells of hepatic origin,
and cells of cardiac origin). Stem cells include human peripheral blood
stem cells, human umbilical cord blood stem cells and stem cells
derived from tissues and solid organs or other sources, including fetal
and or embryonic sources. The invention is not limited to human cell
types and is extendable to all mammalian and non-mammalian species.
Applications of this invention to different cell types utilizes information
on various cell parameters, including the osmotic permeability
parameters and their temperature dependencies, solution properties of
the cytoplasm, and the relationship between intracellular cooling and
intracellular freezing of different cell types. Some of these properties
will not change significantly between different stem cells. Solution
properties, for example, depend primarily on the concentrations of
electrolytes and proteins, which are similar for various types of cells.
Similarly, the incidence of intracellular freezing as a function of cooling
is likely to be similar for different types of cells since there are likely
similar mechanisms of ice nucleation in cells, whether ice is initiated by
spontaneous nucleation in the cells, through aqueous pores in the plasma
membrane (Acker et al., 2001), by surface-catalyzed nucleation (Toner,
1993), or by osmotic rupture of the plasma membrane (Muldew K. and
McGann LE., Biophysical Journal 66(2 Pt 1): 532-541, Feb. 1941).
Conversely, the osmotic permeability parameters and their activation
energies depend strongly on cell type and stage of differentiation
(McGrath, 1988).
CA 02482045 2004-09-17
17
Obtaining Cellular Osmotic Properties
Cellular osmotic properties can be obtained from the literature (see for
example Gao et al., 1998 and Hunt et al., 2003). For cell types whose
osmotic properties have not yet been published, the osmotic properties
can be measured as described by the inventors in the examples and in
the literature (Ross-Rodriguez, 2003(a)).
Measuring Solution Properties
Calculations of osmotic transport at low temperatures require
descriptions of the intracellular and extracellular solutions. Phase
diagrams of even binary solutions show that solution behaviour over the
range of temperature between freezing and -40 C is nonlinear, so an
assumption of dilute solutions is inappropriate. The constants in
equation (1) or other equations that describe nondilute behaviour are
therefore required for the major intracellular and extracellular solutes.
This information has been gathered from the literature and from the
inventors' own previous experimental measurements. Intracellular and
extracellular solute information for cell types can be gathered
empirically according to experiments conducted by the inventors
(McGann et al., Medical and Biological Engineering and Computing,
20(1):117-20, January 1982; McGann et al., Journal of Orthopaedic
Research, 6(1): 10945, 1988; Toupin et al., Cryobiology, 26(5): 431-
44, Oct. 1989; Liu et al., Cryobiology, 32(5): 493-502, Oct. 1995;
Gilmore et al., Animal Reproduction Science, 53(1-4): 277-297, Oct.
1998).
CA 02482045 2004-09-17
- 18 -
In some embodiments of the invention, the inventors used proteins in
cells with solution properties published for hemoglobin. In addition,
fluorescent quenching (Liu et al., 2002) can be used to measure
intracellular water volume as a function of extracellular osmolality.
Also, electron spin resonance, or any other technique for specifically
measuring concentration in the intracellular aqueous solution can be
used to make the same measurement (Elliot et al., Cryobiology 2002).
These data allow calculation of the parameters in equation (1) for the
cytoplasm. Fluorescent quenching is a relatively simple technique, so,
by its application to various cell types, it can be demonstrated that
solution properties of the cytoplasm do not vary significantly between
types of nucleated mammalian cells.
Monitoring Ciyoinjury
Three in vitro methods can be applied to assess stem cell recovery after
experimental treatment and to fine tune temperatures and hold times. In
one embodiment, the simplest method is a single-platform viability
assessment for cells that also accounts for cells lost during treatment
(Yang et al., 2001). This technique, which uses 7-AAD (Molecular
Probes) as the viability indicator based on membrane integrity, has been
developed and implemented in routine assessment of peripheral blood
stem cells cryopreserved for transplantation (Yang, 2003). A metabolic
assay, alamarBlue (Biosource International) that the inventors have used
previously with other cellular systems (Acker and McGann, 2001), can
be used to assess metabolic function after experimental treatment. The
third assay is the standard colony growth in methycellulose to assess the
CA 02482045 2004-09-17
19
ability of cells to divide and differentiate in culture. The inventors'
technique for colony growth accommodates for loss of cells during
experimental treatment (Yang, 2003).
Infusible Extracelltdar Compounds
The inventors demonstrate that temperature profiles can be generated to
avoid intracellular freezing and to reduce cryoinjury related to exposure
to high concentrations of solutes, similar to results for human
lymphocytes (Farrant et al., 1974). However, it may not be possible to
simultaneously meet these criteria for some cells, i.e. conditions
required to avoid intracellular freezing may already subject the cells to
lethal exposure to the solution. In this case the inventors suggest use of
infusible extracellular compounds, including sugars, starches, such as
Pentastarch, serum, or plasma to modify the extracellular solution
properties thereby reducing the temperature of exposure of cells to the
increased electrolyte concentrations.
Cryopreservation Protocol for Stem Cells
A 2-step freezing protocol used by Farrant et al. to obtain high recovery
of human lymphocytes cryopreserved in serum alone (Farrant et al.,
1974) was optimized using simulation of a stem cell line (TF-1 cells, a
hematopoietic stem cell line) without cryoprotectant (Ross-Rodriguez,
2003) and validated using experimental measurements of post-thaw cell
recovery. Osmotic permeability parameters were measured for the TF-1
cells and used in simulations of the 2-step cooling protocol. Maximum
cooling to -40 C was used as an indicator of intracellular freezing, and
CA 02482045 2004-09-17
- 20 -
maximum intracellular potassium chloride concentration used as an
indicator of cryoinjury due to exposure to the concentrated solutes.
Maximum values from the simulation indicated the range of hold
temperatures where cell recovery was expected to be maximal in the
absence of cryoprotectants.
Experimental measurement of TF-1 cell recovery using membrane
integrity showed maximal recovery in the intermediate temperature
range predicted by the simulations and low recovery at intermediate
temperatures outside the predicted range. The maximum recovery of
TF-1 cells without cryoprotectant thawed from -196 C was equivalent to
the recovery after conventional cryopreservation (cooling at 1 C/min in
the presence of 10% DMSO). In a specific embodiment, the zone of
plung temperatures (-5 C to -15 C), when held for 1-3 minutes, confer
comparable protection against injury (approximately 60% viability) to
the standard 10% DMSO solution (63.7 9.8%).
Results of these experiments supported the concept of using theoretical
indicators of cryoinjury in the use of simulations to reduce empirical
experimentation in optimization of cryopreservation protocols. These
results also demonstrate the value of simulations to be used in protocol
design.
Examples
The following examples are intended to illustrate various embodiments
of the invention and are intended to be interpreted in a non-limiting
sense.
CA 02482045 2004-09-17
21
Example 1: Determination of cellular osmotic parameters a TF-1 cells
1.1 Introduction
Osmotic responses of cells to the formation of ice in the
surrounding solution are largely dependent on the movement of water
across the plasma membrane (Mazur, 1965). The formation of
extracellular ice and the resulting increase in extracellular solute
concentration, impose osmotic stresses on the cell (Mazur, 1972). The
osmotic parameters governing the movement of water across the
membrane are specific to each cell type. Thus different cells respond
differently to anisotonic conditions. The movement of water across the
membrane is faster than the movement of solutes and is the result of
simple diffusion of water molecules across the plasma membrane or the
result of water movement through water channels or aquaporins. A
significant amount of the cell volume is comprised of water therefore
water movement determines the cell volume. The net water movement is
described using the osmotic parameters of the cell membrane.
The Osmotic parameters, which govern water movement, are the
hydraulic conductivity, the osmotically-inactive fraction and the
Arrhenius activation energy. The hydraulic conductivity (Lp) denotes
water transport across the cell membrane and thus the cell volume. Lp is a
function of the rate at which water moves across the cell membrane.
Jacobs and Stewart (Jacobs, 1932) uses the following equation, which
describes the rate of cell volume change in =isotonic solutions as a
function of
CA 02482045 2004-09-17
- 22 -
Lp ( m/min/atm) :
ciV
¨ = Lp = A = R = T (7- c ¨ r e) (1)
dt
where V is the cell volume (111113), t is the time (min), A is the cell
surface
area (iun2), R is the universal gas constant (kcal/mol/K), T is the absolute
temperature (K), ne is the extracellular osmolality (osmoles) and it is the
intracellular osmolality (osmoles). The Boyle van't Hoff relationship
expresses equilibrium cell volume in solutions of impermeant solutes:
rc
(2)
VISO ir
where Veq is the equilibrium volume (.tm3), Viso is the isotonic volume
/ 3\
), no is the isotonic osmolality (osmoles), it is the experimental
osmolality (osmoles), and vb is the osmotically-inactive fraction.
Through graphical analysis of Veq/Viso as a function of noht, vb can be
determined by extrapolating the line by linear regression to the y-
intercept.
The movement of water across the cell membrane is temperature
dependent. The Arrhenius activation energy (Ea) for Li, is normally used
to describe the temperature dependence of the hydraulic conductivity
(Woods, 2000). E. (kcal/mol) can be determined using the slope of the
Antenius plot of the natural logarithm of L as a function of the inverse
absolute temperature (K):
CA 02482045 2004-09-17
23
¨ E
Lp k = exp(----2-R) (3)
=T
where k is a fitting constant, R is the universal gas constant (kcal/mol/K)
and T is the absolute temperature (K). Osmotic parameters are useful for
computer simulations which model changes in cell volume at low
temperatures and which could eventually be applied to more complex
systems, such as tissues.
An electronic particle counter was used to monitor cell volume as a
function of time for cells exposed to hypertonic solutions. In the past,
electronic particle counters have been used for a variety of cell types:
lymphocytes (Hempling, 1977); chonclrocytes (McGann, 1988);
pancreatic islet cells (Liu, 1995; Woods, 1999); human corneal
endothelial, stoma, and epithelial cells (Ebertz, 2002) and selected
African mammalian spermatozoa (Gilmore, 1998). As cells pass through
the aperture of the electronic particle counter a volume of conducting
fluid is displaced resulting in a current pulse, which is proportional to the
cell volume. In kinetic studies, sequential measurements of cell volumes
allow for the determination of cell permeability characteristics by fitting
the experimental data with theoretical models. An electronic particle
counter allows permeability characteristics to be obtained for osmotically
slow responding cells (Acker, 1999). A computer interfaced to a particle
counter can record the volume and time of measurements, so the time
evolution of cell volume distribution can be monitored. Another
technique using optical measurements has also been used to study
osmotic responses of other cell types (Armitage, 1984; Gao, 1994; Rube!,
1999). Acker et al. compared the two techniques and determined that
CA 02482045 2004-09-17
- 24 -
even though there are no direct measurements of single cell volumes
using an electronic particle counter, there was no significant difference in
cell volume measurements between the two techniques (Acker, 1999).
The electronic particle counter method was used in these experiments
because it provides rapid and reproducible data collection for analysis of
a population of cells in one experiment, as opposed to multiple single-cell
analyses required by optical measurements.
The objective of this example was to use an electronic particle
counter fitted with a cell size analyzer, to measure changes in cell volume
as a function of time while exposing the cells to hypertonic solutions for
TF-1 cells, as a model for hematopoietic stem cells (HSC) (Kitamura,
1989(a); Kitamura 1989(b); Marone, 2002). The osmotic parameters and
temperature dependencies were then calculated from the volume
measurements.
1.2 Materials & Methods
TF-1 cell culture
TF-1 cells (ATCC, Manassas, Virginia) were cultured at 37 C in
5% CO2 in RPMI 1640 Medium Modified (ATCC) with 10% fetal bovine
serum (FBS) (ATCC), and supplemented with 2 ng/mL recombinant
human GM-CSF (Stemcell Technologies, Vancouver, Canada). Cells
were cultured at a concentration between 0.1 x 10⁶ and 1 x 10⁶ cells/mL,
according to ATCC guidelines. Prior to experiments, cells were washed
twice with serum-free RPMI media and incubated overnight. TF-1 cells
cultured in RPMI without FBS and GM-C SF overnight accumulate in the
CA 02482045 2004-09-17
G1/G0 phase of the cell cycle (KoIonics, 2001), resulting in a more
uniform cell =size distribution. Cells were then centrifuged and re-
suspended in serum-free RPMI at 4 x 10⁶ cells/mL for osmotic
measurements.
Experimental solutions
Various concentrations of phosphate-buffered saline (PBS) were
used to examine the concentration-dependence of the hydraulic
conductivity and the osmotically-inactive fraction. PBS solutions (1-5X)
were made by diluting 10X PBS (GII3CO) with distilled water to final
osmolalities of 291 6, 583 25, 861 22, 1150 17 and 1434 20 mOsm/kg
respectively.
Osmolalities were measured using a freezing-point
depression Osmometer (Precision Systems Inc., Natick, Massachusetts),
which was calibrated using 100, 300 and 500 mOsm/kg osmometry
standards (Precision Systems Inc.).
Measurements of cell volumes
The Coulter counter (ZI31, Coulter Inc., Hialeah, Florida), fitted
with a pulse-height analyzer (The Great Canadian Computer Company,
Spruce Grove, AB, Canada) was used to monitor cell volume as a
function of time as cells passed through the 100 inn aperture (Grover,
1969(a); Grover, 1969(b); McGann, 1982). This system has been
previously used to monitor changes in cell volume for a variety of cells in
suspension (Armitage, 1984; Benson, 1998; Ebertz, 2002; Hempling,
1997; Liu, 1995; Mazur, 1986; McGann, 1981; Woods, 1999; Zierger,
CA 02482045 2004-09-17
- 26 -
1999), including hematopoietic stein cells (Gao, 1998; Hubel, 1999;
McGann, 1987; Woods, 2000).
TF-1 cells (150-200 piL) were injected into well-mixed hypertonic
experimental solutions (10 mL). Experimental solutions were maintained
at experimental temperatures using a circulating water bath with a custom
insulated jacket. The current pulses proportional to the cell volumes were
measured and the time recorded as the cells passed through the aperture
of the Coulter counter. Experimental temperatures were measured at
4.6 0.7, 4.8 0.6, 8.1 0.7, 11.1 0.6, 12.9 1.4, 16.4 0.5, 19.4 0.8,
23.3 1.2, 28.8 0.6, and 37.4 0.8 C using a Digi-Sense thermocouple
thermometer (Cole Parmer, Anjou, Canada). For each experiment, three
replicates were performed for each solution at each temperature. The
experiments were repeated a minimum of three times using cells from
different passages. Latex beads (15 im diameter; Beckman Coulter,
Miami, Florida) were used as calibrators to convert relative volumes to
actual volumes in 1X PBS and in the experimental solutions.
Determination of the osmotic parameters
Measurements of cell volumes as a function of time were used to
determine the osmotic parameters. Least squares error fits using EXCEL
Solver, was used to solve for Lip and vb, using equations 1 and 2
respectively. The analysis of the concentration dependence used 2-5X
PBS solutions (583-1434 mOsrn/kg) at temperatures of 4.8 0.6, 12.9 1.4,
23.3 1.2, and 37.4 0.8 C, and additional analysis with temperatures of
4.6 0.7, 8.1 0.7, 11.1 0.6, 16.4 0.5, 19.4 0.8 and 28.8 0.6 C was
CA 02482045 2004-09-17
27
performed for 3X PBS solutions only. Curves were fitted for Lp and Vb
for each experimental solution at each of the experimental temperatures.
The Arrhenius activation energy for Lp, described by equation 3,
was fit for using linear regression of the natural logarithm of Lp as a
function of the inverse absolute temperature in EXCEL.
Statistical analysis
Statistical comparisons used a standard one-way analysis of
variance (ANOVA) at 5% level of significance. Estimates of Lp and vb
were compared between experimental solutions (2-5X PBS) for all the
experimental temperatures.
1.3 Results
Isotonic volume
Figure 6 shows a representative volume distribution of TF-1 cells
under isotonic conditions in 1X PBS (calibration factor=7.8; mean
volume=806.1 gm3 ). The distribution was lognormal and narrow
compared to other cell types, which have a more broad distribution
(unpublished data). This is the result of synchronizing the cells in G0/G1
phases of the cell cycle. For the entire data set, the isotonic volume for
TF-1 cells was 776 36 gm3.
Hydraulic conductivity
Changes in mean cell volume as a function of time were used to
calculate the L. Figure 7 is a representative graph of TF-1 cells exposed
CA 02482045 2004-09-17
- 28 -
to 3X PBS at four different temperatures, which show the increase rate of
cell volume shrinkage at higher temperatures, demonstrating a higher L.
Data from experimental solutions (2-5X PBS) at four different
temperatures (4.8 0.6, 12.9 1.4, 23.3 1.2, and 37.4 0.8 C) were used to
examine the concentration and temperature dependence of L. The
was determined by fitting the data to Equation 1 using the least squares
method with EXCEL Solver for each experimental solution and
temperature and summarized in Table 1. Values for each concentration
were pooled since there was no concentration dependence (p>0.05).
Lp = Temperature
(m/min/atm) 4.84 0.62 C 12.9 1.4 C 23.3
1.2 C 37.4 0.8 C
2X PBS 0.081 0.013 0.122 0.011 0.337 0.061
1.17 0.14
3X PBS 0.079 0.011
0.134 0.020 0.375 0.060 1.39 0.30
4X PBS 0.077 0.008
0.122 0.017 0.428 0.048 1.42 0.28
5X PBS 0.076 0.014
0.119 0.014 0.379 0.036 1.50 0.30
pooled mean 0.078 0.012 0.123 0.015 0.388 0.052 1.36 0.26
TABLE 1. Lp values for TF-1 cells (mean SD); p>0.05 for all values
implying no concentration dependence
Osmotically-inactive fraction
For each sample, vb was fit to Equation 2 using the least-squares
method in EXCEL Solver. Data from temperatures of 4.8 0.6, 12.9 1.4,
23.3 1.2, and 37.4 0.8 C for 2-5X PBS solutions were used in order to
determine the temperature and concentration dependence of vb. The data
CA 02482045 2004-09-17
29
in Table 2 show that the osmotically-inactive fraction was not dependent
on concentration (p>0.05). As a result, overall data for all temperatures
and concentrations were pooled. TF-1 cells had a mean vb of 0.35 0.03.
A Boyle van't Hoff plot of equilibrium volume as a function of inverse
osmolgity for the aggregate data is shown in Figure 8. TF-1 cells
responded as. ideal osmometers over a range of 583-1434 mOsm/kg. The
vb could also be determined by extrapolating the slope back to the y-axis
in which the intercept was 0.37. This value was within the error found
using the least squares method.
Vb Temperature
4.84 0.62 C 12.9 1.4 C 233 1.2 C 37.4 0.8 C
2X PBS 0.398 0.042
0.332 0.058 0.327 0.016 0.321 0.041
3X PBS 0.378 0.040
0.383 0.022 0.348 0.030 0.338 0.050
4X PBS 0.357 0.027 0.376 0.051 0.341 0.018
0.330 0.021
5X PBS 0.361 0.026
0.384 0.058 0.371 0.010 0.313 0.028
pooled mean 0.373 0.034 0.368 0.052 0.347 0.020 0.326 0.037
TABLE 1 vb values for TF-1 cells (mean SD); p>0.05 for all values
implying no concentration dependence
Arrhenius activation energy
The Lp follows the Arrhenius equation over the range of
experimental temperatures. The Arrhenius activation energy of Lp was
determined using pooled data from experiments based on cell volume
kinetics of 2-5X PBS solutions at temperatures 4.8 0.6, 12.9 1.4,
CA 02482045 2004-09-17
- 30 -
23.3+1.2, and 37.4 0.8 C and of 3X PBS solutions at temperatures
4.6 0.7, 8.1 0.7, 11.1 0.6, 16.4 0.5, 19.4 0.8 and 28.8 0.6 C. Figure 9
shows Arrhenius plots of mean Lp values for all the experimental
temperatures examined. The value of Ea for Lp from these data was 13.4
kcal/mol. Figure 9 also demonstrates that the osmotically-inactive
fraction is independent of temperature using linear regression.
1.4 Discussion
The hydraulic conductivity reported in this example was found to
be strongly dependent on all temperatures reported in this example, but
independent of concentration, which has been previously reported for
other cells types (Liu, 1995). The value for Lp was 0.342 wn/min/atm at
20 C. The Lp is within the range reported for mammalian cells, such as
rat megakarycytoporietic cells, Chinese hamster lung fibroblast cells,
bovine immature oocytes, chonch-ocytes, corneal endothelial, epithelial
and stromal cells (McGrath, 1988). The rate of water movement is
considered slow responding, thus the Coulter counter was an efficient
method of monitoring changes in cell volume.
TF-1 cells follow the Boyle van't Hoff relationship and thus the
cells behave as ideal osmometers. The osmotically-inactive fraction can
be determined using the Boyle van't Hoff plot and the least-squares
method. The vb for TF-1 cells was determined as 0.35 0.03 and 0.37,
respectively. The value of vb reported here is within the range for a
variety of mammalian cell types (0.2-0.41) (Ebertz, 2002; Gao, 1998;
Gilmore, 1998; Hempling, 1977; Liu, 1995; McGann, 1981; McGrath,
1988). The
Arrhenius activation energy for Li, of 13.4 kcal/mol
CA 02482045 2004-09-17
31
reported here, is within normal ranges for other types of mammalian cells
(12-16 kcal/mol) (Ebertz, 2002; Hempling, 1977; Liu, 1995). It has been
reported that cells with an Ea of <6 kcal/mol for 4, are fast responding,
and may exhibit channel-mediated water transport (Elmoazzen, 2002).
Also, cells with an Ea >10 kcal/mol for Li), such as the TF-1 cells, are
slow responding and may transport water by solubility-diffusion through
the plasma membrane. The high Ea for Lp indicates that the water
permeability of the plasma membrane of TF-1 cells is highly dependent
on temperature. However, the Ea for Lip alone may not be enough to
negate the presence of aqueous pores and further analysis is required of
slow responding cells to explore the possibility of other types of pores
(Elmoazzen, 2002).
The osmotic parameters reported here for TF4 cells are
comparable with those previously reported for HSCs. The value reported
here for Lp is comparable with the L previously reported for cord blood
CD34+ cells of 0.168 0.03 j.tm/atm/min at 20 C (Hunt, 2003), indicating
that the rate of water movement is similar for TF-1 cells and for other
HSC. Based on Lp values reported by Hunt et al. at two temperatures
(Hunt, 2003), Ea for Li, in cord blood CD34+ cells were calculated to be
18.8 kcal/mol. The Ea for Lp also denotes a slow-responding cell. The vb
is comparable to that previously reported for both bone marrow
hematopoietic CD34+ cells of 0.205 (Gao, 1998) and umbilical cord
blood CD34+ cells of 0.32 (Hunt, 2003) and 0.27 0.01 (Hunt, 2003). The
average size of TF-1 cells (776 36 m3) was higher than that previously
reported for both bone marrow CD34+ cells of 345 m3 (Gao, 1998) and
umbilical cord blood CD34+ cells of 274 13 inn3 (Hunt, 2003). This
CA 02482045 2004-09-17
- 32 -
indicates that although there are differences in cell volume between TF-1
cells and CD34+ cells from patient samples, the osmotic parameters for
both cell types are comparable.
The parameters determined in this example are sufficient to be
used in the mathematical analysis of the TF-1 cellular responses to low
temperatures and ultimately in designing a cryopreservation procedure
specific to these cells. The parameters summarized in Table 3 were
subsequently used in simulations described in Example 2. The
simulations model the cellular responses to ice formation in the
extracellular solution based on how the cells responded osmotically to
hypertonic solutions. It is also possible to use the osmotic parameters
from other cell types to model their cellular response to low temperatures.
Isotonic Volume 776 m3
Inactive Fraction 0.350
Lp (20 C) 0342 pm/min/atm
Activation Energy for Lp 13.4 kcal/mol
Isotonic osmolality 0.301 osm/kg
TABLE 3. Osmotic parameters for IF-1 cells used in simulations.
CA 02482045 2004-09-17
33
Example 2: Simulations of cellular responses to low temperatures
2.1 Introduction
The freezing of cells in suspension has largely been approached
empirically. However, simulations have been used to mathematically
predict cellular responses to low temperatures for a variety of cell types:
bovine erythrocytes (Leibo, 1976); yeast (Schwartz, 1983); hamster ova
(Shabana, 1988); hamster pancreatic islet cells (Liu, 1995); and epithelial,
endothelial and stroma cells (Ebertz, 2002). Modeling is based on the
theoretical response of the cell to a changing extracellular environment.
The cellular responses to the formation of extracellular ice in surrounding
solution are largely dependent on the movement of water across the
plasma membrane.
Extracellular ice formation increases the
concentration of solutes in the residual liquid, resulting in osmotic efflux
of water from the cell. The properties of the cell membrane, specifically
the osmotic parameters, govern the rate of change of cell volume.
Osmotic parameters can be used in simulations to theoretically model
cellular responses to low temperatures.
Simulations reduce the time and expense involved with empirical
experiments. Simulations also provide a means to analyze changes in cell
volume prior to empirical experimentation. Simulations provide insight
into intracellular osmolalities, concentrations and rates of water
movement. These results can then be used for comparisons between
cryopreservation protocols and for comparison between different cell
types which may be necessary if attempting to cryopreserve a
heterogeneous cell population or a tissue. Ultimately, simulations allow
CA 02482045 2004-09-17
- 34 -
for unlimited theoretical protocols to be explored by controlling cooling
and warming rate, experimental temperatures, and the components of the
intracellular and extracellular compartments for any cell type for which
the osmotic parameters are known.
Mazur has previously used simulations to explore the effects of
solutions, osmotics and temperatures on cellular systems (Mazur, 1963).
Mazur reported the rate of water loss from the cell and the change in
permeability with temperature as the parameters necessary to predict
changes in volume of intracellular water with temperature. Furthermore,
predictions about the probability of intracellular ice formation can be
made based on the amount of intracellular water and the temperature of
the cell. Subsequently, Mazur indicated that rates greater than 1 C/min
may generate a supercooled cytoplasm in yeast (Mazur, 1963; Mazur,
1977). Supercooling is the amount a solution can be cooled below its
freezing point without ice forming and it used as an indicator of the
potential for intracellular ice formation (Mazur, 1972). Intracellular
supercooling is the extent to which a cell is cooled below the phase-
change temperature before the formation of intracellular ice. Mazur also
reported that there was a 10 C limit to supercooling above which the risk
of intracellular ice is increased (Mazur, 1963; Mazur, 1977). Cooling
rates of approximately 1 C/min should reduce the amount of
supercooling therefore they reduce the risk of intracellular ice. Diller
further examined the probability of intracellular ice formation based on
the synergistic interaction of cooling rates and supercooling Diller,
1975). During cooling, the cell attempts to maintain equilibrium across
the plasma membrane either through osmotic dehydration or the
CA 02482045 2004-09-17
formation of ice. Therefore, with no supercooling, there is a high
probability that the cell will dehydrate; whereas with greater than 10 C
supercooling, the cell may form intracellular ice (Diller, 1975). Ebertz
also reported the use of supercooling as an indicator for intracellular ice
formation for simulations on corneal endothelial, epithelial and stromal
cells (Diller, 1975).
Based on Mazur et al.'s 'two-factor hypothesis', solution effects
injury must also be considered along with intracellular ice formation
injury, when attempting to determine the optimal cooling rate for
cryopreserving a cell type (Mazur, 1972). During slow cooling, cell
injury is due to prolonged exposure to high solute concentrations, as a
result of cell dehydration due to extracellular ice formation. This work
represents a novel approach of combining supercooling with intracellular
electrolyte concentration in the presence of extracellular ice, to use as
indicators of cryoinjury.
The objective of these simulations was to theoretically determine
the cellular responses of TF-1 cells at various stages of the graded
freezing protocol for comparison with experimental data. Simulations
were performed using the osmotic parameters of TF-1 cells reported in
Example 1 (Table 3). Maximum levels of intracellular electrolyte
concentrations ([KCl]1) and of supercooling were examined upon cooling
the cells to -40 C, as indicators for solution effects injury and
intracellular ice formation injury, respectively.
CA 02482045 2004-09-17
-36-
2.2 Calculations of low-temperature responses
Methods
The CryoSim5 program (Dr. Locksley McGann, University of
Alberta, Canada) was used to perform the simulations and Figure
is a representative image of the program interface. The program uses
the phase diagrams of the components of the intracellular and
extracellular solutions, the osmotic characteristics of the cell membrane
and the temperature dependencies of the parameters. The simulations are
calculations of the cellular osmotic responses to the concentration of
solutes in the residual liquid in the presence of ice at low temperatures.
Ice nucleation is assumed to be at the freezing point of the extracellular
solution. Phase diagrams were used to calculate concentrations in the
liquid phase for sodium chloride (NaC1)-H20 (Wolf, 1982) and potassium
chloride (KCI)-H20 (Wolf, 1982) for the extracellular and intracellular
compartments, respectively. The amount of intracellular protein has been
reported to be more than half the dry weight of the cell (Alberts, 1994). It
has also been reported that red blood cells possess approximately 0.0073
mol of hemoglobin per kg of intracellular water (7.3 mmolal) (Dick,
1958; Savitz, 1964; Williams, 1959). Since the intracellular protein
content is unknown for TF-1 cells to the inventors' knowledge, the
inventors used half the molality of hemoglobin in red blood cells (3.65
mmolal) for the simulations. The hydraulic conductivity (Lp) was used
to calculate osmotic cellular responses to changes in the extracellular
conditions. The Arrhenius activation energy (Ea) for Lp was used to
describe the temperature dependency of hydraulic conductivity. The
CA 02482045 2004-09-17
37
numerical values of the hydraulic conductivity and the Ea for Lp from
Example 1 (Table 3), were extrapolated to lower subzero temperatures.
Temperature profiles
To explore the role of low and high cooling rates typically used to
cryopreserve cells, the inventors simulated the empirical procedure of the
graded freezing protocols. Graded freezing provides insights into the two
types of freezing injury which can affect cell recovery: solution effects
and intracellular ice formation (McGann, 1979). The graded freezing
technique involved cooling (ie. 1 C/min) the samples to various subzero
temperatures before being either thawed directly in a 37 C water bath or
plunged into liquid nitrogen first and then thawed (McGann, 1979). With
this procedure it is possible to separate injury sustained during the initial
cooling phase to subzero experimental temperatures, from that sustained
upon further cooling to storage temperatures. Various cooling rates can
also be used to explore the effect of time spent during cooling on cell
recovery.
Simulations were performed in which cells with no
cryopreservant were cooled to various subzero temperatures ranging from
-4 C to -30 C at cooling rates ranging from
0.2 C/min to 100 Chnin, prior to being plunged to -40 C at 325 C/min to
model graded freezing (Ebertz, 2002(a)).
In the experimental procedure, the samples are first placed in a -
3 C methanol bath from 0 C and allowed to equilibrate prior further
cooling to the various experimental subzero temperatures. The
temperature profile of this equilibration is governed by Fourier's Law.
CA 02482045 2004-09-17
- 38 -
Fourier's Law describes the rate of heat transfer which depends on the
temperature distribution of the system (Incropera, 2002):
dT
= k AT
dt (1)
where dT/dt is the rate of change in temperature of the sample with time,
k is the fitting constant, and AT is the difference in temperature between
the bath and the sample. The constant was determined by monitoring the
cooling profile of a sample taken from 0 C and placed in a -3 C methanol
bath with a Type T thermocouple (Omega, Laval, Canada). This profile
was then fitted to a curve using equation 1. The constant was then used
in simulations to model the equilibration step of the graded freezing
procedure. Simulating the equilibration step using Fourier's Law is a
novel approach.
2.3 Results
Cooling profiles
Cells were cooled to -3 C from 0 C (k=7) and then cooled at 0.2,
0.5, 1.0; 5.0, 10, 20, or 100 C/min to plunge temperatures ranging from -
4 C to -30 C, prior to being cooled rapidly to -40 C. Figure 11 is a
representative temperature cooling profile for equilibration and cooling at
1 C/min to various subzero experimental temperatures. The cooling
profiles were similar for all cooling rates except that the length of time
needed to reach the intermediate temperatures decreased with increasing
cooling rate.
CA 02482045 2004-09-17
39
Cell volume during cooling
Figure 12 is a representative graph for 1 C/min demonstrating the
changes in cell volume as a function of temperature. The data showed
that cells did not reach the same volume when cooled to -3 C prior to
rapid cooling to
-40 C, as did cells cooled to other subzero temperatures. The cell
volumes for the other temperatures were very close to the values obtained
for -30 C, which was the minimal cell volume recorded. This may
indicate that cells cooled to
-3 C may have a greater amount of supercooling at low subzero
temperatures due to the higher water content than cells cooled to the other
temperatures. The results not shown for 0.2 and 0.5 C/min demonstrated
similar changes in cell volume. The results not shown for 1.0, 5.0, 10,
20, or 100 C/min demonstrated less of a reduction in cell volume when
cooled to the subzero temperatures.
Supercooling & 11(Cl1 during cooling
Supercooling was calculated in cells cooled to the plunge
temperatures prior to being plunged to -40 C (325 C/min) for all cooling
rates. A representative graph demonstrating supercooling as a function
of temperature for cells cooled at 1 C/min is shown in Figure 13a. At
low cooling rates, supercooling is greater than 10 C for cells initially
cooled to -3 C prior to plunging. Also, at the higher cooling rates such as
100 C/min, supercooling was also seen at plunge temperatures of -6 C
through -12 C, respectively (data shown for 100 C/min in Figure 13b).
CA 02482045 2004-09-17
- 40 -
A representative graph demonstrating [KCl] as a function of
temperature for cells cooled at 1 C/min is shown in Figure 14a. Cells
cooled to increasingly lower subzero plunge temperatures showed
increasing concentrations of [KCl]1, with the highest concentration for
cells cooled to -30 C at 1 C/min. This correlates with the decrease in cell
volume reported in the previous section. This gradual increase in [KCl]1
demonstrates the potential for increased solution effects upon cooling to
the lower subzero temperatures. Results for 0.2 C/min and 0.5 C/min
were not shown however were similar to 1 C/min data, but over a longer
period of time. Figure 14b shows the [Ka} as a function of temperature
for cells cooled at 100 C/min. This demonstrates the increase of [KCI]i is
minimized with higher cooling rates.
Maximum supercooling and [KClh during cooling
The maximum amount of supercooling was calculated as the
highest amount of supercooling which occurred throughout the cooling
profile for each plunge temperature. Figure 13a and 13b shows
supercooling as a function of temperature for TF-1 cells cooled at
1.0 C/min and at 100 C/inin respectively, with arrows indicating where
the maximum supercooling was determined for the various plunge
temperatures. The maximum supercooling for each cooling rate was then
summarized and graphed as a function of plunge temperature (Figure 15).
Similar patterns of high supercooling (27 C) at -3 C were demonstrated =
for all the cooling rates, with a decrease to below 10 C at approximately -
4 C for cells cooled at 0.2, 0.5, and 1.0 C/min and at approximately -
13 C for cells cooled at 100 C/min. Intracellular ice formation thus only
appears to play a role in freezing injury for cells cooled to high subzero
CA 02482045 2004-09-17
41
temperatures for low cooling rates and intermediate subzero temperatures
for higher cooling rates.
The maximum amount of [KC11 was calculated as the highest
concentration of KC1 which occurred throughout the cooling profile for
each plunge temperature. Figure 14a and 14b shows the [Ka]1 as a
function of temperature for TF-1 cells cooled at 1.0 C/min and at
100 C/min respectively, with arrows indicating where the maximum
[KCl]i was determined for the various plunge temperatures. The
maximum [KCIli for each cooling rate was then summarized and graphed
as a function of plunge temperature (Figure 16). Similar patterns of an
increase in [KCl]i are demonstrated for all cooling rates, which is
consistent with the change in cell volume. Cooling rates of 0.2, 0.5, and
1.0 C/min showed the sharpest increase in [KCl]i at the higher subzero
temperatures, compared with higher cooling rates that showed a gradual
increase, which is consistent with the cell dehydrating sufficient to
maintain equilibrium. Thus at the low cooling rates examined, cells were
exposed to comparably high solute conditions at high subzero
temperatures. However, there was increased time spent exposed to the
solutes for the 0.2 C/min compared with the 1.0 C/min, so one would
expect that 0.2 C/min would have a lower cell recovery because cells
would have been exposed to increasingly high solute concentrations for a
longer period of time. The optimal temperature for plunging the cells
after the initial cooling phase is a function of temperature and the amount
of time spent cooling to that temperature, which influences [KCl]i and
supercooling.
CA 02482045 2004-09-17
- 42 -
Example 3: Experimental assessments of simulation outcomes
3.1 Introduction
In order for simulations to be used in cryopreservation, it is
necessary to test the predictions of simulations empirically. The
objective of this example was to conduct graded freezing experiments
with TF-1 cells and compare the cell survival outcomes with the
theoretical predictions put forward in Example 2 based on degrees of
supercooling and intracellular electrolyte concentration ([(Cl]i).
Membrane integrity was used as an assay for freeze-thaw injury.
Membrane integrity has been used as an indicator of cell damage during
freezing, as it has been shown that the membrane is a site of freezing-
thawing injury (Acker, 2001). Also, it has been shown that there is a
correlation between intracellular freezing and membrane damage for cells
in suspension (Acker, 2001; Mazur, 1965).
3.2 Materials & Methods
TF-1 cell culture
TF-1 cells (ATCC, Manassas, Virginia) were grown at 37 C in 5%
CO2 in RPM 1640 Medium Modified (ATCC) with 10% fetal bovine
serum (FBS) (ATCC), and supplemented with 2 ng/mL recombinant
human GM-CSF (Stemcell Technologies, Vancouver, Canada). Cells
were maintained between 0.1 x 10⁶ and 1 x 10⁶ cells/mL, according to
ATCC guidelines. Prior to experiments, cells were washed twice with
serum-free RPMI media and incubated overnight to synchronize the cells
(Kolonics, 2001). Cells were then centrifuged and re-suspended at a
CA 02482045 2004-09-17
43
concentration of 4 x 10⁶/mL, which was necessary for the viability
assessment program to be used.
Experimental solutions
TF-1 cells were re-suspended in serum-free RPM' prior to the
graded freezing experiments. In order to compare the results with the
clinical standard, IF-1 cells were also re-suspended in 10%
DMSO/RPMI at 4 C, prior to freezing experiments.
Graded freezing experiments
Samples of 0.2 mL cell suspension, in serum-free RPMI or 10%
DMSO/RPMI, in glass tubes (Fisher, Edmonton, Canada) were cooled in
a 0 C ice bath for 5 minutes. Control samples were removed and either
warmed in a 37 C water bath or plunged into liquid nitrogen (325 C/min;
(Ebertz, 2002(a)). Experimental samples were transferred into a
methanol bath preset at -3 C and allowed to equilibrate for 5 minutes
prior to ice nucleation with cold forceps. After 5 minutes, the bath cooled
at 0.2, 0.5, or 0.9 C/min to -40 C. The cooling rates were monitored
using a Type T thermocouple (Omega, Laval, Canada). Samples were
then removed at -3, -6, -9,-12, -15, -20, -30, and -40 C and either thawed
directly in a 37 C water bath or plunged into liquid nitrogen. Samples
were kept in liquid nitrogen for a minimum of 1 hour prior to being
thawed in a 37 C water bath. Duplicate samples were used for both the
direct thaw and the plunge conditions at each experimental temperature.
Each experiment was repeated in triplicate for each cooling rate and
experimental solution. Samples in 10%DMSO/RPMI were only cooled
using 0.9 C/min.
CA 02482045 2004-09-17
- 44 -
Viability assessment
Cell viability was assessed by a membrane integrity assay. The
assay was performed by incubating cells with SYTO 13 (Molecular
Probes, Eugene, Oregon) and ethidium bromide (EB) (Sigma,
Mississauga, Canada) (Yang, 1998). Syto 13 permeates the cell
membrane of all cells and complexes with DNA and fluoresces green
under UV exposure. EB penetrates cells with a damaged plasma
membrane and also complexes with DNA fluorescing red under UV
conditions. The dual stain allows for differentiation between cells with
and without intact plasma membranes.
The Syto/EB stain was prepared using 40 AL of 2.5 mM EB stock
solution and 10 fiL of 5 mM SYTO 13 stock solution mixed with 350
!IL phosphate-buffered saline (PBS). Final concentrations were 0.25 inIVI
EB and 0.125 mM Syto. Twenty pL of stain was added to 200 iL each
sample, mixed, and allowed to incubate for 2 minutes at room
temperature. Fluorescent images were captured using a Leitz Dialux 22
fluorescence (440-480 mrt) microscope (Leitz, Germany) fitted with a
PIXERA Viewfinder Pro digital camera (Pixera Corporation, Los Gatos,
CA, USA) digital camera. The Viability Assessment Program (The Great
Canadian Computer Company, Spruce Grove, Canada), which counts red
versus green pixels was used to quantify cell membrane integrity from
digital images (Jomha, 2003). This method measures membrane integrity
of the cell remaining after experimental treatment.
3.3 Results
Conventional cryopreservation protocol with DMSO
CA 02482045 2004-09-17
The standard for cryopreserving HSCs is to cool the cells at 1 C/min
in
10% DMSO. TF-1 cells were cooled at 0.9 C/min in 10% DMSO/RPMI
to various temperatures down to -40 C, prior to being thawed directly or
plunged into liquid nitrogen (Figure 17). The maximum percentage of
membrane integrity was 63.7 9.8%, when samples were cooled to -12 C
to -15 C, prior to being plunged into liquid nitrogen. The results were
comparable with that previously reported for cryopreserving HSCs with
10% DMSO cooling at 1.0 C/min (79 5% (Hunt, 2003); 67.4 2.0%
(Yang, 2003). This experiment was limited by the cooling capacity of the
methanol bath.
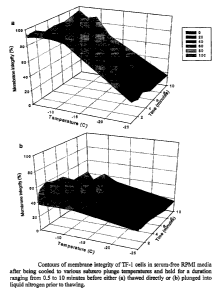
Graded freezing with no cryopreservant using various cooling rates
TF-1 cells were suspended in serum-free RPMI and cooled at
0.2 C/min to various temperatures up to -20 C, prior to being thawed
directly or plunged into liquid nitrogen. Cells thawed directly from the
subzero plunge temperatures showed a 50% decrease in membrane
integrity by -12 C, indicating that a major portion of cells were damaged
prior to being plunged into liquid nitrogen (Figure 18). However, damage
at higher subzero temperatures occurred as a result of the plunge into
liquid nitrogen. There was limited cell recovery when the cells were
plunged into liquid nitrogen at all plunge temperatures. The maximum
recovery of 24.2 5.5% was seen for TF-1 cells plunged at -3 C.
Figure 19 shows the membrane integrity as a function of plunge
temperature for TF-1 cells cooled at 0.5 C/min to -40 C, prior to being
plunged into liquid nitrogen. TF-1 cells demonstrated similar membrane
CA 02482045 2004-09-17
- 46 -
integrity for both thaw and plunge samples as with 0.2 C/min. The
maximum recovery of 28.2 5.8% was obtained between -3 C and -9 C.
Membrane integrity as a function of plunge temperature for TF-1
cells cooled at 0.9 C/min to -40 C, prior to being thawed directly or
plunged into liquid nitrogen is shown in Figure 20. Results were also
similar to those for 0.2 C/min and 0.5 C/min. TF-1 cells showed
maximum recovery of 27.8 0.8% at -9 C. This experiment was limited
by the cooling capacity of the methanol bath, which had a maximum
cooling rate of 0.9 C/min.
Data from all three cooling rates demonstrated a 50% decline in
membrane integrity for cells thawed directly from the plunge temperature
at -12 C. This indicates that cells were damaged prior to being plunged
into liquid nitrogen, possibly due to solution effects. However, there was
a significant difference between the membrane integrity for cells directly
thawed and those further plunged into liquid nitrogen. Due to the high
cooling rate upon plunging into liquid nitrogen (325 C/min), this
indicates that intracellular ice formation may play a role in damage at
these temperatures. There does appear to be a zone of subzero plunge
temperatures (-3 C to -9 C), which confers some protection against
injury during the plunge into liquid nitrogen for all the cooling rates.
This would constitute an optimal subzero plunge temperature range for
these cooling rates.
3.4 Discussion
Discussion of experimental data
CA 02482045 2004-09-17
47
The conventional cryopreservation protocol of using 10%DMS0
solution yielded comparable results with other HSCs cryopreservation
reports. The experimental results for cryopreserving TF-1 cells without
cryopreservants were significantly lower than the standard. The data
showed that the membrane integrity between the various cooling rates
was within standard error mean of each other. TF-1 cells responded
similarly to exposure to the various subzero plunge temperatures and to
subsequent plunging into liquid nitrogen.
Comparison of theoretical and experimental results
Simulations from Example 2 predicted that there was no difference
in maximum [KCl] i between the cooling rates, however the time spent
exposed to these elevated concentrations may cause additional cryoinjury.
The experimental results demonstrated that there was not a significant
difference in membrane integrity between the cooling rates of 0.2, 0.5,
and 0.9 C/min, which is consistent with the theoretical results based
solely on [KCl]. Simulations did indicate that there was potential for
increased exposure time to the solutes with the lower cooling rate
(0.2 C/min), however the experimental data demonstrated that the
percentages of membrane integrity were within error for all the cooling
rates. Therefore, the increased exposure time for the lower cooling rates
was not significant.
For all cooling rates, simulations predicted a progressive increase
in [KCl]i upon cooling to lower temperatures. Based on Lovelock's
work, the inventors predicted that salt concentrations of greater than 3 M
would be damaging to the cells (Lovelock, 1953) and the experimental
CA 02482045 2004-09-17
- 48 -
data demonstrated that there was a decrease in membrane integrity
(-60%) at this concentration for all the cooling rates. The experimental
data also demonstrated a progressive decline in membrane integrity for
cells thawed directly from subzero plunge temperatures. At low subzero
plunge temperatures (<-20 C), cells directly thawed had low percentages
of membrane integrity (<20%). Therefore, the exposure time coupled
with the concentration of solutes may have been significant variables for
freezing injury.
Simulations also predicted that cells cooled to -3 C prior to being
cooled at 325 C/min to -40 C would have a high degree of supercooling
(27 C). The experimental results demonstrated that upon cooling to -3 C
prior to plunging into liquid nitrogen, TF-1 cells had a relatively high
percentage of membrane integrity. This
indicates that although
intracellular ice formation may have played a role in membrane damage
at this plunge temperature, there was another source of damage upon
cooling to lower temperatures, where solutions effects were present.
Also, the range of plunge temperatures between -3 C and -9 C, which
demonstrated the highest viability, had high variations in maximum
supercooling (2 C to 27 C) and in maximum [KCl]1 (2 to 4 M). This
alludes to the complex interactions between these two types of injury at
subzero temperatures.
Example 4: Theoretical design of a cryopreservation protocol
4.1 Introduction
The cellular responses to the formation of ice in surrounding
solution are largely dependent on the movement of water across the
CA 02482045 2004-09-17
49
plasma membrane. Ice formation causes osmotic stress on the cell
membrane forcing water out of the cell to maintain equilibrium with the
extracellular solution. The properties of the cell membrane, specifically
the osmotic parameters, govern these changes in cell volume. The
osmotic parameters can be used in simulations to theoretically model
cellular responses to low temperatures. Simulations also provide precise
results regarding changes in cell volume and the amount of supercooling.
These results can then be used for comparisons between cryopreservation
protocols and for comparison between different cell types which may be
present in one tissue. Ultimately, simulations allow for unlimited
theoretical protocols to be explored by controlling cooling and warming
rate, plunge temperatures, and the components of the intracellular and
extracellular compartments for any cell type for which the osmotic
parameters are known.
To distinguish between the two types of injury, solution effects and
intracellular ice formation, the inventors simulated the empirical
procedure of two-step freezing. The two-step freezing technique was
developed by Farrant et al. and has provided a logical method to examine
the effects of freezing injury on cell recovery due to non-linear cooling
rates and to exposure to a range of subzero temperatures (Farrant, 1974).
In their procedure, samples were cooled at an uncontrolled non-linear
cooling rate to various subzero plunge temperatures by being transferred
to a preset bath before being 1) thawed directly from that holding
temperature or 2) plunged to 196 C before thawing. McGann and Farrant
later reported the subzero plunge temperatures and the length of hold time
CA 02482045 2004-09-17
- 50 -
at that temperature were important variables to consider when attempting
to maximize cell survival (McGann, 1976).
The objective of this example was to further the inventors'
understanding of the theoretical responses of TF-1 cells, a model for
hematopoietic stem cells (HSC) (Kitamura, 1989(a); Marone, 2002), to
subzero plunge temperatures and to hold times at those temperatures.
Simulations were done using the osmotic parameters of TF-1 cells
reported in Example 1. The objective of these simulations was to
theoretically determine the conditions of TF-1 cells at various stages of a
' freezing protocol.
Maximum levels of intracellular electrolyte
concentrations ([KCl]1) and of supercooling were examined upon cooling
the cells to -40 C, as indicators for solution effects injury and
intracellular ice formation injury, respectively.
4.2 Simulations of two-step freezing protocol
Methods
=
Simulations were performed according to those done in Example 2
using the osmotic parameters of TF-1 cells (Table 3) in the CryoSim5
program (Dr. Locksley McGann, University of Alberta, Canada). The
simulations were based on a two-step freezing technique, which has been
used to examine the effects of high solute concentrations and intracellular
ice formation on cell survival during freezing (Farrant, 1977). The
cryopreservation protocol was defined by assigning a starting temperature
and then varying the cooling rates, based on typical two-step freezing
procedures. Supercooling and [KCl} were used as indicators of potential
intracellular ice formation and solution effects, respectively.
CA 02482045 2004-09-17
51
Temperature profiles
The two-step freezing technique involved rapidly cooling the
samples to various subzero plunge temperatures before either being
thawed directly in a 37 C water bath or plunged into liquid nitrogen first
and then thawed (McGann, 1979). For the simulations, cells were cooled
using a temperature profile derived from Fourier's Law. Fourier's Law
describes the rate of heat transfer which depends on the temperature
distribution of the system, previously described in Example 2 (Incropera,
2002). The fitting constant was determined by monitoring the cooling
profile of a sample taken from room temperature and exposed to the
experimental subzero temperature with a Type T thermocouple (Omega,
Laval, Canada). Figure 21 is a representative cooling profile of a sample
cooled from room temperature to -15 C. This profile was then fitted to a
curve and the equation was then used in simulations. The variations
between the experimental and fitted curves were due to the latent heat of
fusion.
Simulations were performed in which cells with no cryopreservant
were cooled to various subzero plunge temperatures ranging from -3 C to
-40 C and held at that temperature for 03, 0.5, 0.7, 1, 2, 3, 5, 7, or 10
minutes, prior to being plunged to -40 C (325 C/Min) (Ebertz, 2002).
CA 02482045 2004-09-17
- 52 -
43 Results
Changes in cell volume during cooling
Figure 22 shows simulation results of temperature as a function of
time for TF-1 cells cooled to various subzero plunge temperatures
ranging from -3 C to -30 C, held for various hold times (minutes), prior
to being plunged to -40 C
(325 C/min). Based on the results from the simulations, the hold times
were grouped according to similarities of changes in cell volume, [KCl],
and supercooling: hold times of 1 minute or less will be represented by
the 0.5 minute data; hold times between 2 and 5 minutes will be
represented by the 3 minute data; and hold times of between 7 and 10
minutes will be represented by the 10 minute data. Figure 23
demonstrates the changes in cell volume as a function of temperature
upon cooling to various subzero plunge temperatures ranging from -3 C
to -30 C, held for a duration, prior to being plunged to -40 C
(325 C/min). The data shown is for (a) 0.5 min., (b) 3 min., and (c) 10
min. hold times. Cells showed a progressive decrease in cell volume
upon cooling. Cells only held for 0.5 minutes at the subzero temperature
did not reach the same volumes as those held for 3 or 10 minutes at -3 C
and -35 C. This data suggests that the cells have not had sufficient
amount of time to dehydrate with a hold time of 0.5 minutes, as opposed
to greater than 3 minutes, for both high and low subzero plunge
temperatures. This data also indicates that the cells would have a higher
amount of supercooling at these outlying plunge temperatures due to the
lack of cellular dehydration. Also, with lower concentrations of [KCl]1, it
is possible that the cells would not be subjected to high solution effects.
CA 02482045 2004-09-17
53
CA 02482045 2004-09-17
- 54 -
Supercooling during cooling
Figure 24 demonstrates the changes in supercooling as a function
of temperature upon cooling to various subzero plunge temperatures
ranging from
-3 C to -30 C, prior to being plunged to -40 C (325 C/min). Data shown
are for (a) 0.5 min., (b) 3 min., and (c) 10 min. hold times. Supercooling
of up to 10 C occurs for all the hold times down to -12 C. This suggests
that supercooling plays a key role in potential injury during freezing to
lower subzero plunge temperatures. At these lower temperatures, cells
were exposed to increasingly supercooled conditions up to 30 C at -30 C.
[KC1ji during cooling
Figure 25 demonstrates the changes in [KCl]; as a function of
temperature upon cooling to various subzero plunge temperatures ranging
from -3 C to -30 C, prior to being plunged to -40 C (325 Cimin). The
data shown is for (a) 0.5 min., (b) 3 min., and (c) 10 min. hold times.
Cells cooled to lower subzero plunge temperatures showed increasing
concentrations of [KC1]1, with the highest concentration for cells cooled
to -30 C and held for greater than. 3 minutes. This correlates with the
gradual decrease in cell volume reported in the previous section. This
gradual increase in [KC1]1 demonstrates the potential for increased
solution effects upon cooling to the lower subzero plunge temperatures.
The data show similar concentrations of [KC1]1 at all plunge temperatures
except at
-3 C and below -30 C.
CA 02482045 2004-09-17
Maximum supercooling and IKC11; during cooling
The maximum amount of supercooling was calculated as the
highest amount of supercooling which occurred throughout the cooling
profile for each plunge temperature. Figure 24a supercooling as a
function of temperature for TF-1 cells with arrows indicating where the
maximum supercooling was determined for the various plunge
temperatures. The maximum amount of supercooling was calculated and
graphed as a function of plunge temperature (Figure 26). Data is shown
for (a) 0.5 min., (b) 3 min., and (c) 10 min. hold times. The maximum
supercooling obtained appears to be the primary contributor to potential
injury, which suggests that a target plunge temperature between -6 C to -
12 C would lead to high levels of survival because the supercooling does
not exceed 10 C. Cells held for 0.5 minutes have a more narrow range of
optimal plunge temperatures, limited by the amount of supercooling.
These results correlate with the lack of cellular dehydration discussed in
the previous sections.
The maximum amount of [KCl]1 was calculated as the highest
concentration of KC1 which occurred throughout the cooling profile for
each plunge temperature. Figure 25a shows the [KO]; as a function of
temperature for TF-1 cells, with arrows indicating where the maximum
[KClli was determined for the various plunge temperatures. The levels of
maximum [KCl]i for cells held for 0.5, 3 and 10 minutes gradually
increase from -3 C to -20 C (Figure 26). The slope between -3 C and -
6 C varies from cells held for 0.5 minutes and 3 to 10 minutes,
suggesting that at plunge temperatures between -3 C and -6 C, there may
be a difference in cell recovery between 0.5 minutes and 3 to 10 minutes.
CA 02482045 2004-09-17
- 56 -
For all the hold times, based on the temperature range set by the 10 C
limit to supercooling, the data suggests that the lower [KC1]; levels would
result in better cell recovery. Figure 27 shows the plunge temperature
ranges for cells held for 3 minutes based on 10 C supercooling and 3 M
[KCl]i. This range varies between 0.5 minute hold time and the 3 and 10
minute hold time. However,
a target plunge temperature of
approximately -6 C should result in the highest cell recovery for all the
hold times.
These simulations suggest that supercooling plays a key role in
two-step freezing and the effects of increasing solute concentrations are
secondary. The optimal temperature for plunging the cells after the initial
cooling phase is a function of the amount of time spent to cool to a
specific temperature, which influences [KCl]1 and supercooling.
Example 5: Experimental correlation and optimization of a theoretically-
designed cryopreservation protocol
5.1 Introduction
The simulations performed in Example 4 predicted that subzero
plunge temperature and time spent at that temperature were critical
variables in the optimization of cryopreservation protocols. In order for
simulations to be used in cryopreservation, it is necessary to test the
predictions of simulations empirically. The purpose of this example was
to explore the range of subzero plunge temperatures and time spent at
those temperatures. Two-step freezing experiments were conducted with
TF-1 cells and compared with the cell survival outcomes that were
theoretically predicted in Example 4. Membrane integrity was used as an
CA 02482045 2004-09-17
57
assay for freeze-thaw injury. Membrane integrity has been used as an
indicator of cell damage during freezing, as it has been shown that the
membrane is a site of freezing-thawing injury (Acker, 2001). Also, it has
been shown that there is a correlation between intracellular freezing and
membrane damage for cells in suspension (Acker, 2001; Mazur, 1965).
5.2 Materials & Methods
TF-1 cell culture
TF-1 cells (ATCC, Manassas, Virginia) were grown at 37 C in 5%
CO2 in RPMI 1640 Medium Modified (ATCC) with 10% fetal bovine
serum (FBS) (ATCC), and supplemented with 2 ng/mL recombinant
human GM-CSF (Stemcell Technologies, Vancouver, Canada). Cells
were maintained between 0.1 x 10⁶ and 1 x cells/mL, according to ATCC
guidelines. Prior to experiments, cells were washed twice with serum-
free RPMI media and incubated overnight. Cells were then centrifuged
and re-suspended at a concentration of 4 x 10⁶ cells/mL, which was
necessary for the viability assessment program to be used.
Experimental solutions
TF-1 cells were re-suspended in serum-free RPME prior to the two-
step freezing experiments.
Two-step freezing experiments
Samples of 0.2 mL cell suspension, in serum-free RPMI, in glass
tubes were allowed to equilibrate at room temperature for 5 minutes.
Control samples were either warmed in a 37 C water bath or plunged into
CA 02482045 2004-09-17
- 58 -
liquid nitrogen. Experimental samples were individually transferred into
a methanol bath preset at -3, -6, -9, -12, -15, -20, -30, and -40 C and
allowed to equilibrate for 2 minutes at that temperature prior to ice
nucleation with cold forceps. After nucleation, samples were allowed to
equilibrate for 3 minutes before either being thawed directly in a 37 C
water bath or plunged into liquid nitrogen. Samples were kept in liquid
nitrogen for a minimum of 1 hour prior to being thawed in a 37 C water
bath. Duplicate samples were used for both the direct thaw and the plunge
conditions at each plunge temperature. Each experiment was repeated in
triplicate.
The two-step freezing experiments were repeated with varying
hold times. Cells were cooled to -5, -7, -9, -12, -15, and -25 C and
allowed to equilibrate for 2 minutes prior to ice nucleation with cold
forceps. After nucleation, samples were allowed to equilibrate for 0.5 or
minutes before either being thawed directly in a 37 C water bath or
plunged into liquid nitrogen. Samples were kept in liquid nitrogen for a
minimum of 1 hour prior to being thawed in a 37 C water bath. Duplicate
samples were used for both the direct thaw and the plunge conditions at
each plunge temperature. Each experiment was repeated in triplicate.
Viability assessment
Cell viability was assessed by a membrane integrity assay. The
assay was performed by incubating cells with SYTO 13 (Molecular
Probes, Eugene, Oregon) and ethidium bromide (EB) (Sigma,
Mississauga, Canada) (Yang, 1998). Syto 13 permeates the cell
membrane of all cells and complexes with DNA and it fluoresces green
CA 02482045 2004-09-17
59
under UV exposure. EB penetrates cells with a damaged plasma
membrane and also complexes with DNA fluorescing red under UV
conditions. The dual stain allows for differentiation between cells with
and without intact plasma membranes.
The Syto/EB stain was prepared using 40 L of 2.5 mM EB stock
solution and 10 gla of 5 mM Syto 13 stock solution mixed with 350 1AL
1X phosphate-buffered saline (PBS). Final concentrations were 0.25 mM
EB and 0.125 mM Syto. Twenty pi, of stain was added to each sample
and allowed to incubate for 2 minutes at room temperature. Fluorescent
images were captured using a Leitz Dialux 22 fluorescence (440-480 nm)
microscope (Leitz, Germany) fitted with a PIXERA DiRactor (Pixera
Corporation, Los Gatos, CA, USA) digital camera. The Viability
Assessment Program (The Great Canadian Computer Company, Spruce
Grove, Canada), which counts red versus green pixels was used to
quantify cell membrane integrity from digital images (Jomha, 2003). This
method measures membrane integrity of the cell remaining after
experimental treatment.
5.3 Results
Varying plunge temperature
TF-1 cells were suspended in serum-free RPMI to various plunge
temperatures up to -40 C and held for 3 minutes, prior to being thawed
directly or plunged into liquid nitrogen (Figure 28). Overall, cells
demonstrated a higher percentage of membrane integrity than cells cooled
at 0.2 C/min to 0.9 C/min presented in Example 3. Cells plunged into
liquid nitrogen showed comparable results for membrane integrity to cells
CA 02482045 2004-09-17
- 60 -
directly thawed from temperatures ranging from -15 C to -40 C. Cells
thawed directly from the plunge temperatures showed a 50 % decrease in
membrane integrity by -17 C, indicating that a major portion of cells
were damaged prior to being plunged into liquid nitrogen (Figure 28).
However, this membrane damage occurred at a higher subzero plunge
temperature for cells cooled at 0.9 C/min. The maximum recovery of
58.8 6.5% was seen for TF-1 cells cooled to -12 C or -15 C before being
plunged into liquid nitrogen. These results were higher than those
previously reported in Example 3 of approximately 28.2%. Furthermore,
these results were comparable with those shown for cooling at 0.9 C/min
in 10% DMSO/RPMI of 63.7% (Example 3).
Varying experimental hold time
TF-1 cells were cooled to -5, -7, -9, -12, -15, or -25 C and allowed
to equilibrate for 2 minutes prior to ice nucleation with cold forceps.
After nucleation, samples were allowed to equilibrate for varying times
(0.3, 0.5, 0.7, 1, 2, 3, 5, 7, and 10 minutes) before either being thawed
directly in a 37 C water bath or plunged into liquid nitrogen. Figure 29a
shows the membrane integrity of TF-1 cells as a function of hold time for
cells cooled to -5 C, held and plunged into liquid nitrogen. Comparable
results of membrane integrity were obtained for cells held at -7 C to -9 C
(results not shown). However there was minimal membrane integrity for
cells held below -25 C (data shown in Figure 29b). Cells that were
directly thawed from the subzero plunge temperatures after being held
showed progressive decrease in membrane integrity based on reduced
temperature and increased duration of hold time (Figure 30a). Results
indicated a high percentage of membrane integrity of 55 to 60%, when
CA 02482045 2004-09-17
61
cells were held for 1-5 minutes at high subzero plunge temperatures.
Cooled cells from room temperature to -5 C and -7 C and held for 1-3
minutes, prior to plunging into liquid nitrogen resulted in the highest
percentage of membrane integrity of approximately 60% (Figure 30b). A
hold time of greater than 5 minutes resulted in a marked decrease in cell
survival. This data indicates that there is a zone of subzero plunge
temperatures (-5 C to -15 C), when held for 1-3 minutes, which confers
protection against injury comparable to DMSO.
5.4 Correlation with theoretically-designed protocol
Discussion of experimental results
The experimental results for cryopreserving TF-1 cells without
cryopreservants indicate that cells can be cryopreserved without DMSO.
This data indicates that there is a zone of subzero plunge temperatures (-
C to -15 C), when held for 1-3 minutes, which confers comparable
protection against injury to the standard 10% DMSO/RPMI solution,
previously reported in Example 3. This range would constitute an
optimal subzero temperature range for these hold times based on
experimental results.
Comparison of theoretical and experimental results
Simulations were done based on an empirical approach to
cryopreservation, two-step freezing, which can be used to examine the
role of exposure to subzero plunge temperatures and exposure time. The
cooling rates used in the two-step freezing protocol are governed by
Fourier's Law and were determined experimentally in Example 4. Cells
CA 02482045 2004-09-17
- 62 -
were exposed to increasingly supercooled conditions up to 40 C at a
plunge temperature of -40 C. Supercooling appears to be the primary
contributor to potential freezing injury. This research supported the
upper limit of 10 C supercooling, previously reported by Mazur. The
proposed target plunge temperature was suggested to be between -4 C
and -12 C, as supercooling was restricted to less than 10 C, which is
comparable to the range determined empirically. Also, based on levels of
intracellular KC1 ([1(C1]i), it was suggested that the higher subzero plunge
temperature would have the lowest potential for solution effects based on
the lack of cell dehydration, which was also supported by this data.
Two-step freezing experiments demonstrated a high percentage of
membrane integrity for TF-1 cells when cells were cooled to between -
C and
-12 C and held for 1-5 minutes. These plunge temperatures corresponded
with the theoretical values of 5 C to 10 C supercooling, which suggested
that a certain amount of supercooling is necessary to achieve a higher
viability (Diller, 1975). However, this also supports the belief that
excessive supercooling may lead to damage as a result of intracellular ice
formation.
Based on the simulations, the duration of time the cells were held
at the subzero plunge temperature was also considered an important
factor. When cells were held for 0.5 minutes, they did not have sufficient
time to dehydrate and reach the same volume as cells held for greater
than 2 minutes. This excess intracellular water may have caused damage
by forming ice upon subsequent cooling. According to the two-step
freezing experiments, cells held for 2 minutes at -5 C and for 5 minutes
CA 02482045 2012-02-17
CA 02482045 2004-09-17
63
at -12 C, had the highest cell recovery. Those held for 10 minutes may
have been exposed to high concentrations of solutes for a duration which
was damaging. Simulations from Example 4 predicted that there was no
difference in [KC11i concentrations and supercooling between hold times
down to -25 C. The experimental results demonstrated that the
differences in membrane integrity between the hold times may depend on
the duration of exposure, which is consistent with the theoretical results.
For all the hold times, simulations predicted a progressive increase
in [I{Cl]i upon cooling to lower plunge temperatures down to -25 C for
cells held for 0.5 minutes. The experimental results demonstrated a
progressive decline in membrane integrity for cells thawed directly from
subzero plunge temperatures. At low subzero plunge temperatures (<-
20 C), cells directly thawed had low percentages of membrane integrity
(<30%). Therefore, either the exposure time and/or the concentration of
solutes may have been significant variables for freezing injury.
CA 02482045 2004-09-17
- 64 -
References
J.F. Abrahamsen, A.M. Bakken, 0. Bruserud, Cryopreserving human
peripheral blood progenitor cells with 5-percent rather than 10-percent
DMSO results in less apoptosis and necrosis in CD34+cells, Transfusion
42 (2002) 1573-1580.
J.P. Acker, A. Larese, h. Yang, A. Petrenko, L.E. McGraim, Intracellular
ice formation is affected by cell interactions, Cryobiology 38 (1999) 363-
371.
J.P. Acker, J. Pasch, I. Heschel, G. Rau, L.E. McGann, Comparison of
optical measurement and electrical measurement techniques for the study
of osmotic responses of cell suspensions, Ciyo-Letters 20 (1999) 315-
324.
J.P. Acker, L.E. McGann, Cell-cell contact affects membrane integrity
after intracellular freezing, Cryobiology 40 (2000) 54-63.
J.P. Acker, L.E. McGann, Membrane damage occurs during the
formation of intracellular ice, Cryo-Letters 22 (2001) 241-254.
J.P. Acker, J.A.W. Elliott, L.E. McGann, Intercellular ice propagation:
Experimental evidence for ice growth through membrane pores,
Biophysical Journal 81 (2001) 1389-1397).
J.P. Acker, L.E. McGann, Innocuous Intracellular ice improves survival
of frozen cells, Cell Transplantation 11(2002) 563-571.
B. Alberts, D. Bray, J. Lewis, M. Raff, K. Roberts, J.D. Watson,
Molecular biology of the cell (Garland Publishing, Inc, New York &
London, 1994) 1294.
D.S. Allan, M. Keeney, K. Howson-Jan, M. Bhatia, D.R. sutherland, I.
Chin-Yee, Number of viable CD34+cells reinfused predicts enfraftment
in autologous hematopoietic stem cell transplantation., Blood 96 (2000)
381a-381a.
W.J. Armitage, P. Mazur, Osmotic tolerance of human-granulocytes,
American Journal of Physiology 247 (1984) C373-C381.
CA 02482045 2004-09-17
F. Beaujean, J.H. Bourhis, C. Bayle, H. Jouault, M. Divine, C. Rieux, M.
Janvier, C. Le Forestier, J.L. Pico, Successful cryopreservation of
purified autologous CD34(+) cells: influence of freezing parameters on
cell recovery and engraftment, Bone Marrow Transplantation 22 (1998)
1091-1096.
C.T. Benson, C. Liu, D.Y. Gao, E.S. Critser, J.D. Benson, J.K. Critser,
Hydraulic conductivity (L-p) and its activation energy (E-a),
cryoprotectant agent permeability (P-s) and its E-a, and reflection
coefficients (sigma) for golden hamster individual pancreatic islet cell
membranes, Cryobiology 37 (1998) 290-299.
C7043, Stem Cell Laboratory Endpoints, in: S.C. Laboratoy (Ed.),
(Canadian Blood Services, Edmonton Centre, 2003).
J.M. Davis, S.D. Rowley, H.G. Braine, S. Piantadosi, G.W. Santos,
Clinical toxicity of cryopreserved bone-marrow graft infusion, Blood 75
(1990) 781-786.
D.A.T. Dick, L.M. Lowenstein, Osmotic Equilibria in Human
Erythrocytes Studied by Immersion Refractometry., Proceedings of the
Royal Society of Londong, Series B 149 (1958) 241-256.
K.R. Diller, Intracellular freezing - effect of extracellular supercooling,
Cryobiology 12 (1975) 480-485
C. Donaldson, W.J. Armitage, P.A. DenningKendall, A.J. Nicol, B.A.
Bradley, J.M. Hows, Optimal cryopreservation of human umbilical cord
blood, Bone Marrow Transplantation 18 (1996) 725-731.
M.J. Egorin, E.G. Zuhowski, D.M. Rosen, D.L. Sentz, J.M. Covey, J.L.
Eiseman, Plasma pharmacokinetics and tissue distribution of 17-
(allylamino)-17-demethoxygeldanamycin (NSC 330507) in CD2F1
micel, Cancer Chemotherapy and Pharmacology 47 (2001) 291-302.
S.L. Ebertz, Fundamental cryobiology of cells from a bioengineered
human corneal equivalent, Doctor of Philosophy, Medical Sciences -
Laboratory Medicine and Pathology, University of Alberta, 2002.
S.L. Ebertz, L.E. McGann, Osmotic parameters of cells from a
bioengineered human corneal equivalent and consequences for
cryopreservation, Cryobiology 45 (2002) 109-117.
CA 02482045 2004-09-17
- 66 -
J.A.W. Elliott, L.E. McGann, S. Hakda, K. Porter, R.C. Bannerman,
Thermodynamics in cryobiology: Limitations of the Boyle van't Hoff
equation., Cryobiology 45 (2002) 252.
H.Y. Elmoazzen, J.A.W. Elliott, L.E. McGann, The effect of temperature
on membrane hydraulic conductivity, Cryobiology 45 (2002) 68-79.
J. Farrant, S.C. Knight, L.E. McGann, J. O'Brien, Optimal recovery of
lymphocytes and tissue culture cells following rapid cooling, Nature 249
(1974) 452-453.
J. Farrant, C.A. Walter, H. Lee, L.E. McGann, Use of two-step cooling
procedures to examine factors influencing cell survival following freezing
and thawing, Cryobiology 14 (1977) 273-286.
D.Y. Gao, C. Liu, C.T. Benson, J. Liu, E.S. Critser, J.K. Critser, L.E.
McGann, S. Lin, Theoretical and experimental analyses of optimal
experimental design for determination of hydraulic conductivity of cell
membrane., in: L.J. Hayes, R.B. Roemer (Eds.), Advances in heat and
mass transfer in biological systems., Vol. 288 (American Society of
Mechanical Engineers., New York, N. Y., 1994) 151-158.
D.Y. Gao, Q. Chang, C. Liu, K. Farris, K. Harvey, L.E. McGann, D.
English, J. Jansen, J.K. Critser, Fundamental cryobiology of human
hematopoietic progenitor cells I: Osmotic characteristics and volume
distribution, Cryobiology 36 (1998) 40-48.
D.Y. Gao, J.K. Critser, Mechanisms of cryoinjury in living cells, Ilar J 41
(2000) 187-196.
J.A. Gilmore, L.E. McGann, E. Ashworth, J.P. Acker, J.P. Raath, M.
Bush, J.K. Critser, Fundamental cryobiology of selected African
mammalian spermatozoa and its role in biodiversity preservation through
the development of genome resource banking, Animal Reproduction
Science 53 (1998) 277-297.
N.B. Grover, J. Naaman, S. Ben-Sasson, F. Doljanski, Electrical sizing of
particles in suspensions. I: Theory, Biophysical Journal 9 (1969) 1398-
1414.
CA 02482045 2004-09-17
67
N.B. Grover, J. Naaman, S. Ben-Sasson, F. Doljanski, Electrical sizing of
particles in suspensions. 111: Rigid spheroids and red blood cells,
Biophysical Journal 12 (1972) 1099-1117.
N.B. Grover, I Naaman, S. Ben-Sasson, F. Doljanski, E. Nadav,
Electrical sizing of particles in suspensions. II: Experiments with rigid
spheres, Biophysical Journal 9 (1969) 1415-1425.
P. Halle, 0. Tournilhac, W. Knopinska-Posluszny, J. Kanold, P.
Gembara, N. Boiret, C. Rapatel, M. Berger, P. Travade, S. Angielski, J.
Bonhomme, F. Demeocq, Uncontrolled-rate freezing and storage at-80
degrees C, with only 3.5-percent DMSO in cryoprotective solution for
109 autologous peripheral blood progenitor cell transplantations,
Transfusion 41 (2001) 667-673.
H.G. Hempling, S. Thompson, A. Dupre, Osmotic properties of human
lymphocyte, Journal of Cellular Physiology 93 (1977) 293-302.
A. Hubei, J. Norman, T.B. Darr, Cryobiophysical characteristics of
genetically modified hematopoietic progenitor cells, Cryobiology 38
(1999) 140-153.
C.J. Hunt, S.E. Armitage, D.E. Pegg, Cryopreservation of umbilical cord
blood: 1. Osmotically inactive volume, hydraulic conductivity and
permeability of CD34(+) cells to dimethyl, sulphoxide, Cryobiology 46
(2003) 61-75.
C.J. Hunt, S.E. Armitage, D.E. Pegg, Cryopreservation of umbilical cord
blood: 2. Tolerance of CD34(+) cells to multimolar dimethyl sulphoxide
and the effect of cooling rate on recovery after freezing and thawing,
Cryobiology 46 (2003) 76-87.
F.P. Incropera, D.P. Dewitt, Introduction to heat transfer (John Wiley &
Sons, New York, 2002) 892.
M.H. Jacobs, D.R. Stewart, A simple method for the quantitative
measurement of cell permeability, Journal of Cellular and Comparative
Physiology 1(1932) 71-82.
IA. Johnson, T.A. Wilson, Osmotic volume changes induces by a
permeable solute, Journal of Theoretical Biology 17 (1967) 304-311.
CA 02482045 2004-09-17
- 68 -
N.M. Jomha, P.C. Anoop, J.A. Elliott, K. Bagnall, L.E. McGann,
Validation and reproducibility of computerised cell-viability analysis of
tissue slices, BMC Musculoskelet Disord 4 (2003) 5.
Y. Katayama, T. Yano, A. Bessho, S. Deguchi, K. Sunami, N. Mahmut,
K. Shinagawa, E. Omoto, S. Makin , T. Miyamoto, S. Mizuno, T.
Fukuda, T. Eto, T. Fujisaki, Y. Oluio, S. Inaba, Y. Niho, M. Harada, The
effects of a simplified method for cryopreservation and thawing
procedures on peripheral blood stem cells, Bone Marrow Transplantation
19 (1997) 283-287.
T. Kitamura, T. Tange, T. Terasawa, S. Chiba, T. Kuwaki, K. Miyagawa,
Y.F. Piao, K. Miyazono, A. Urabe, F. Takaku, Establishment and
characterization of a unique human cell-line that proliferates dependently
on GM-CSF, IL-3, or erythropoietin, Journal of Cellular Physiology 140
(1989) 323-334.
T. Kitamura, A. Tojo, T. Kuwaki, S. Chiba, K. Miyazono, A. Urabe, F.
Takaku, Identification and analysis of human erythropoietin receptors on
a factor-dependent cell-line, TF-1, Blood 73 (1989) 375-380.
A. Kolonics, A. Apati, J. Janossy, A. 13rozik, R. Gati, A. Schaefer, M.
Magocsi, Activation of RafJERK1/2 MAP kinase pathway is involved in
GM-CSF-induced proliferation and survival but not in erythropoietin-
induced differentiation of TF-1 cells, Cellular Signalling 13 (2001) 743-
754.
S.P. Leibo, J. Farrant, P. Mazur, M.G. Hanna, Jr., L.H. Smith, Effects of
freezing on marrow stem cell suspensions: interactions of cooling and
warming rates in the presence of PVP, sucrose, or glycerol, Cryobiology
6 (1970) 315-332.
S.P. Leibo, Freezing damage of bovine erythrocytes - simulation using
glycerol concentration changes at subzero temperatures, Cryobiology 13
(1976) 587-598.
C. Liu, C.T. Benson, D.Y. Gao, B.W. Haag, L.E. Mcgaiin, J.K. Critser,
Water permeability and Its activation-energy for individual hamster
pancreatic-islet cells, Cryobiology 32 (1995) 493-502.
J. Liu, J.A. Christian, J.K. Critser, Canine RBC osmotic tolerance and
membrane permeability, Cryobiology 44 (2002) 258-268.
CA 02482045 2004-09-17
69
J.E. Lovelock, The Haemolysis of Human Red Blood-Cells by Freezing
and Thawing, I3iochimica et Biophysica Acta 10 (1953) 414-426.
M. Marone, G. Scambia, G. Bonanno, S. Rutella, D. de Ritis, F. Guidi, G.
Leone, L. Pierelli, Transforming growth factor-beta 1 transcriptionally
activates CD34 and prevents induced differentiation of TF-1 cells in the
absence of any cell-cycle effects, Leukemia 16 (2002) 94-105.
P. Mazur, Kinetics of water loss from cells at subzero temperatures and
the likelihood of intracellular freezing, The Journal of General
Physiology 47 (1963) 347-369.
P. Mazur, The role of cell membranes in the freezing of yeast and other
cells, Annals of the New York Academy of Science 125 (1965) 658-676.
P. Mazur, S.P. Leibo, E.H. Chu, A two-factor hypothesis of freezing
injury. Evidence from Chinese hamster tissue-culture cells, Experimental
Cell Research 71(1972) 345-355.
P. Mazur, Role of Intracellular Freezing in Death of Cells Cooled at
Supraoptimal Rates, Cryobiology 14 (1977) 251-272.
P. Mazur, U. Schneider, Osmotic responses of preimplantation mouse and
bovine embryos and their cryobiological implications, Cell Biophysics 8
(1986) 259-285.
L.E. McGann, J. Farrant, Survival of tissue culture cells frozen by a two-
step procedure to -196 degrees C. I. Holding temperature and time,
Cryobiology 13 (1976) 261-268.
L.E. McGann, Differing actions of penetrating and nonpenetrating
cryoprotective agents, Cryobiology 15 (1978) 382-390.
L.E. McGann, Optimal temperature ranges for control of cooling rate,
Cryobiology 16 (1979) 211-216.
L.E. McGann, M. Grant, A.R. Turner, J.M. Turc, Osmotic limits of
human-granulocytes, Cryobiology 18 (1981) 622-622.
LE. McGann, A.R. Turner, M.J. Allalunis, J.M. Turc, Cryopreservation
of human peripheral blood stem cells: optimal cooling and warming
conditions, Cryobiology 18 (1981) 469-472.
CA 02482045 2004-09-17
- 70 -
L.E. McGann, N.S. Schachar, J. Heard, S. Lam, Osmotic properties of
chondrocytes isolated from articular-cartilage, Cryobiology 19 (1982)
675-675.
L.E. McGann, A. Janowska-Wieczorek, A.R. Turner, L. Hogg, K.B.
Muldrew, J.M. Turc, Water permeability of human hematopoietic stem-
cells, Cryobiology 24 (1987) 112-119.
L.E. McGann, M. Stevenson, K. Muldrew, N. Schachar, Kinetics of
osmotic water-movement in chondrocytes isolated from articular-
cartilage and applications to cryopreservation, Journal of Orthopaedic
Research 6 (1988) 109-115.
L.E. McGann, J.A.W. Elliott, Optimization of cryopreservation protocols
using computer simulations, Cryobiology 47 (2003) 255.
J.J. McGrath, Membrane Transport Properties, in: K.R. Diller (Ed.), Low
Temperature Biotechnology: emerging applications and engineering
contributions (American Society of Mechanical Engineers, New York,
1988) 273-330,
L.U. Ross-Rodriguez, Using simulations to design a cryopreservation
protocol for hematopoietic stem cells without DMSO., Masters of
Science, Medical Sciences - Laboratory Medicine and Pathology,
University of Alberta, 2003.
L.U. Ross-Rodriguez, H. Yang, J.A.W. Elliott, L.E. McGann, Using
simulations to design a cryopreservation protocol for hematopoietic stem
cells without DMSO, Cryobiology 47 (2003) 255.
N.C. Santos, J. Figueira-Coelho, J. Martins-Silva, C. Saldanha,
Multidisciplinary utilization of dimethyl sulfoxide: pharmacological,
cellular, and molecular aspects, Biochemical Pharmacology 65 (2003)
1035-1041.
D. Savitz, V.W. Sidel, A.K. Solomon, Osmotic Properties of Human Red
Cells, Journal of General Physiology 48 (1964) 79-94.
G.J. Schwartz, K.R. Diller, Osmotic response of individual cells during
freezing .1. Experimental volume measurements, Cryobiology 20 (1983)
61-77.
CA 02482045 2004-09-17
71
M. Shabana, J.J. Mcgrath, Cryomicroscope investigation and
thermodynamic modeling of the freezing of unfertilized hamster ova,
Cryobiology 25 (1988) 338-354
M. Toner, E.G. Cravalho, M. Karel, Cellular-Response of Mouse Oocytes
to Freezing Stress - Prediction of Intracellular Ice Formation, Journal of
Biomechanical Engineering-Transactions of the Asme 115 (1993) 169-
174.
F.T. Williams, C.C. Fordham, III, W. Hollander, Jr., L.G. Welt, A Study
of the Osmotic Behaviour of the Human Erythrocyte, Journal of Clinical
Investigation 38 (1959) 1587-1598.
A.V. Wolf, M.G. Brown, P.G. Prentiss, Concentrative properties of
aqueous solutions, in: Weast (Ed.), Handbook of chemistry and physics
(CRC Press, 1982) D-258, D-261.
E.J. Woods, J. Liu, C.W. Derrow, F.O. Smith, D.A. Williams, J.K.
Critser, Osmometric and permeability characteristics of human
placental/umbilical cord blood CD34(+) cells and their application to
cryopreservation, Journal of Hematotherapy & Stem Cell Research 9
(2000) 161-173.
E.J. Woods, J. Liu, M.A.J. Zieger, J.R.T. Lakey, J.K. Critser, Water and
cryoprotectant permeability characteristics of isolated human and canine
pancreatic islets, Cell Transplantation 8 (1999) 549-559.
H. Yang, J. Acker, A. Chen, L. McGann, In situ assessment of cell
viability, Cell Transplant 7 (1998) 443-451.
H. Yang, J.P. Acker, J. Hannon, H. Miszta-Lane, J.J. Akabutu, L.E.
McGann, Damage and protection of UC blood cells during
cryopreservation, Cytotherapy 3 (2001) 377-386.
H. Yang, Effects of incubation temperature and time after thawing on
viability assessment of peripheral hematopoietic progenitor cells
cryopreserved for transplantation, Bone Marrow Transplantation 32
(2003) 1021-1026.
H. Yang, H. Zhao, L.E. McGann, Effects of DMSO of flow cytometric
absolute CD34+ cell enumeration, Cytotherapy 5 (2003) 453.
CA 02482045 2004-09-17
- 72 -
A. Zambelli, G. Poggi, G. Da Prada, P. Pedrazzoli, A. Cuomo, D. Miotti,
C. Perotti, P. Preti, G.R. Della Cuna, Clinical toxicity of cryopreserved
circulating progenitor cells infusion, Anticancer Research 18 (1998)
4705-4708.
M.A.J. Zieger, E.J. Woods, J.R.T. Lakey, J. Liu, J.K. Critser, Osmotic
tolerance limits of canine pancreatic islets, Cell Transplantation 8 (1999)
277-284.