Note: Descriptions are shown in the official language in which they were submitted.
CA 02485964 2010-07-16
-1-
NON-INVASIVE SUBSTANCE CONCENTRATION
MEASUREMENT USING AN OPTICAL BRIDGE
BACKGROUND OF THE INVENTION
This invention relates to the non-invasive measurement of the concentration of
substances that absorb electromagnetic radiation, such as light or infrared
radiation, in
absorbing and turbid matrices, such as human or animal body tissue, using a
probe
beam of electromagnetic radiation. The invention is particularly applicable to
glucose
measurement in human tissue using near-infrared radiation. It is, however,
generally
applicable to measurements of the concentration of any species that absorbs
electromagnetic radiation, especially in strongly absorbing and turbid
matrices.
The infrared measurement methods known in the art are not well adapted to the
problem of quantifying an analyte, such as glucose, dissolved in a strongly
absorbing
solvent, such as blood. The known methods include separate or indirectly
alternating
measurements at a "glucose" wavelength and at a "reference" wavelength, where
glucose does not absorb, as well as differential wavelength modulation about a
glucose
absorption band (C. Dahne, D. Gross, European patent 0 160 768 and references
therein). In the known methods, the signal is easily masked with the
variations of the
strong background presented by water and other constituents in the tissue and
in the
capillary blood flow.
The present invention is an improvement over U.S. Patent 5,099,123, issued to
Harjunmaa (hereafter, the "'123 patent"). The balanced differential (or
"optical bridge")
method disclosed in the '123 patent utilizes two wavelengths for target
124-03-2004 CA 02485964 2004-11-23
02031289 7
Mar-24-04. 03:3Tpm From-HBS$R 1976-341-0136 T-630 P.06/16 F-512
1455.1008002
-2-
analyze concentration measurements. The first, or pt ncipal wavelength is
chosen
such to be highly absorbed in the target analyte. The second, or reference
wavelength is chosen using a balancing process so that both wavelengths have
substantially identical extinction coefficients in the background matrix. A
radiation
beam is generated that contains these two wavelengths in alternate succession
at a
suitable frequency. When the beam is properly bal4nced for the measurement, a
sample detector, placed to measure radiation transmitted or reflected by the
sample
matrix that contains only a residual amount of the target analyze, will detect
only a
very small alternating component in the radiation, regardless of the thickness
of the
sample. When there is a relatively substantial amount of the target analyze in
the
sample matrix, however, the detector will detect a Aignif`icant aiternatins,
signal
synchronous with the wavelength alternation: This alternating signal is
amplified
and is then detected using a phase-sensitive detector (or lock in amplifier).
The
optical bridge balancing process entails nulling out the alternating signal
from the
sample detector by systematically varying the relative intensities at d/or
wavelengths
of the repetitive radiation periods. An auxiliary doctor is also used to
sample the
combined beam before it enters the tissue in order to enhance the measurement
stability. Although suitable for the purposes intended, the realization ofthe
precautions taken to deal with the unavoidable differences in the spectral
response
between the auxiliary detector and the sample detector make the system
somewhat
complicated.
Subsequently in U.S. patent 5,178,142, (hereafter, the "142 patent"),
Harjunmaa er al, disclosed an improved method and apparatus in which the
concentration measurement is performed using a two-wavelength alternating
radiation probe beam which interacts with the tissue. One of the wavelengths
is
used as a reference wavelength, and the other is the principal wavelength. The
reference wavelength is tunable to account for the expected variability of the
background spectrum. After passing through the matrix that contains a given
reference concentration of analyze, detected signals from the probe beam are
balanced or nulled by tuning the variable wavelength beam over a range of
frequencies. Next, the blood content of the sample is changed. The alternating
component of the interacted probe beam is then detected. The amplitude of the
Empf,zeit:24/03/2004 21:38 AMENDED SHEET
.:412 P.008
24-03-2004 CA 02485964 2004-11-23
US031289i
M1ar-2444 03:39pm From-HB5&R 1078-341-0138 T-830 P.09/18 F-512
1455.1008002
-3-
alternating component of the signal given. by the sample detector is
proportional to
the concentration of analyze or the diflrrnee from a preset reference analyze
concentration. This method and apparatus is also disclosed in WO 93/00855.
.Other related patents include U.S. Patents No_ 5,112,124; 5,137,023;
5,183,042; 5,277,181 and 5,372,135.
SUMMARY OF THE INVENTION
This invention relates to systems and methods for non-invasively estimating
the concentration of a target analyze in a sample. For the purpose of
simplicity, and
to aid in the understanding of the principles of this invention, the sample is
defined
as consisting of three components: non-fluid, bound fluid. and unbound fluid.
The
non-fluid and bound fluid components' are generally fixed, and together are
referred
to as the background matrix. In The case of human tissue, for example, the
packground matrix comprises the cellular matrix and infra-cellular fluid. The
third
main component, the unbound fluid, is generally not fixed in the sample, and
can
freely circulate through the fixed background matrix of the sample. In human
tissue,
for instance, the unbound fluid consists of blood and other substances
dissolved in or
otherwise contained within The blood. The unbound fluid can be displaced by,
for
instance, compressing (squeezing) the sample. Also, in human tissue, the
interstitial
fluid can be considered to be bound fluid if the sample compression lasts for
less
than 20-30 seconds.
If not specified otherwise, the term "fluid" as used herein refers to the
unbound fluid only. Generally, according to the present invention, the
concentration
of the target analyze in the unbound fluid is different from the concentration
of the
target analyte in the background matrix.
The present invention relates to a series of improvements to the known
balanced differential, or "optical bridge," systems for measuring the
concentration of
a target analyze in a sample, As used herein, "optical bridge" refers to an
apparatus
and/or method for quasi-simnhaueous differential optical measurement of very
small
absorbance differences of a sample, performed at one or more wavelength pairs.
According to one aspect, the improved optical bridge method and system of
present
invention includes: 1) time-series tneasuremrpts during and after a sample
thickness
Empf.zeit:24/03/2004 21:39 AMENDED SHEET,
Lõit, ., x.412 P.009
CA 02485964 2004-11-23
WO 03/091711 PCT/US03/12897
-4-
variation; 2) synchronization of the measurements with the unbound fluid (e.g.
blood) inrush into the sample; and, 3) the use of parameters extracted from
the time-
series measurements to compensate for daily and long-term variations in the
absorption of the sample background matrix. An advantage of the present
invention
is the ability to record signals from a sample whose composition varies with
time,
while maintaining the sample at a substantially constant thickness, thus
removing
the thickness change as a major contributor to the signal. Accordingly, a
simpler
measurement system is provided which is capable of improved accuracy of target
analyte concentration estimation.
An apparatus according to this invention includes a source for producing a
beam of electromagnetic radiation. This beam consists of time multiplexed
components (principal and reference) of desired narrow line-width wavelengths,
and
is produced, for instance, using a tunable filter. In alternative embodiments,
two or
more separate substantially monochromatic sources, whose outputs are combined
into a single beam, can also be employed.
During a measurement, the alternating-wavelength probe beam passes
through (or is reflected from) a sample mounted in a compression device. The
compression device controllably varies the thickness of the sample (and
consequently its unbound fluid content) during the measurement. A sample
detector
is positioned to receive the probe beam after it passes through the sample.
The
sample detector then feeds a signal to an analog signal pre-processing module
that
includes the hardware implementation of the optical bridge. The output optical
bridge signal is then fed to a processor, which is programmed to calculate the
target
analyte concentration in the unbound fluid, based on parameters extracted from
the
sample detector signal and other auxiliary variables and time-varying signals.
One of the auxiliary signals used in the calculation of the target analyte
concentration is preferably a time-varying estimate of the unbound fluid (e.g.
blood)
content within the sample. This estimate can be obtained, for example, by a
separate, auxiliary blood signal detector measuring the sample transmission
(or
reflection) of light from a separate light source that provides radiation
distinct from
the wavelengths used for the target analyte measurement, preferably at a
wavelength
where hemoglobin absorbs, and even more particularly at a wavelength where
CA 02485964 2004-11-23
WO 03/091711 PCT/US03/12897
-5-
hemoglobin absorption is independent of its oxidation state (i.e., isosbestic
point). In
other embodiments, a laser Doppler flow meter may be used to obtain a
measurement of sample blood content.
Preferably, the movement of the compression device is synchronized with
the unbound fluid inrush into the sample. In case of glucose measurement in
the
blood, the synchronization can be achieved using a separate, auxiliary
synchronization detector measuring the sample transmission (or reflection) of
light
from a separate light source that provides radiation distinct from the
wavelengths
used for the target analyte measurement, and preferably at a wavelength where
hemoglobin absorbs. The synchronization can also be achieved using a pulse
oximeter.
Additional enhancements to the target analyte measurement can be achieved
by measuring the temperature of the sample and/or the temperature of the
detectors,
and incorporating these variables into the processing of the detector output.
A method, according to this invention, for non-invasively measuring a
concentration of a target substance (e.g., glucose) in a matrix (e.g., tissue)
includes
the following steps. First, the sample is compressed by the compression device
to
force out the unbound fluid that contains the majority of the target analyte.
The
sample is then illuminated with the probe beam of electromagnetic radiation.
Preferably, the beam includes a principal period and a reference period,
wherein
during the principal period the effective wavelength of the radiation is more
strongly
absorbed by a target analyte, such as glucose, than is the effective
wavelength of the
radiation during the reference period. By way of illustration, the wavelength
that is
strongly absorbed by glucose can be between approximately 1550 and 1700 nm,
and
the wavelength lightly absorbed by glucose can be between approximately 1350
and
1430 nm.
In one embodiment, both the principal and the reference wavelengths are
universally pre-set, or pre-set individually for each patient. In another
embodiment,
the reference and/or principal wavelengths are selected during a balancing
process.
This balancing process can be performed prior to measurement. The balancing
process comprises, for example, tuning the wavelength and/or intensity of at
least
one of the alternating radiation periods to obtain a substantially-zero
alternating
CA 02485964 2004-11-23
WO 03/091711 PCT/US03/12897
-6-
component of the sample detector signal (i.e. the optical bridge signal) at
chosen
sample thicknesses/pressures exerted by the sample compression device. The
optical bridge is "balanced" when there is substantially no alternating
component in
the signal generated by the sample detector. A properly balanced optical
bridge
means that the principal and reference wavelengths are equally absorbed by the
sample matrix, which contains only residual amounts of the target analyte.
A measurement sequence comprises a series of individual measurements of
intensities of the transmitted/reflected probe beam wavelength components
obtained
by the sample and auxiliary detector(s). This series of measurements is
obtained
during an alteration of sample thickness, and also over the subsequent sample
content equilibration process that follows the alteration of sample thickness.
The
measurements are preferably obtained while the unbound fluid content of the
sample
is changing.
In a preferred embodiment of the invention, the sample thickness change is
synchronized with the heartbeat. One advantage of this is that since the
influx speed
of blood depends on the blood pressure, performing the uncompression at a
constant
phase of the cardiac cycle produces blood refill time profiles that are
substantially
constant in shape. The cardiac phase can be chosen so as to also provide the
fastest
possible blood content change.
Measurements of auxiliary parameters (including, for example, unbound
fluid content, temperature of sample and detector, sample thickness, and/or
electronic control system operational parameters) accompany the measurements
of
the probe beam intensities. The recorded data is further combined with
corresponding estimates of the time-varying unbound fluid content over the
same
time. An algorithm, based on modeling, is used to extract characteristic
parameters
from the time-series profiles, and combines these parameters with other
measured
parameters to achieve improved specificity and sensitivity in the estimation
of the
target substance concentration.
Using the method of the present invention, the accuracy of the target analyte
measurement is improved by isolating and quantifying the component of the
optical
bridge signal that results from the presence of the analyte rather than other
"parasitic" factors. More specifically, where the targeted analyte is located
CA 02485964 2004-11-23
WO 03/091711 PCT/US03/12897
-7-
primarily within the unbound fluid rather than the fixed structure of the
matrix, the
magnitude of the optical bridge signal depends directly on the amount of fluid
within
the sample. Thus, if the varying unbound fluid content of the sample is
estimated
and plotted against the magnitude of the optical bridge signal over time, the
result is
a substantially straight line whose slope is directly related to the
concentration of
analyte in the sample, assuming that the other factors contributing to the
"parasitic"
signal, including shifts in the effective wavelength due to changes in sample
thickness, remain relatively constant during the measurement process.
BRIEF DESCRIPTION OF THE DRAWINGS
The foregoing and other objects, features and advantages of the invention
will be apparent from the following, more particular description of preferred
embodiments of the invention, as illustrated in the accompanying figures. The
drawings are not necessarily to scale, emphasis instead is placed on
illustrating the
principles of the invention.
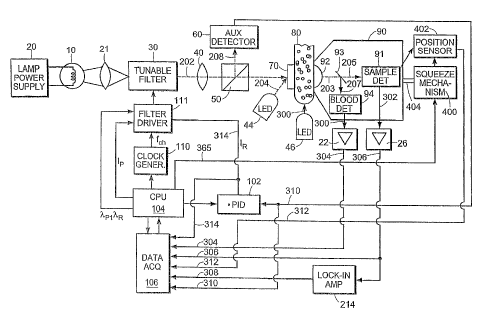
Fig. 1 is a schematic block diagram of an apparatus of the invention; and
Fig. 2 is a block diagram schematically illustrating an embodiment of the
components and steps for processing the time-varying detector signals and
other
measured parameters to obtain an estimate of analyte concentration, in
accordance
with one aspect of the invention.
DETAILED DESCRIPTION OF THE INVENTION
The features and other details of the method of the invention will now be
more particularly described with reference to the accompanying drawings and
pointed out in the claims. It will be understood that the particular
embodiments of
the invention are shown by way of illustration and not as limitations of the
invention. The principal features of this invention can be employed in various
embodiments without departing from the scope of the invention.
One embodiment of an apparatus for performing a method of the invention to
measure glucose concentration in blood based on transmitted light through the
sample will now be explained in detail in connection with Figure 1. A similar
apparatus maybe designed which uses reflected light instead of transmitted
light.
CA 02485964 2004-11-23
WO 03/091711 PCT/US03/12897
-8-
The light source 10 is preferably a quartz-halogen lamp powered by power
supply 20. Using optical elements 21, the lamp light is directed to an optical
tunable
filter 30. The characteristics (wavelengths, intensities and duration of each
wavelength component) of the probe beam (output 202 from the optical tunable
filter 30) are controlled by filter driver 111. In performing the methods of
this
invention, an acousto-optical tunable filter has been used.
In an alternate embodiment, a pair of tunable monochromatic light sources,
such as tunable laser diodes, may be used to produce the probe beam 202.
Clock generator 110 produces a timing signal at the desired chopping
frequency fh needed for time multiplexing of the principal and reference
components of the probe beam. The CPU 104 generates signals for controlling
the
principal intensity Ip, both wavelengths Xp and X R, and the chopping
frequency fh of
the probe beam 202.
The probe beam 202 exiting from optical filter 30 is directed, using optical
elements 40, to beam splitter 50, from which a fraction 208 of probe beam 202
is
directed to auxiliary detector 60. The auxiliary detector 60 is connected to a
PID
(proportional - integral - derivative) controller 102 that extracts the
intensity
difference between the two components (principal and reference) of the
detected
beam, compares that difference voltage with a pre-set voltage, and by means of
controlling the intensity of the reference wavelength component IR 314,
maintains
the difference of the two wavelength intensities constant. An alternative
embodiment maintains the ratio of the two wavelength intensities constant.
These
features make the system stable against changes in light source output caused
by, for
instance, aging of the lamp or other components, or from light source power
variations.
The majority of the probe beam is directed onto diffuser plate 70. Placing a
diffuser plate in the beam path before the sample provides the advantage of
minimizing the effects of the variation in the scattering properties of the
sample.
The sample specimen 80, such as an earlobe, lip, cheek, nasal septum, tongue,
or the
skin between the fingers or toes of the subject, is placed between diffuser
plate 70
and sample detector lens 92, and is compressed by moving the measurement head
90, mounted on compression mechanism 400. The probe beam 203 transmitted
CA 02485964 2004-11-23
WO 03/091711 PCT/US03/12897
-9-
through sample 80 is focused by sample detector lens 92, and directed to
dichroic
mirror 93. The major portion of the probe beam is transmitted by dichroic
mirror 93
to sample detector 91. The sample detector 91 detects the intensity at each of
the
wavelength periods of the probe beam 205 transmitted through sample 80, and
sends
an electrical signal 302 to preamplifier 26 and phase sensitive detector (or
lock-in
amplifier) 24. The output signal 308 from the phase sensitive detector 24 is
proportional to the difference (or ratio) of the principal and reference
intensities
detected by sample detector 91. This signal 308 is referred to as the optical
bridge
signal.
In this embodiment, also shown in Figure 1, a separate auxiliary radiation
source such as an infrared or visible-light LED 44, is used to provide an
estimate of
the sample blood content. This auxiliary radiation source 44 produces a blood
detection beam 204 that is directed onto the diffuser plate 70 and into the
sample.
An LED operating at a wavelength of, for instance 525 mn (an isosbestic
wavelength for hemoglobin), provides a good sensitivity to blood. The sample
detector 91 can be used to detect the transmitted portion of the blood
detection beam
204. However, since there is a significant ambient light in this wavelength
range, it
is advantageous to use a separate blood signal detector 94 to detect the blood
detection beam 204. To achieve this, the transmitted blood detection beam is
reflected by the dichroic mirror 93 to the blood signal detector 94, producing
a blood
signal 300. The blood signal 300 is then sent to the blood signal processing
preamplifier 22. The dichroic mirror 93 in this embodiment also eliminates
ambient
light from the sample detector 91 by transmitting only infrared wavelengths.
In accordance with another embodiment, the blood content is estimated using
a laser Doppler flowmeter integrated into the system, with a needle probe
mounted
on the optical axis. The laser Doppler flowmeter measures the number of moving
red blood cells in its field of view, which extends to about 1 mm into the
tissue.
While the needle probe may block some light from the central portion of the
optical
bridge beam, the loss of light is tolerable. While the optical bridge
measurements
are performed, the laser Doppler instrument simultaneously takes its own
readings
of blood circulation under the skin. Accordingly, an estimate of the amount of
blood
in the measurement field at the time of measurement is provided.
CA 02485964 2004-11-23
WO 03/091711 PCT/US03/12897
-10-
Other possible techniques for obtaining an estimate of the blood content
include ultrasound and electrical impedance plethysmography.
In the embodiment shown in Fig. 1, the pulse detection for synchronizing the
measurements with the unbound fluid (e.g. blood) inrush into the sample is
accomplished using an additional radiation source, similar to auxiliary
radiation
source 44. This, radiation source 46, can also be a LED operating at a
wavelength
of, for instance 525 nm, an oxyhemoglobin isobestic point. This radiation
source 46
should be directed at a portion of the sample that at all times maintains good
circulation, such as a section of the sample that is not compressed by the
measurement head. The radiation source 46 generates a pulse detection beam 206
that is aimed at the sample 80. This beam is scattered by the tissue, and a
fraction of
the original beam 206 is collected by sample detector lens 92, is reflected by
dichroic mirror 93, and is detected by blood signal detector 94.
Preferably, the two auxiliary radiation sources 44 and 46 are not operated at
the same time. The pulse synchronization source 46 should be operated prior to
the
measurement step in order to synchronize the start of the measurement process
with
a variation of the unbound fluid (e.g. blood) pressure. The blood detection
source 44
should be operated during the measurement process to provide a time-varying
estimate of the unbound fluid content within the sample. The intensities of
the two
auxiliary radiation beams 204 and 206 are pre-set or can be controlled by the
CPU
104.
To perform a measurement, the sample 80 is introduced between diffuser
plate 70 and sample detector lens 92. The measurement head 90 is moved by
compression mechanism 400 to gently compress sample 80 until a predetermined
pressure is exerted on sample 80. The preferred embodiment of compression
mechanism 400 includes a miniature linear actuator. Its step size, speed and
travel
distance are controlled by the CPU 104. Although this embodiment uses an
electrical actuator, a hydraulic or a pneumatic actuator could also be used,
with the
ensuing advantages of compactness of the compression mechanism. A position
sensor 402 is used to monitor the effects of the motor movement.
CA 02485964 2004-11-23
WO 03/091711 PCT/US03/12897
-11-
In this description, three different types of probe beam attenuations are
distinguished. First is the background matrix, the second is the target
analyte, while
the third is the unbound fluid attenuation.
The background matrix attenuation results from the absorption of probe
beam 202 by sample constituents whose concentrations are substantially
constant
throughout fixed sample compartments. The target analyte attenuation is caused
by
absorption of probe beam 202 by the target analyte (e.g. glucose), which is
mostly
concentrated in the unbound fluid (e.g. blood). When the tissue is
sufficiently
compressed, the unbound fluid, along with the target analyte (e.g. glucose),
is
substantially displaced from the sample 80. Since the concentration of the
target
analyte in the unbound fluid is different than its concentration in the
background
matrix (e.g. intracellular concentration), its average concentration in the
beam path
changes as a result of the compression. This concentration change allows the
target
analyte to be detected by this method.
The principal wavelength Xp of probe beam 202 is selected in such a way to
have high attenuation by the target analyte. The principal wavelength
intensity Ip is
set to achieve an optimal transmitted signal intensity. The reference
wavelength 2R
of the probe beam is either pre-set or selected during the optical bridge
balancing
process. Its intensity IR should be adjusted before each measurement as
explained
below in the description of the measurement process.
In the following text, a simple to understand example of a bridge balancing
process is presented. It will be readily understood by those skilled in the
art that
different, more complex, bridge balancing procedures can also be used, with
corresponding variations of the signal processing algorithm.
In the first step of bridge balancing, sample 80 is sufficiently compressed to
remove the major amount of unbound fluid from the sample tissue. The principal
wavelength parameters )p and Ip are set, and the reference wavelength XR is
initialized. The probe beam 202 is directed at the sample, and the optical
bridge is
balanced or nulled by adjusting the intensity of the probe beam reference
wavelength intensity IR to obtain a substantially-zero optical bridge signal
308. In
other embodiments, the reference wavelength intensity IR is set, while the
principal
wavelength intensity Ip is adjusted to balance the bridge. Next, the sample
CA 02485964 2004-11-23
WO 03/091711 PCT/US03/12897
-12-
compression pressure is released by a predetermined amount, called "step 1
incremental thickness" (typically 0.1 mm) and the probe beam reference
wavelength
2R is adjusted by a signal from CPU 104 so as to again achieve a substantially-
zero
optical bridge signal 308. The initial compression pressure is chosen such
that, even
after releasing sample 80 by the step 1 incremental thickness, there is nearly
no
unbound fluid reflow into the sample. Changes in the optical bridge signal
308, due
to this thickness increase result merely from increased background matrix
thickness
and not from any influx of fluid. Sample 80 is then compressed again back to
its
original compressed thickness, and the intensity at the reference (or
principal)
wavelength is again adjusted by the CPU 104 to achieve minimum optical bridge
signal.
This two-thickness procedure may be repeated until a substantially-zero
optical bridge signal is obtained at both thicknesses. At this point, the
absorption
coefficient of sample 80 in its compressed state is substantially equal at the
two
wavelengths ?,P and 2R . Although the reference wavelength can be balanced to
completely zero the optical bridge signal, a non-zero signal must generally be
contended with in practice. During the measurement process, this non-zero
optical
bridge signal can be subtracted from detector outputs to improve the accuracy
of the
measurement.
In one embodiment, the balancing is limited to only one cycle in order to
speed up the measurement and reduce the compression stress on the sample.
Due to the monochromatic components of the probe beam, and a completely
diffused light field, the sample constituents that have substantially constant
concentrations throughout fixed sample compartments do not give rise to any
optical
bridge signal, irrespective of their absorbance spectra. This holds true even
for
constituent substances that have differential absorbance across the wavelength
pair.
Accordingly, these constituents do not interfere with an optical bridge
measurement,
regardless of the sample thickness.
This completes the optical bridge balancing phase; at this point both
wavelengths and their intensities have been established. The instrument is
ready to
perform a measurement. A typical sequence for measurement of glucose in blood
will be described in the following text, with reference to the measurement
apparatus
CA 02485964 2004-11-23
WO 03/091711 PCT/US03/12897
-13-
of Fig. 1, and the processing steps shown in Fig. 2. It will be understood
that, in
accordance with at least one embodiment of the invention, all blocks, signals,
and
paths shown in Fig. 2 reside within CPU 104.
With the probe beam still directed through the fully compressed sample,
pulse-detection LED 46 is turned on, the measurement of blood signal 304 from
blood signal detector 94 starts, and a pulse detection subroutine 501 (Fig. 2)
is
performed using a real-time analysis of the digitized blood signal 304. Pulse
detection subroutine 501 recognizes systolic and diastolic phases of blood
signal
304. After the subroutine 501 locks onto the pulse of the sample, the CPU 104
turns
off pulse LED 46 and turns on blood detection LED 44. The CPU 104 then waits
for a period determined by subroutine 501, and generates a trigger signal to
start the
measurements synchronized with the heart beat phase. First, a set of system
parameter measurements is performed, as instructed by subroutine 502 (Fig. 2).
As
shown in Fig. 1, a plurality of system parameter signals are generated, which
can be
sent to data acquisition unit 106 that is in communication with CPU 104.
Examples
of these system parameter measurement signals include residual optical bridge
value
308, principal and reference wavelength intensities measured by the sample and
auxiliary detectors (306 and 310, respectively), and PID and position sensor
values
(314 and 312, respectively). The sample and detector temperatures can also be
measured and recorded.
Generally, the sample 80 is maintained in the compressed state to displace
the unbound fluid content for a time period of approximately 1 to 100 seconds.
Next, continuous measurements of the time-varying signals begin, including
time-varying measurements of the optical bridge output 308, blood signal 304,
and
position sensor output 312.
Once these measurements begin, the compression mechanism 400 then starts
opening the measurement head 90 by an amount and rate set by the CPU 104.
According to one aspect, the head opening may have an initial fast phase,
followed
by a secondary slow phase. The amount of head opening may be fixed (e.g. 0.5
mm
for a human ear), or may be thickness dependent (e.g. 30% of the compressed
sample thickness). It is directly controlled from the subroutine for
compression
control 505, via connection 365. The purpose for the fast opening phase is to
allow
CA 02485964 2004-11-23
WO 03/091711 PCT/US03/12897
-14-
the unbound fluid that contains the target analyte to return into the sample.
The
optional slow phase head opening is designed to compensate for the background
matrix thickness displacement resulting from the fluid influx and is also
controlled
by compression control subroutine 505.
The opening of the compression mechanism causes a change in the sample
composition, which makes the sample absorb differently at the two wavelengths.
This change in absorption of the two wavelengths results in a non-zero optical
bridge signal 308. The measurements continue until stopped by CPU 104.
Typically, the time-varying signal series should contain several hundred data
sets,
which are recorded over a measurement time period of approximately 0.1 to 10
seconds after the sample uncompression begins.
This concludes the measurement process, which is then followed by signal
processing. An example of the steps for processing the time-varying detector
signals
and other measured parameters and calculating an estimate of the concentration
of
the target analyte is illustrated schematically in Fig. 2.
The optical bridge signal can be represented with the following simplified
equation:
OBS = CCS - UFA - TAC + CCI (Eq.1)
where:
OBS = optical bridge signal,
CCS = calibration constant slope,
UFA = unbound fluid amount,
TAC = target analyte concentration,
CCI = calibration constant intercept, and
TAA = target analyte amount = UFA=TAC.
In the case where the optical bridge has been ideally balanced for a
measurement, the magnitude of the measured optical bridge signal, OBS (see Eq.
1),
represents the difference in the absorbed light intensity at the two
wavelengths
CA 02485964 2004-11-23
WO 03/091711 PCT/US03/12897
-15-
resulting from the absorption of the target analyte within sample 80. This
difference
is proportional to the difference of the absorption by the target analyte at
the two
wavelengths, as well as to the amount of the target analyte in the sample. The
amount of target analyte in the unbound fluid of the sample can be calculated
as the
product of the unbound fluid amount, UFA, and the target analyte
concentration,
TAC, in the unbound fluid. The difference of the absorption by the target
analyte at
the two wavelengths is known (CCS and CCI in Eq. 1), and is determined during
a
calibration process described in greater detail below. In order to obtain the
concentration of the target analyte TAC (e.g. glucose) in the unbound fluid
(e.g.
blood), the optical bridge signal, OBS 308, is normalized with the amount of
the
unbound fluid, UFA.
As shown in Fig. 2, the unbound fluid amount, UFA, is calculated using
subroutine 507. This calculation is based upon the fact that the time-series
recording
of the transmitted principal wavelength intensity signal 306 is dependent on
the
variation of the total amount of fluid in the optical path. This dependence is
non-
linear and relative. Similarly, the time-series recording of the blood signal
304 is
dependent on the variation of the amount of unbound fluid in the optical path,
and
this dependence is also non-linear and relative. Subroutine 507 can thus
perform
mathematical modeling and self-normalization using time-series recordings 304
and
306 to calculate an estimate the time-varying amount of the unbound fluid,
UFA.
Theoretically, once the system is calibrated, and the unbound fluid amount is
calculated, the target analyte concentration can be calculated directly from
Equation
1 using the calibration constants, CCS and CCI, and the instantaneous values
of the
optical bridge signal, OBS, and the unbound fluid amount, UFA. Due to
physiological noise (variations of sample's physiological properties within
the
measurement interval), however, measurement enhancements should generally be
performed to increase the accuracy of the target analyte concentration
estimation.
For this reason, multiple (preferably several hundred) measurements of the
time-
varying signals are obtained during and after the sample thickness alteration.
These
measurements are then processed using calculation subroutine 509 .
In accordance with at least one embodiment of the invention, calculation
subroutine 509 performs a linear regression of the optical bridge time-series
CA 02485964 2004-11-23
WO 03/091711 PCT/US03/12897
-16-
measurements (OBS) vs. the calculated unbound fluid amount (UFA) time-series,
over a time window beginning after the end of the fast phase of the opening of
measurement head 90. The slope of the regression line is the parameter that
is, in
principle, directly correlated to the target analyte concentration. In
principle, this
slope is also independent of the amount of unbound fluid entering the sampling
area,
and also independent of the speed at which the unbound fluid enters the
sampling
area.
As the unbound fluid enters the sample volume, it displaces some of the non-
fluid and bound fluid. This displacement can affect the accuracy of the
optical
bridge signal in a predictable manner. Subroutine 511 is designed to cancel
this
effect by using a fast phase correction that is calculated from the change to
the signal
during the opening (i.e. fast phase) movement of the measurement head.
Subroutine 517 then calculates an estimate of the target analyte concentration
(TAC) in the unbound fluid using the measured system parameters and the
previously-described parameters calculated by subroutines 507 (UFA) and 509
(regression), in combination with the calibration coefficients, CCS and CCI,
determined by calibration algorithm 521. The target analyte concentration
(TAC)
value is calculated based upon the relationship described in Equation 1, and
this
value may be displayed, digitally or otherwise, at step 522.
The measurement system is calibrated prior to performing predictive
estimations of the target analyte concentration. The calibration constants,
CCS and
CCI, are determined by calibration algorithm 521. The calibration algorithm
521
performs the previously-described measurement process, except that during the
calibration process, the concentration of the target analyte is a known
quantity.
Preferably, at least two and typically between 4 and 10 measurement sequences
are
performed on samples with varying and known concentrations of the target
analyte.
The measurement sequence for calibration is identical to the one used in
predictive
estimation, except that at the end of the procedure, the calibration
constant(s), rather
than the analyte concentration, are calculated and stored for future
reference. Using
the relationship of Equation 1, the calibration algorithm 521 calculates the
calibration constant(s) by performing best fit regression between the known
concentrations of the target analyte and the above-described calculated
parameters
24-03.2004 CA 02485964 2004-11-23 US0312889 i
Mar-Z4-04 03:38pm From-HBS&R - 19TB-341-0136 T-630 P.10/16 F-51Z
1T~,l.lvvpVVG
-17-
determined by subroutine 517, and determines the calibration constants from
ttte
regression. Typically, there is one multiplication calibration constant, CCS,
and
another additive constant, CCI. These calibration constants are later used by
subroutine 517 to calculate the target analyze concentration (TAC) in a
predictive
measurement where the analyze concentration is unknown.
Having thus-described a few particular embodiments of the invention,
various alterations, modifications and improvements will readily occur to
those
skilled in the an. Such alterations, modifications and improvements as are
made
obvious by this disclosure are intended to be pan of this description though
not
expressly stated herein, and are intended to be within the scope of the
invention.
For example, while the method is here described as applied to an optical
bridge employing an acousto-optical tunable filter, it can also be applied to
different
implementations of the optical bridge, such as one equipped with tunable diode
.lasers or other means to generate a beam containing the required wavelength
pairs.
Moreover, although the method is here described with a focus toward measuring
the
concentration of glucose in blood, the method and apparatus of this invention
may
also be employed to detect the concentration of other analytes such as
cholesterol,
urea, heavy metals, alcohol, nicotine or drugs in blood or other fluids.
Further,
sinusoidal, rather than square, modulation waveforms that are set 180 out of
phase
and result in a substantially constant total intensity, can alternatively be
used to form
the combined radiation beam- Also, measurements of radiation reflected by the
tissue, rather Than transmitted radiation, can be performed to obtain the
desired data.
Accordingly, the Foregoing description is by way of example only, and not
limiting. The invention is limited only as defined in the following claims and
equivalents thereto-
AMENDED ............. SHEET
Empf.zelt:24/03/2004 21:39 L,
,~i, , õ ~1 ..412 P.010